Article

Dynamically Adjusted and Peripheral Visualization of Reverse Optical Flow for VR Sickness Reduction

Department of Computer Science and Engineering, Korea University, Seoul 02841, Republic of Korea
*
Author to whom correspondence should be addressed.
These authors contributed equally to this work.
Electronics 2023, 12(4), 861; https://doi.org/10.3390/electronics12040861
Submission received: 24 January 2023 / Revised: 6 February 2023 / Accepted: 7 February 2023 / Published: 8 February 2023
(This article belongs to the Special Issue Recent Advances in Extended Reality)

Abstract

:
Sickness is a major obstacle in the wide adoption of virtual reality (VR). Providing low-resolution peripheral “countervection” visualization could mitigate VR sickness. Herein, we present an extension/improvement to this work, in which the reverse optical flow of the scene features is mixed in, and the extent of the periphery is dynamically adjusted simultaneously. We comparatively evaluated the effects of our extension versus the two notable sickness reduction techniques, (1) the original peripheral countervection flow using the simple stripe pattern (with a fixed field of view and peripheral extent) and (2) the dynamic field of view adjustment (with no added visualization). The experimental results indicated that the proposed extension exhibits competitive or better sickness reduction effects and less user-perceived content intrusion, distraction, and breaks in immersion/presence. Furthermore, we tested the comparative effect of visualizing the reverse optical flow only in the lower visual periphery, which further reduced the content intrusion and lowered the sense of immersion and presence. The test indicated that using just the low visual periphery could achieve a comparable level of sickness reduction with significantly less computational effort, making it suitable for mobile applications.

1. Introduction

Simulator sickness is one of the primary concerns that hampers the wider adoption of virtual reality (VR) technology [1]. Sensory mismatch between visual and bodily (stationary) motion is known to be the main cause of such sickness [1]. One effective measure to address the sensory mismatch is to reduce or nullify the self visual motion (i.e., vection), thereby reducing the mismatch. Xiao and Benko [2] explored the concept of a sparse peripheral display as an inexpensive and feasible approach of expanding the off-the-shelf VR headset field of view (FoV) by adding a low-resolution array of LEDs in the periphery of the visual field. In this study, they also considered what is called the “countervection” visualization (using the same sparse peripheral LED display) in which striped bar patterns moving in the opposite direction to the visual motion were used to partly reduce the feeling of vection and VR sickness. In a similar spirit, Park et al. [3] proposed to mix in the motion trail in the opposite direction to the optical flow (reverse optical flow) of the navigation content. In this work, however, the reverse optical flow was visualized using short white line segments over the entire screen space (wherever there were moving visual features), creating significant intrusiveness in the original content. On the other hand, Fernandes et al. proposed adjusting the FoV dynamically during VR navigation, for example making it smaller, when the user is accelerating and likely to feel vection and sickness [4]. The approach seeks to diminish the visual motion information, thus reducing the sensory mismatch.
The visual periphery, being sensitive to motion change, plays an important role in all of these approaches, as opposed to the focused center of the visual field, where visual details are detected [5]. Based on these observations, we propose to extend the “countervection” visualization by using the reverse optical flow (see Figure 1 and Figure 2) in the visual periphery. Thus, provided that there are a sufficient number of visual features, the visualized counter flow is more natural and correct—e.g., forward/backward motion flow should be seen as radial optical flow, rather than lateral, as can be observed with the projection of the striped bar motion (Figure 1). Furthermore, it will be more attuned to the original content as the reverse optical flow is based on actual visual features in the content.
It may be unnecessary, however, to add such a visualization if vection/sickness is not likely to be induced (for example, when the user is moving slowly or not accelerating). The added reverse flow in the periphery should be modulated based on the likelihood of sickness. For this, we adopted the method proposed by [4] and adjusted the extent of the periphery based on the motion profile of the user (which in essence estimates the sickness profile).
Finally, while sickness may be reduced, the manipulated visual content can still cause distraction and confusion and a broken/decreased sense of immersion/presence of varying degrees. The overall user experience should be judged by the proper balance between the relative degrees of the sickness and content intrusion. Thus, we evaluated our extension not only for its sickness reduction effect, but also in terms of the overall user experience, particularly with regard to the content intrusion and effects on the immersion/presence. The proposed approach was compared to the two notable aforementioned sickness reduction techniques: the original peripheral countervection flow, which projects a moving linear striped pattern (simulated) [2], and the dynamic FoV adjustment approach [4].
In addition, we tested the idea of further limiting the peripheral visualization of the reverse optical flow only to the lower visual periphery, based on previous results regarding the optical flow in the lower visual field (LVF) inducing stronger vection [6,7]. This would not only further reduce the extent of the content intrusion, but also be computationally more efficient while still maintaining a similar or competent level of sickness reduction effect.

2. Related Work

VR (or simulator) sickness leads to unpleasant symptoms when using immersive VR simulators, in particular with navigation contents. Major symptoms include disorientation, headache, nausea, and ocular strain [1]. VR sickness is known to be caused by sensory mismatch, that is navigating contents convey apparent visual self-motion (known as vection) while the user is stationary, causing a conflict with the vestibular sense [1]. Few approaches such as dynamic FoV adjustment [4] and image blurring during rotation [8] have been suggested in an attempt to minimize the visual motion information, thereby reducing the extent of sensory mismatch. In particular, Reference [4] varied the FoV as a function of user speed and angular velocity. However, there is still a concern that the visual manipulation of the original content/display may interfere with or become a significant distraction, leading to a reduction in the sense of presence and immersion and degraded user experience.
A related approach to VR sickness reduction is based on the rest frame theory [1], as in the case of the virtual nose [9]. The rest frame object remains fixed with respect to the real world and does not move as the user moves [10]. According to the rest frame theory, sickness may be relieved by assessing the rest frame object(s), which helps the user maintain balance [1]. Moreover, attending to such objects is likely to lower the sensory mismatch. However, the rest frame object may not blend naturally into the original content.
Optical flow has been extensively studied in association with self-motion and motion sickness. The visual motion itself is perceived through the optical flow and quantified by its amount [11]. Methods to modulate the degree or characteristics of the vection (and motion sickness) have been proposed by manipulating the optical flow [12]. Extending this idea, Park et al. [3] recently proposed mixing reverse optical flow information in VR navigation contents to reduce the level of sickness. Xiao and Benko [2] explored a similar concept of visualizing the “countervection” flow, with striped linear bar patterns moving in the reverse direction of the user and a sparse array of LEDs attached to the periphery of the headset (off the screen). The danger of content intrusion persists, albeit to a lesser degree, due to the visualization being confined to the periphery.
Furthermore, previous studies have demonstrated that optical flow in the LVF induces stronger vection than that in the upper visual field (UVF) [6,7,13]. Studies suggest the LVF has greater utility than the UVF, such as in the estimation of heading direction [14], spatial resolution [15], motion perception/sensitivity [16], and mismatch negativity to visual motion [17]. This appears to stem from the ecological importance of the LVF and the notion of the ground [11,18]—an object on the ground or the ground itself provides a stable frame of reference and information on self-motion. This is also related to the rest frame theory, wherein providing a reference object (or objects) may alleviate sickness. A rest frame object may be an object that is felt to be stationary over running frames or attached to a body that has no user relative motion [1,9,19].
We propose to combine all these ideas: (1) to use the reverse optical flow as the more correct rendition of the opposite movement with the vection nullifying effect (in low resolution, given the sensitivity of peripheral vision to motion), (2) to dynamically adjust the extent of the peripheral visualization according to the likelihood of sickness; (3) to refrain from blacking out the periphery and, rather, retaining the original FoV and background content for less content intrusion; (4) to consider only utilizing the LVF to further lessen the content intrusion and save computational resources.
One particular concern related to applying most of the aforementioned sickness-reducing techniques (including our proposal) is the possible negative effects on the sense of immersion and presence, which are the most-important qualities of the VR experience [20]. Virtual reality is frequently presented as aiming to create a unique and immersive experience and a sense of presence [21]. The senses of immersion and presence are closely related in the context of VR’s spatial nature [22]. “Spatial” immersion refers to the extent the user of the VR system is surrounded by the virtual environment (e.g., using a surround display or immersive headset), while presence is often referred to as the sense of “being” in the virtual environment [23]. Notably, psychological immersion by which the user is absorbed into the content is also possible [24]. In general, the higher the spatial immersion (or provided), the more presence the user feels [25]. Immersion and presence are affected by several factors including the visual realism [26], field of view, and display resolution [27]. Even though restricted to the periphery or the LVF, the addition of reverse optical flow, which is not part of the original content, can degrade the VR experience. In our evaluation study, we employed two major VR experience/immersion/presence questionnaires, namely the Igroup Presence Questionnaire [28] and the Slater–Usoh–Steed Questionnaire [29], to assess the effect of the proposed sickness reduction.

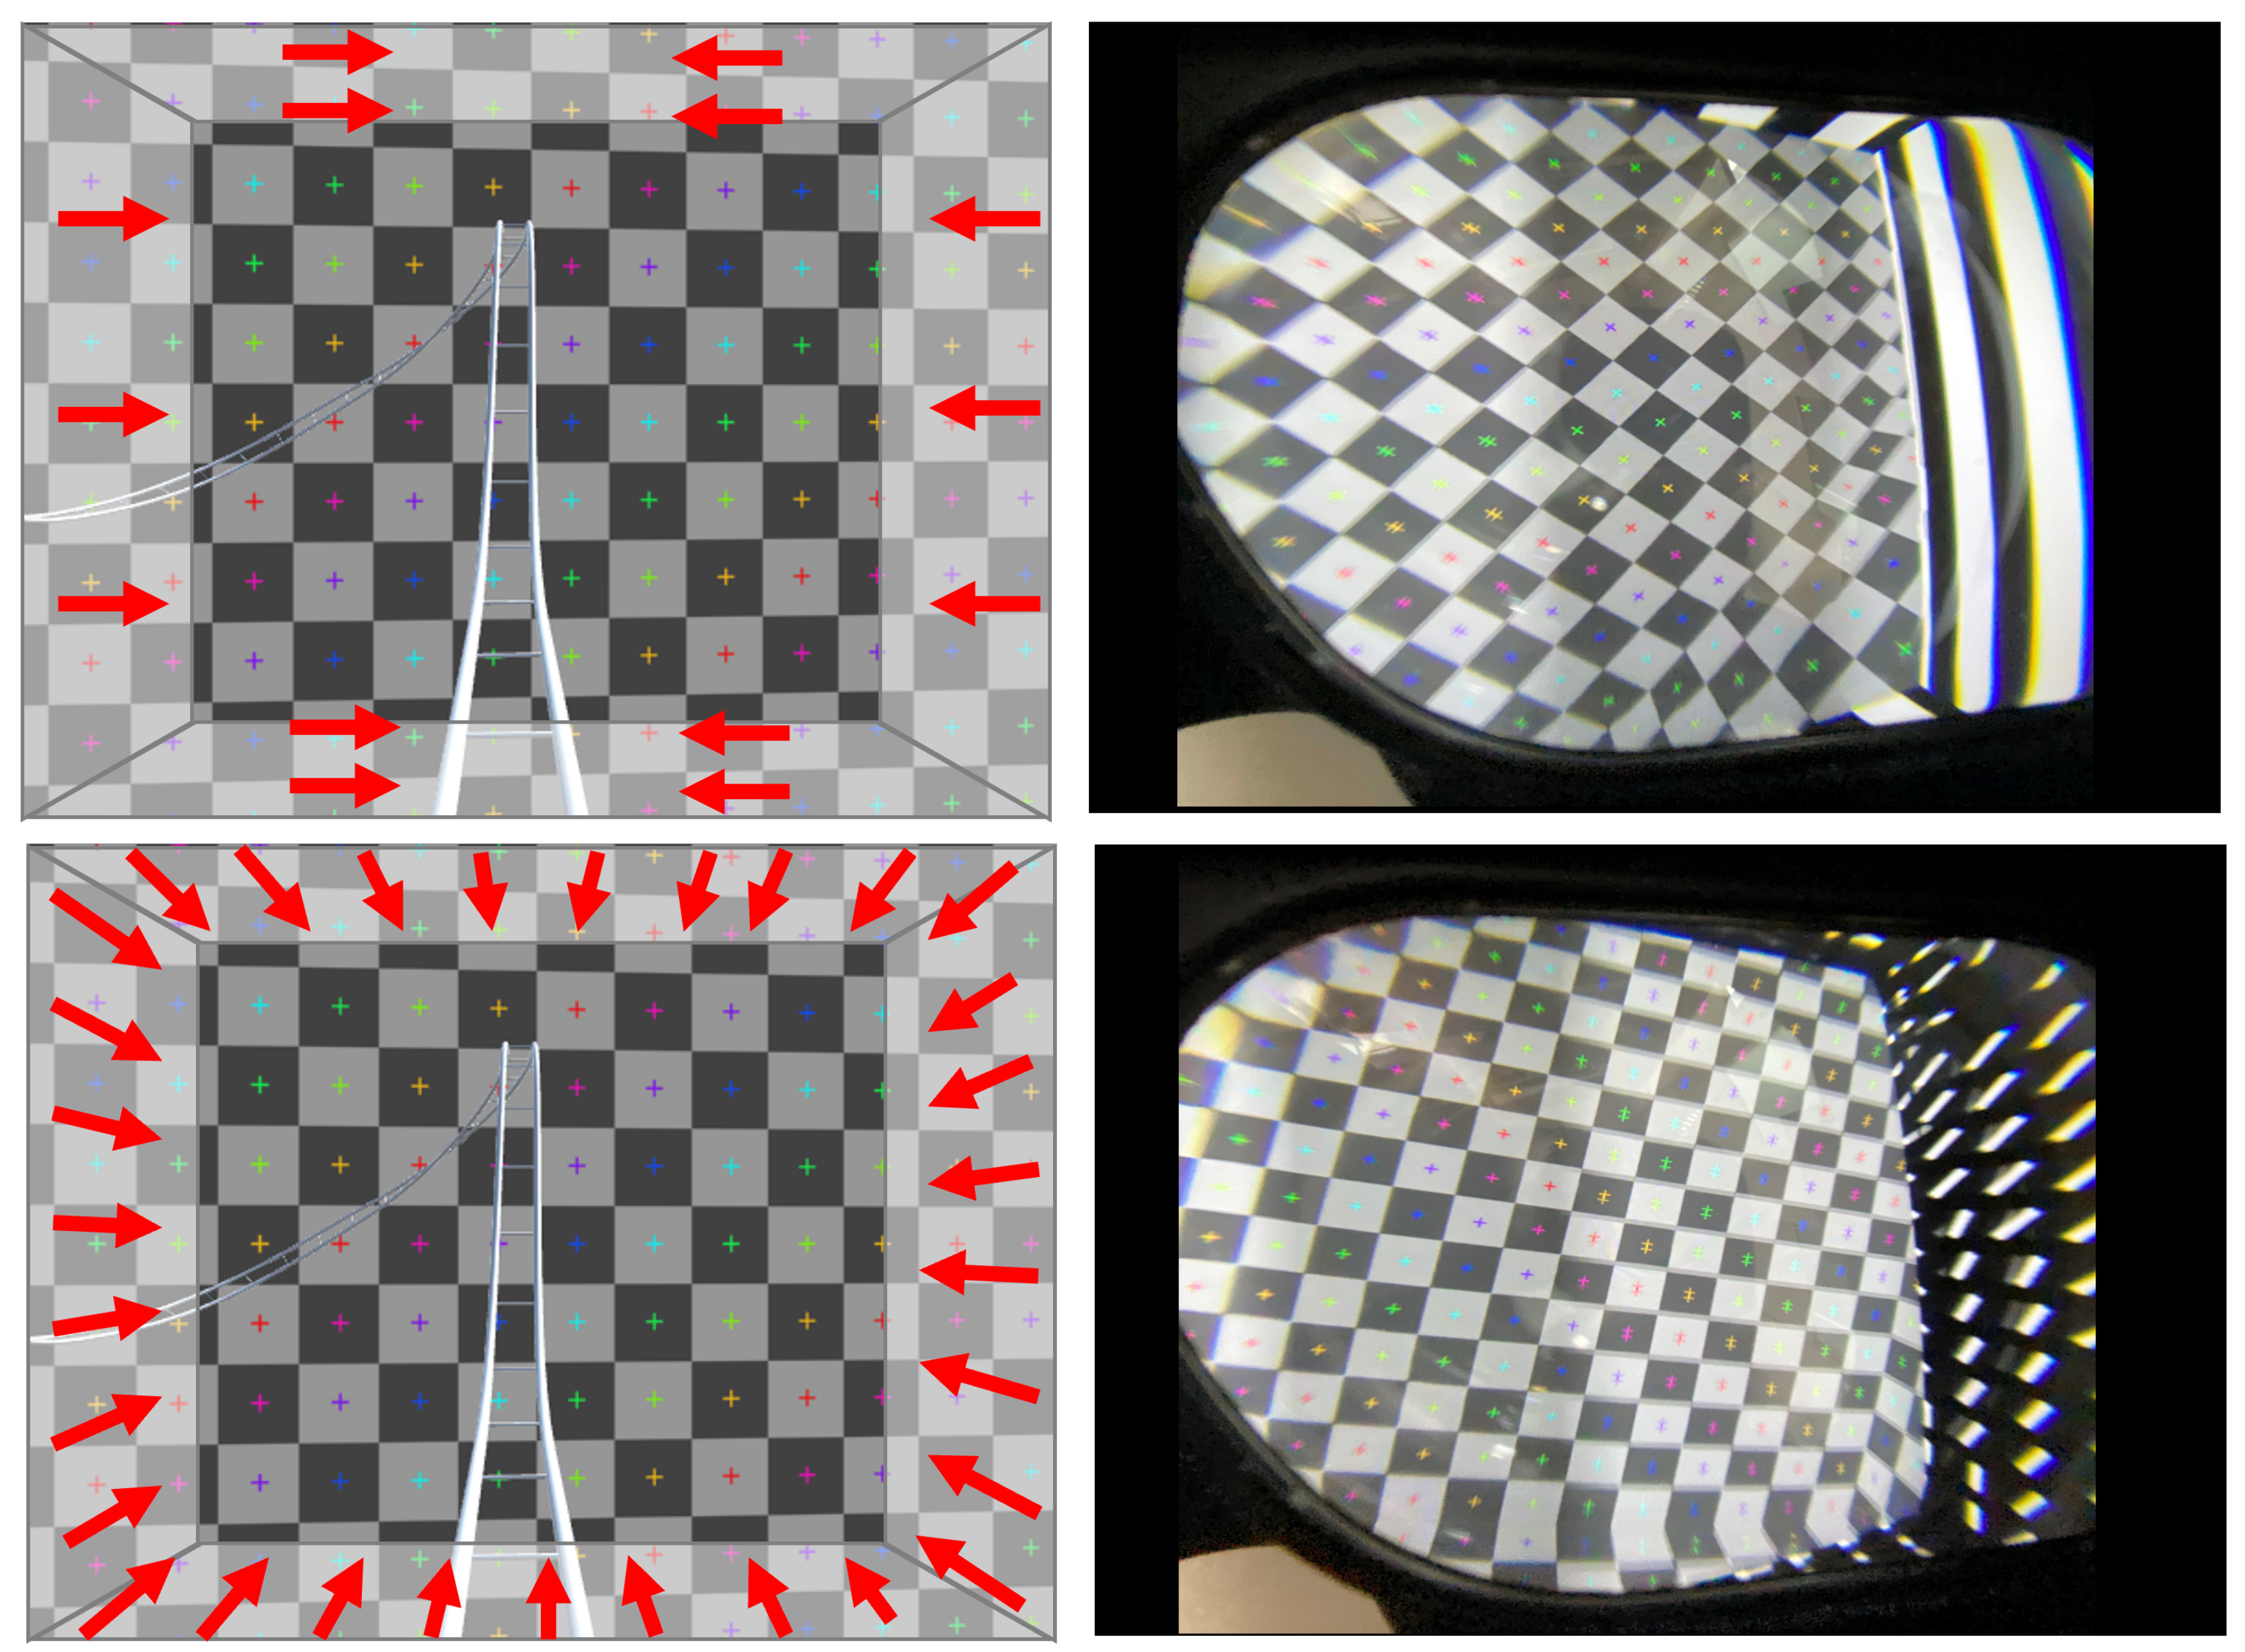
3. System Configuration: Reverse Optical Flow in the Visual Periphery

To implement and effectively demonstrate the mixing of the reverse optical flow into the VR navigation content in the visual periphery, we used a wide FoV headset from Pimax (Pimax 5K Plus:160.29° horizontal, 102.70° vertical). The two main issues in creating particular, but reasonable experimental conditions were: (1) determining the extent of the periphery and (2) computing and visualizing the reverse optical flow over it. In our validation experiments, the extent of the visual periphery was determined in two ways. In the first pilot experiment, it was set and fixed to be beyond the relatively smaller FoV of the Oculus Quest 2 headset (104° horizontal, 98° vertical), and the same experimental conditions as that of a previous study [2] were used (for the purpose of a comparison between the two studies). For the same reason, the periphery was rendered to simulate the sparse LEDs by a simple downsampling of the peripheral image (Figure 1) to 32 × 8 (assuming the same number of LEDs).
In the second main experiment, the visual periphery was changed dynamically based on the logic adopted in a previous study [4]. The radius of the circular FoV, beyond which the peripheral region was defined, was determined proportionally to only the linear velocity (the average during the last one second was used) of the user with the maximum ( M a x F o V = 105°) and minimum ( M i n F o V = 60°) values. The exact proportional relationship between the velocity and radius was set empirically based on trial and error and implemented with the Unity [30] script as follows (d: distance traveled between consecutive frames, t: time elapsed between consecutive frames, v: velocity, r: FoV radius, k: empirical proportional coefficient):
d = ( C u r r e n t U s e r P o s i t i o n O l d U s e r P o s i t i o n )
v = d · x 2 + d · y 2 + d · z 2 t
r = k × M e d i a n M a x F o V , M i n F o V P i m a x F o V × F o V R e s t r i c t o r W i d t h / 2 × v
The reverse optical flow was computed and visualized using the algorithm presented in [3]. Point features were extracted at short fixed frame intervals, and their screen–space movements in the following frames during the remainder of the interval were estimated using the Lucas–Kanade optical flow algorithm [31]. The estimated optical flow vectors were reversed and drawn as white line segments and added individually to the feature locations (found at the start of the interval) to provide a sense of reversely animated movements.
The test system was implemented and run on a PC (Windows 10) with an AMD Ryzen 5 3600 6-core processor (3.6 GHz, 16 GB RAM) and the Nvidia GeForce RTX 2070 SUPER graphics card. For more details on the algorithms used for the dynamic FoV adjustment and reverse optical flow visualization, refer to [2,3].

4. Pilot Experiment

The pilot experiment first compared the sickness reduction effect by visualizing the periphery with the rotating striped bars, as was originally conducted in [2], and using the reverse optical flow instead. The three test conditions were as follows (one factor—three levels, within-subject repeated measures design; see Figure 1):
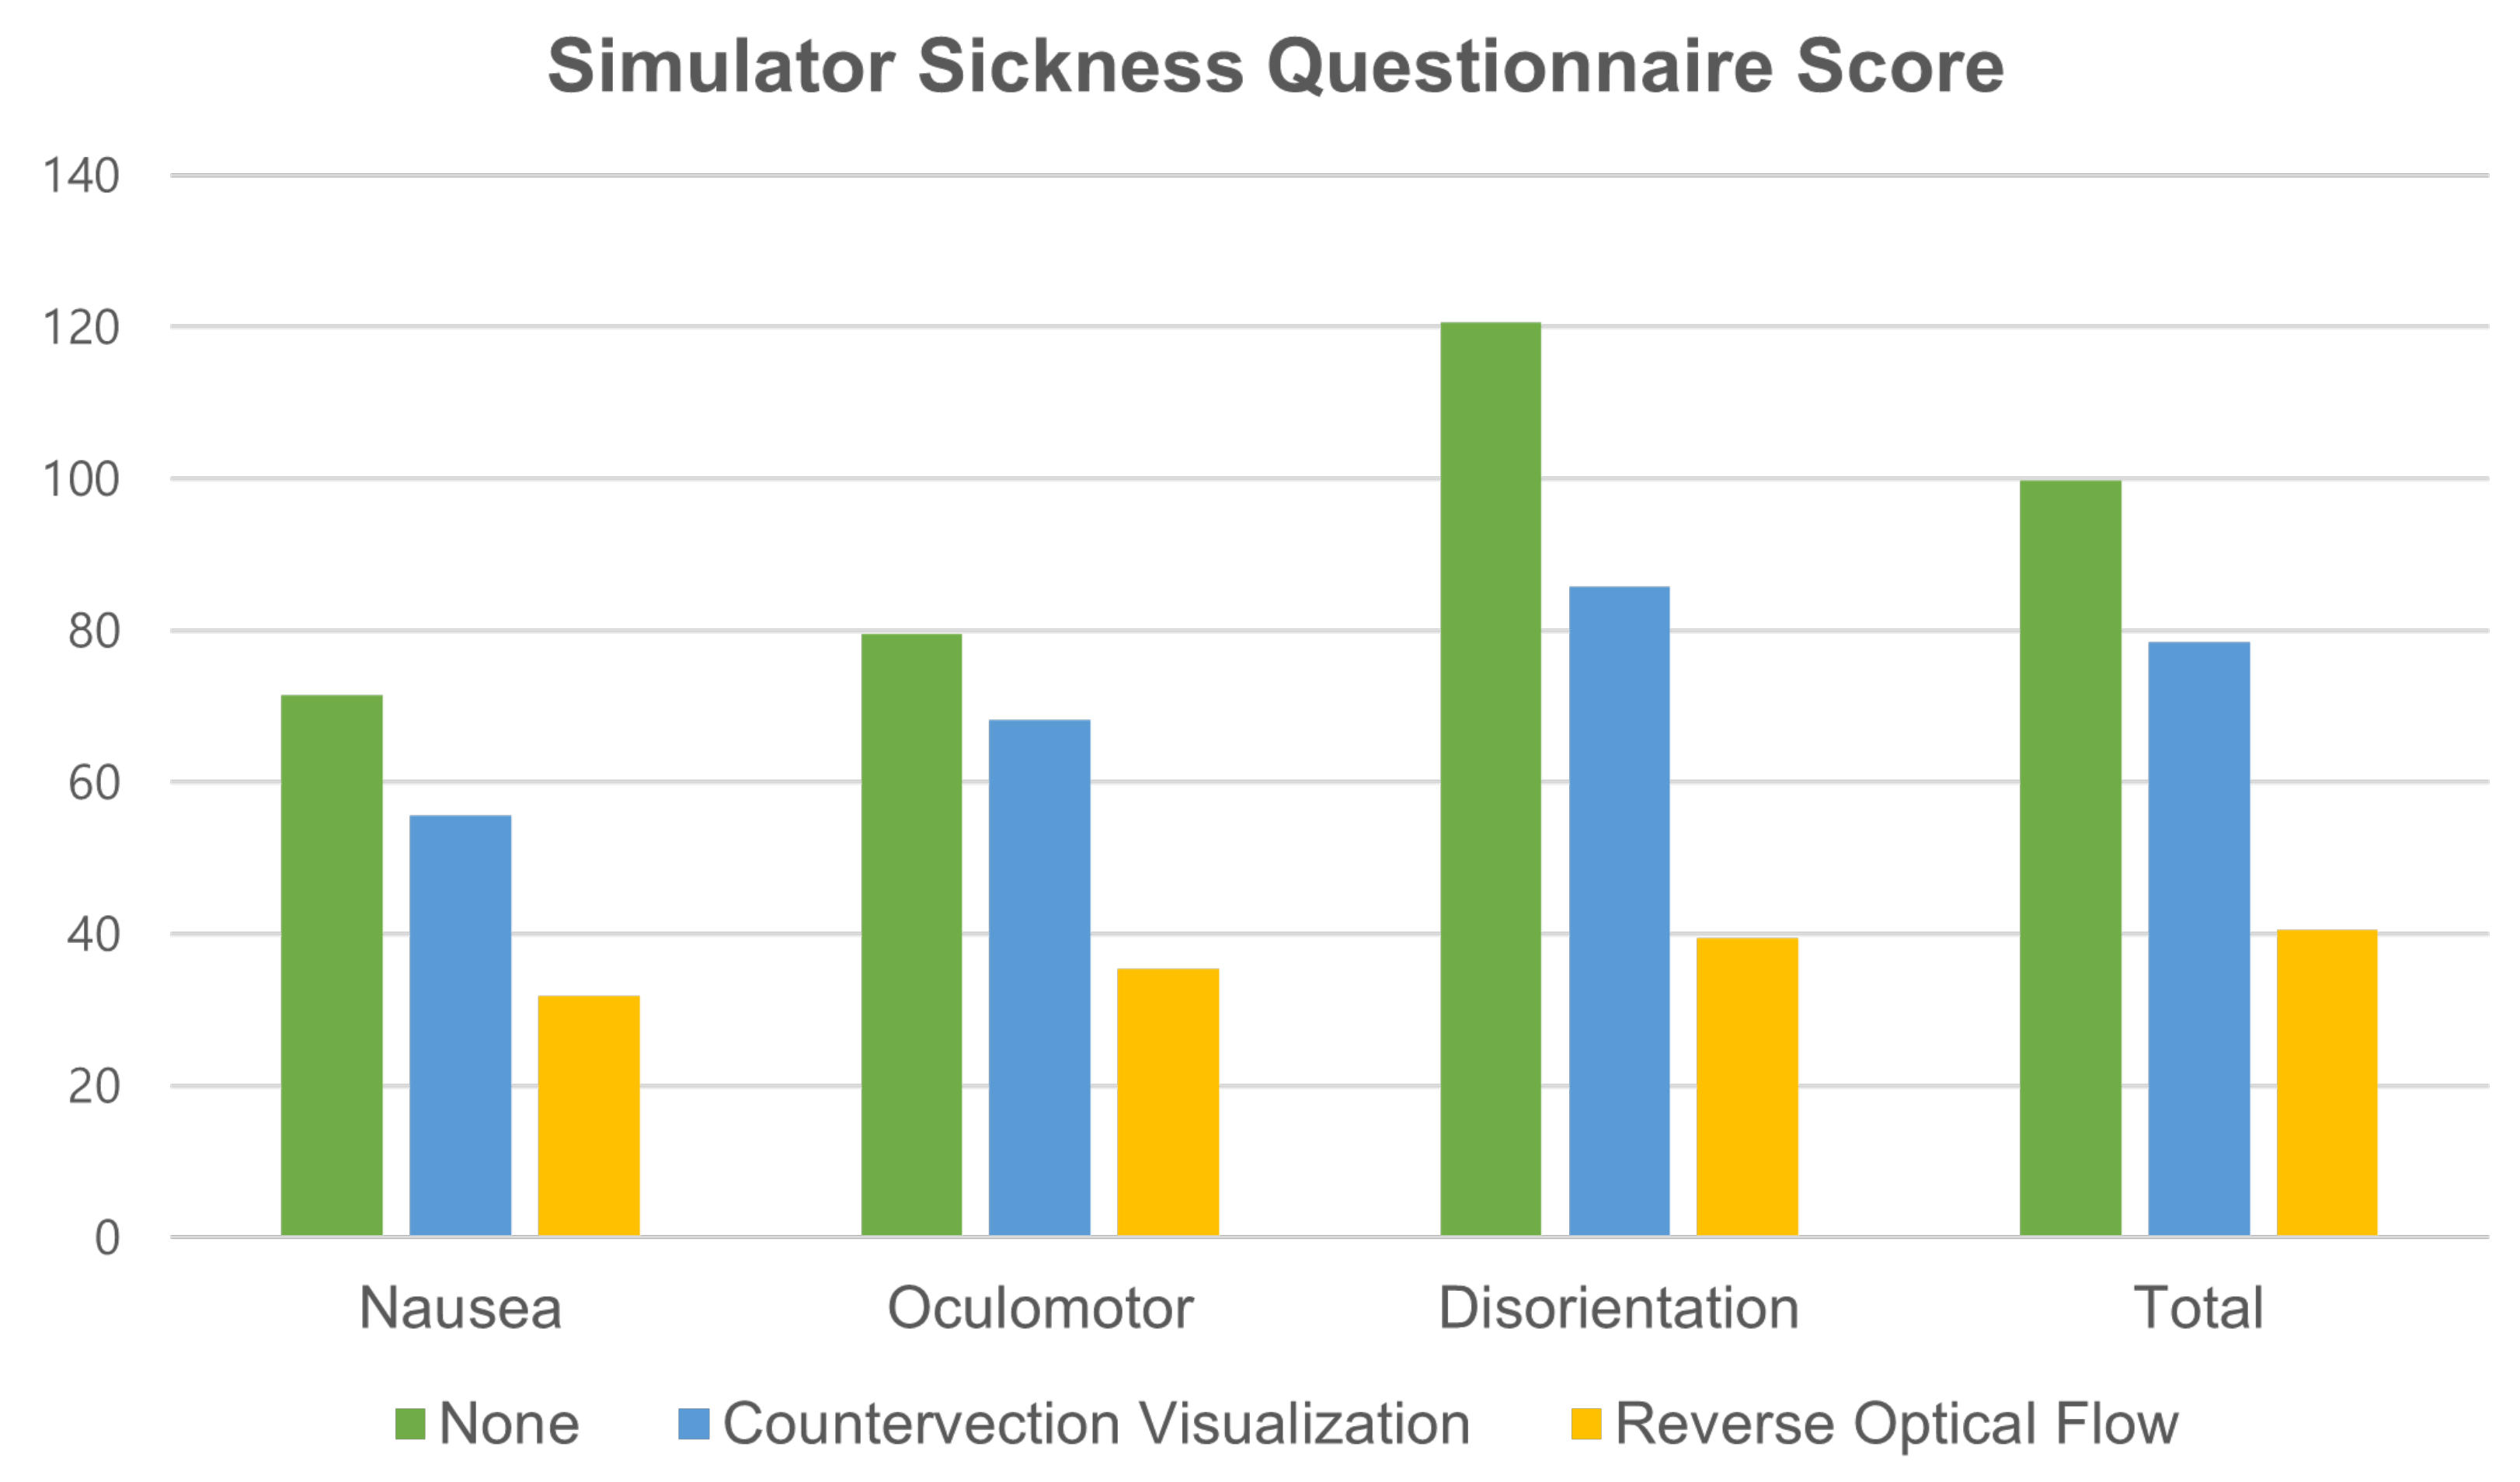
  • None: The peripheral visual field was rendered black (baseline).
  • Moving striped bars (CV): The peripheral visual field was rendered with a projection of rotating striped bars, situated at the top, bottom, left, and right ends of the display. This condition simulated a previous study [2].
  • Reverse optical flow (RO): The peripheral visual field was rendered with the reverse optical flow, as suggested in [3].
Six participants (five males and one female, mean = 25.5/SD = 2.31) were asked to experience and view a roller coaster ride content for 3 min in a balanced order across three test conditions. The background of the roller coaster ride content was decaled with a dotted grid pattern to guarantee a sufficient number of features to generate a reasonable and uniform optical reverse flow in the periphery.
The primary dependent variable was the sickness level, measured using the simulator sickness questionnaire (SSQ) proposed by Kennedy et al. [32]. The baseline level (baseline) was measured, and after each treatment, as the participants rested (as much as needed), they filled out the SSQ such that the after-effects could be measured. The subcategory scores were scaled by the weight factors, as indicated in [32] (N = 9.54, O = 7.58, D = 13.92, and T = 3.74), for later comparison.
Figure 3 shows the results; in all categories including the total score, a decreasing trend in the sickness levels was observed in the order of none > striped bars > reverse flow. However, no statistically significant differences were found, most likely because of the low number of participants.

5. Main Experiment

5.1. Experimental Design

The main experiment focused on comparing the basic dynamic FoV adjustment approach and the one extended with peripheral reverse optical flow visualization with regard to the relative effects of VR sickness reduction and user experience such as distraction and presence/immersion.
Based on the positive results of the pilot experiment, we rendered the reverse optical flow in the periphery (rather than the rotating striped bars). In this experiment, peripheral visualization was not made sparse. The experiment was designed with two independent variables, namely Factor 1: visualization type (four levels, see below); Factor 2: the content type, thus making it a 4 × 2 within-subject repeated measures design (eight test conditions in total). The two contents tested were a roller coaster ride and space navigation (Figure 2). The former included only four degrees of freedom, while the latter had six degrees of freedom. In addition, the space navigation content had significantly sparser features than those in the roller coaster ride. The four test groups according to the first factor are explained below (Figure 2):
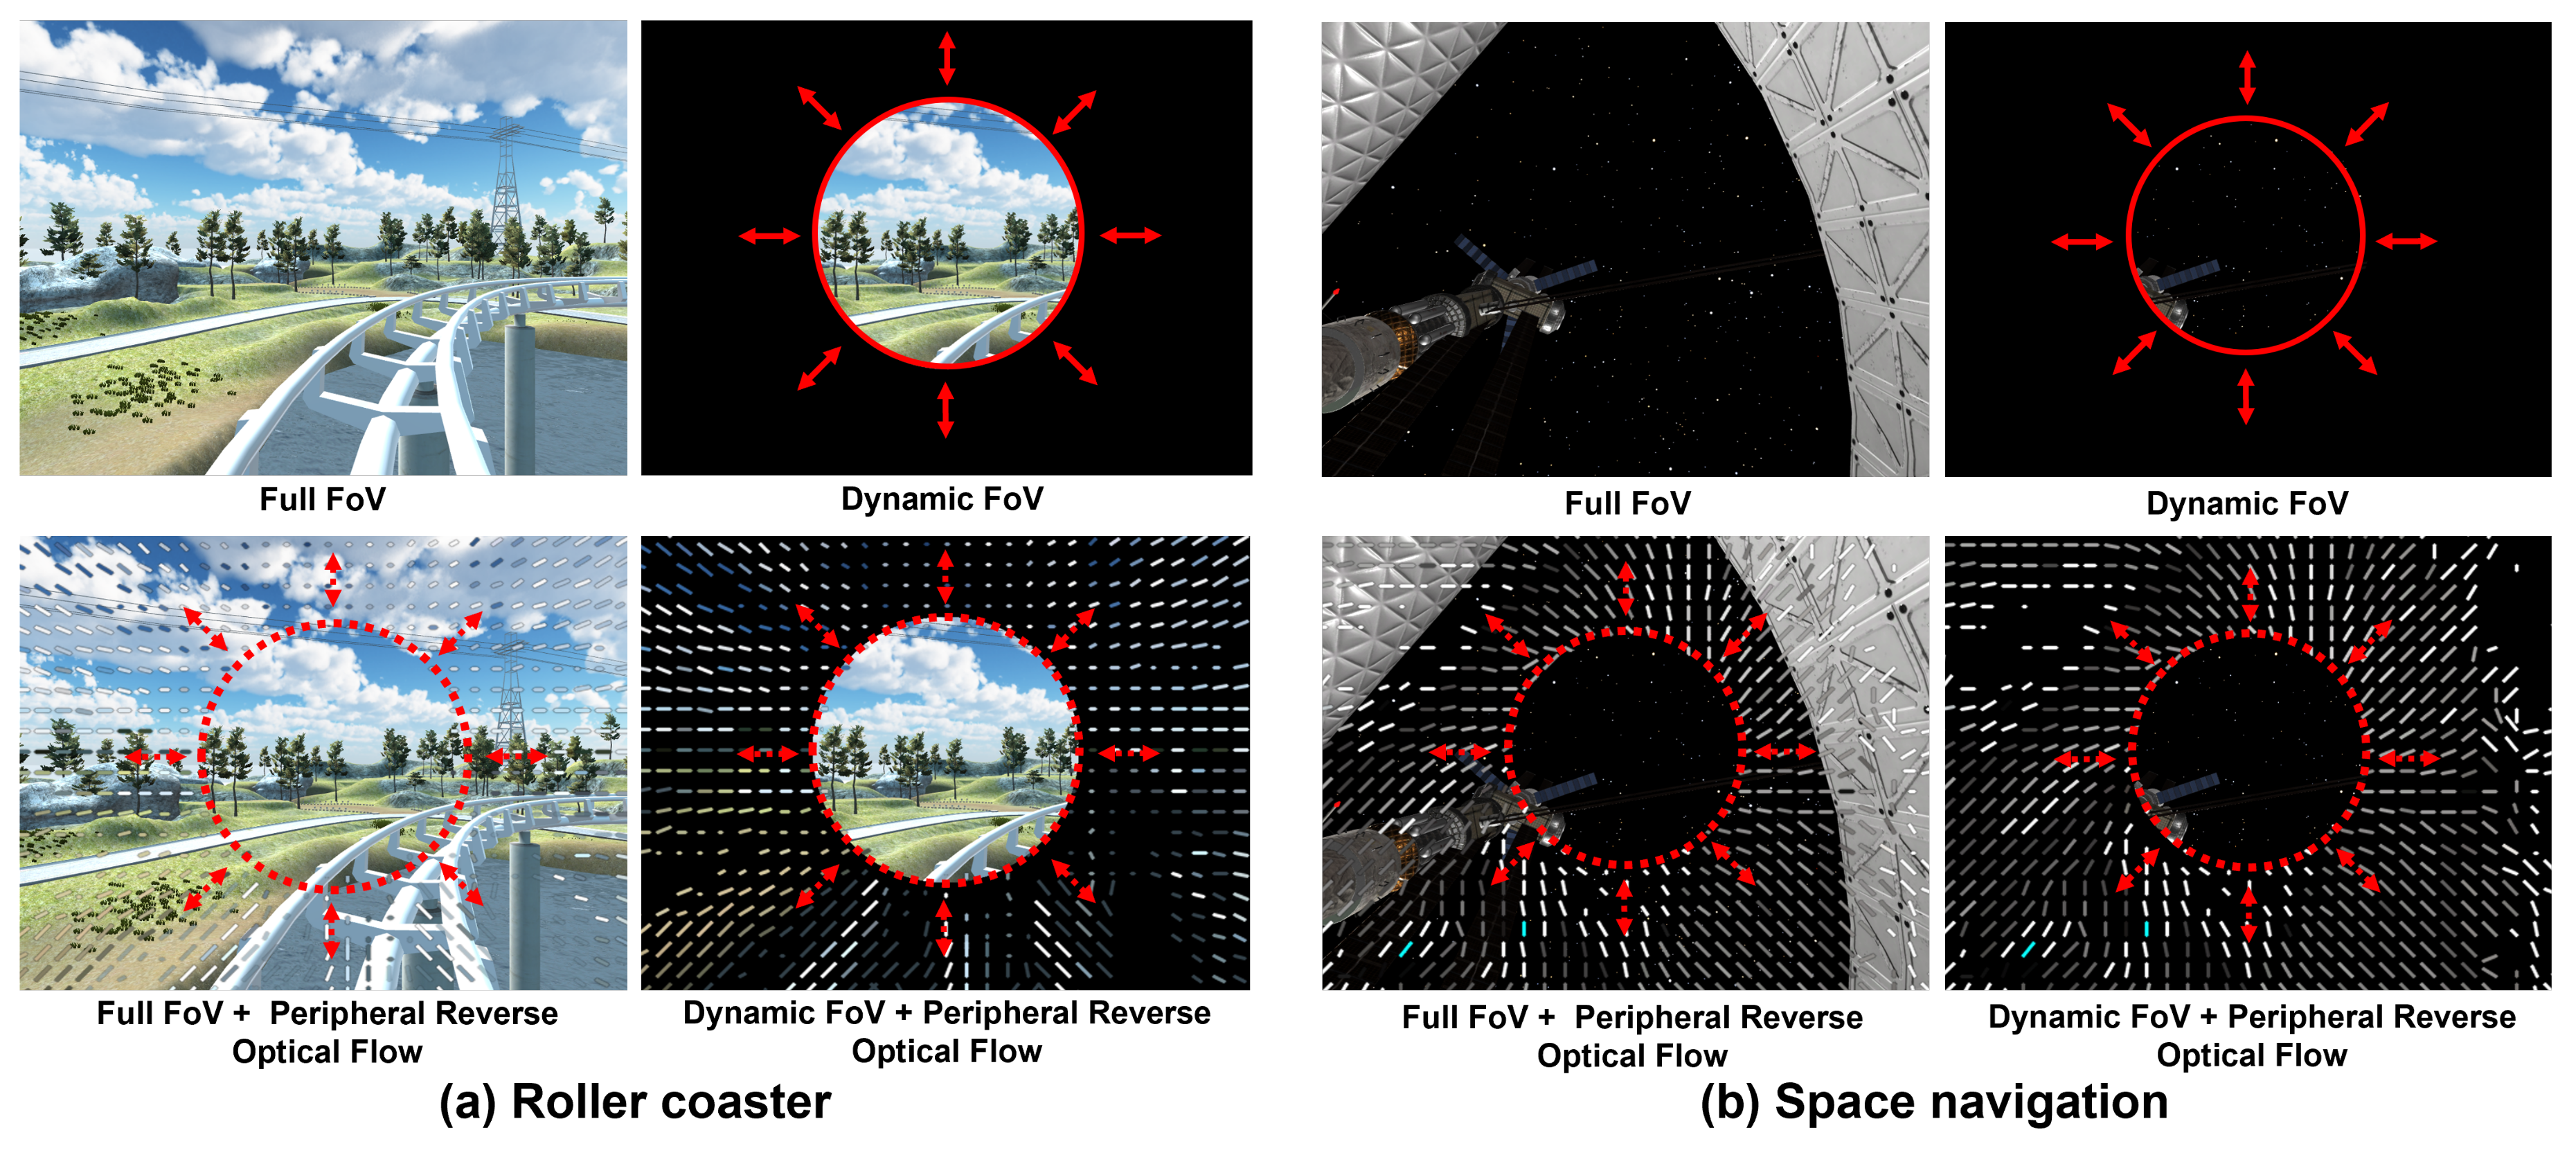
  • None/full FoV (F-FoV): The content was displayed with the full FoV (baseline).
  • Dynamic FoV (D-FoV): The content was displayed with the FoV adjusted according to the logic described in Section 3. The display was blacked out beyond the FoV.
  • Full FoV + peripheral reverse optical flow (F-FoV+P-ROF): The content was displayed with the full FoV, but with the reverse optical flow mixed in and overlaid on the periphery. The extent of the periphery was determined by the same dynamic FoV algorithm applied in the second condition, and the reverse optical flow visualization followed the same method as proposed by [3] and in the first pilot experiment.
  • Dynamic FoV + peripheral reverse optical flow (D-FoV+P-ROF): The same dynamic FoV algorithm as in the second condition was used. However, the periphery beyond the FoV was overlaid with the reverse optical flow with a blacked-out background.
Our main hypothesis was that the peripheral overlay of the reverse optical flow without the restricted content FoV (F-FoV+P-ROF) is at least preferred over the dynamic FOV adjustment (D-FoV) or even the combined approach (D-FoV+P-ROF)) because of its competitive VR sickness reduction effect and less content intrusion.

5.2. Participants

More than 41 potential subjects were recruited through a closed university on-line community. They filled out a self-reporting survey about their basic demographic backgrounds (including the extent of any prior VR experience) and tendency/sensitivity toward motion and simulator sickness (compensation of USD 3). We used the reduced version of the MSSQ [33] for the latter. Subjects who indicated very high or low sensitivity (>75 or <25 percentile) to the self-reported VR sickness were excluded from the experiment, regardless of how much prior VR experience they might have had. Note that a deeper investigation of the relationship between the effect of our approach and prior VR experience remains a possible future work. This was performed so as to assess the applicability of our work to the typical VR users. A final total of 24 participants (9 men and 15 women between the ages of 18 and 31, mean = 24.5/SD = 3.02) participated in the actual experiment. Those final subjects were paid USD 23 for their participation.

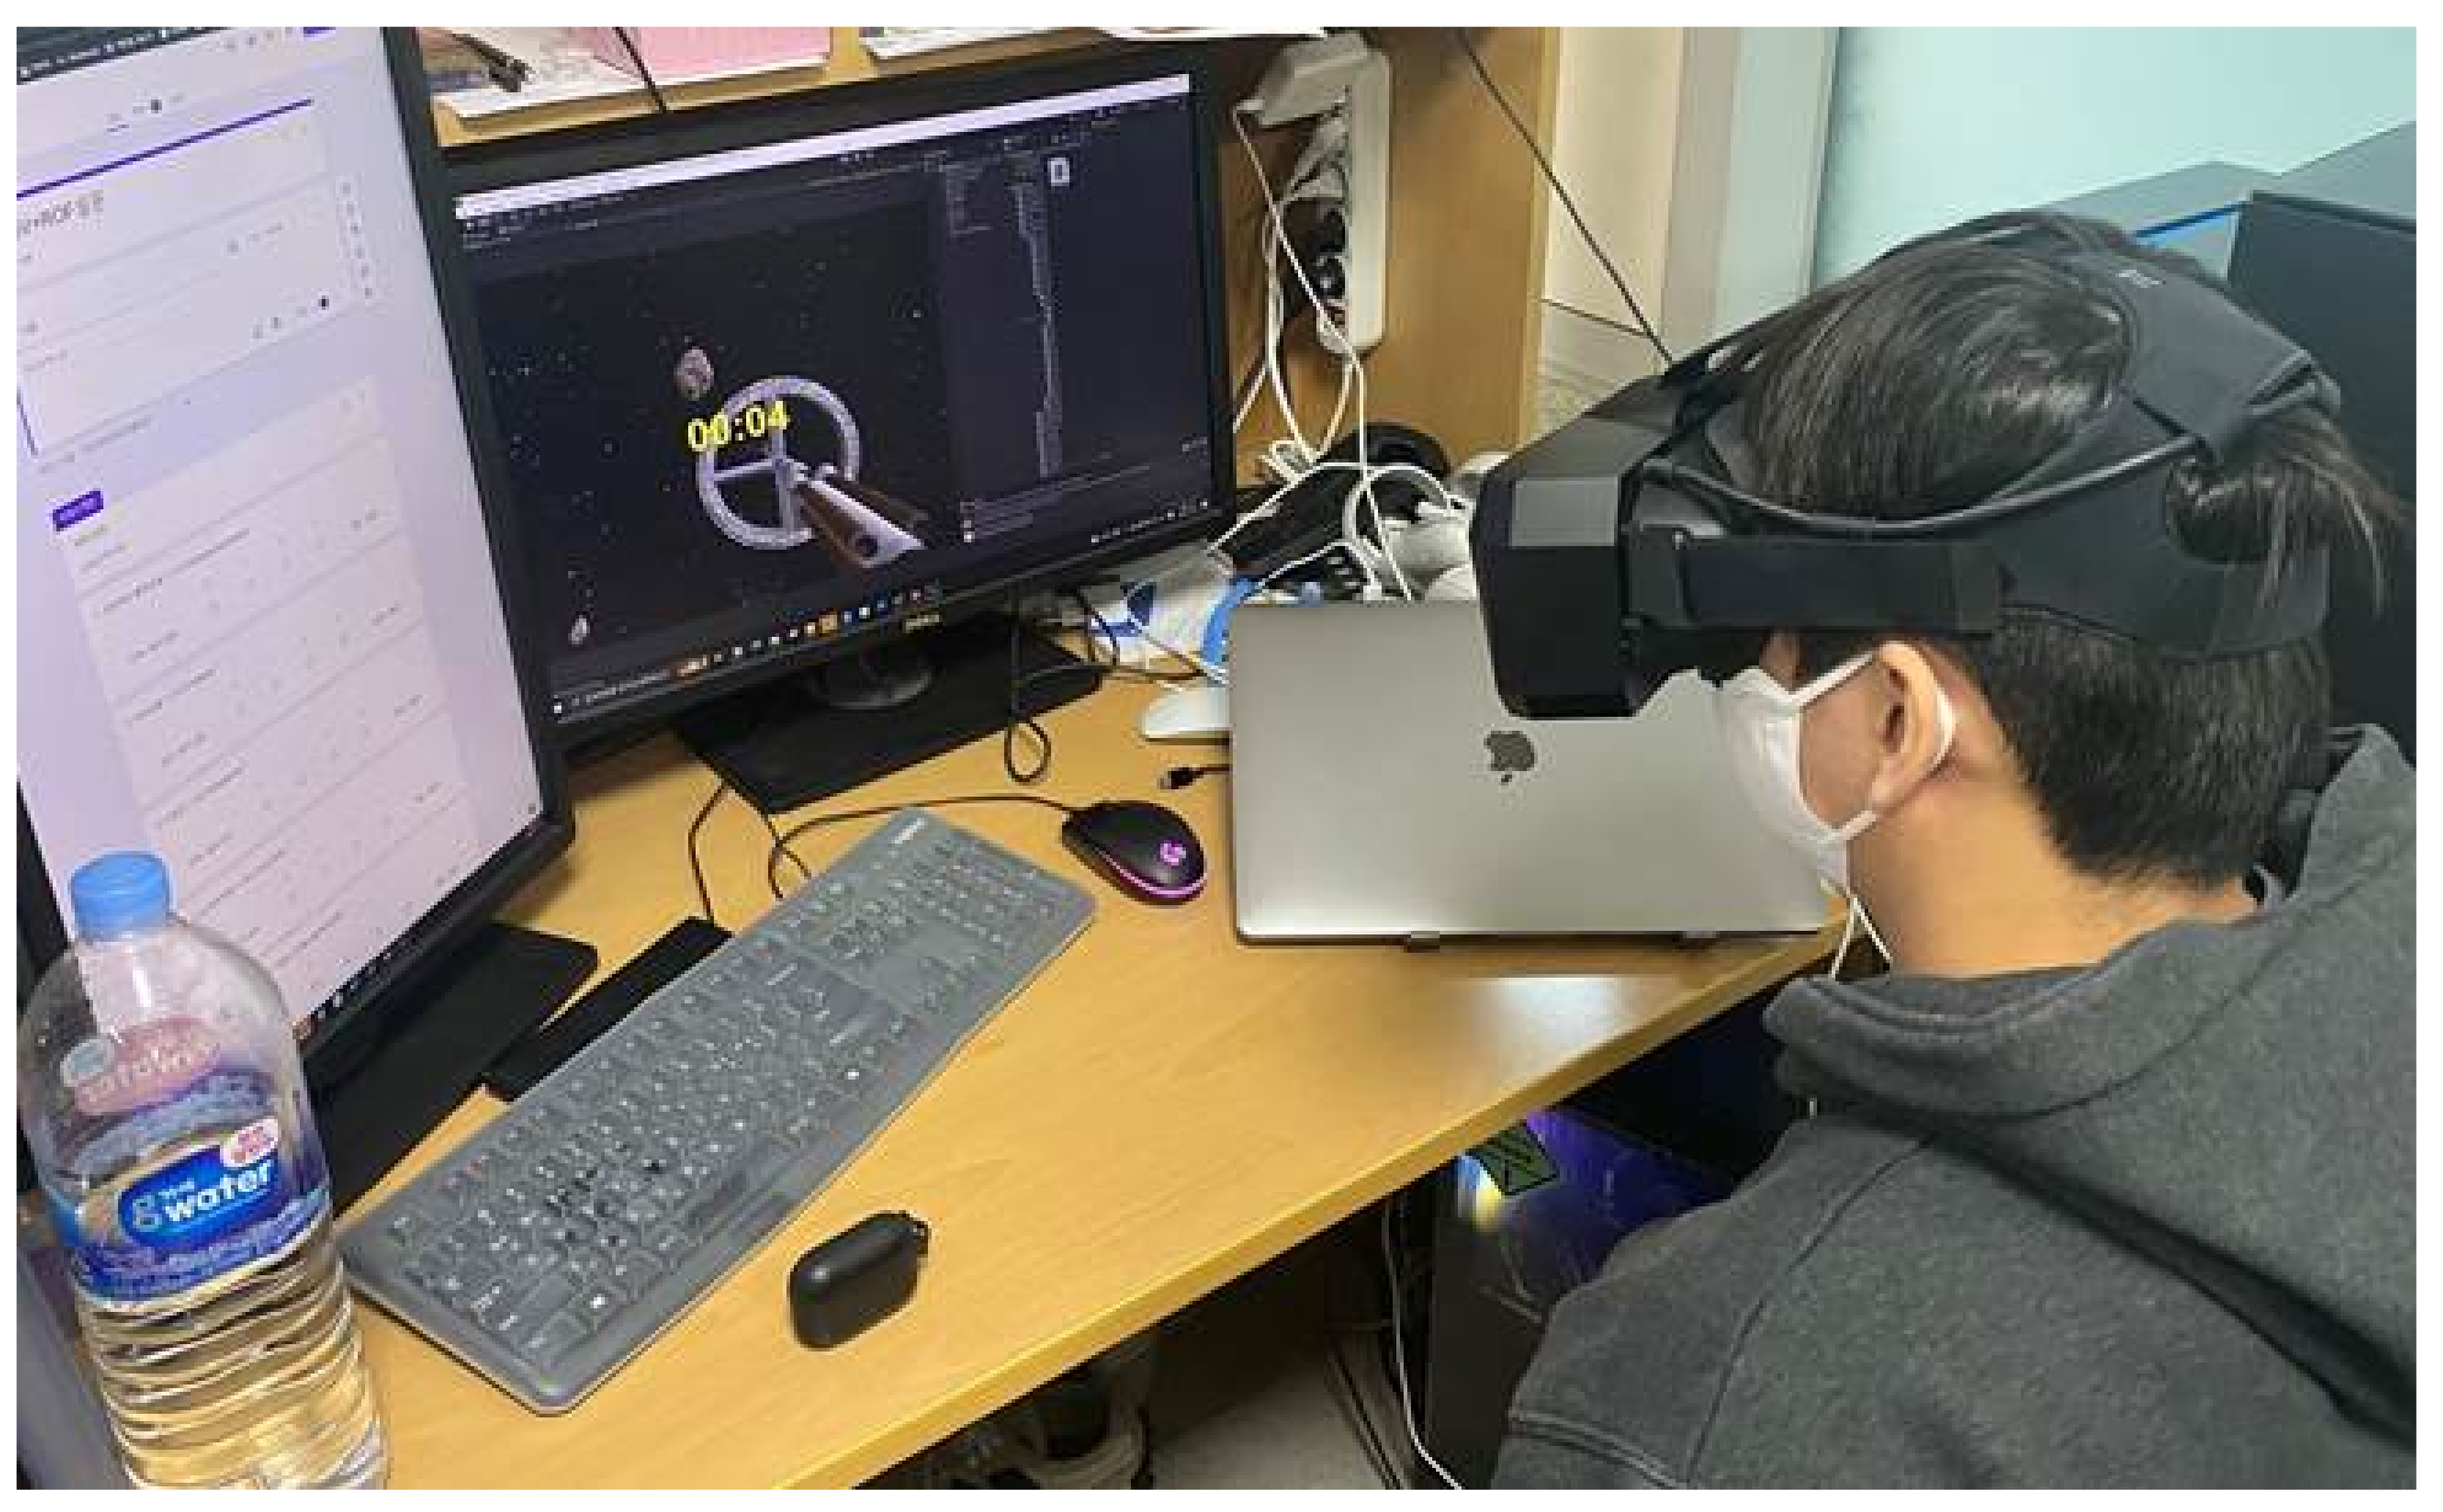
5.3. Experimental Procedure
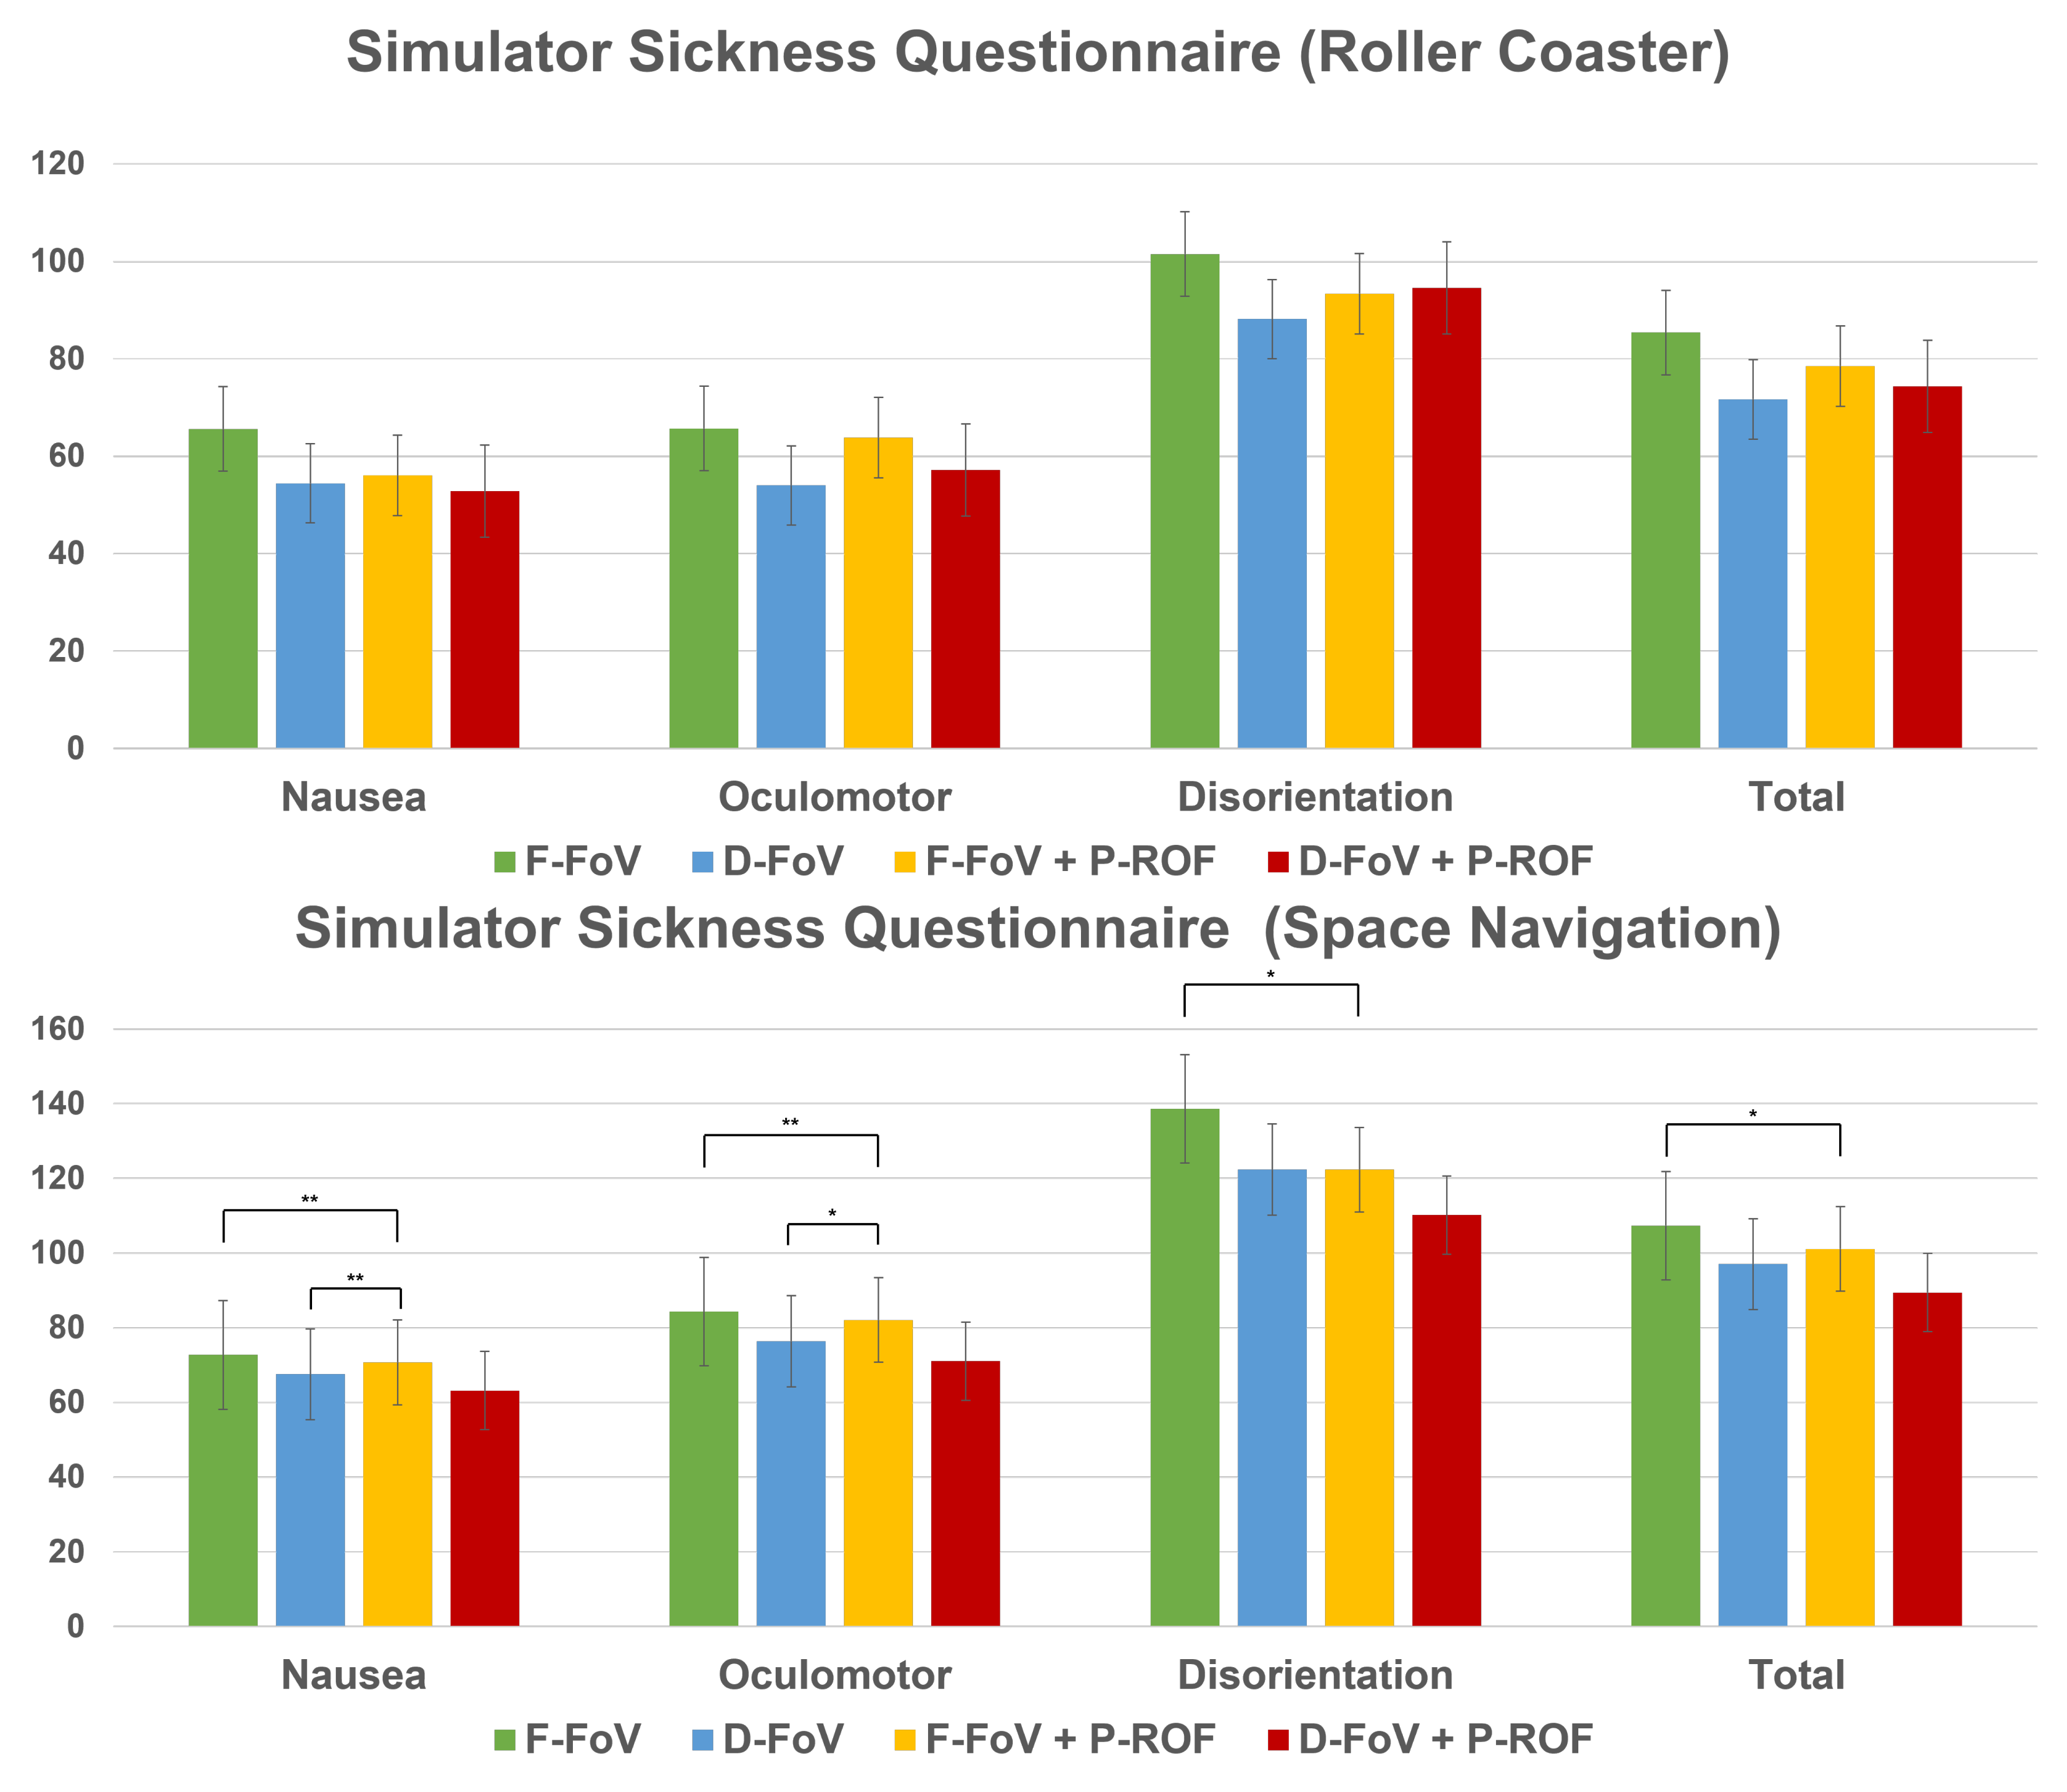
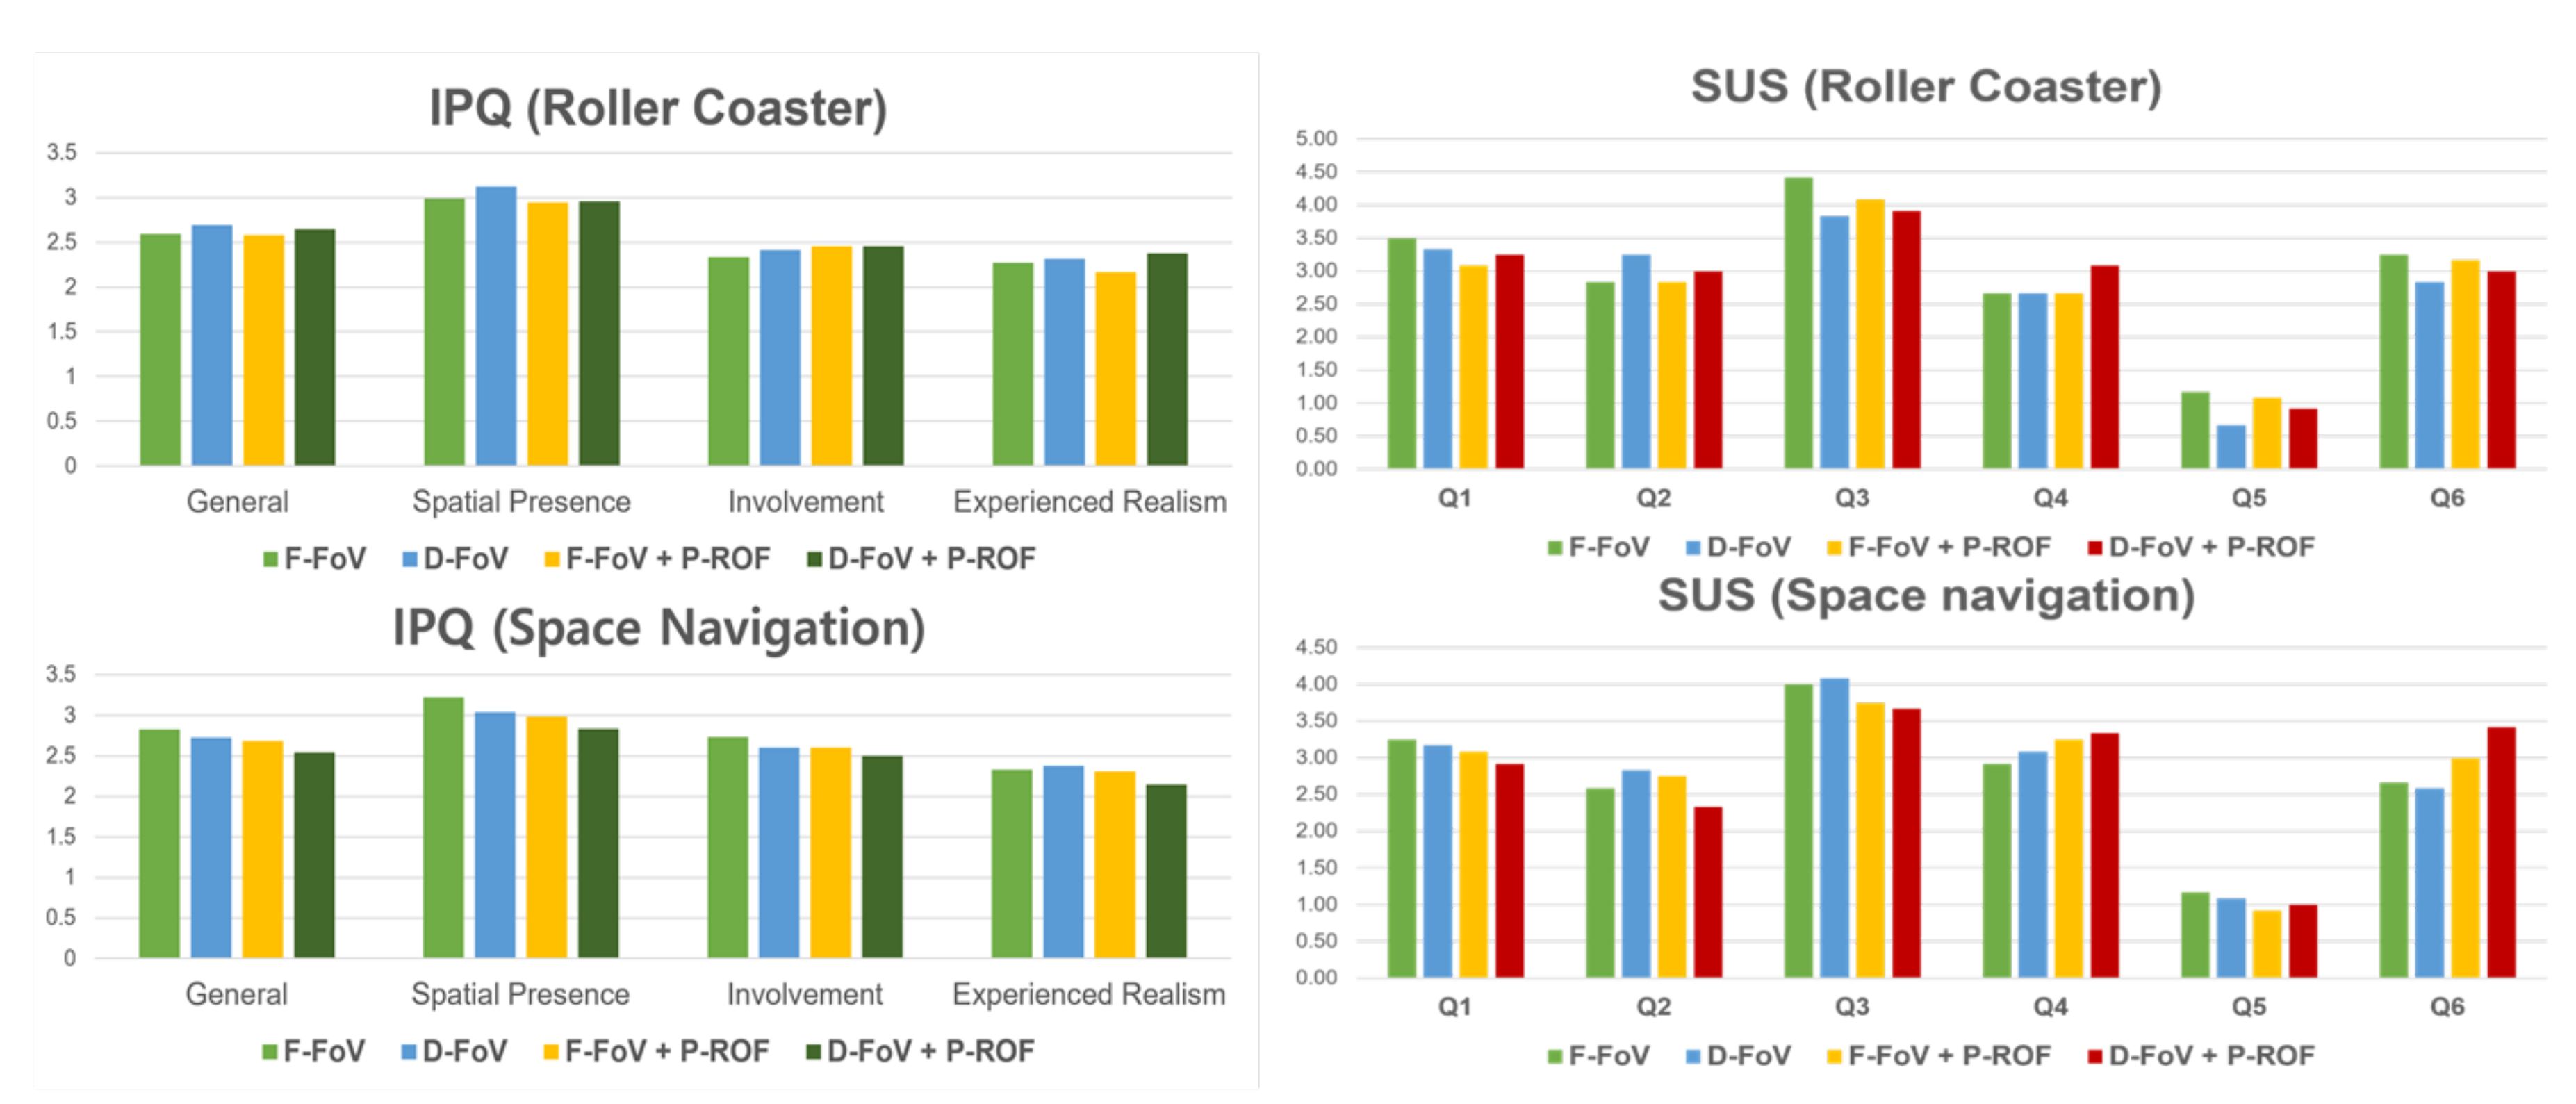
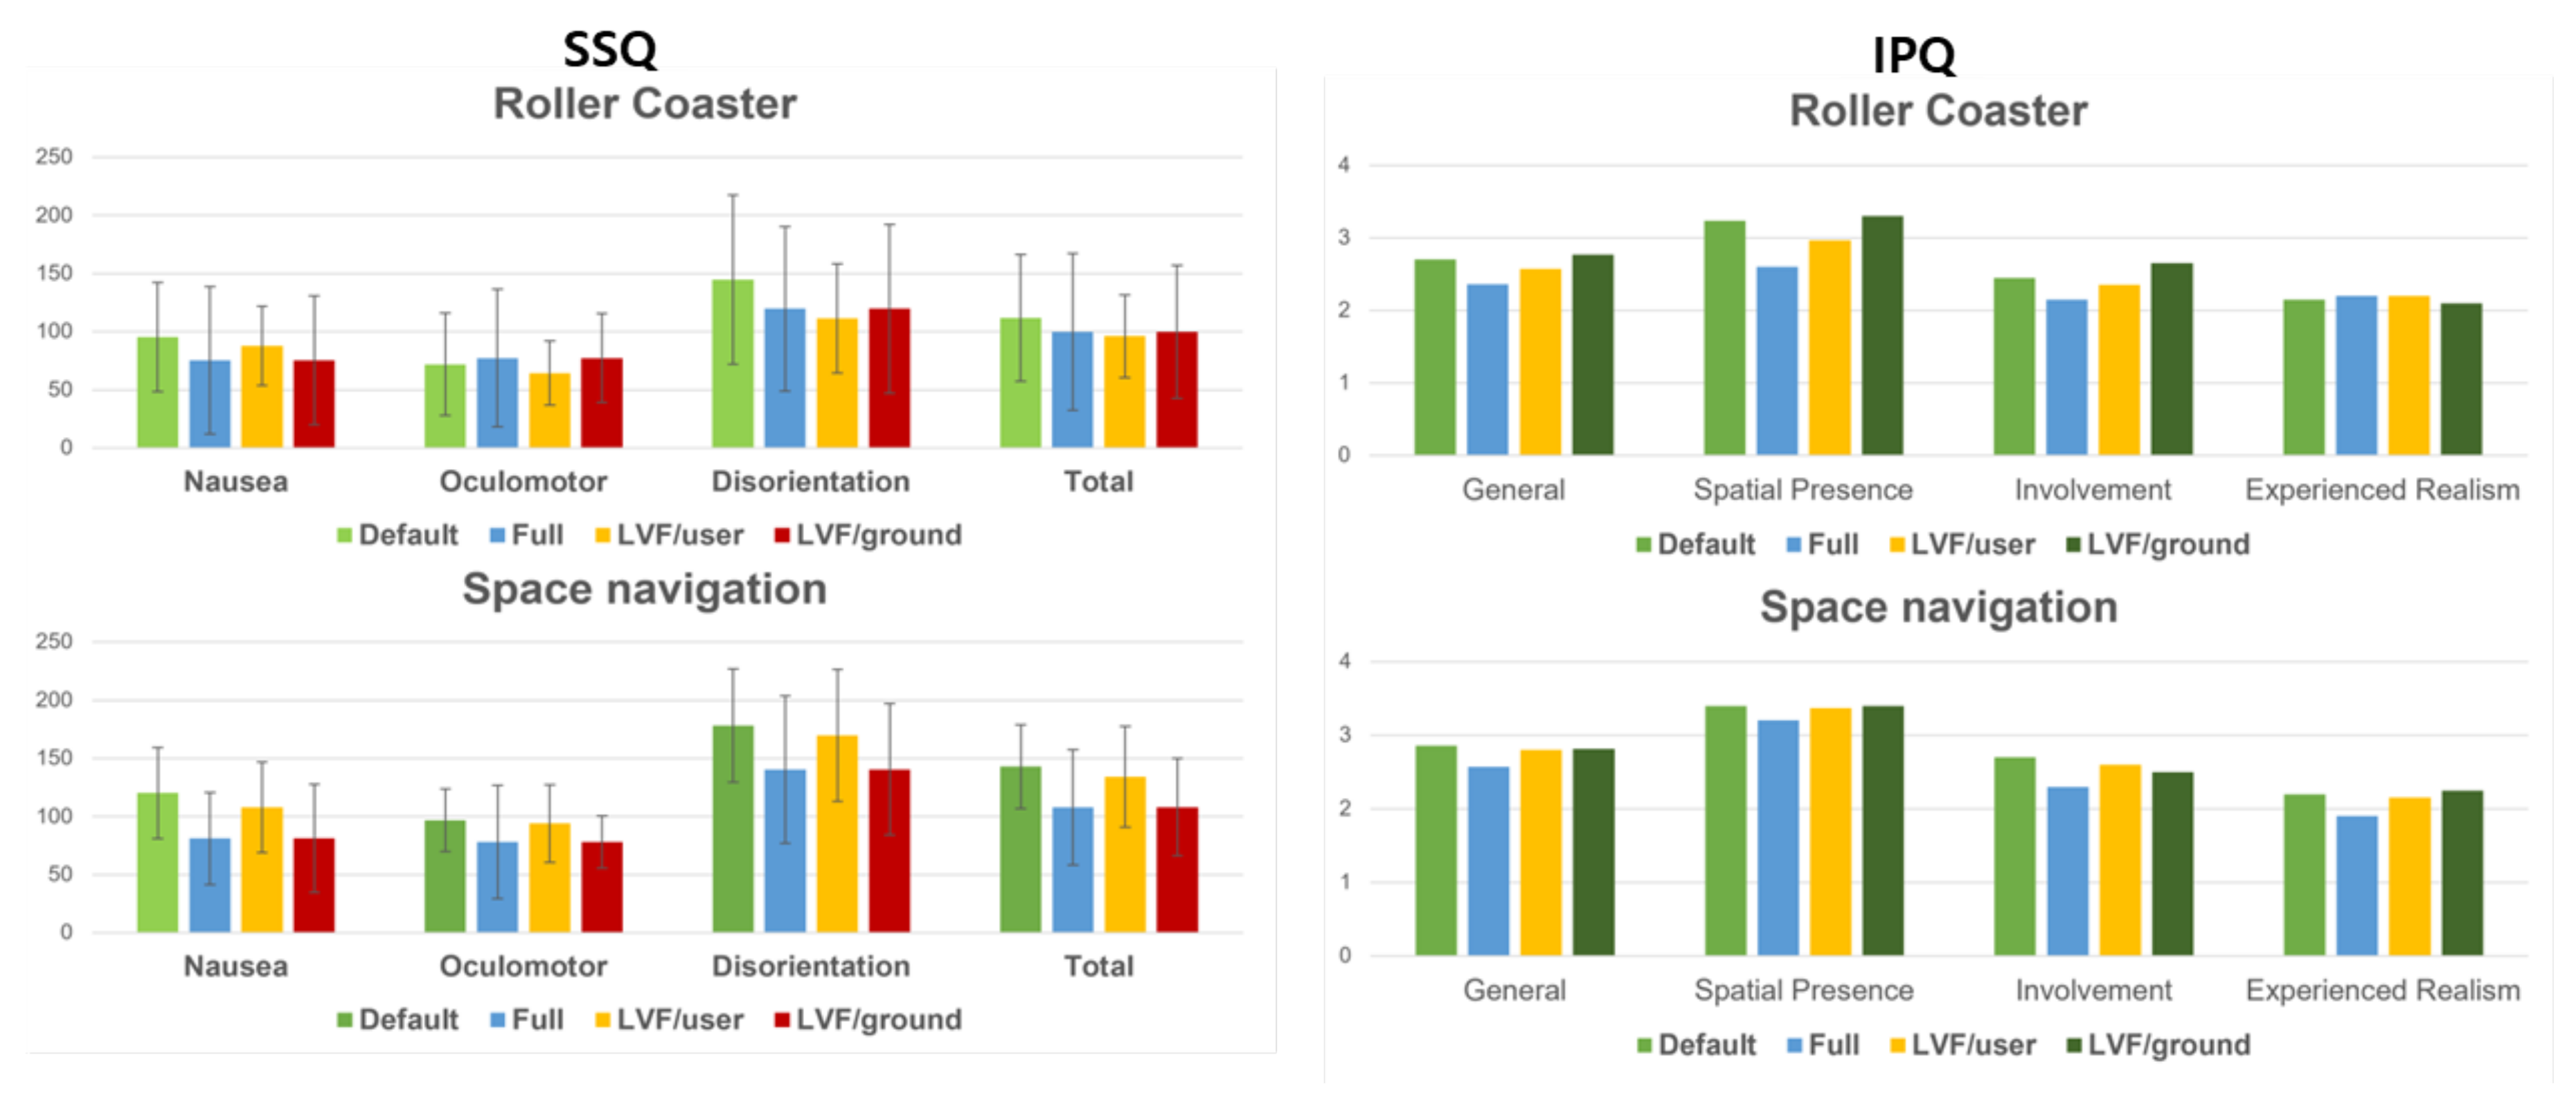
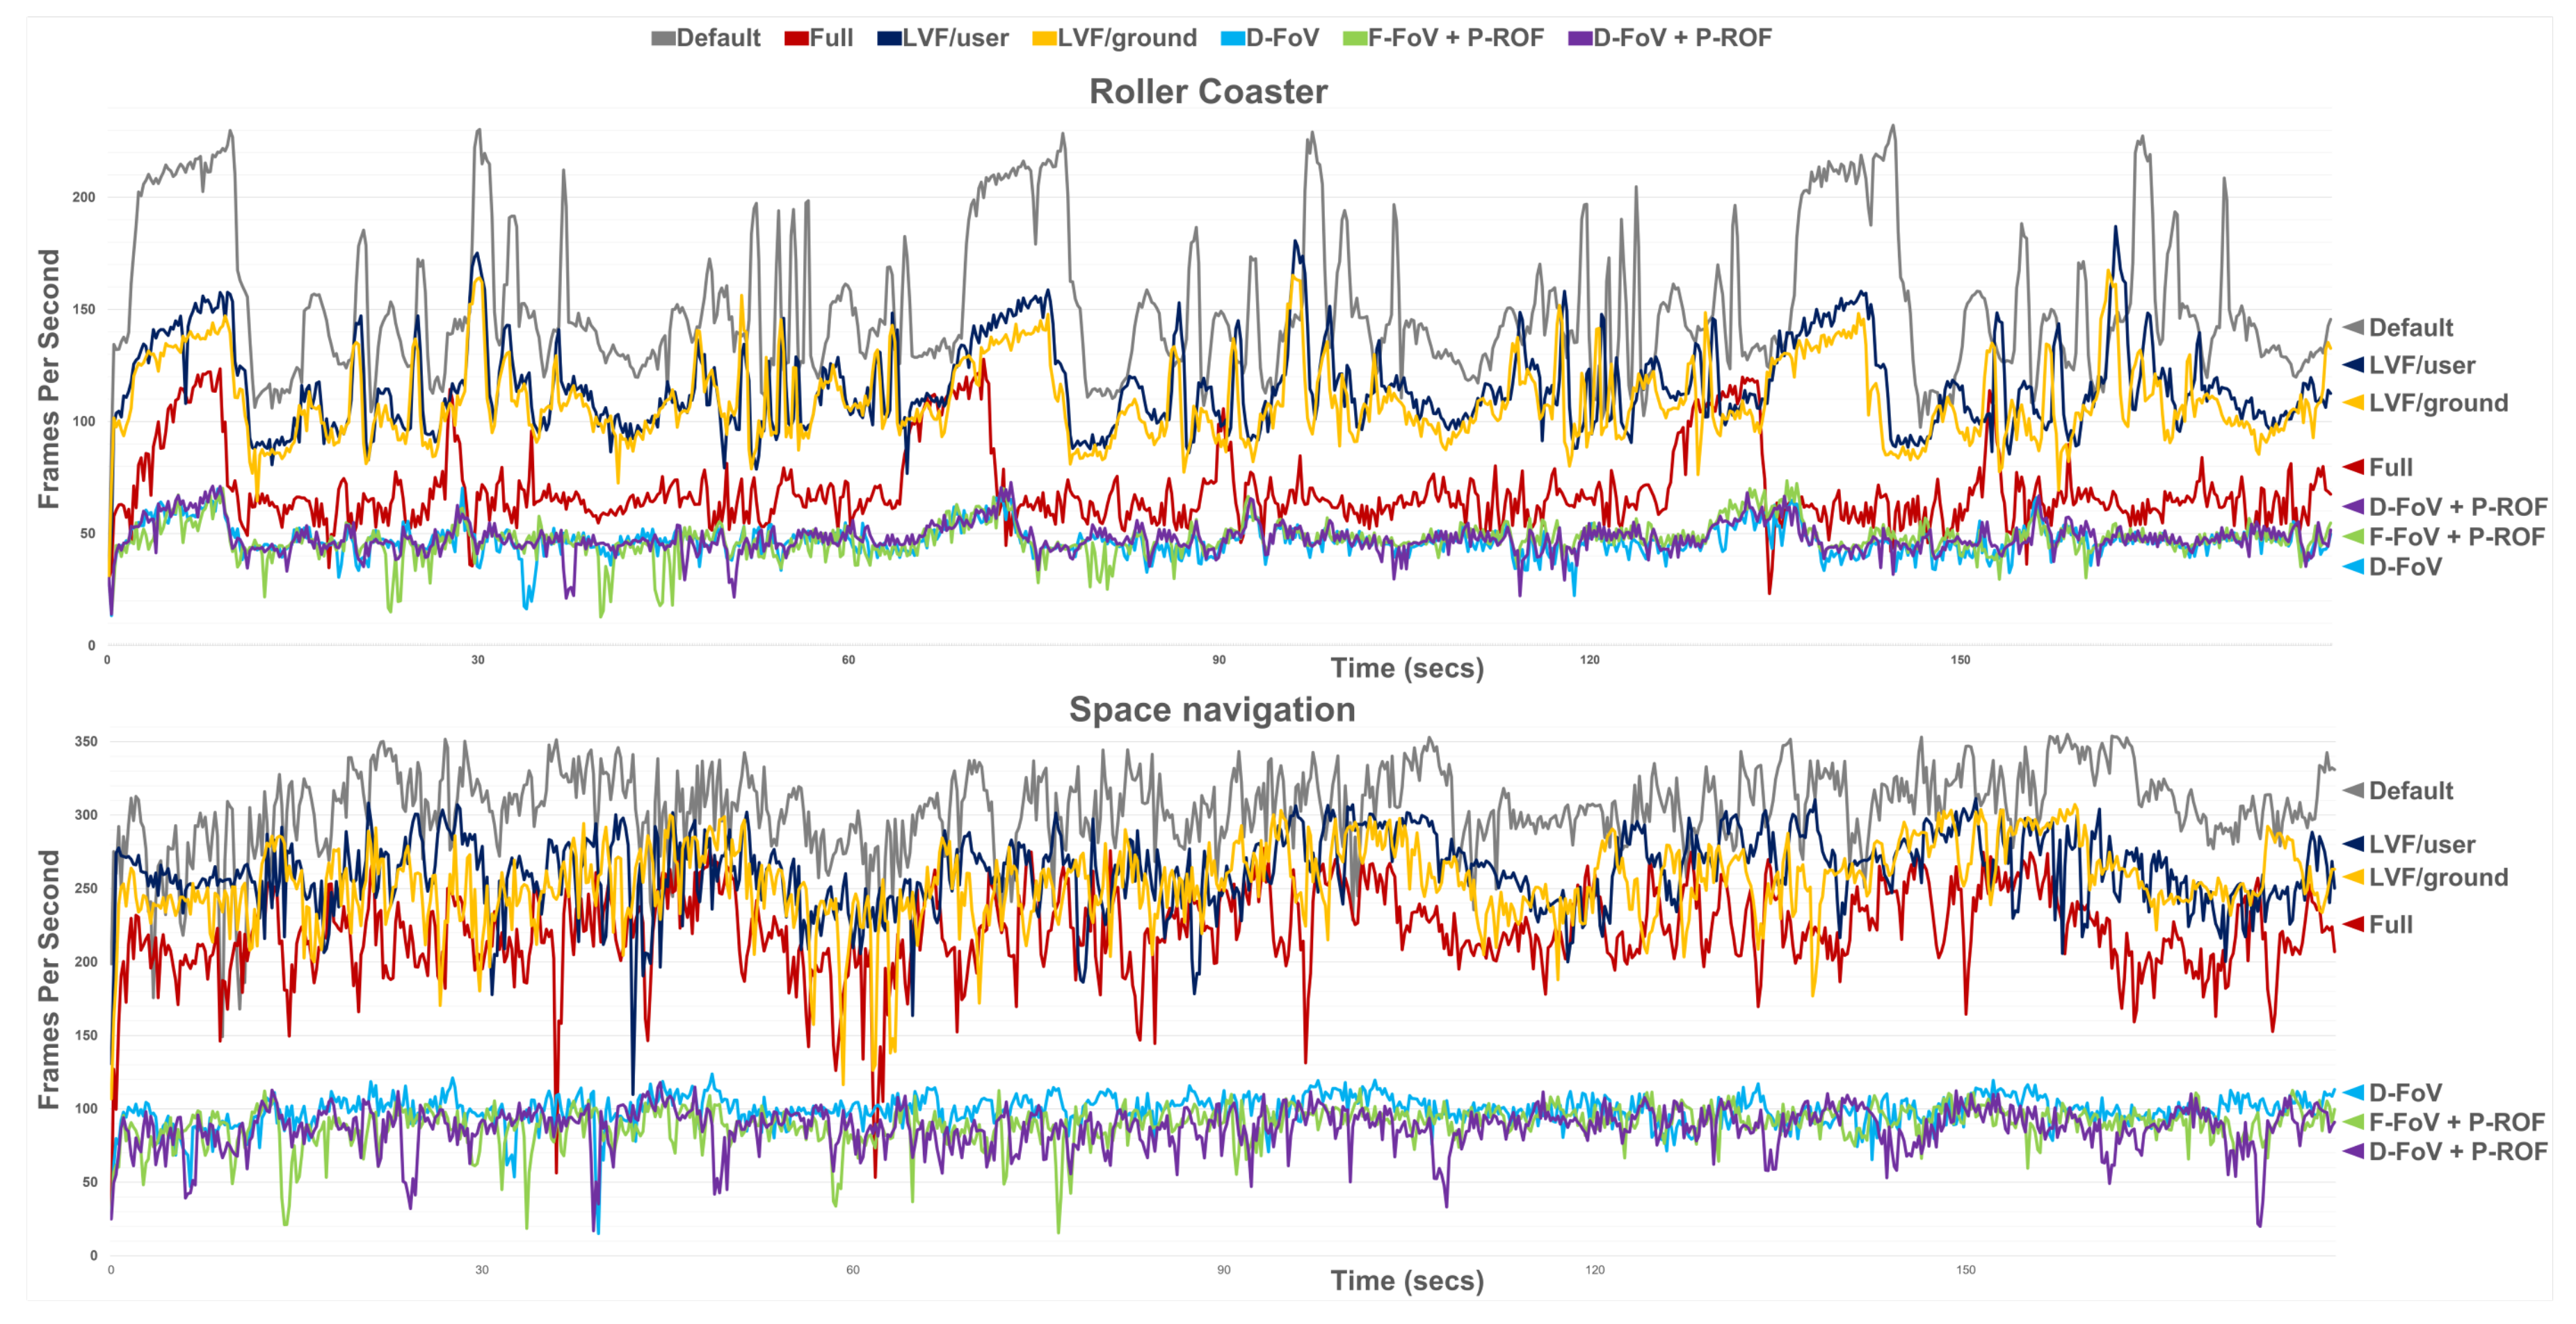
The participants completed the consent agreement form, received a briefing, and were informed of the purpose of the experiment and the experimental task. Before and after each test treatment, the participants filled out the SSQ [32] for the baseline measurement.
The participant sat on a chair (to avoid falling or losing balance due to possible sickness), and the administrator helped to correctly adjust the headset (Figure 4). The participants experienced eight different conditions in a balanced Latin square order. For each condition, the subject simply viewed the virtual space as automatically navigating a fixed path through a virtual space. The subject was allowed to explore and change his/her perspective.
To supplement the SSQ (an offline survey), we provided a handheld button for the user to indicate moments (by a simple press) at which he/she felt a severe level of sickness online during the test. The subject was allowed to stop and discontinue the experiment for any reason. Between treatment trials, the participant rested at least 10 min and/or until reaching a sickness level considered negligible and safe before moving on to the next treatment. The sickness level was assessed using the same SSQ, and a score of less than 30 was confirmed. The well-being and willingness of the participant were also confirmed. The total experiment lasted up to 3 h per participant.
After each treatment, the participants, as they rested, completed the SSQ again to record the after-effects. The subcategory scores were scaled by the weight factors, as indicated in [32]. The level of user-perceived presence/immersion was also measured to indicate the VR user experience, using the SUS Presence Questionnaire [29] and Igroup Presence Questionnaire (IPQ) [28]. See Appendix A for the details.
To assess the potential distraction factor, we instructed the users to report if they recalled any particular objects from the first content they viewed (pre-designated and planted beforehand). There were eight different objects: robot, Moon, Earth, container box, satellite, space station, space shuttle, and galaxy. After experiencing all treatments, the participants were interviewed informally regarding their preferences and self-reported degradation in presence/immersion. All survey questions were answered on a four-point Likert scale. This study was approved by the Institutional Review Board.

5.4. Results

The collected data were analyzed with the Shapiro–Wilk test Thus, normality was found for the space navigation conditions, but not for the roller coaster. Hence, one-way ANOVA was applied for the former and the non-parametric Kruskal–Wallis H test for the latter data at a 95% confidence level.
Figure 5 and Table 1 show the change (effect of the factor) in the sickness level (in categorical and total scores according to the SSQ) among the four different test conditions. For the roller coaster case (left graph), although a marginal trend of less sickness was observed (F-FoV > D-FoV > F-FoV+P-ROF > D-FoV+P-ROF), no statistically significant differences were found. As for the space navigation, several statistically significant results were found, as indicated in the right-hand graph. While the general trend was similar to the case of the roller coaster ride, F-FoV+P-ROF showed a clear difference from the default/baseline F-FoV, but there were no significant differences compared with that of the other conditions. Detailed statistical figures (Tukey HSD analysis) are presented in Table 2.
A similar trend was found with the sickness data collected online with the handheld button. Figure 6 shows the total number of times the participants pressed the “severe sickness” button along the navigation path for the eight test conditions. Relatively higher occurrences of severe sickness were clearly observed with the F-FoV, but the three remaining conditions showed similar levels.
An equally important evaluation criterion was the effect on the user experience, for instance if the visual manipulation by the three non-default (F-FoV) interfaces caused any significant distraction or degraded the sense of immersion and presence. Figure 7 shows the Igroup and SUS Presence Questionnaire results. No marked differences were observed in the statistical analysis. In the object recall test, participants recalled the most in the F-FoV+P-ROF condition: FFoV+ROF (5.1) > D-FoV(5) > F-FoV(4.5) > D-FoV+P-ROF(4). However, no statistically significant differences were found.

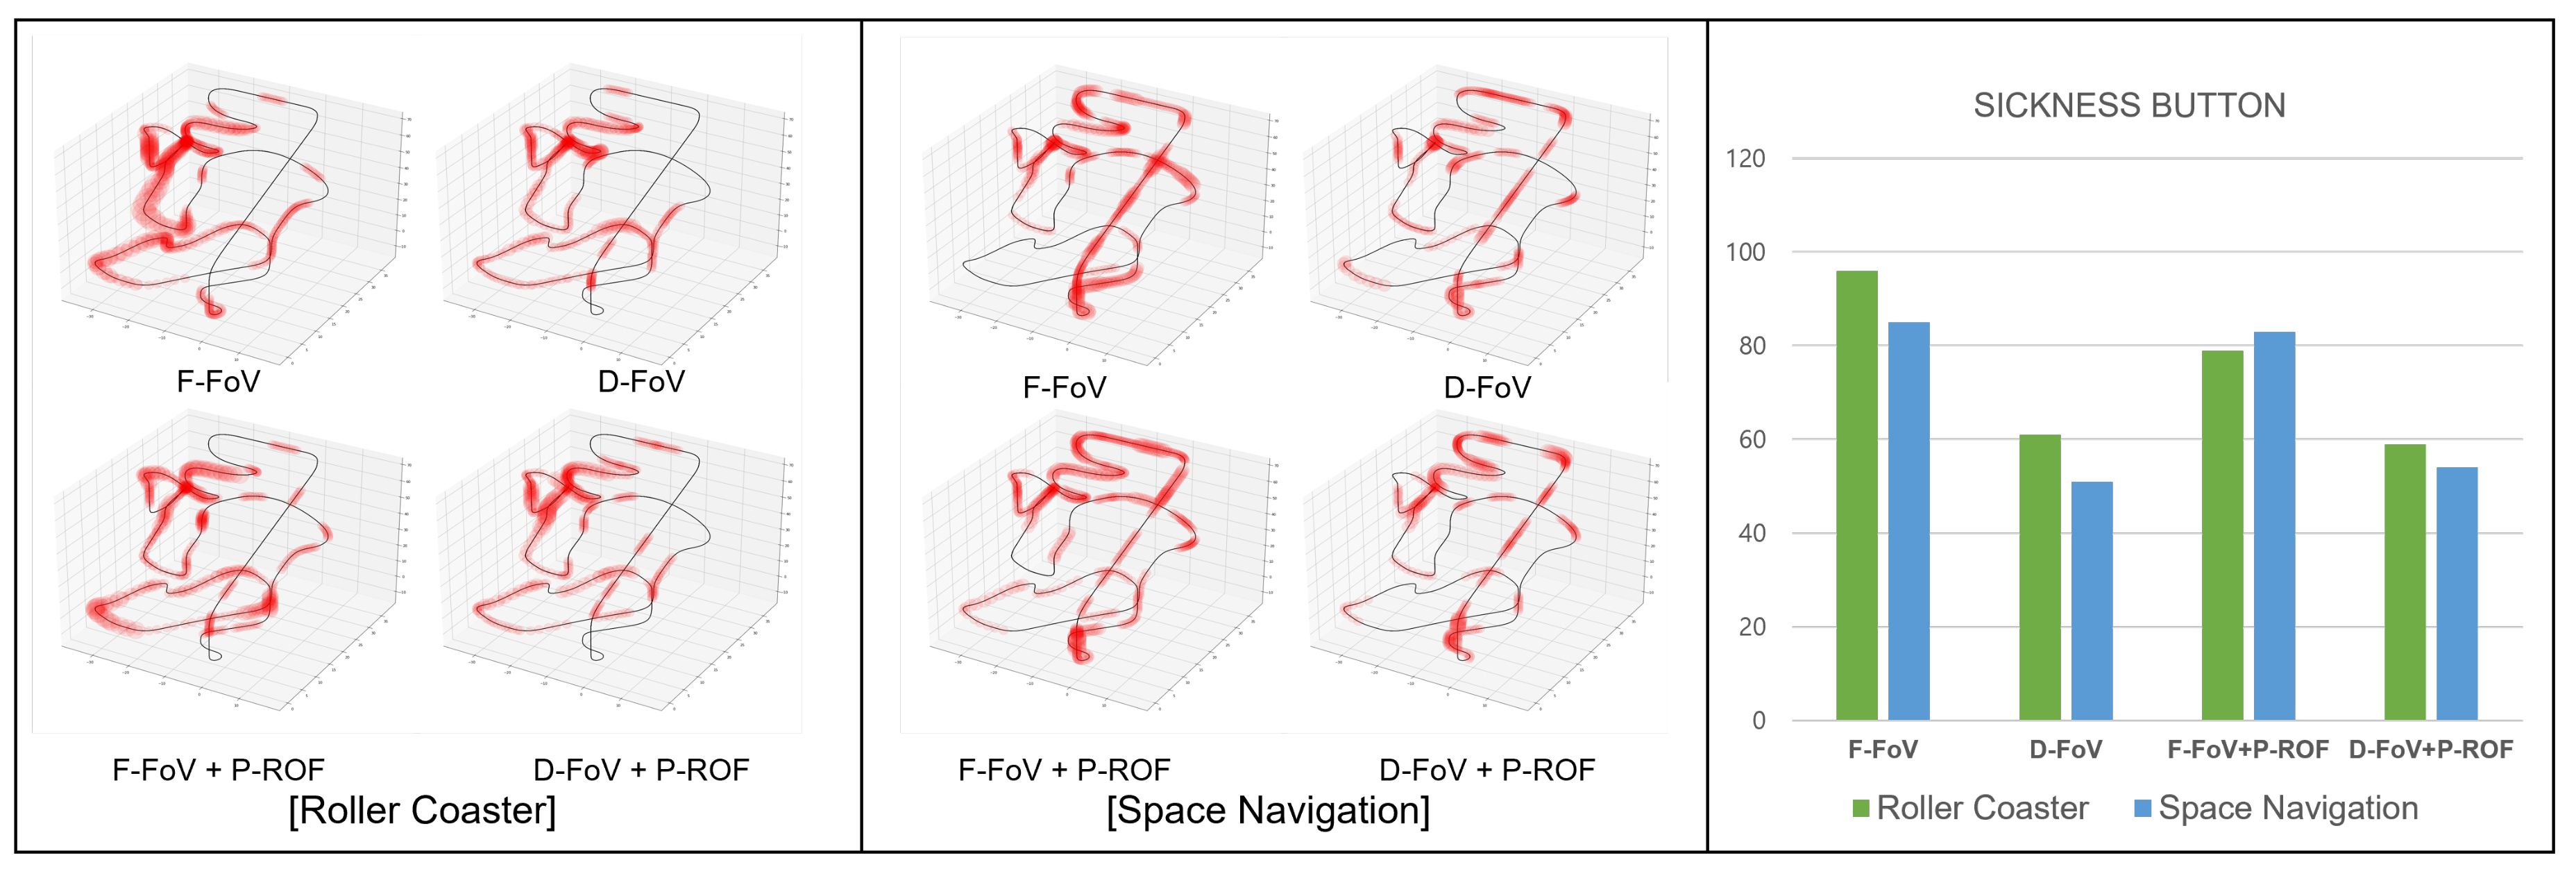
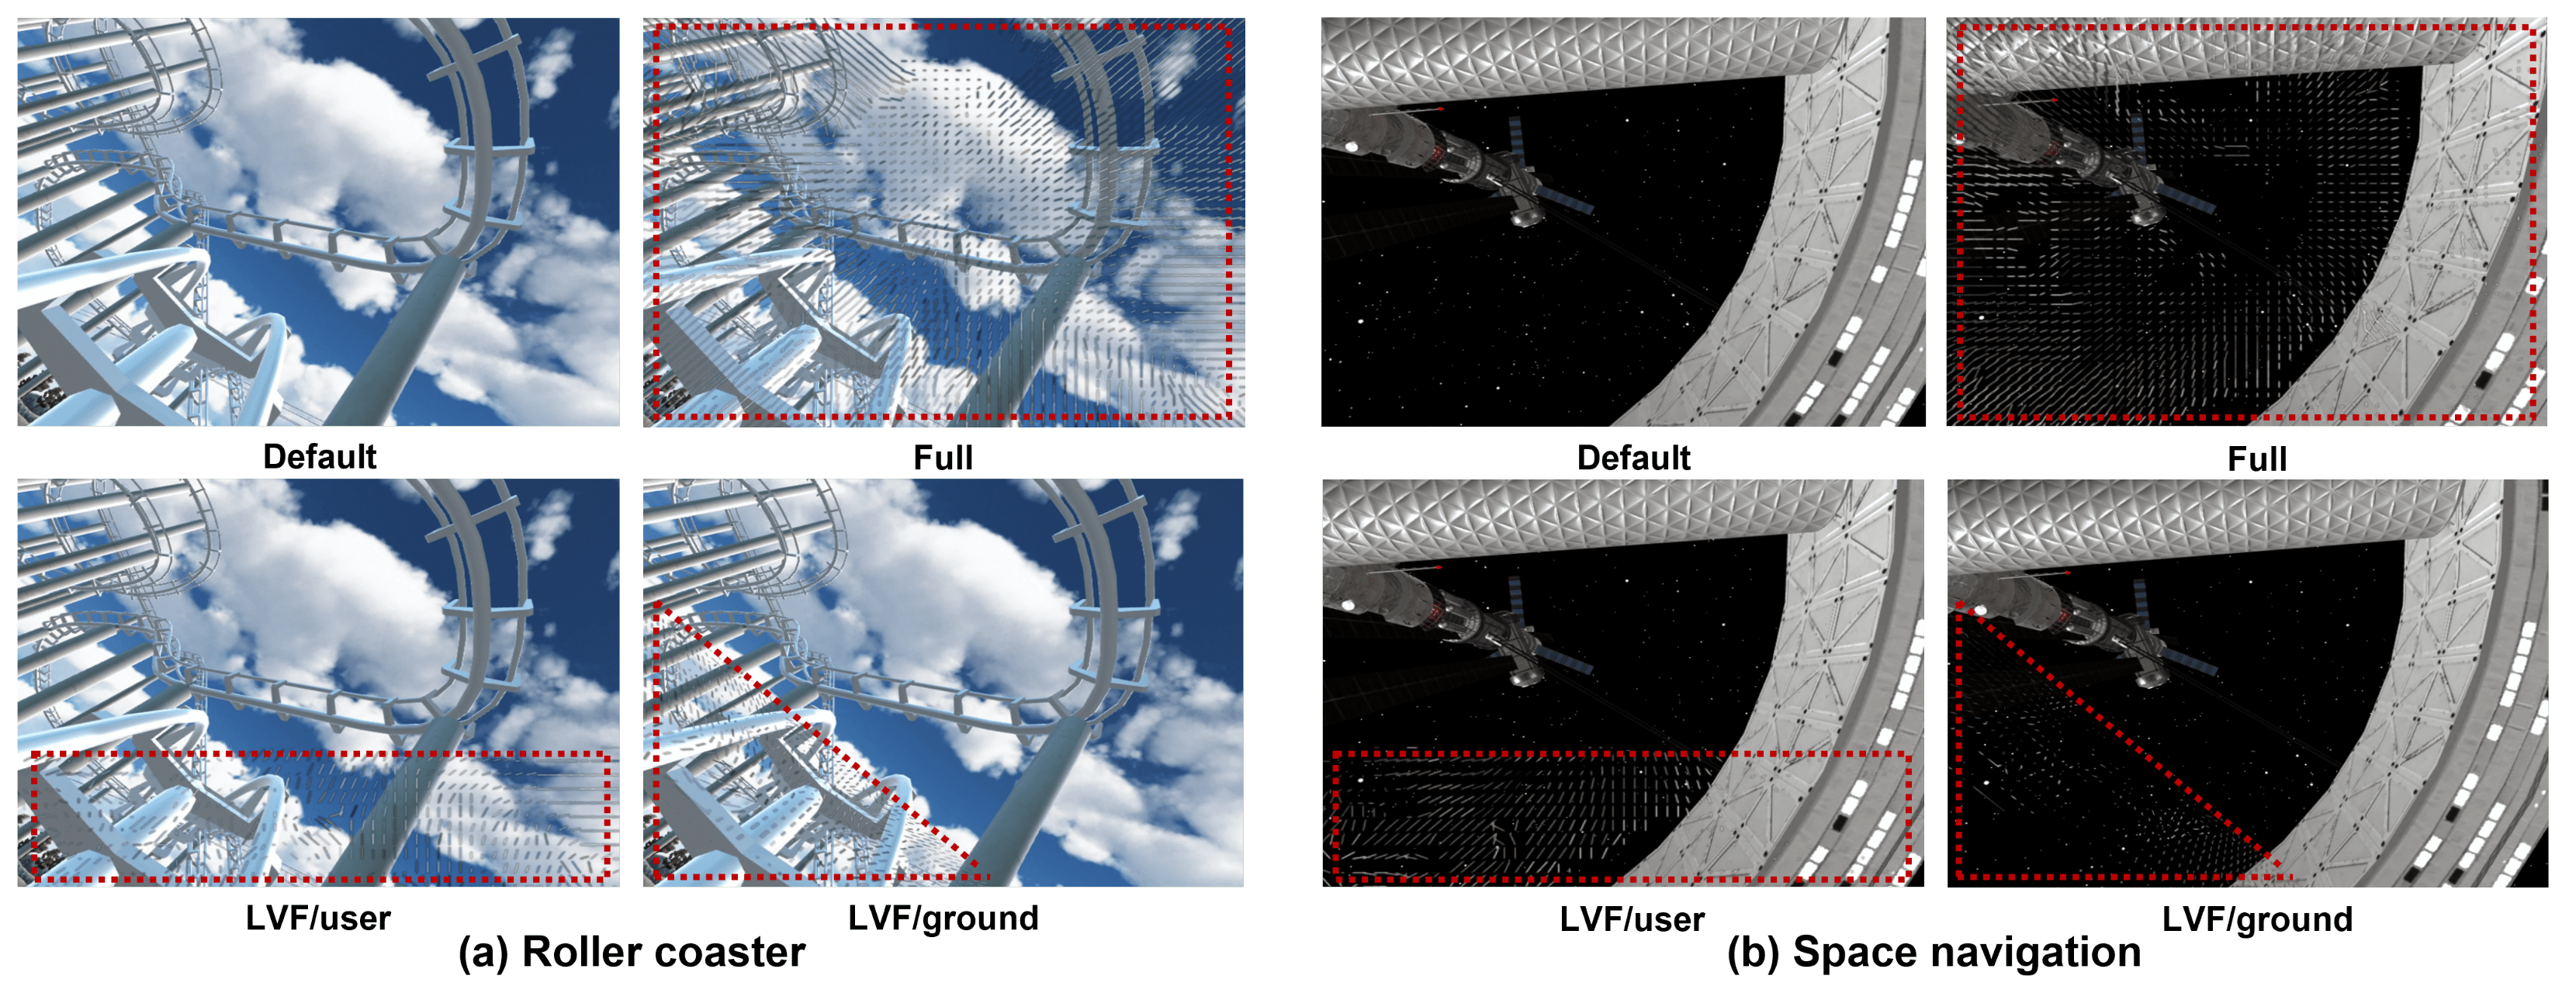
6. Supplement Experiment: Restricting Reverse Optical Flow Only to Low Visual Field

Visualizing the reverse optical flow in the periphery with dynamic adjustment of its extent demonstrated potential, yet the computational load and content intrusion can be minimized by restricting the visualization to the LVF. The literature review presented evidence suggesting that a reduction in the reverse mixed flow of less than half can lead to a significant reduction in sickness. Moreover, extracting features, computing for the optical flow, and generating the overlay textures can be computationally expensive, in particular for future applications on lighter platforms, such as mobile VR. We conducted a supplementary experiment to assess this possibility by comparing four visualization conditions: (1) default: viewing the original content as is; (2) full: overlaying the reverse optical flow over the entire screen space; (3) LVR/user: overlaying the reverse optical flow only in the bottom third of the screen space, but with respect to the user orientation; (4) LVR/ground: overlaying the reverse optical flow only in the bottom third of the screen space, but with respect to the direction of gravity (Figure 8).
The experiment was conducted in a similar manner to the main experiment and likewise measured the dependent variables, namely the levels of the SSQ scores (after viewing the respective conditions) and the user-felt immersion/presence (IPQ score). Ten individuals (four males and six females, mean = 24/SD = 3.46) participated in the experiment, and the same two roller coaster and space navigation contents were used. We omit further details.
The results are illustrated in Figure 9. Statistically significant effects could not be observed for either dependent variables in this limited experiment (only one content and fewer participants). Nevertheless, there was an observed trend of sickness reduction with LVF reverse optical flow (both LVF/user and LVF/ground) compared to that of the default case, but slightly less than that in the full reverse optical flow condition. No clear subjective trend was observed in terms of immersion/presence, with the exception of the full condition, which appeared to reduce user experience, and the LVF/ground condition, which appeared to enhance it slightly.

7. Discussion and Conclusions

We presented an extension/improvement to countervection flow visualization to reduce the level of VR sickness by using low-resolution reverse optical flow in the visual periphery. The comparison to the original moving striped bar patterns showed positive results, further improving the intended effect. We combined this approach with the previously validated idea of dynamically adjusting the FoV (or equally adjusting the periphery), wherein we added the reverse optical flow visualization. The validation experiment and post briefings with the participants confirmed significant sickness reduction for D-FoV+P-RoF compared to that for the F-FoV and dynamic FoV only (D-FoV) conditions. While no statistically significant differences were found with regard to the sense of presence and immersion, the non-default test conditions exhibited a decreasing trend.
Aside from the content intrusion and its detrimental effects on the immersive user experience, another factor to consider is the computational cost. The reverse optical flow requires the extraction of visual features, the estimation of their optical flow, and the creation of texture to be overlaid on the original imagery. The feature density and coverage of the screen space, as well as the accuracy of the optical flow algorithm can affect the real-time interactivity of the system. Figure 10 shows the system performance in terms of the frames per second for seven different content deliveries presented and tested in this study: (1) default: original content without any provision for sickness and with the full FoV; (2) full: overlaid with reverse optical flow over the entire full FoV; (3) D-FoV: FoV dynamically changed; (4) F-FoV+P-ROF: full FoV and reverse optical flow overlaid only in the periphery; (5) D-FoV+P-ROF: dynamically changed FoV and reverse optical flow overlaid only in the periphery; (6) LVF/user: reverse optical flow overlaid only in the lower visual field with respect to the user; (7) LVF/ground: reverse optical flow overlaid only in the lower visual field with respect to the ground. The data showed that the performance was the best in the order of: default > LVF/user, LVF/ground, > full > D-FoV, D-FoV+P-ROF, and F-FoV+P-ROF. We can readily see that different methods offered different advantages in terms of the extent of the sickness reduction effect, content intrusion, and computational cost. Notably, the frame rates for D-FoV, D-FoV+P-ROF, and F-FoV+P-ROF occasionally decreased to values in the range of 20. However, the average frame rates remained significantly above 50 for all conditions, as they were run on a high-end PC. For lighter platforms such as the mobile platform, the computational cost must be weighed to benefit appropriately as latency is another source of sickness [1].
Interviews with the participants revealed that many of them felt considerable glare from the reverse optical flow visualization, in particular for the space navigation content. Here, the background was mostly black with only relatively small speckles of objects (such as distant planets and stars), which made the white line segments (of the reverse optical flow) exhibit significant contrast (to the background) and glare. We intend to explore different and more flexible visualization to mitigate such effects.
In this study, the implementation of the dynamic adjustment of FoV (or periphery) only considered the use of linear velocity. As rotation is also a significant factor in eliciting VR sickness, it must be added to the combined model to strengthen the reduction effect. In fact, many more system parameters must be optimized or adjusted to maximize the sickness reduction effect. This remains another avenue for future work.
New approaches have been developed for VR sickness prediction [34,35,36,37] and for mitigation methods. While a single individual method may not suffice in eliminating VR sickness sufficiently, multiple approaches when integrated and applied in accordance with the required application conditions can perform better as their combined effects can be strengthened and VR contents can be consumed more safely.

Author Contributions

Conceptualization, S.K. and G.J.K.; methodology, S.K. and G.J.K.; software, S.K.; validation, S.K. and G.J.K.; formal analysis, S.K.; investigation, S.K. and G.J.K.; resources, G.J.K.; data curation, S.K.; writing—original draft preparation, S.K. and G.J.K.; writing—review and editing, G.J.K.; visualization, S.K.; supervision, G.J.K.; project administration, G.J.K.; funding acquisition, G.J.K. All authors have read and agreed to the published version of the manuscript.

Funding

This research was supported by the ITRC Program (IITP-2022-RS-2022-00156354) funded by MSIT/IITP Korea, the Competency Development Program for Industry Specialist funded by MSIT/IITP/MOTIE/KIAT Korea (N0009999), and the Basic Research Laboratory Program funded by NRF Korea (2022R1A4A1018869).

Institutional Review Board Statement

The study was conducted in accordance with the Declaration of Helsinki and approved by the Institutional Review Board of Korea University (KUIRB 2022-0270-01, approved on 30 August 2022).

Informed Consent Statement

Informed consent was obtained from all participants involved in the study.

Data Availability Statement

Subject experimental data are unavailable due to privacy or ethical restrictions (they can be made available under special circumstances).

Conflicts of Interest

The authors declare no conflict of interest.

Abbreviations

VRVirtual reality
FoVField of view
SSQSimulation sickness questionnaire
CVCountervection
ROReverse optical flow
F-FoVFull FoV
D-FoVDynamic FoV
P-ROFPeripheral reverse optical flow
USDUS Dollar
IPQIgroup Presence Questionnaire
SUSSlater, Usoh, and Steed

Appendix A

Table A1. Igroup Presence Questionnaire.
Igroup Presence Questionnaire (IPQ)
01.In the computer generated world I had a sense of “being there”. 1 (not at all) 7 (very much)
02.Somehow I felt that the virtual world surrounded me. 1 (fully disagree) 7 (fully agree)
03.I felt like I was just perceiving pictures. 1 (fully disagree) 7 (fully agree)
04.I did not feel present in the virtual space. 1 (did not feel) 7 (felt present)
05.I had a sense of acting in the virtual space, rather than operating
something from outside.
1 (fully disagree) 7 (fully agree)
06.I felt present in the virtual space. 1 (fully disagree) 7 (fully agree)
07.How aware were you of the real world surrounding while
navigating in the virtual world?
(i.e., sounds, room temperature, other people, etc.)?
1 (extremely aware)7 (not aware at all)
08.I was not aware of my real environment. 1 (fully disagree) 7 (fully agree)
09.I still paid attention to the real environment. 1 (fully disagree) 7 (fully agree)
10.I was completely captivated by the virtual world. 1 (fully disagree) 7 (fully agree)
11.How real did the virtual world seem to you?1 (completely real)7 (not real at all)
12.How much did your experience in the virtual environment seem
consistent with your real world experience?
1 (not consistent)7 (very consistent)
13.How real did the virtual world seem to you?1 (about as real as
an imagined world)
7 (indistinguishable
from the real world)
14.The virtual world seemed more realistic than the real world. 0 (fully disagree) 3 (fully agree)
Table A2. Slater–Usoh–Steed Questionnaire.
Slater–Usoh–Steed Questionnaire (SUS)
01.I had a sense of “being there” in the virtual environment 1 (Not at all) 7 (Very much)
02.There were times during the experience when the virtual
environment was the reality for me...
1 (At no time) 7 (Almost all the time)
03.The virtual environment seems to me to be more like... 1 (Images that I saw) 7 (Somewhere that I
visited)
04.I had a stronger sense of... 1 (Being elsewhere) 7 (Being in the virtual
environment)
05.I think of the virtual environment as a place in a way similar
to other places that I’ve been today...
1 (Not at all) 7 (Very much so)
06.During the experience I often thought that I was really
standing in the virtual environment...
1 (Not very often) 7 (Very much so)

References

  1. LaViola, J., Jr. A discussion of cybersickness in virtual environments. ACM Sigchi Bull. 2000, 32, 47–56. [Google Scholar]
  2. Xiao, R.; Benko, H. Augmenting the field-of-view of head-mounted displays with sparse peripheral displays. In Proceedings of the 2016 CHI Conference on Human Factors in Computing Systems, San Jose, CA, USA, 7–12 May 2016; pp. 1221–1232. [Google Scholar]
  3. Park, S.H.; Han, B.; Kim, G.J. Mixing in reverse optical flow to mitigate vection and simulation sickness in virtual reality. In Proceedings of the CHI Conference on Human Factors in Computing Systems, New Orleans, LA, USA, 29 April–5 May 2022; pp. 1–11. [Google Scholar]
  4. Fernandes, A.S.; Feiner, S.K. Combating VR sickness through subtle dynamic field-of-view modification. In Proceedings of the 2016 IEEE Symposium on 3D User Interfaces (3DUI), Greenville, SC, USA, 19–20 March 2016; pp. 201–210. [Google Scholar]
  5. Jones, J.A.; Swan II, J.E.; Bolas, M. Peripheral stimulation and its effect on perceived spatial scale in virtual environments. IEEE Trans. Vis. Comput. Graph. 2013, 19, 701–710. [Google Scholar] [CrossRef]
  6. Telford, L.; Frost, B. Factors affecting the onset and magnitude of linear vection. Percept. Psychophys. 1993, 53, 682–692. [Google Scholar] [CrossRef]
  7. Sato, T.; Seno, T.; Kanaya, H.; Hukazawa, H. The ground is more effective than the sky—The comparison of the ground and the sky in effectiveness for vection. In Proceedings of the ASIAGRAPH 2007, Shanghai, China, 15–17 November 2007; pp. 103–108. [Google Scholar]
  8. Budhiraja, P.; Miller, M.R.; Modi, A.K.; Forsyth, D. Rotation blurring: Use of artificial blurring to reduce cybersickness in virtual reality first person shooters. arXiv 2017, arXiv:1710.02599. [Google Scholar]
  9. Wienrich, C.; Weidner, C.K.; Schatto, C.; Obremski, D.; Israel, J.H. A virtual nose as a rest-frame-the impact on simulator sickness and game experience. In Proceedings of the 2018 10th International Conference on Virtual Worlds and Games for Serious Applications (VS-Games), Würzburg, Germany, 5–7 September 2018; pp. 1–8. [Google Scholar]
  10. Cao, Z. The Effect of Rest Frames on Simulator Sickness Reduction. Ph.D. Thesis, Duke University, Durham, NC, USA, 2017. [Google Scholar]
  11. Gibson, J.J. The Perception of the Visual World; Houghton Mifflin: Boston, MA, USA, 1950. [Google Scholar]
  12. Fujii, Y.; Seno, T. The effect of optical flow motion direction on vection strength. i-Perception 2020, 11, 2041669519899108. [Google Scholar]
  13. Fujimoto, K.; Ashida, H. Roles of the Retinotopic and Environmental Frames of Reference on Vection. Front. Virtual Real. 2020, 1, 581920. [Google Scholar]
  14. D’Avossa, G.; Kersten, D. Evidence in Human Subjects for Independent Coding of Azimuth and Elevation for Direction of Heading from Optic Flow. Vis. Res. 1996, 36, 2915–2924. [Google Scholar]
  15. Carrasco, M.W.P.; Yeshurun, Y. Covert attention increases spatial resolution with or without masks: Support for signal enhancement. J. Vis. 2002, 2, 4. [Google Scholar] [CrossRef]
  16. Zito, G.A.; Cazzoli, D.; Müri, R.M.; Mosimann, U.P.; Nef, T. Behavioral Differences in the Upper and Lower Visual Hemifields in Shape and Motion Perception. Front. Behav. Neurosci. 2016, 10, 128. [Google Scholar]
  17. Amenedo, E.; Pazo-Alvarez, P.; Cadaveira, F. Vertical asymmetries in pre-attentive detection of changes in motion direction. Int. J. Psychophysiol. 2007, 64, 184–189. [Google Scholar]
  18. Previc, F. Functional specialization in the lower and upper visual fields in humans: Its ecological origins and neurophysiological implications. Behav. Brain Sci. 1990, 13, 519–542. [Google Scholar] [CrossRef]
  19. Hemmerich, W.; Keshavarz, B.; Hecht, H. Visually induced motion sickness on the horizon. Front. Virtual Real. 2020, 1, 582095. [Google Scholar]
  20. Wilkinson, M.; Brantley, S.; Feng, J. A Mini Review of Presence and Immersion in Virtual Reality. Proc. Hum. Factors Ergon. Soc. Annu. Meet. 2021, 65, 1099–1103. [Google Scholar] [CrossRef]
  21. Heeter, C. Being There: The Subjective Experience of Presence. Presence Teleoperators Virtual Environ. 1992, 2, 262–271. [Google Scholar]
  22. Azarby, S.; Rice, A. Understanding the Effects of Virtual Reality System Usage on Spatial Perception: The Potential Impacts of Immersive Virtual Reality on Spatial Design Decisions. Sustainability 2022, 14, 10326. [Google Scholar] [CrossRef]
  23. Slater, M. Measuring Presence: A Response to the Witmer and Singer Presence Questionnaire. Presence 1999, 8, 560–565. [Google Scholar]
  24. Witmer, B.G.; Singer, M.J. Measuring Presence in Virtual Environments: A Presence Questionnaire. Presence 1998, 7, 225–240. [Google Scholar] [CrossRef]
  25. Berkman, M.I.; Akan, E. Presence and Immersion in Virtual Reality. In Encyclopedia of Computer Graphics and Games; Lee, N., Ed.; Springer International Publishing: Cham, Switzerland, 2019; pp. 1–10. [Google Scholar]
  26. Hvass, J.; Larsen, O.; Vendelbo, K.; Nilsson, N.; Nordahl, R.; Serafin, S. Visual realism and presence in a virtual reality game. In Proceedings of the 2017 3DTV Conference: The True Vision—Capture, Transmission and Display of 3D Video (3DTV-CON), Copenhagen, Denmark, 7–9 June 2017; pp. 1–4. [Google Scholar]
  27. Lin, J.W.; Duh, H.; Parker, D.; Abi-Rached, H.; Furness, T. Effects of field of view on presence, enjoyment, memory, and simulator sickness in a virtual environment. In Proceedings of the Proceedings IEEE Virtual Reality 2002, Orlando, FL, USA, 24–28 March 2002; pp. 164–171. [Google Scholar]
  28. Schubert, T.; Friedmann, F.; Regenbrecht, H. The experience of presence: Factor analytic insights. Presence Teleoperators Virtual Environ. 2001, 10, 266–281. [Google Scholar] [CrossRef]
  29. Usoh, M.; Catena, E.; Arman, S.; Slater, M. Using presence questionnaires in reality. Presence 2000, 9, 497–503. [Google Scholar] [CrossRef]
  30. Unity. 2022. Available online: https://unity.com (accessed on 5 February 2023).
  31. Lucas, B.D.; Kanade, T. An iterative image registration technique with an application to stereo vision. In Proceedings of the IJCAI’81: 7th International Joint Conference on Artificial Intelligence, Vancouver, BC, Canada, 24–28 August 1981; Volume 81. [Google Scholar]
  32. Kennedy, R.S.; Lane, N.E.; Berbaum, K.S.; Lilienthal, M.G. Simulator sickness questionnaire: An enhanced method for quantifying simulator sickness. Int. J. Aviat. Psychol. 1993, 3, 203–220. [Google Scholar]
  33. Golding, J.F. Motion sickness susceptibility questionnaire revised and its relationship to other forms of sickness. Brain Res. Bull. 1998, 47, 507–516. [Google Scholar] [CrossRef]
  34. Kim, W.; Lee, S.; Bovik, A.C. VR sickness versus VR presence: A statistical prediction model. IEEE Trans. Image Process. 2020, 30, 559–571. [Google Scholar] [CrossRef]
  35. Wang, Y.; Chardonnet, J.R.; Merienne, F. VR sickness prediction for navigation in immersive virtual environments using a deep long short term memory model. In Proceedings of the 2019 IEEE Conference on Virtual Reality and 3D User Interfaces (VR), Osaka, Japan, 23–27 March 2019; pp. 1874–1881. [Google Scholar]
  36. Hell, S.; Argyriou, V. Machine learning architectures to predict motion sickness using a virtual reality rollercoaster simulation tool. In Proceedings of the 2018 IEEE International Conference on Artificial Intelligence and Virtual Reality (AIVR), Taichung, Taiwan, 10–12 December 2018; pp. 153–156. [Google Scholar]
  37. Islam, R.; Desai, K.; Quarles, J. Cybersickness Prediction from Integrated HMD’s Sensors: A Multimodal Deep Fusion Approach using Eye-tracking and Head-tracking Data. In Proceedings of the 2021 IEEE International Symposium on Mixed and Augmented Reality (ISMAR), Bari, Italy, 4–8 October 2021; pp. 31–40. [Google Scholar]
Figure 1. Test conditions CV and RO in the pilot experiment and how they were seen by the users through the headset: Top: CV—the visual field in the periphery is drawn with the low-resolution projection of the rotating striped bars, as in [2]; bottom: RO—the visual field in the periphery is drawn with the low-resolution projection of the reverse optical flow, as in [3].
Electronics 12 00861 g001
Figure 2. Four test conditions for assessing the effect of dynamically adjusted peripheral visualization of reverse optical flow for VR sickness reduction for the two test contents: (a) roller coaster and (b) space navigation. For each content, from top left, counterclockwise: full FoV, dynamic FoV [4], full FoV + peripheral reverse optical flow [3], and dynamic FoV + peripheral reverse optical flow. The dashed/solid lines indicate the peripheral boundary, and the arrows indicate the dynamic adjustment of the FOV/periphery.
Electronics 12 00861 g002
Figure 3. Comparisons of the “after” levels of simulation sickness by the SSQ in the three sickness categories and the total. A clear trend is seen where, in the none condition, the sickness was the highest, which was reduced by the countervection striped bar visualization (CV) and further by the reverse flow visualization (RO).
Electronics 12 00861 g003
Figure 4. Snapshot of the subject experiencing the test condition.
Electronics 12 00861 g004
Figure 5. After sickness level as categorically assessed by the SSQ for two test contents—a roller coaster ride (left) and space navigation (right). A general trend of sickness reduction was found with the three conditions against the baseline (F-FoV), in particular in the space navigation case (statistically significant difference between F-FoV and F-FoV+P-ROF). However, there was no clear winner among the three. */** indicate statistically significant differences.
Electronics 12 00861 g005
Figure 6. Visualization of the total occurrences of “severe sickness” button pressed during the navigation—roller coaster ride (far left) and space navigation (middle)—among the four test conditions. D-FoV, F-FoV+P-ROF, and D-Fov+P-ROF all showed fewer button presses than the baseline F-FoV, but a clear winner was not identified.
Electronics 12 00861 g006
Figure 7. Effects on VR user experience (presence/immersion) using the IPQ and SUS questionnaires: roller coaster (top) and space navigation (bottom).
Electronics 12 00861 g007
Figure 8. Scenes from the respective four conditions compared in the supplementary experiment: roller coaster (left) and space navigation (right). From left, default, full, LVR/user, and LVR/ground).
Electronics 12 00861 g008
Figure 9. Results of the supplementary experiment with regard to the levels of VR sickness (SSQ score) and user-felt immersion/presence (IPQ score).
Electronics 12 00861 g009
Figure 10. System performance of various sickness reduction methods: (1) default: original content without any provision for sickness and with full FoV; (2) full: overlaid with reverse optical flow over the entire full FoV; (3) D-FoV: FoV dynamically changed; (4) F-FoV+PROF: full FoV and reverse optical flow overlaid only in the periphery; (5) D-FoV+P-ROF: dynamically changed FoV and reverse optical flow overlaid only in the periphery; (6) LVF/user: reverse optical flow overlaid only in the lower visual field with respect to the user; (7) LVF/ground: reverse optical flow overlaid only in the lower visual field with respect to the ground. The data showed that the performance was the best in the order of: default > LVF/user, LVF/ground > Full > D-FoV, D-FoV+P-ROF, F-FoV+P-ROF.
Electronics 12 00861 g010
Table 1. ANOVA results with regard to effects on sickness reduction for the two test contents: p-value (f-value); * indicates statistically significant differences.
Roller CoasterSpace Navigation
Nausea0.7292 (0.4338) 0.0007 (6.129) *
Oculomotor0.6313 (0.5773) 0.0047 (4.6028) *
Disorientation0.9326 (0.1449) 0.0146 (3.6903) *
Total0.7874 (0.3524) 0.0307 (3.0945) *
Table 2. Results of the Tukey HSD for the four test conditions. * marks a statistically significant difference (N, nausea; O, oculomotor; D, disorientation; T, total).
Roller CoasterSpace Navigation
NODTNODT
F-FoVD-FoV0.77660.64580.89990.74580.8930.89990.89990.8999
F-FoVF-FoV + P-ROF0.84880.89990.89990.89990.0010 *0.0052 *0.0135 *0.0317 *
F-FoVD-FoV + P-ROF0.70450.81770.89990.84930.16530.26310.26940.4081
D-FoVF-FoV + P-ROF0.89990.74890.89990.89990.0080 *0.0265 *0.08130.0997
D-FoVD-FoV + P-ROF0.89990.89990.89990.89990.50860.5660.64630.6735
F-FoV + P-ROFD-FoV + P-ROF0.89990.89990.89990.89990.24240.39950.5720.5952
Disclaimer/Publisher’s Note: The statements, opinions and data contained in all publications are solely those of the individual author(s) and contributor(s) and not of MDPI and/or the editor(s). MDPI and/or the editor(s) disclaim responsibility for any injury to people or property resulting from any ideas, methods, instructions or products referred to in the content.

