
Remote Real-Time Optical Layers Performance Monitoring Using a Modern FPMT Technique Integrated with an EDFA Optical Amplifier

Abstract
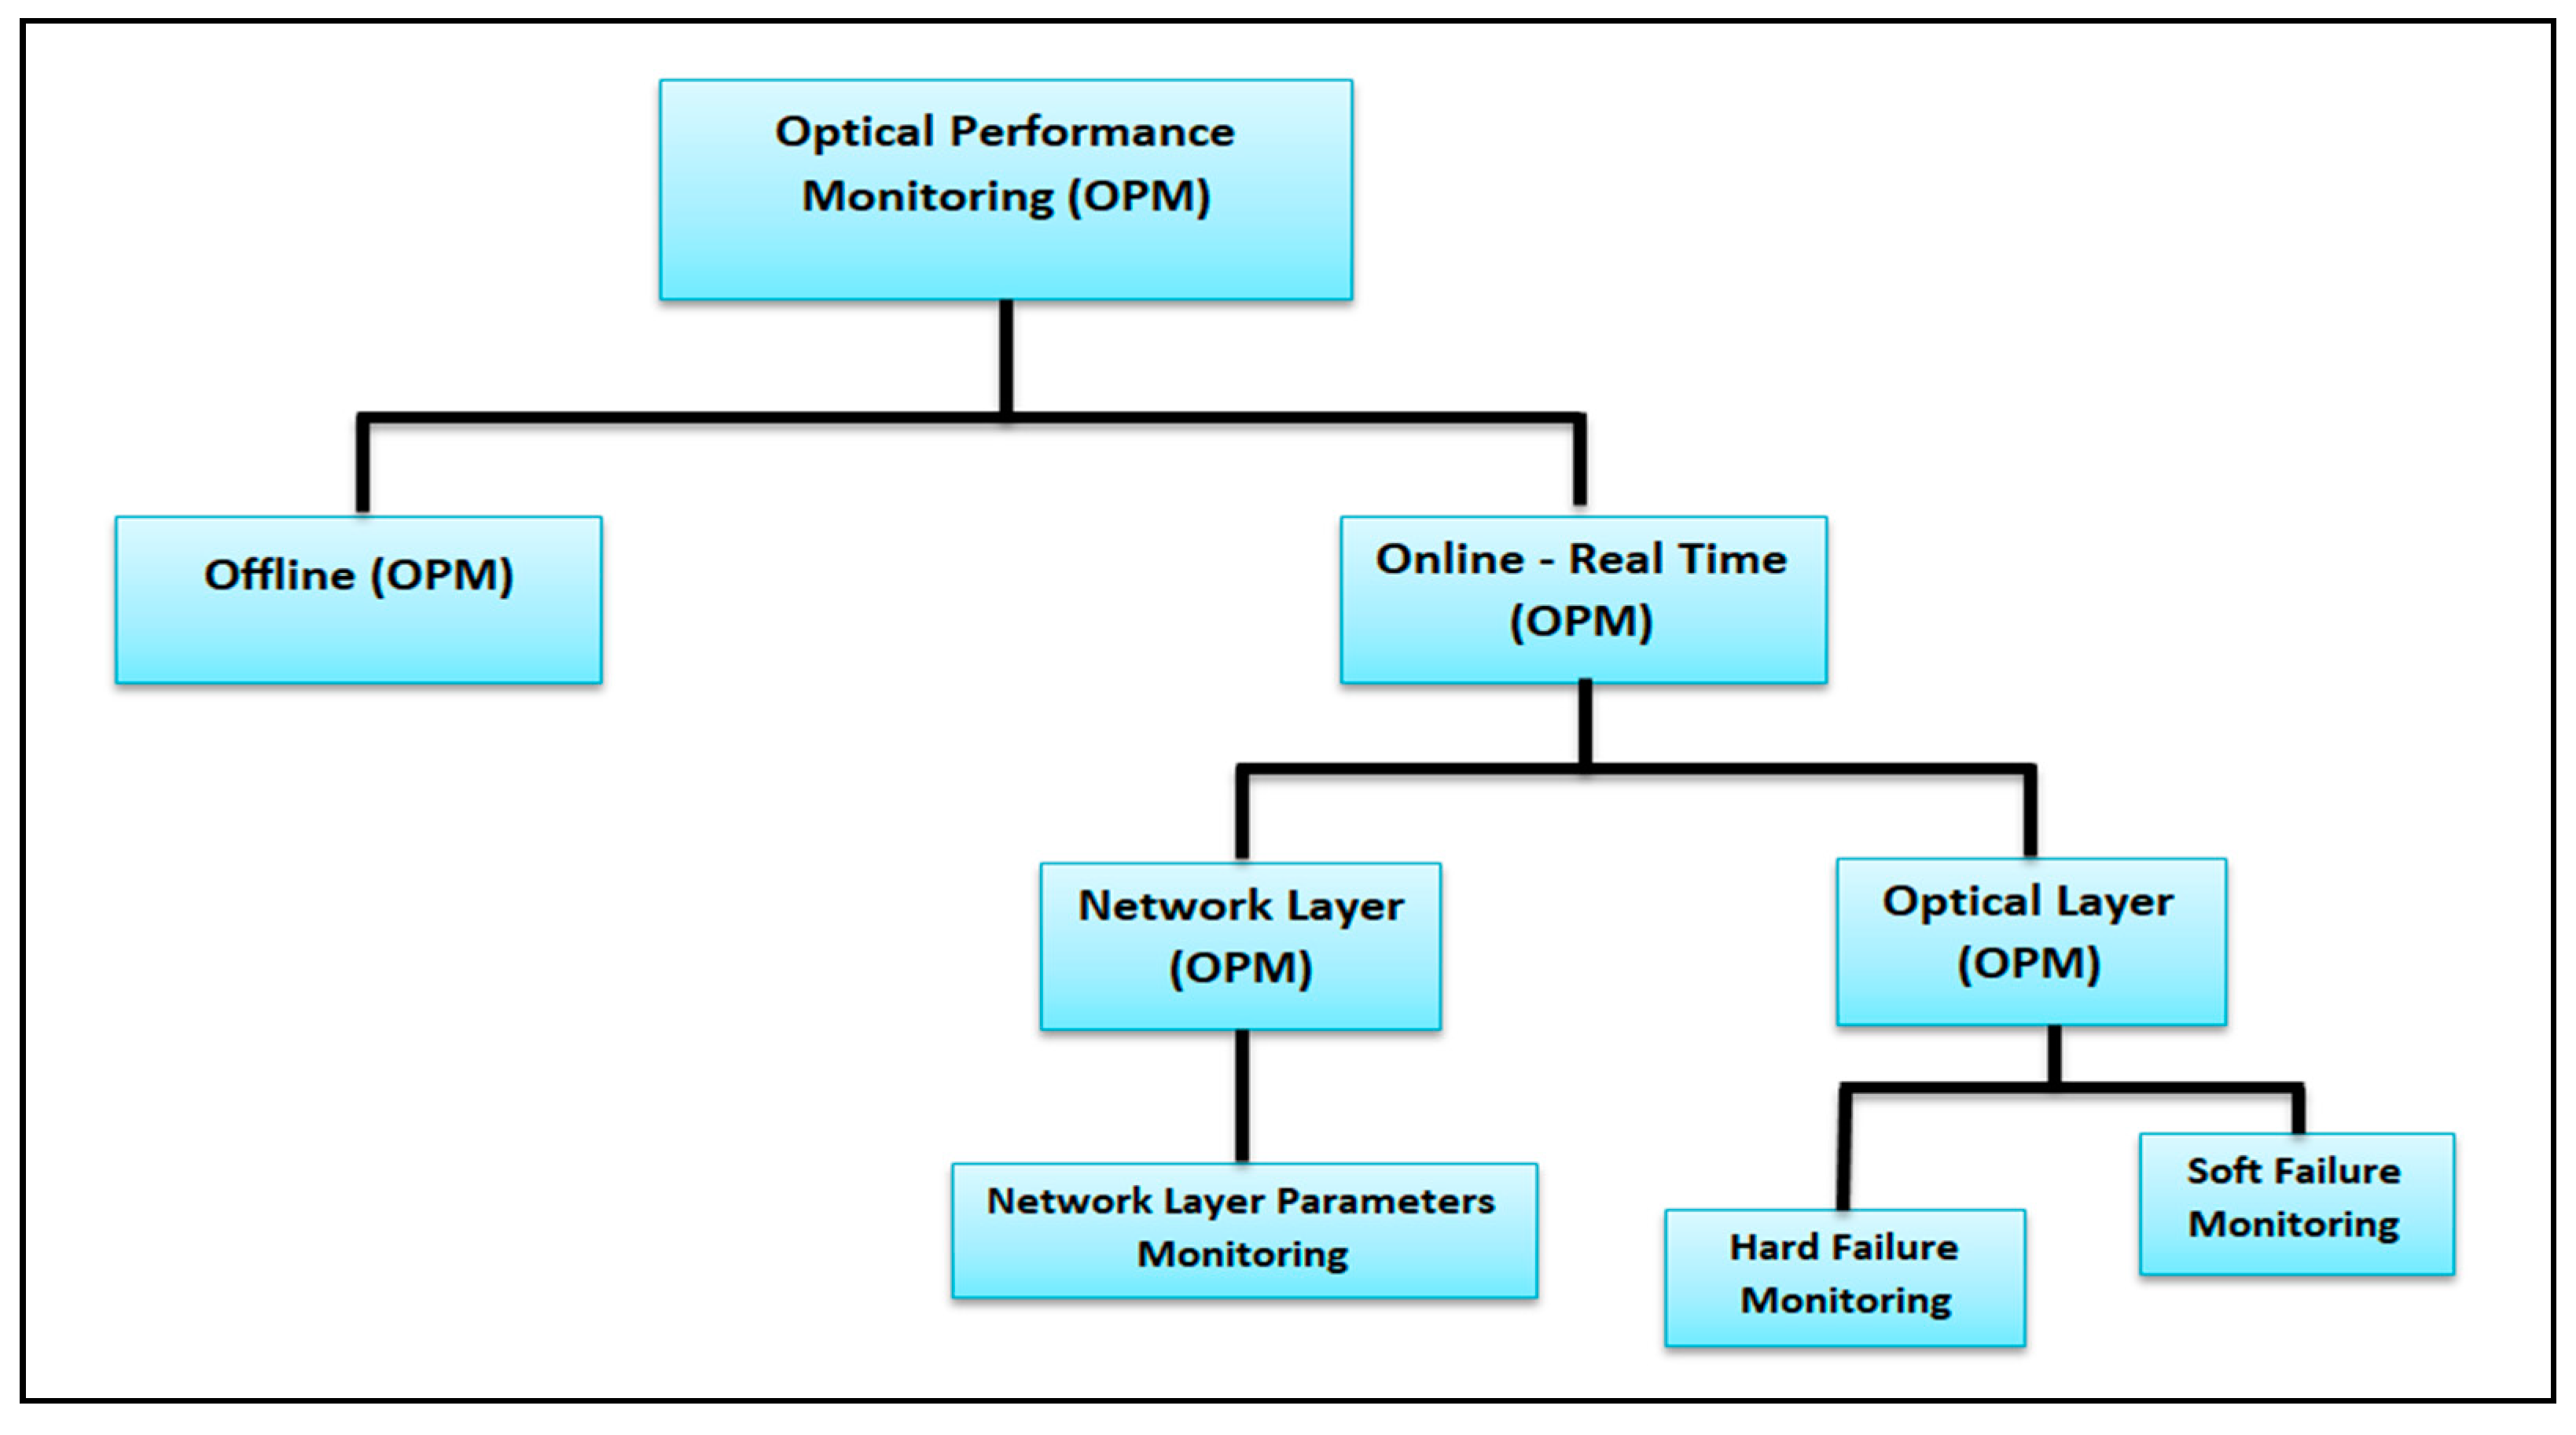
:1. Introduction
1.1. Review of Related Research and Other Literature
1.2. Aim of the Paper
1.3. Organization of the Paper
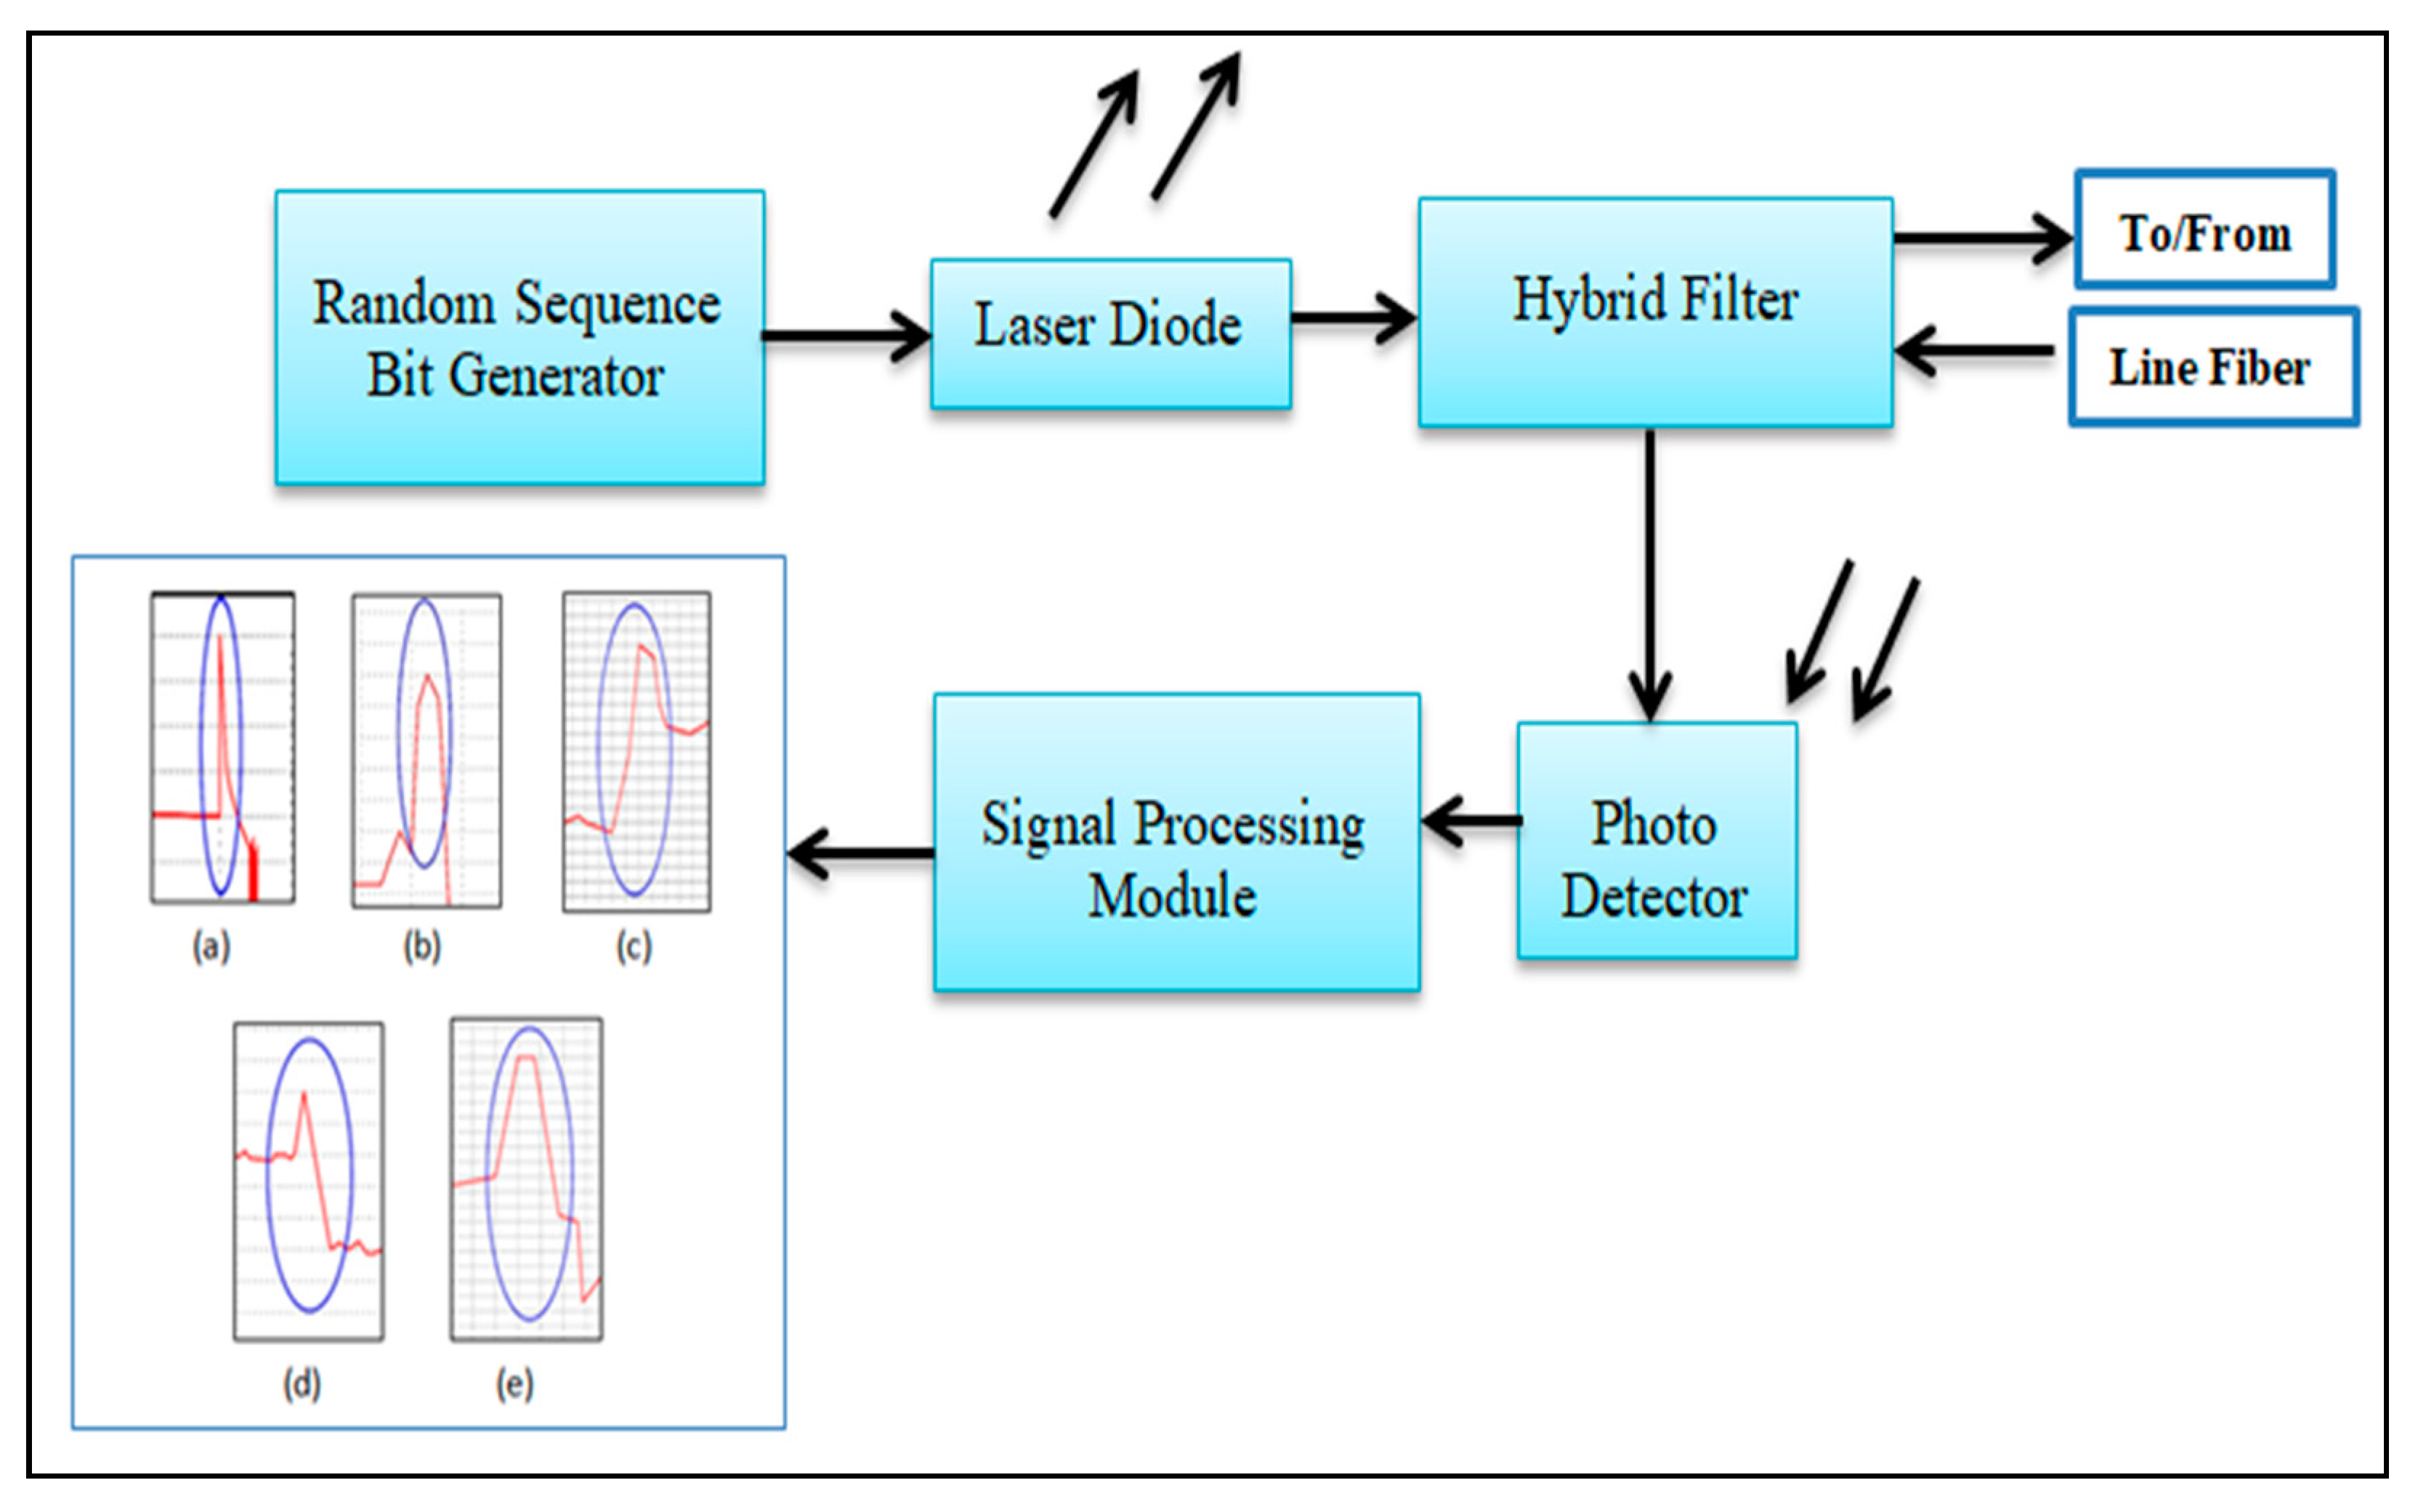
2. Modern FPMT Technique Working Principle
3. Optical Amplifiers Used to Transmitting Test Signals
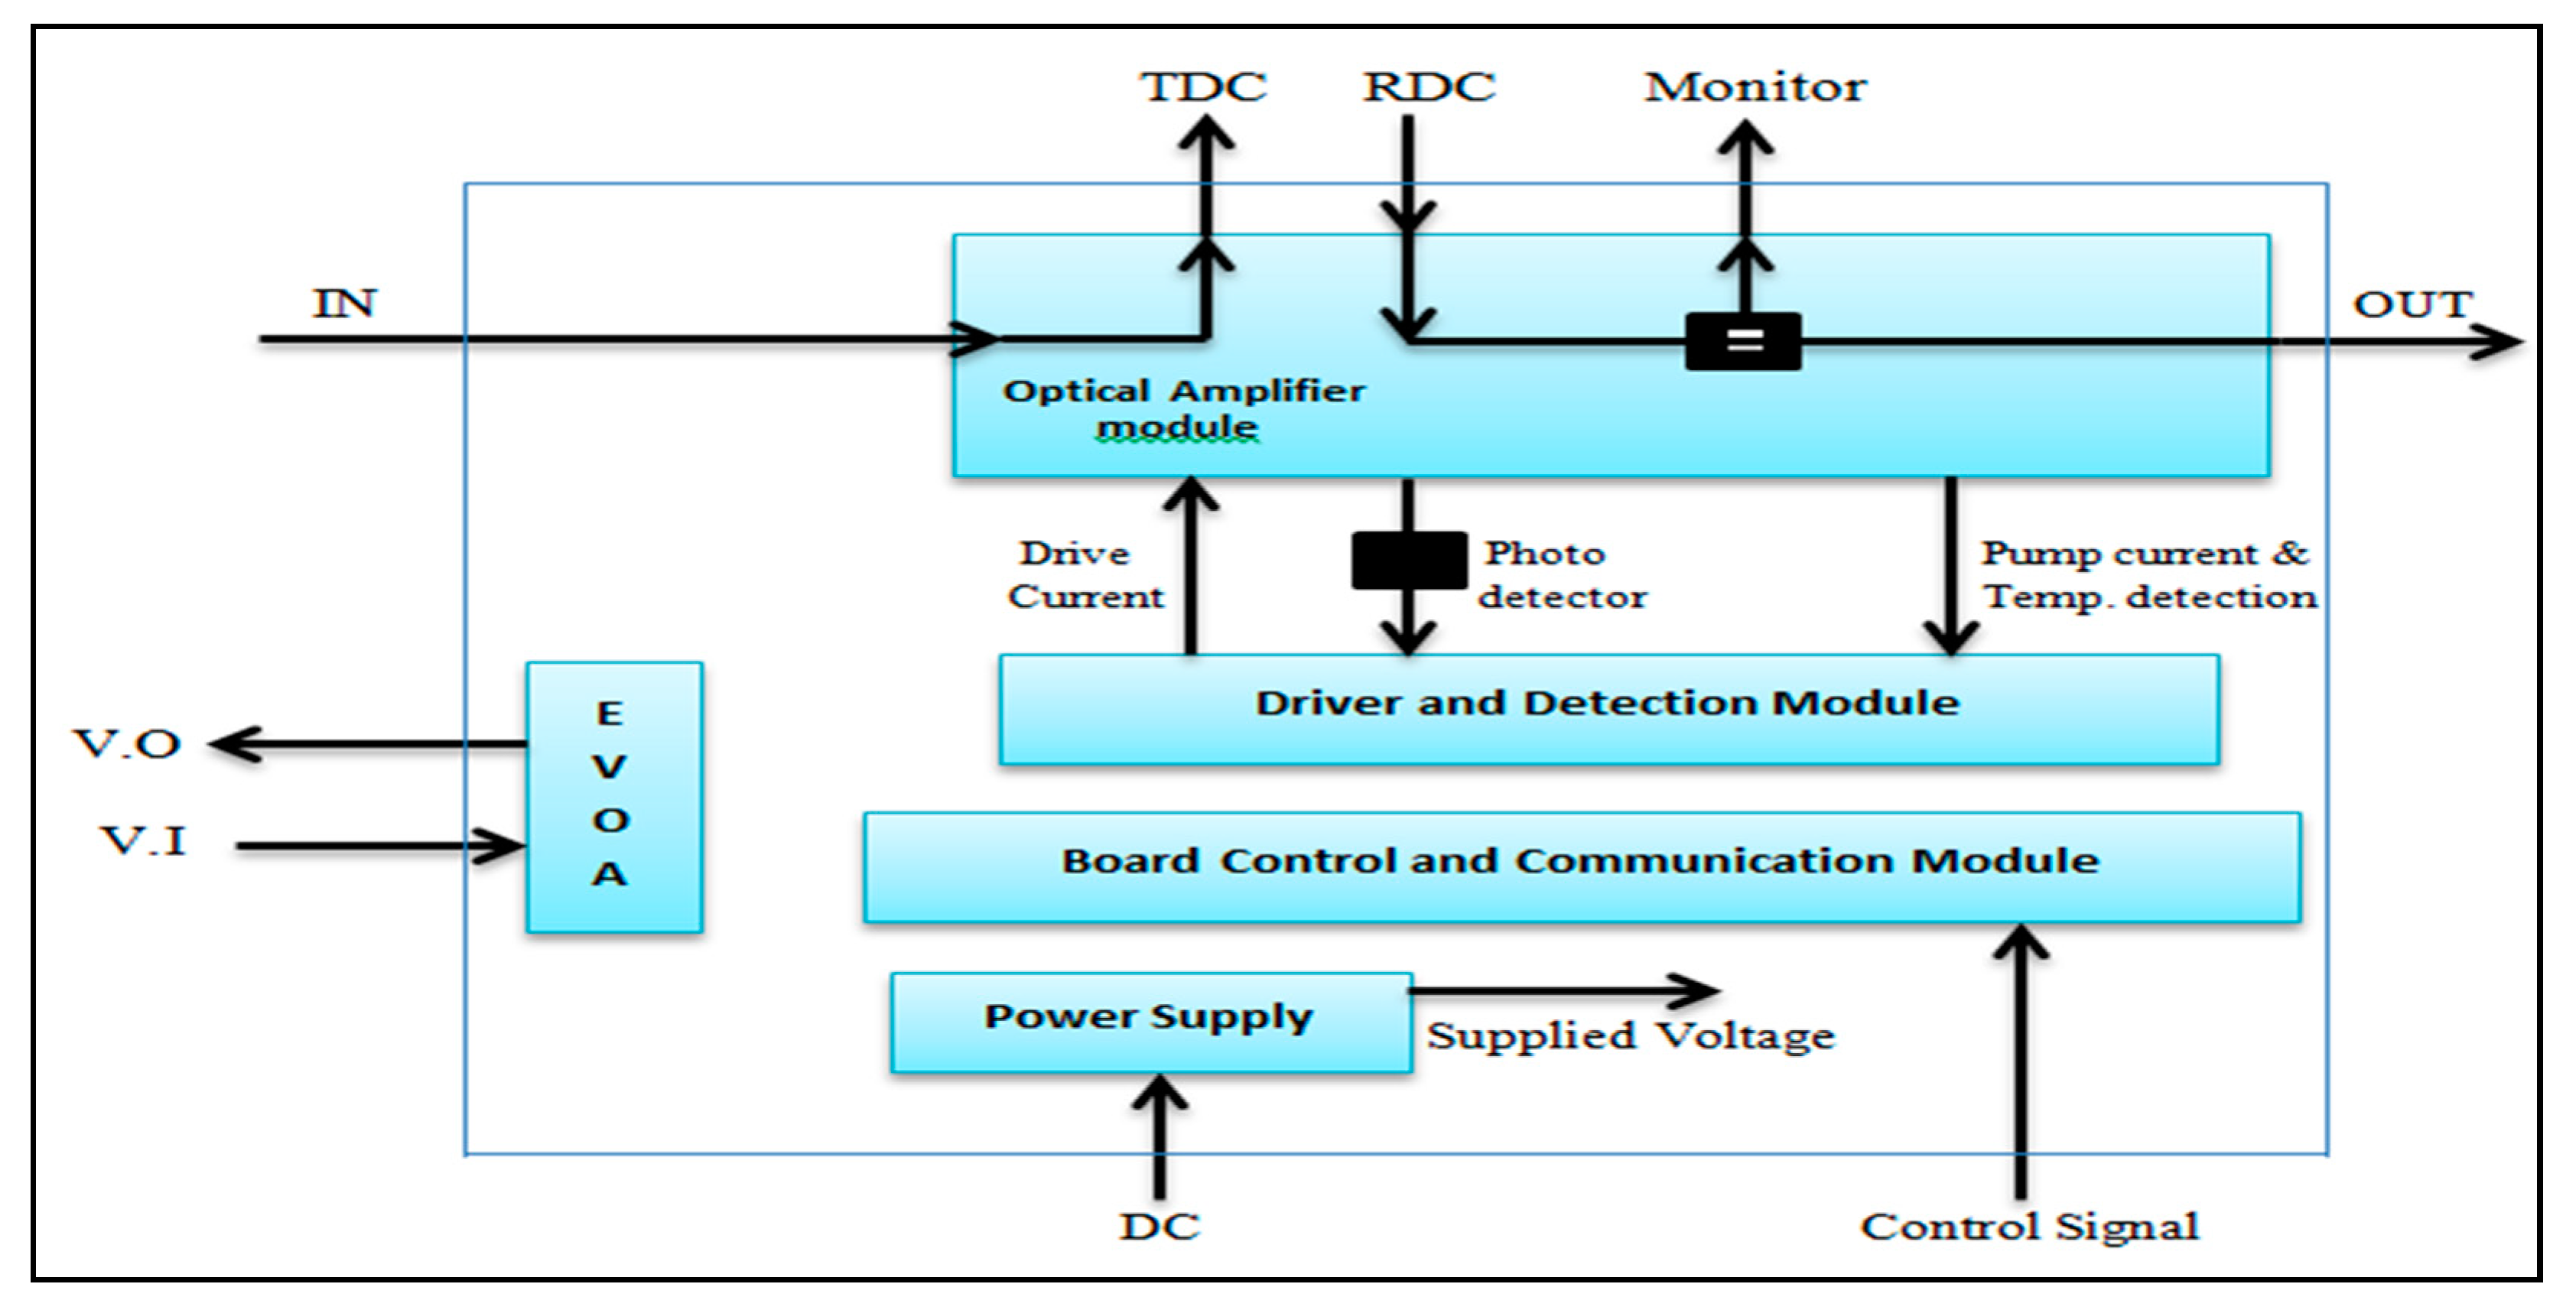
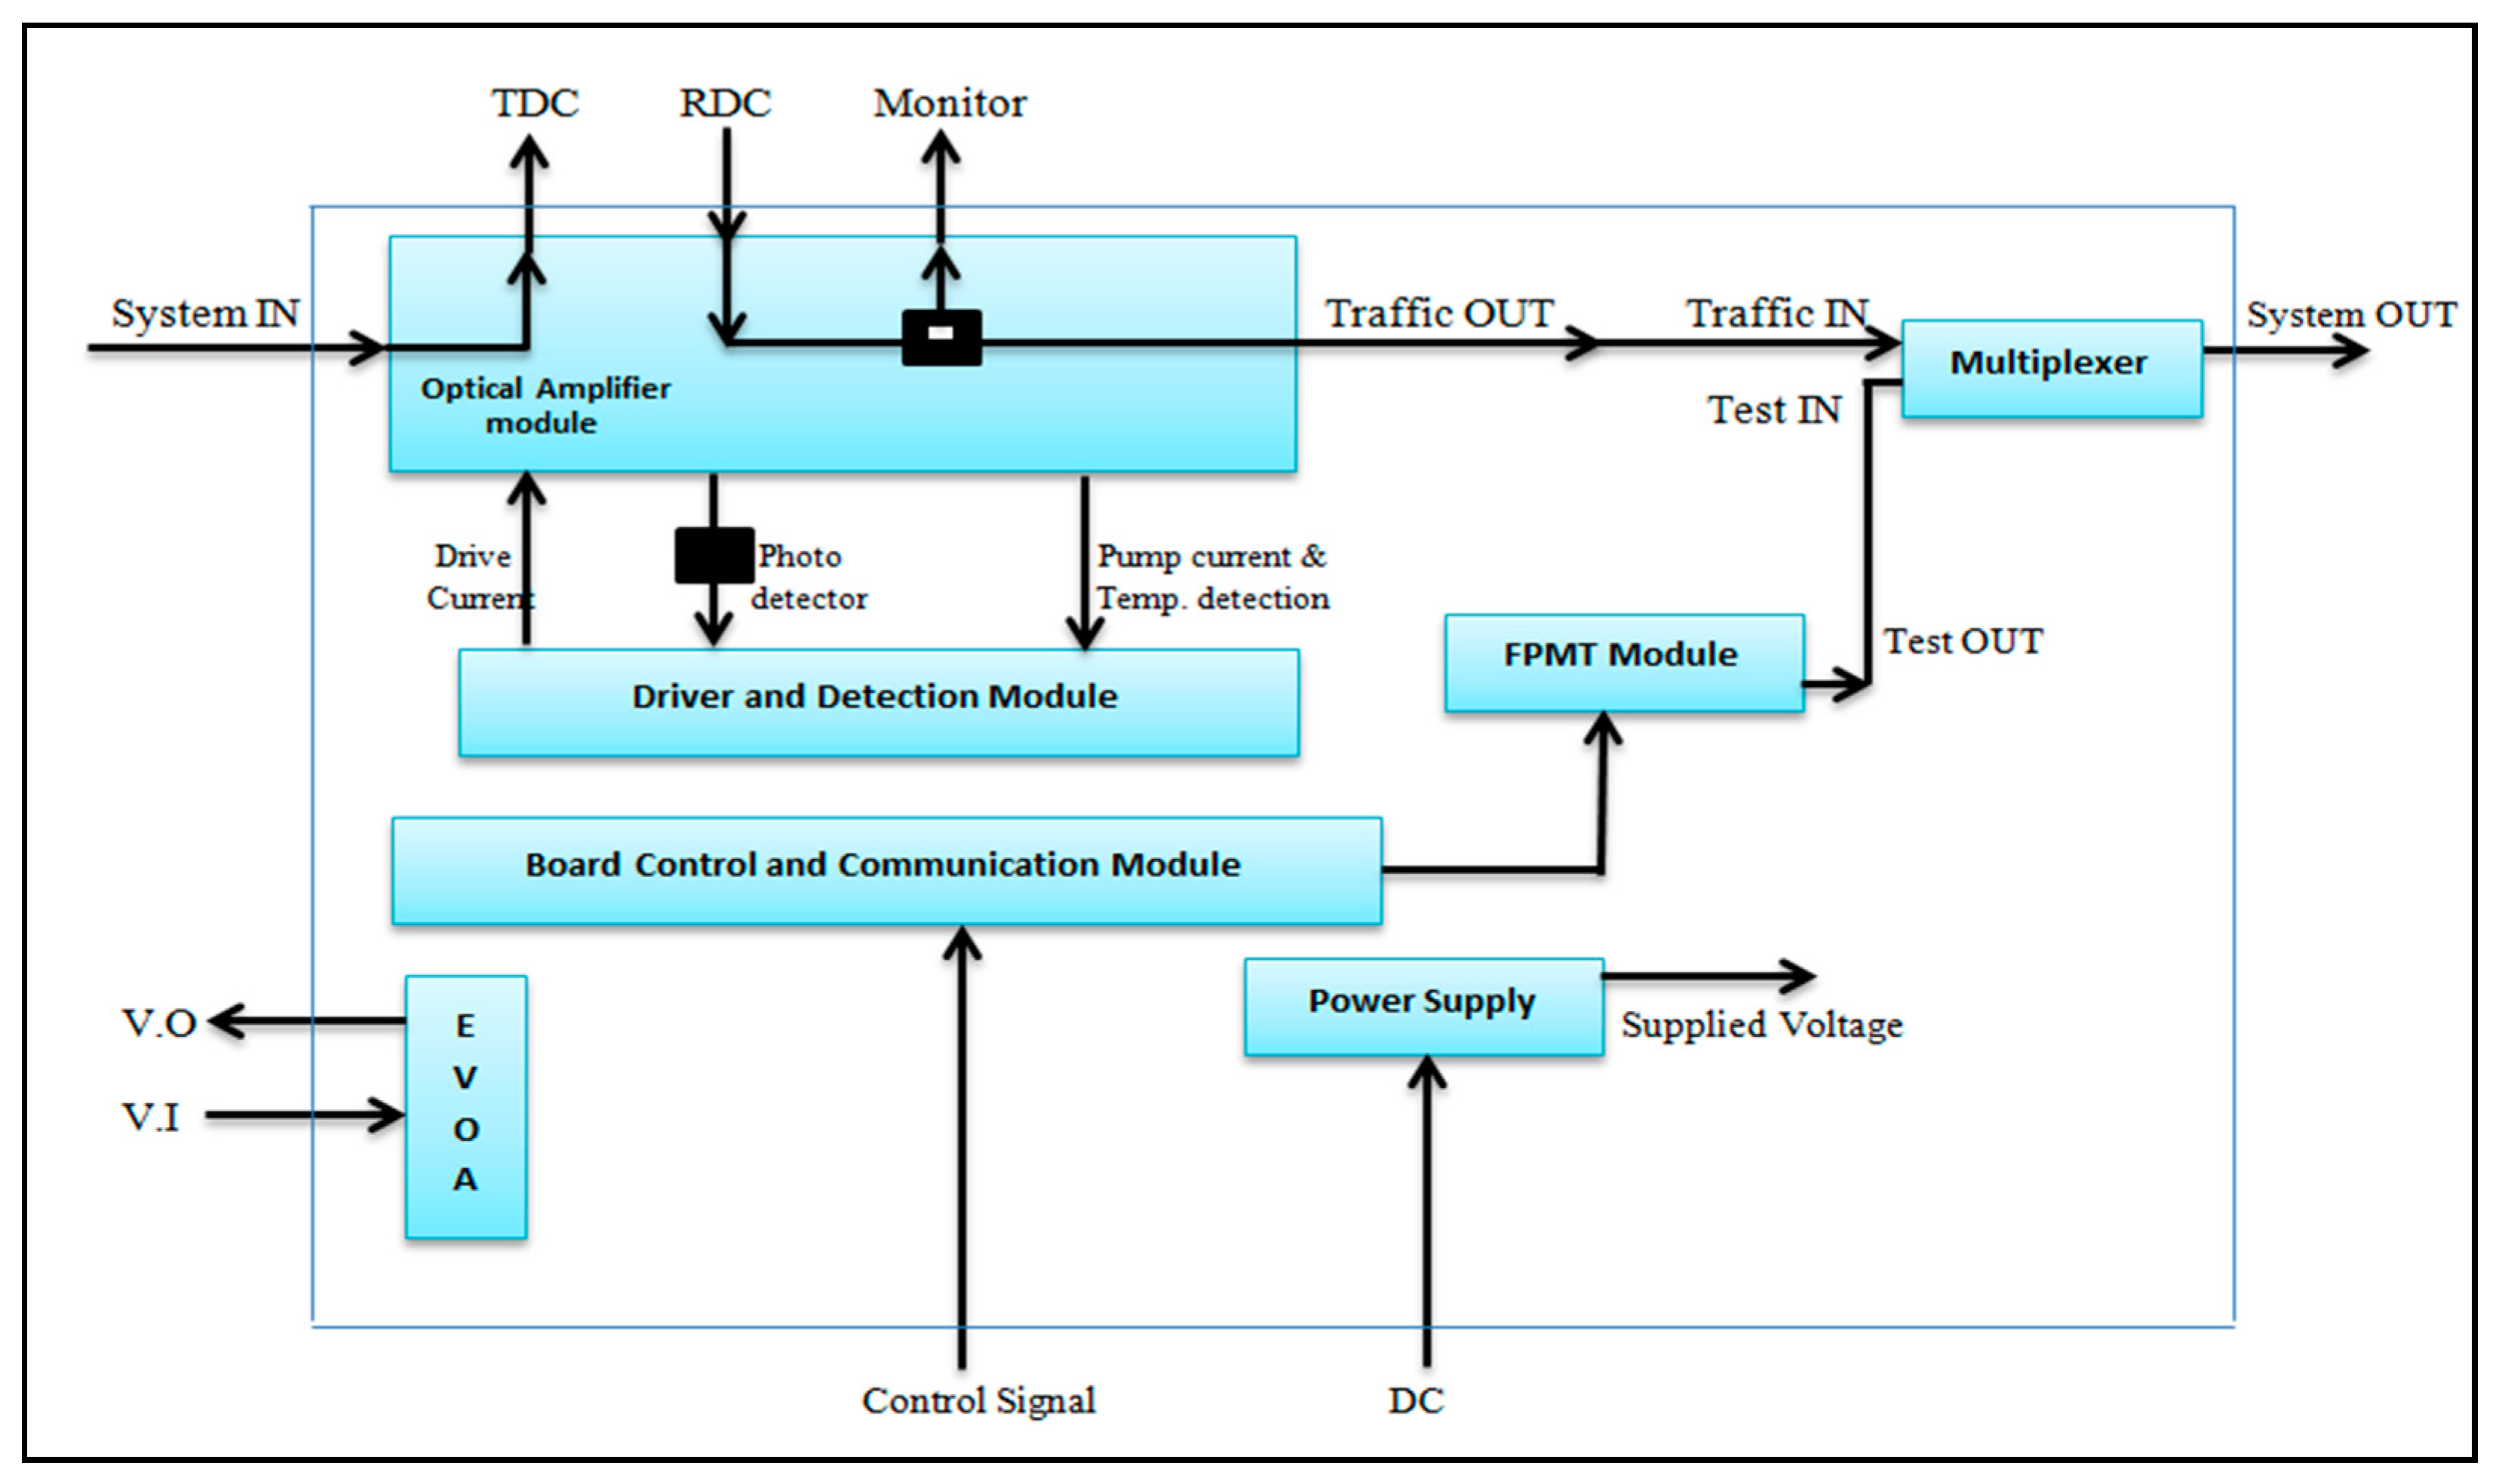
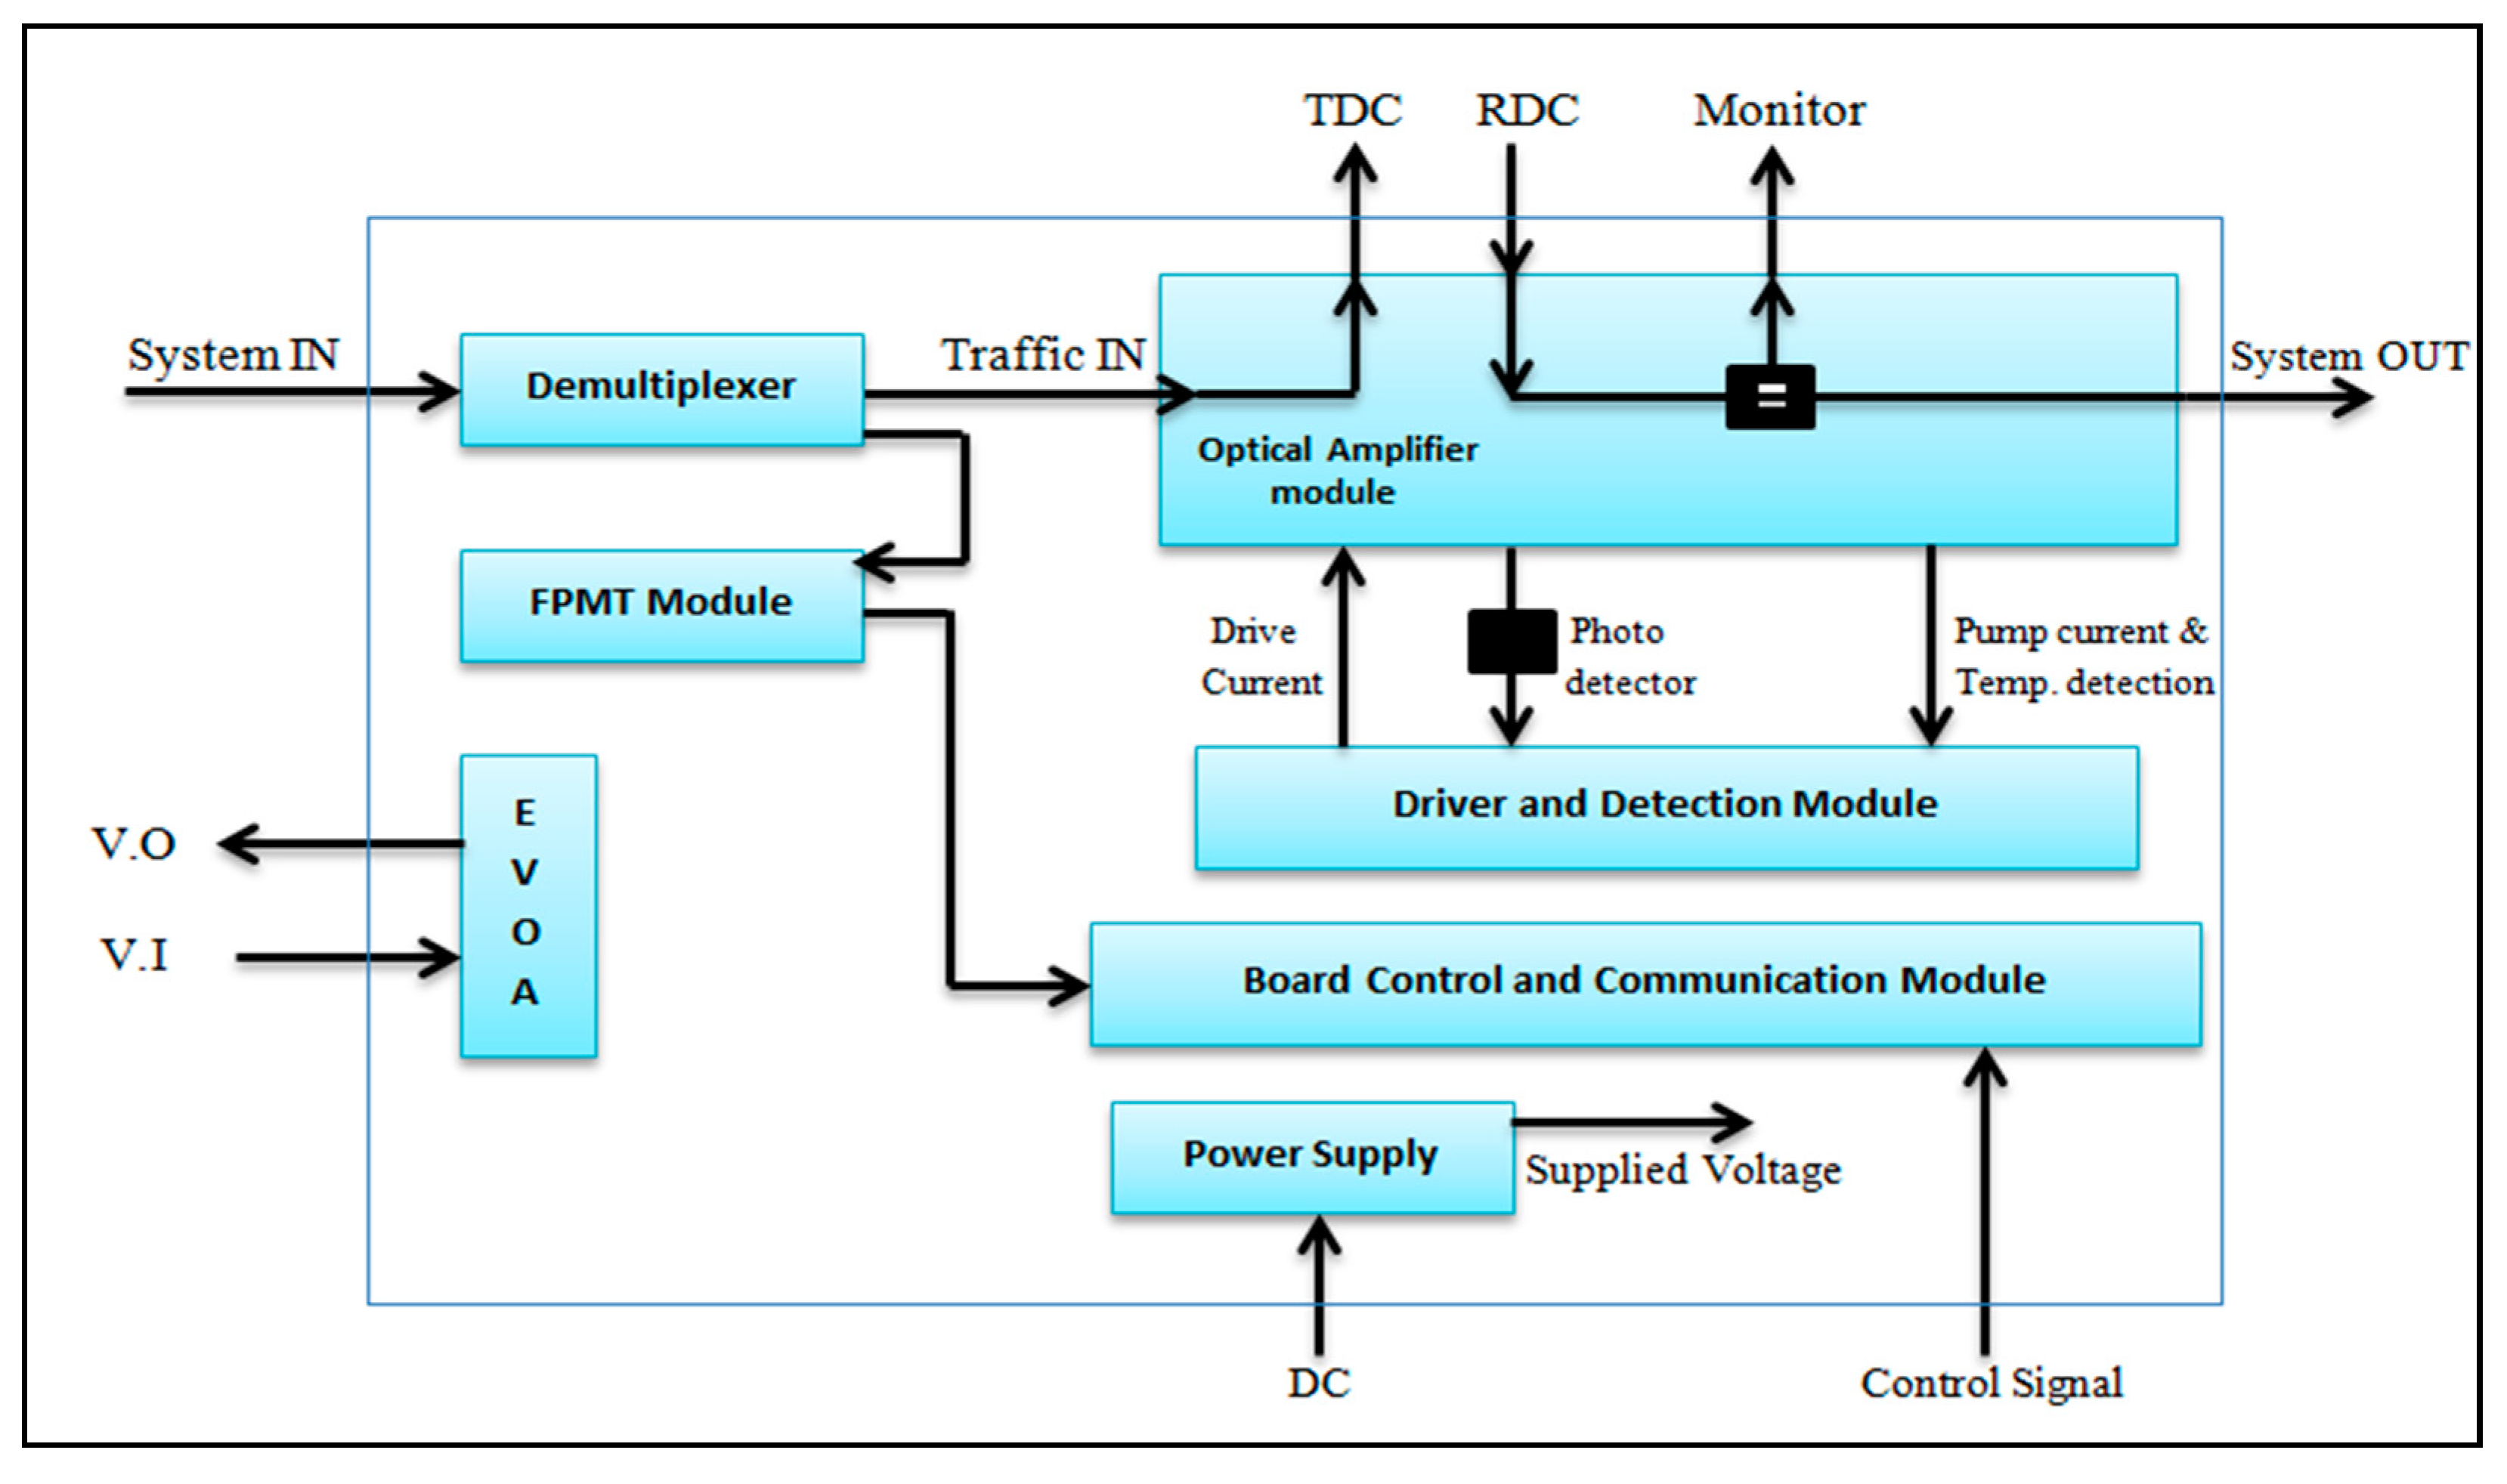
4. Modern FPMT Detection Circuit after and before Integration with EDFA Optical Amplifier Board
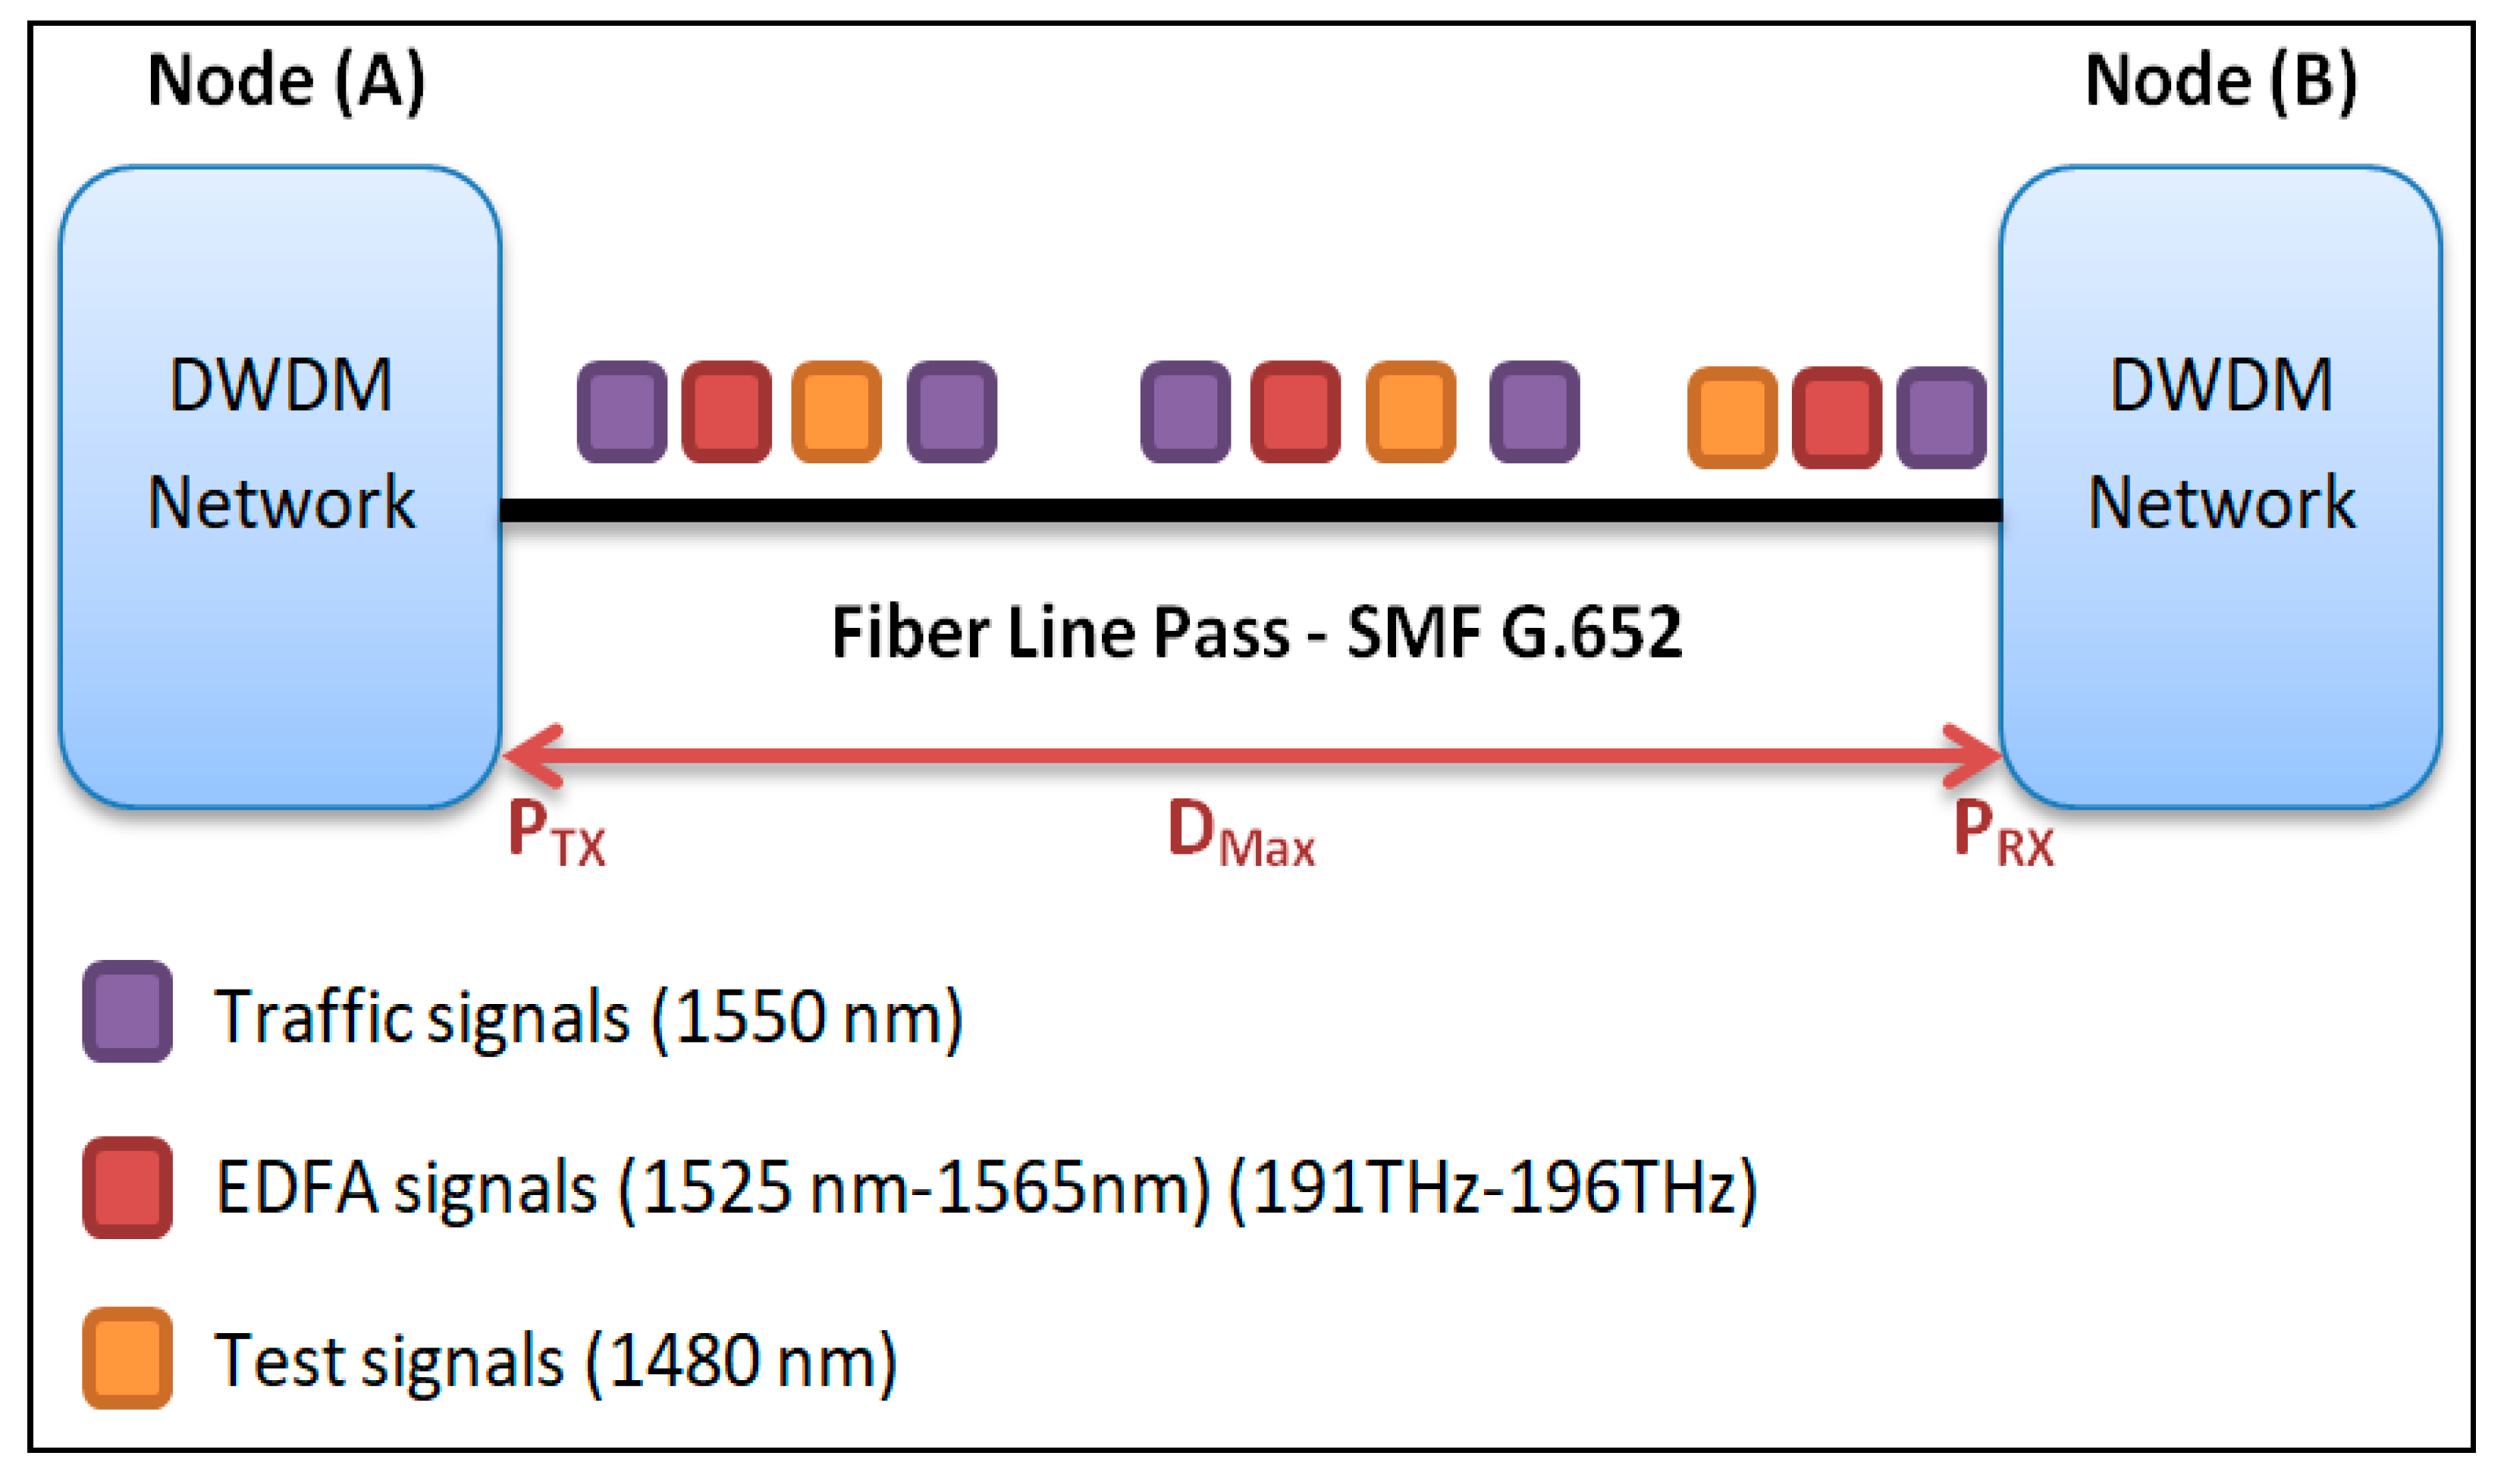
5. The Maximum Performance Monitoring Distance by Using EDFA Board
6. Results
Practical Results
7. Discussion
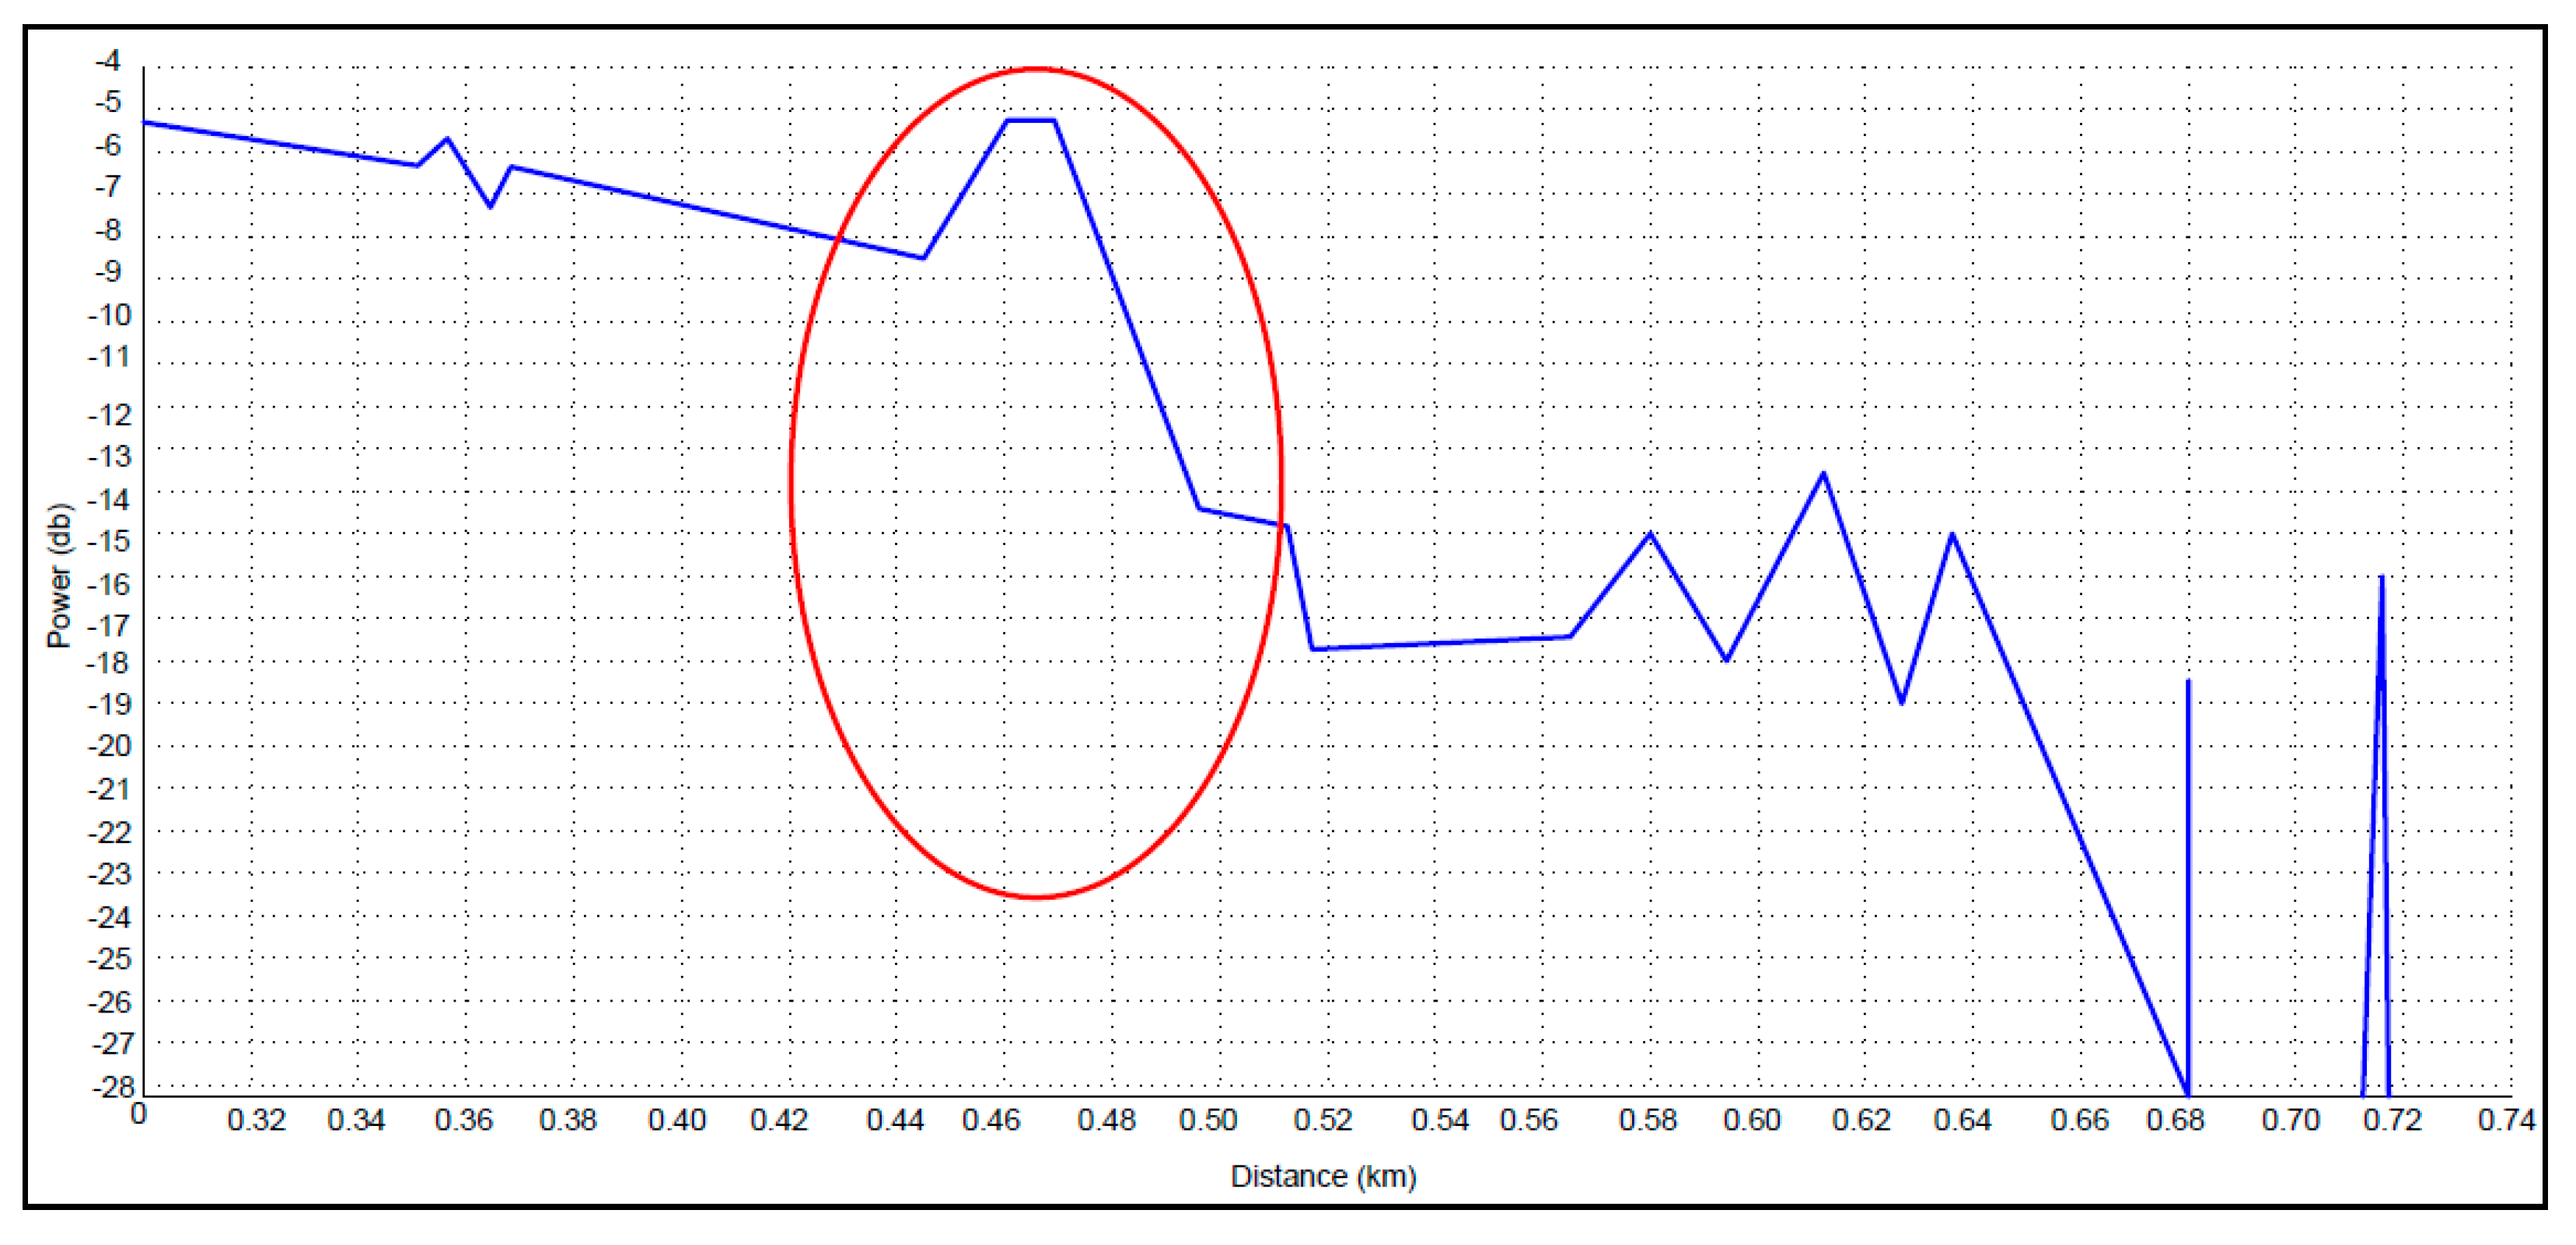
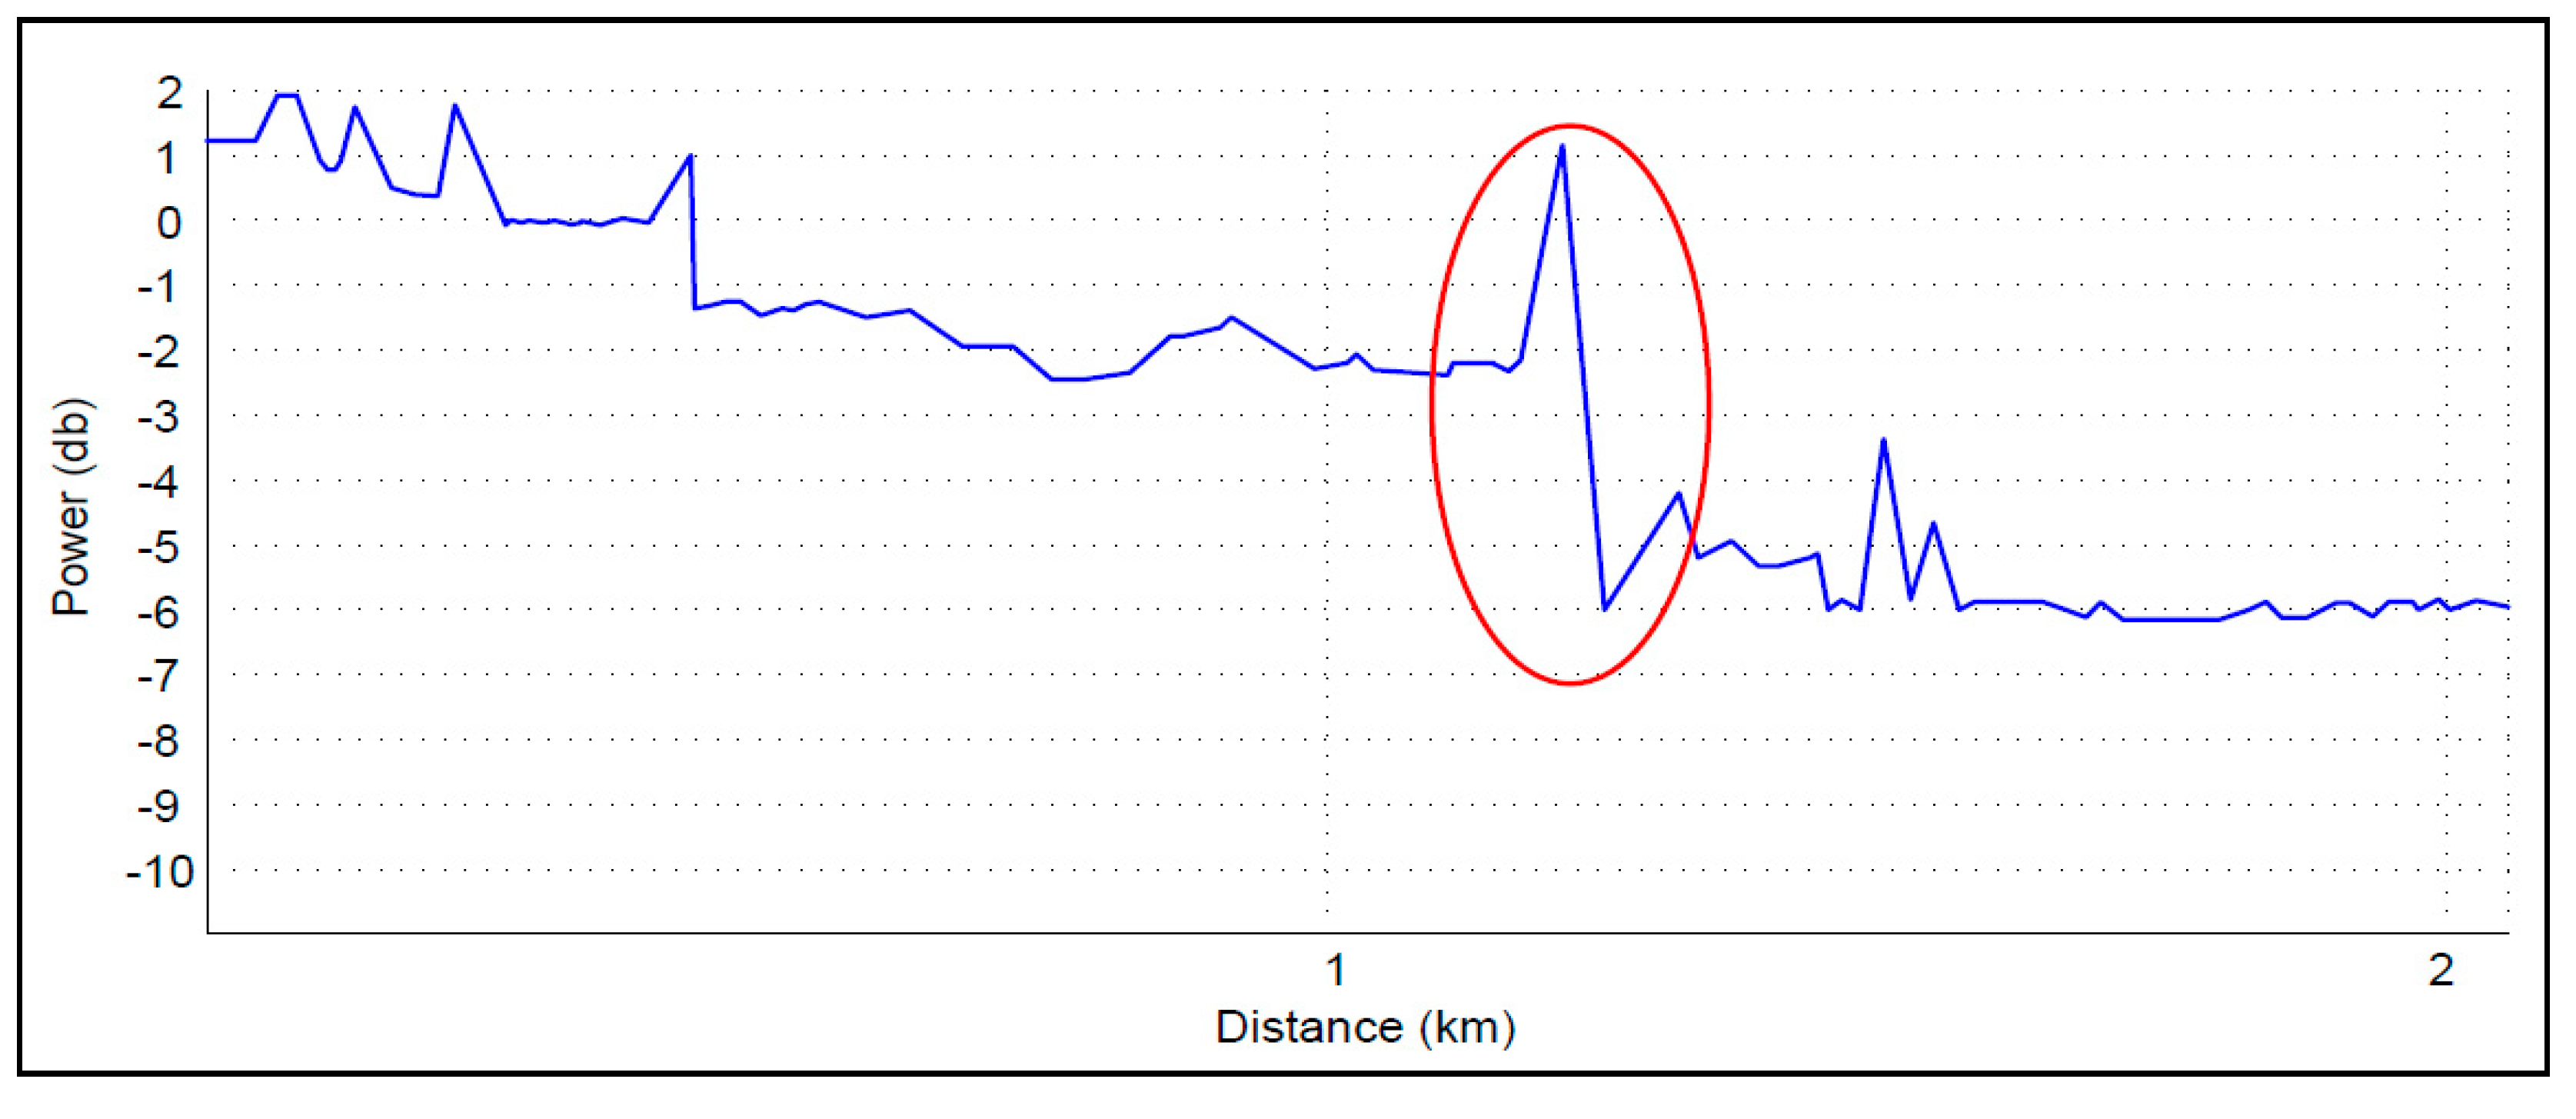
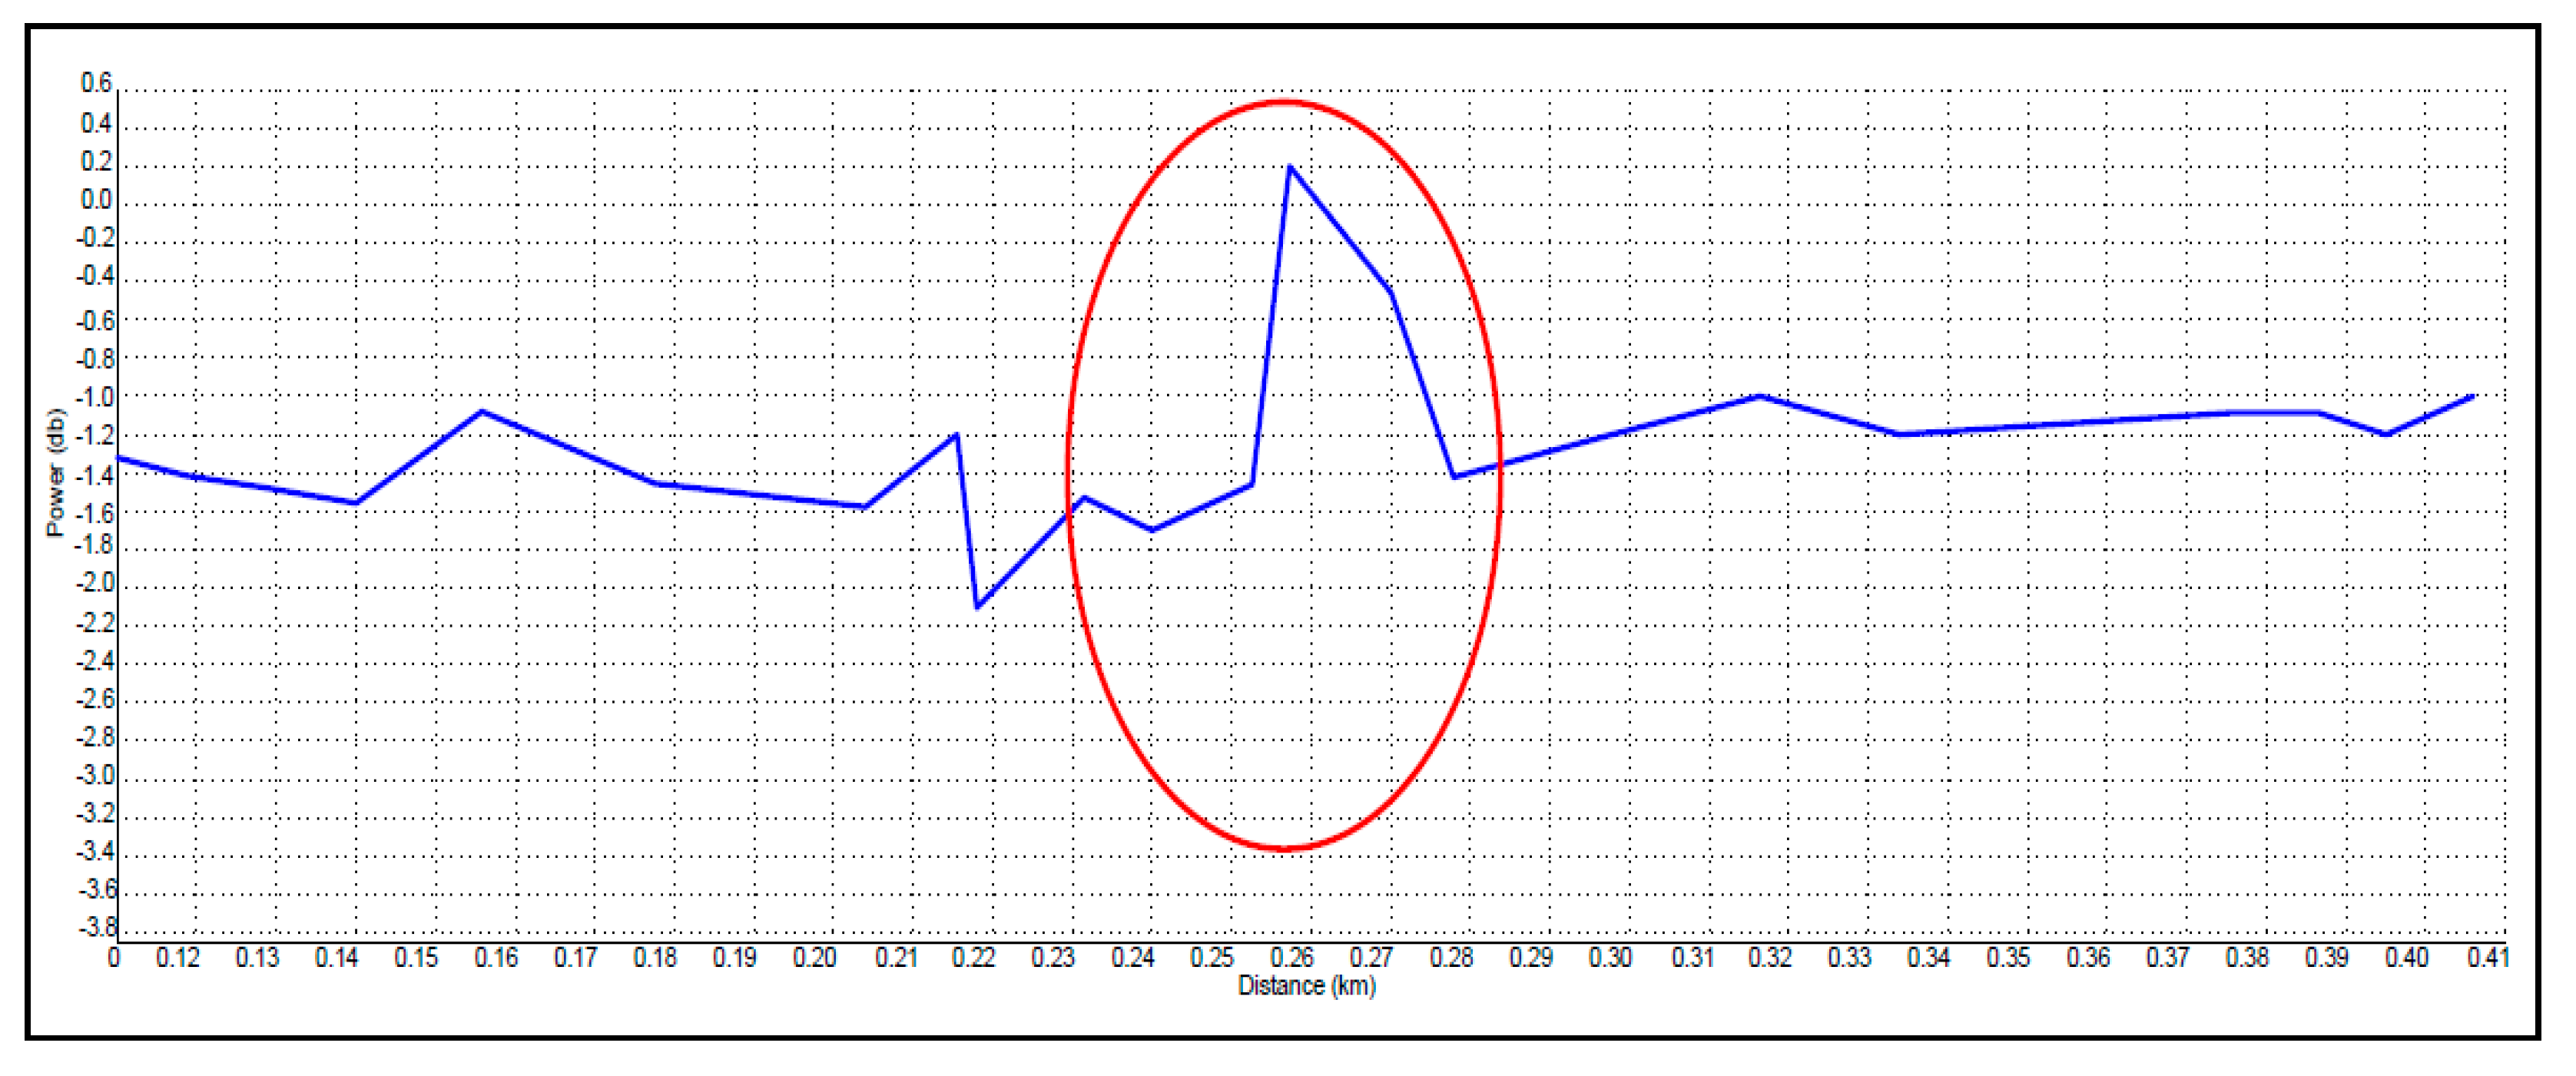
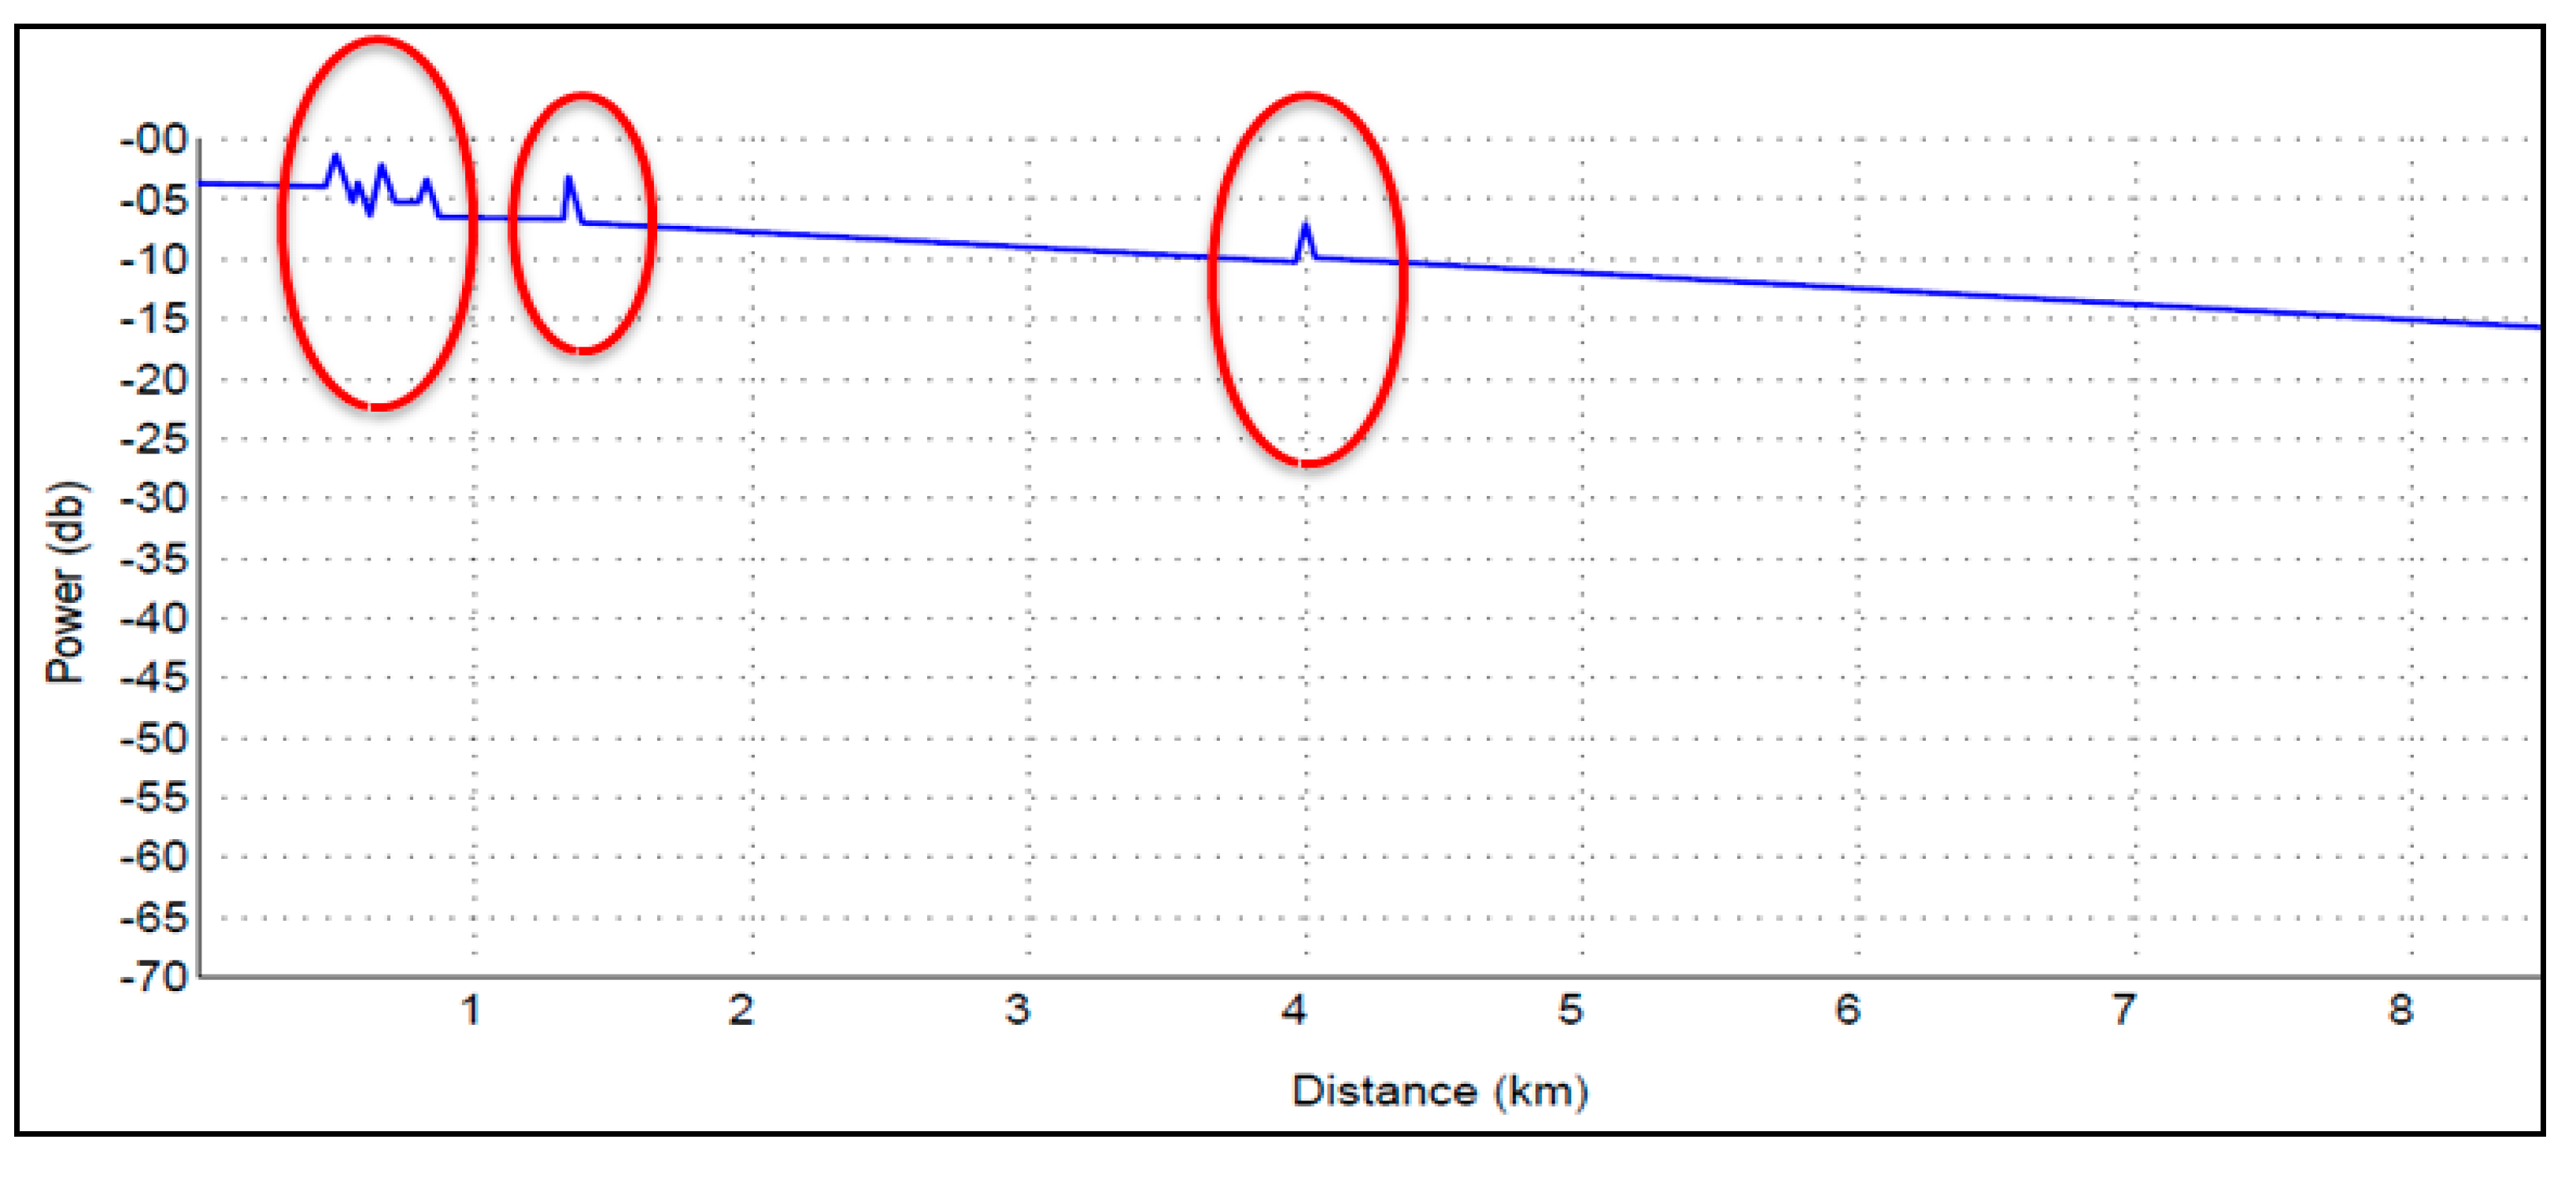
7.1. Failures Detection
7.2. Fault Location Measurement
7.3. Measurement Reliability
7.4. Techniques Comparison
8. Conclusions
Author Contributions
Funding
Institutional Review Board Statement
Informed Consent Statement
Data Availability Statement
Acknowledgments
Conflicts of Interest
References
- Trichili, A.; Park, K.; Zghal, M.; Ooi, B.S.; Alouini, M.-S. Communicating using spatial mode multiplexing: Potentials, challenges, and perspectives. IEEE Comm. Surveys Tuts. 2019, 21, 3175–3203. [Google Scholar] [CrossRef] [Green Version]
- Horvath, T.; Munster, P.; Oujezsky, V.; Bao, N.-H. Passive Optical Networks Progress: A Tutorial. Electronics 2020, 9, 1081. [Google Scholar] [CrossRef]
- Saif, W.S.; Esmail, M.; Ragheb, A.M.; Alshawi, T.A.; Alshebeili, S.A. Machine Learning Techniques for Optical Performance Monitoring and Modulation Format Identification: A Survey. IEEE Commun. Surv. Tutor. 2020, 22, 2839–2882. [Google Scholar] [CrossRef]
- DeSanti, C.; Du, L.; Guarin, J.; Bone, J.; Lam, C.F. Super-PON: An evolution for access networks. J. Opt. Commun. Netw. 2020, 12, D66–D77. [Google Scholar] [CrossRef]
- Calix. Next-Generation PON: Eliminating Physical Constraints from the Access Network; Calix: San Jose, CA, USA, 2020. [Google Scholar]
- Yu, J.; Zhou, X. Ultra-High-Capacity DWDM Transmission System for 100G and beyond. IEEE Commun. Mag. 2010, 48, S56–S64. [Google Scholar] [CrossRef]
- Sano, A.; Kobayashi, T.; Yoshida, E.; Miyamoto, Y. Ultra-high Capacity Optical Transmission Technologies for 100 Tbit/s Optical Transport Networks. IEICE Trans Commun. 2011, 94, 400–408. [Google Scholar] [CrossRef] [Green Version]
- Singh, R.; Kumar, M. Acomprehensive analysis for the performance of next generation passive optical network. In 2021 International Conference on Smart Generation Computing, Communication and Networking (SMART GENCON); IEEE: Piscatvie, NJ, USA, 2021; pp. 1–6. [Google Scholar]
- Zhang, J.; Xu, M.; Zhang, H.; Jia, Z.; Campos, L.A. Next-generation high-speed access network for emerging services. In 2020 Conference on Lasers and Electro-Optics Pacific Rim (CLEO-PR); IEEE: Piscatvie, NJ, USA, 2020; pp. 1–2. [Google Scholar]
- Zhang, D.Z.; Liu, D.K.; Wu, X.; Nesset, D. Progress of ITU-T higher speed passive optical network (50G-PON) standardization. J. Opt. Commun. Netw. 2020, 12, D99–D108. [Google Scholar] [CrossRef]
- Saif, W.S.; Ragheb, A.M.; Esmail, M.A.; Marey, M.; Alshebeili, S.A. Machine Learning Based Low-Cost Optical Performance Monitoring in Mode Division Multiplexed Optical Networks. Photonics 2022, 9, 73. [Google Scholar] [CrossRef]
- Dong, Z.; Khan, F.N.; Sui, Q.; Zhong, K.; Lu, C.; Lau, A.P.T. Optical performance monitoring: A review of current and future technologies. J. Lightwave Technol. 2016, 34, 525–543. [Google Scholar] [CrossRef]
- Wang, D.; Jiang, H.; Liang, G.; Zhan, Q.; Mo, Y.; Sui, Q.; Li, Z. Optical Performance Monitoring of Multiple Parameters in Future Optical Networks. J. Lightwave Technol. 2021, 39, 3792–3800. [Google Scholar] [CrossRef]
- Khan, F.N.; Dong, Z.; Lu, C.; Lau, A.P.T.; Zhou, X.; Xie, C. Optical performance monitoring for fiber-optic communication networks. In Enabling Technologies for High Spectral-Efficiency Coherent Optical Communication Networks; John Wiley & Sons, Inc.: Hoboken, NJ, USA, 2016. [Google Scholar]
- Zweck, J.; Menyuk, C.R. Detection and Mitigation of Soft Failure due to Polarization-Mode Dispersion in Optical Networks. In Proceedings of the Optical Fiber Communication Conference and Exposition and The National Fiber Optic Engineers Conference, Technical Digest (CD). Anaheim, CA, USA, 5–10 March 2006; Optica Publishing Group: Washington, DC, USA; p. OFG5. [Google Scholar]
- Ibrahim, A.A.; Fouad, M.M.; Hamdi, A.A. A Design Fiber Performance Monitoring Tool (FPMT) for Online Remote Fiber Line Performance Detection. Electronics 2022, 11, 3627. [Google Scholar] [CrossRef]
- Usman, A.; Zulkifli, N.; Salim, M.R.; Khairi, K. Fault monitoring in passive optical network through the integration of machine learning and fiber sensors. Int. J. Commun. Syst. 2022, 35, e5134. [Google Scholar] [CrossRef]
- Vela, A.P.; Shariati, B.; Ruiz, M.; Cugini, F.; Castro, A.; Lu, H.; Proietti, R.; Comellas, J.; Castoldi, P.; Yoo, S.J.B.; et al. Soft failure localization during commissioning testing and lightpath operation. IEEE/OSA J. Opt. Commun. Netw. 2018, 10, A27–A36. [Google Scholar] [CrossRef]
- Chen, X.; Li, B.; Proietti, R.; Zhu, Z.; Yoo, S.J.B. Self-Taught Anomaly Detection With Hybrid Unsupervised/Supervised Machine Learning in Optical Networks. J. Lightw. Technol. 2019, 37, 1742–1749. [Google Scholar] [CrossRef]
- Shahkarami, S.; Musumeci, F.; Cugini, F.; Tornatore, M. Machine-Learning-Based Soft-Failure Detection and Identification in Optical Networks. In 2018 Optical Fiber Communications Conference and Exposition (OFC); IEEE: Piscatvie, NJ, USA, 2018. [Google Scholar]
- Schmuck, H.; Hehmann, J.; Straub, M.; Pfeiffer, T. Embedded OTDR techniques for cost-efficient fibre monitoring in optical access networks. In 2006 European Conference on Optical Communications; IEEE: Piscatvie, NJ, USA, 2006; pp. 1–2. [Google Scholar] [CrossRef]
- Abdelli, K.; Grießer, H.; Ehrle, P.; Tropschug, C.; Pachnicke, S. Reflective fiber fault detection and characterization using long short-term memory. J. Opt. Commun. Netw. 2021, 13, E32–E41. [Google Scholar] [CrossRef]
- Hamisu, U.A.; Zulkifli, N.; Salim, M.R.; Khairi, K.; Azmi, A.I. Optical link monitoring in fibre-to-the-x passive optical network (FTTx PON): A comprehensive survey. Opt. Switch. Netw. 2020, 39, 100596. [Google Scholar]
- Chen, H.; Leblanc, M.; Plomteux, O. Live-Fiber OTDR Testing Traffic and Measurement Impairments; EXFO electro-Optical Engineering Inc.: Maharashtra, India, 2003; pp. 1–7. [Google Scholar]
- Yu, M.; Liu, M.; Chang, T.; Lang, J.; Chen, J.; Cui, H.-L. Phase-sensitive optical time-domain reflectometric system based on a single-source dual heterodyne detection scheme. Appl. Opt. 2017, 56, 4058–4064. [Google Scholar] [CrossRef]
- Marie, T.F.B.; Bin, Y.; Dezhi, H.; Bowen, A. Principle and Application State of Fully Distributed Fiber Optic Vibration Detection Technology Based on Φ-OTDR: A Review. IEEE Sens. J. 2021, 21, 16428–16442. [Google Scholar] [CrossRef]
- Wang, Y.; Lv, Y.; Jin, B.; Xu, Y.; Chen, Y.; Liu, X.; Bai, Q. Co-Processing Parallel Computation for Distributed Optical Fiber Vibration Sensing. Appl. Sci. 2020, 10, 1747. [Google Scholar] [CrossRef] [Green Version]
- Shi, Y.; Feng, H.; Zeng, Z. A Long Distance Phase-Sensitive Optical Time Domain Reflectometer with Simple Structure and High Locating Accuracy. Sensors 2015, 15, 21957–21970. [Google Scholar] [CrossRef] [Green Version]
- Lu, B.; Wu, B.; Gu, J.; Yang, J.; Gao, K.; Wang, Z.; Cai, H. Distributed optical fiber hydrophone based on Φ-OTDR and its field test. Opt. Express 2021, 29, 3147–3162. [Google Scholar] [CrossRef] [PubMed]
- Saif, W.S.; Ragheb, A.M.; Alshawi, T.A.; Alshebeili, S.A. Optical Performance Monitoring in Mode Division Multiplexed Optical Networks. J. Light. Technol. 2021, 39, 491–504. [Google Scholar] [CrossRef]
- Anderson, T.B.; Kowalczyk, A.; Clarke, K.; Dods, S.D.; Hewitt, D.; Li, J.C. Multi Impairment Monitoring for Optical Networks. J. Light. Technol. 2009, 27, 3729–3736. [Google Scholar] [CrossRef]
- Wang, D.; Sui, Q.; Li, Z. Toward universal optical performance monitoring for intelligent optical fiber communication networks. IEEE Commun. Mag. 2020, 58, 54–59. [Google Scholar] [CrossRef]
- Zhu, X.; Liu, B.; Zhu, X.; Ren, J.; Ullah, R.; Mao, Y.; Wu, X.; Chen, S.; Li, M. Optical performance monitoring via domain adversarial adaptation in few-mode fiber. Opt. Commun. 2022, 510, 127933. [Google Scholar] [CrossRef]
- Amirabadi, M.A.; Nezamalhosseini, S.A.; Kahaei, M.H. Meta-ensemble learning for OPM in FMF systems. Appl. Opt. 2022, 61, 6249–6256. [Google Scholar] [CrossRef]
- Zhang, L.; Li, C.; He, J.; Liu, Y.; Zhao, J.; Guo, H.; Zhu, L.; Zhou, M.; Zhu, K.; Liu, C.; et al. Optical Machine Learning Using Time-Lens Deep Neural NetWorks. Photonics 2021, 8, 78. [Google Scholar] [CrossRef]
- Saif, W.S.; Ragheb, A.M.; Nebendahl, B.; Alshawi, T.; Marey, M.; Alshebeili, S.A. Machine Learning-Based Optical Performance Monitoring for Super-Channel Optical Networks. Photonics Multidiscip. Digit. Publ. Inst. 2022, 9, 299. [Google Scholar] [CrossRef]
- Huang, Z.; Tian, Y.; Liu, Y.; Luo, H.; Long, X.; Yu, C. Optical performance monitoring using SOI-based spectral analysis. Opt. Express 2022, 30, 6397–6412. [Google Scholar] [CrossRef]
- Bakar, A.; Jamaludin, M.; Abdullah, F.; Yaacob, M.; Mahdi, M.; Abdullah, M. A New Technique of Real-Time Monitoring of Fiber Optic Cable Networks Transmission. Opt. Lasers Eng. 2007, 45, 1126–1130. [Google Scholar] [CrossRef]
- Shu, L.; Yu, Z.; Wan, Z.; Zhang, J.; Hu, S.; Xu, K. Dual-Stage Soft Failure Detection and Identification for Low-Margin Elastic Optical Network by Exploiting Digital Spectrum Information. J. Light. Technol. 2020, 38, 2669–2679. [Google Scholar] [CrossRef]
- Liang, S.; Yu, Z.; Wan, Z.; Zhang, J.; Hu, S.; Xu, K. Low-complexity dual-stage soft failure detection by exploiting digital spectrum information. In IET Conference Proceedings; The Institution of Engineering & Technology: London, UK, 2019. [Google Scholar]
- Zhang, X.; Ning, N. A PON Monitoring Scheme for Online Fault Detection and Localization. IEEE Photonics J. 2022, 314, 1–6. [Google Scholar] [CrossRef]
- Zhang, X.; Yang, T.; Jia, X. A PON Monitoring System Integrating Fault Detection and Localization. IEEE Photonics J. 2022, 5, 1–7. [Google Scholar] [CrossRef]
- Luo, Z.; Zhang, Y.; Cheng, W.; Yang, X.; Zeng, S. Fiber-end antireflection method for ultra-weak fiber Bragg grating sensing systems. Meas. Sci. Technol. 2021, 32, 055109. [Google Scholar] [CrossRef]
- Wang, D.; Zhang, C.; Chen, W.; Yang, H.; Zhang, M.; Lau, A.P.T. A review of machine learning-based failure management in optical networks. Sci. China Inf. Sci. 2022, 65, 211302. [Google Scholar] [CrossRef]
- Abdelli, K.; Cho, J.Y.; Azendorf, F.; Griesser, H.; Tropschug, C.; Pachnicke, S. Machine-learning-based anomaly detection in optical fiber monitoring. J. Opt. Commun. Netw. 2022, 14, 365–375. [Google Scholar] [CrossRef]
- Champavère, A. New OTDR Measurement and Monitoring Techniques. In Optical Fiber Communication Conference; Optical Society of America:: Washington, DC, USA, 2014; p. W3D.1. [Google Scholar] [CrossRef]
- Jiang, W.; Sui, J.; Ren, P. Virtual instrument based online monitoring, real-time detecting and automatic diagnosis management system for multi-fiber lines. In 2011 3rd International Conference on Advanced Computer Control; IEEE: Piscatvie, NJ, USA, 2011; pp. 169–173. [Google Scholar] [CrossRef]
- Edfa-Vs-Raman-Amplifier. Available online: www.huawei.com (accessed on 15 November 2021).
- Mallick, B.; Prasad, B.; Patra, D.K.C. Design of a Hybrid Optical amplifier for 64 DWDM Channels network by using EDFA and Raman Amplifier. Int. J. Electr. Electron. Res. (IJEER) 2017, 5, 18–23. [Google Scholar] [CrossRef]
- Hu, Q.; Zhao, X.; Tian, X.; Wang, M.; Wang, Z.; Xu, X. Raman suppression in high-power fiber laser oscillator by long period fiber grating. Results Phys. 2021, 26, 104460. [Google Scholar] [CrossRef]
- Islam, M.N. Raman amplifiers for telecommunications. IEEE J. Sel. Top. Quantum Electron. 2002, 8, 548–559. [Google Scholar] [CrossRef]
- Olonkins, S.; Bobrovs, V.; Ivanovs, G. Comparison of Semiconductor Optical Amplifier and Discrete Raman Amplifier Performance in DWDM Systems. Elektron. Ir Elektrotechnika 2012, 123, 133–136. [Google Scholar] [CrossRef]
- Gaur, C.B.; Ferreira, F.; Gordienko, V.; Ribeiro, V.; Szabó, Á.D.; Doran, N.J. Experimental comparison of fiber optic parametric, Raman and erbium amplifiers for burst traffic for extended reach PONs. Opt. Express 2020, 28, 19362–19373. [Google Scholar] [CrossRef] [PubMed]
- Dilendorfs, V.; Parfjonovs, M.; Alsevska, A.; Spolitis, S.; Bobrovs, V. Influence of dispersion slope compensation on 40 Gbit/s WDM-PON transmission system performance with G.652 & G.655 optical fibers. In Proceedings of the 2017 Progress in Eletromagnetics Research Symposium, Fall (PIERS-FALL), Singapore, 19–22 November 2017; pp. 598–604. [Google Scholar] [CrossRef]
- Kandishaya, C. Design and Implementation of a Multivendor Network Management System (NMS) User Interface with the Aid of HUAWEI, ZTE and CISCO Network Elements. Master’s Thesis, University of Zimbabwe, Harare, Zimbabwe, 2020, unpublished. [Google Scholar]
- What is Huawei NCE. Available online: www.huawei.com (accessed on 5 September 2021).


| Parameter | Specification |
|---|---|
| Network | DWDM |
| Signal generate by | Modern-FPMT Technique |
| Signal transmit by | Integrate at EDFA-OA |
| Signal shape | Random predefined Binary-Bits |
| Signal pulse width | 20 × 103 Nano-seconds |
| Signals rate | 2 Mbps |
| Signal wavelength | 1480 nm or 1490 nm |
| Attenuation | 0.22 dB/km |
| Fiber-standard | SFM-G.652 |
| Max. detected distance | 300 km derived in Section 5 |
| Features | EDFA | Raman |
|---|---|---|
| Working principle | It uses stimulated radiation of EDF fibers to amplify optical signals and requires-doped optical fiber. | It uses stimulated Raman scattering to amplify optical signals and does not require doped-optical fiber. |
| Pump power | 26 dBm | 30 dBm |
| Amplification band | 1525–1565 nm 1570–1610 nm | All wavelengths |
| Noise figure | 5 dB | 5 dB |
| Gain | 40 dB | 25 dB |
| Financial cost factor | Low cost | High cost |
| Parameter | Specification |
|---|---|
| Cabinet Name | OSN_9800 |
| Optical Amplifier Type | Optical Booster unit (OBU) in TX Optical Amplifier unit (OAU) in Rx |
| Wavelength | 1525 nm or 1565 nm [49,50] |
| Frequency | 191 THz to 196 THz [49,50] |
| Insertion Loss | 0 dB (active element) Refs. [50,51,52] |
| Receiver Sensitivity | −48 dBm [48] |
| Max. Transmit Power | 26 dBm [48] |
| Max. Attenuation Loss | −67 dBm in Section 5 |
| Max. Transmit Distance | 300 km in Section 5 |
| Requirement | Parameter |
|---|---|
| Experimental investigations implemented | Huawei-Labs |
| Experimental investigations collected | Huawei NCE servers |
| System applied | High-speed capacity DWDM system |
| Standard optical fiber | SMF G.652 |
| Wavelength | 1550 nm |
| Fiber attenuation coefficient | 0.22 dB/km |
| Events created on the applied system | (1) Fiber Cuts (2) Fiber Contamination (3) Fiber Burning (4) Connector insertion loss (5) Interconnected Fiber Cable (6) Fiber bending |
| Detection Signals Generated by | EDFA Optical Amplifier |
|---|---|
| Fiber standard | G.652 SMF |
| Wavelength | 1550 nm |
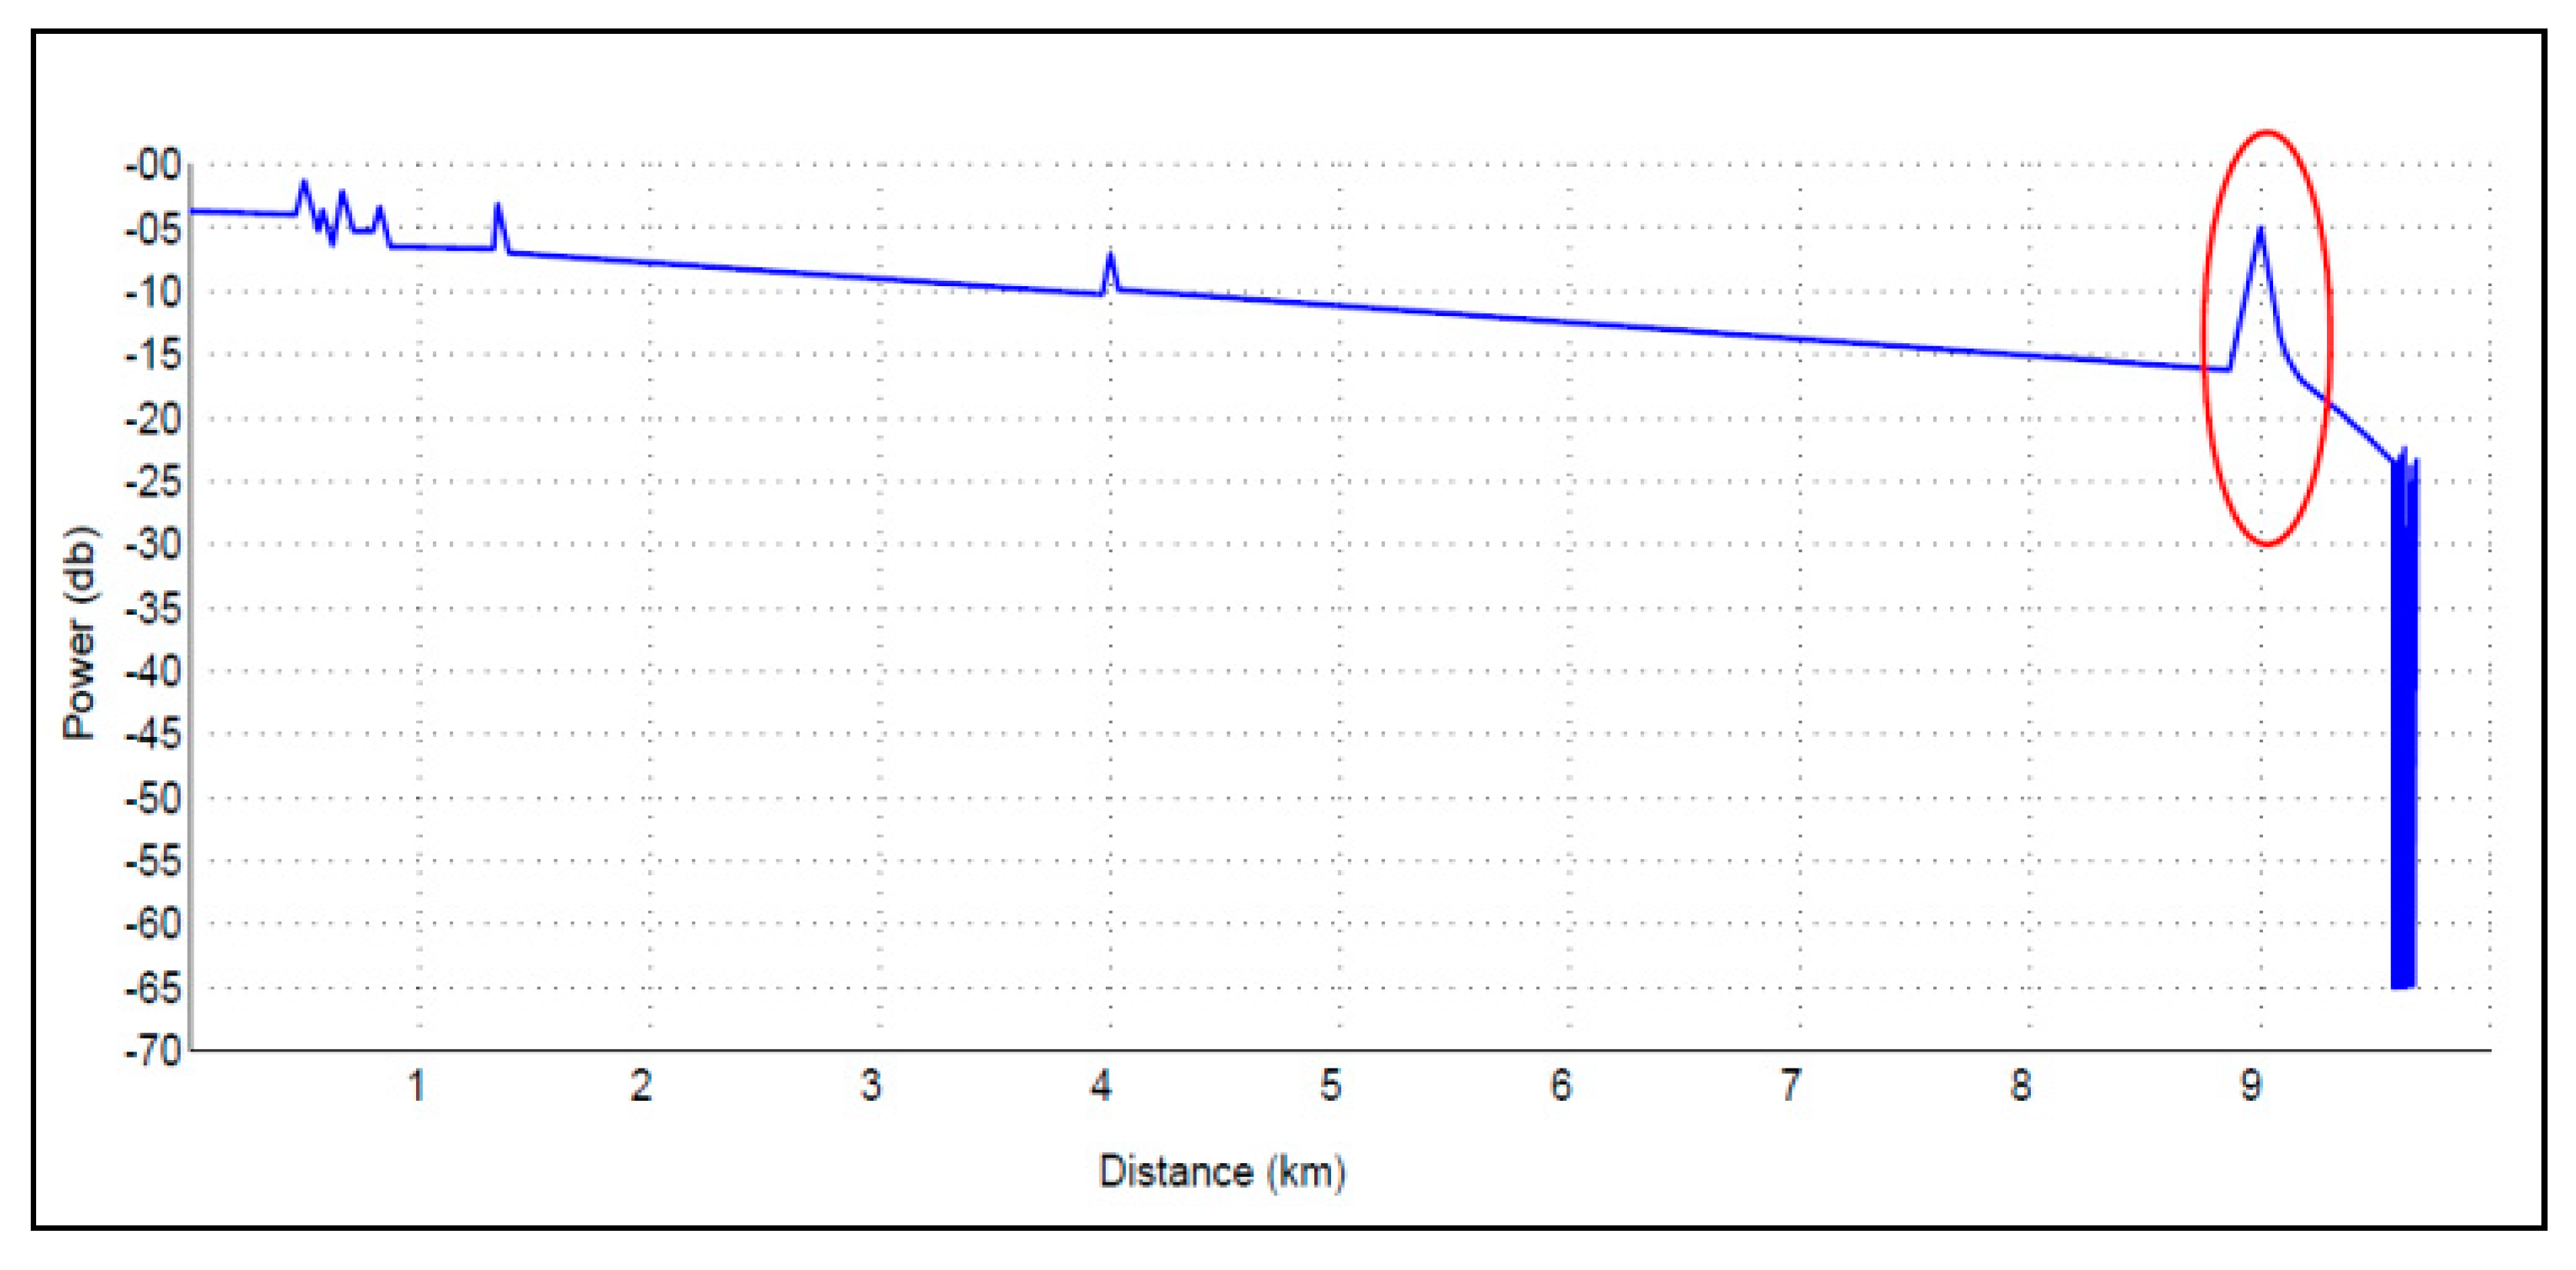
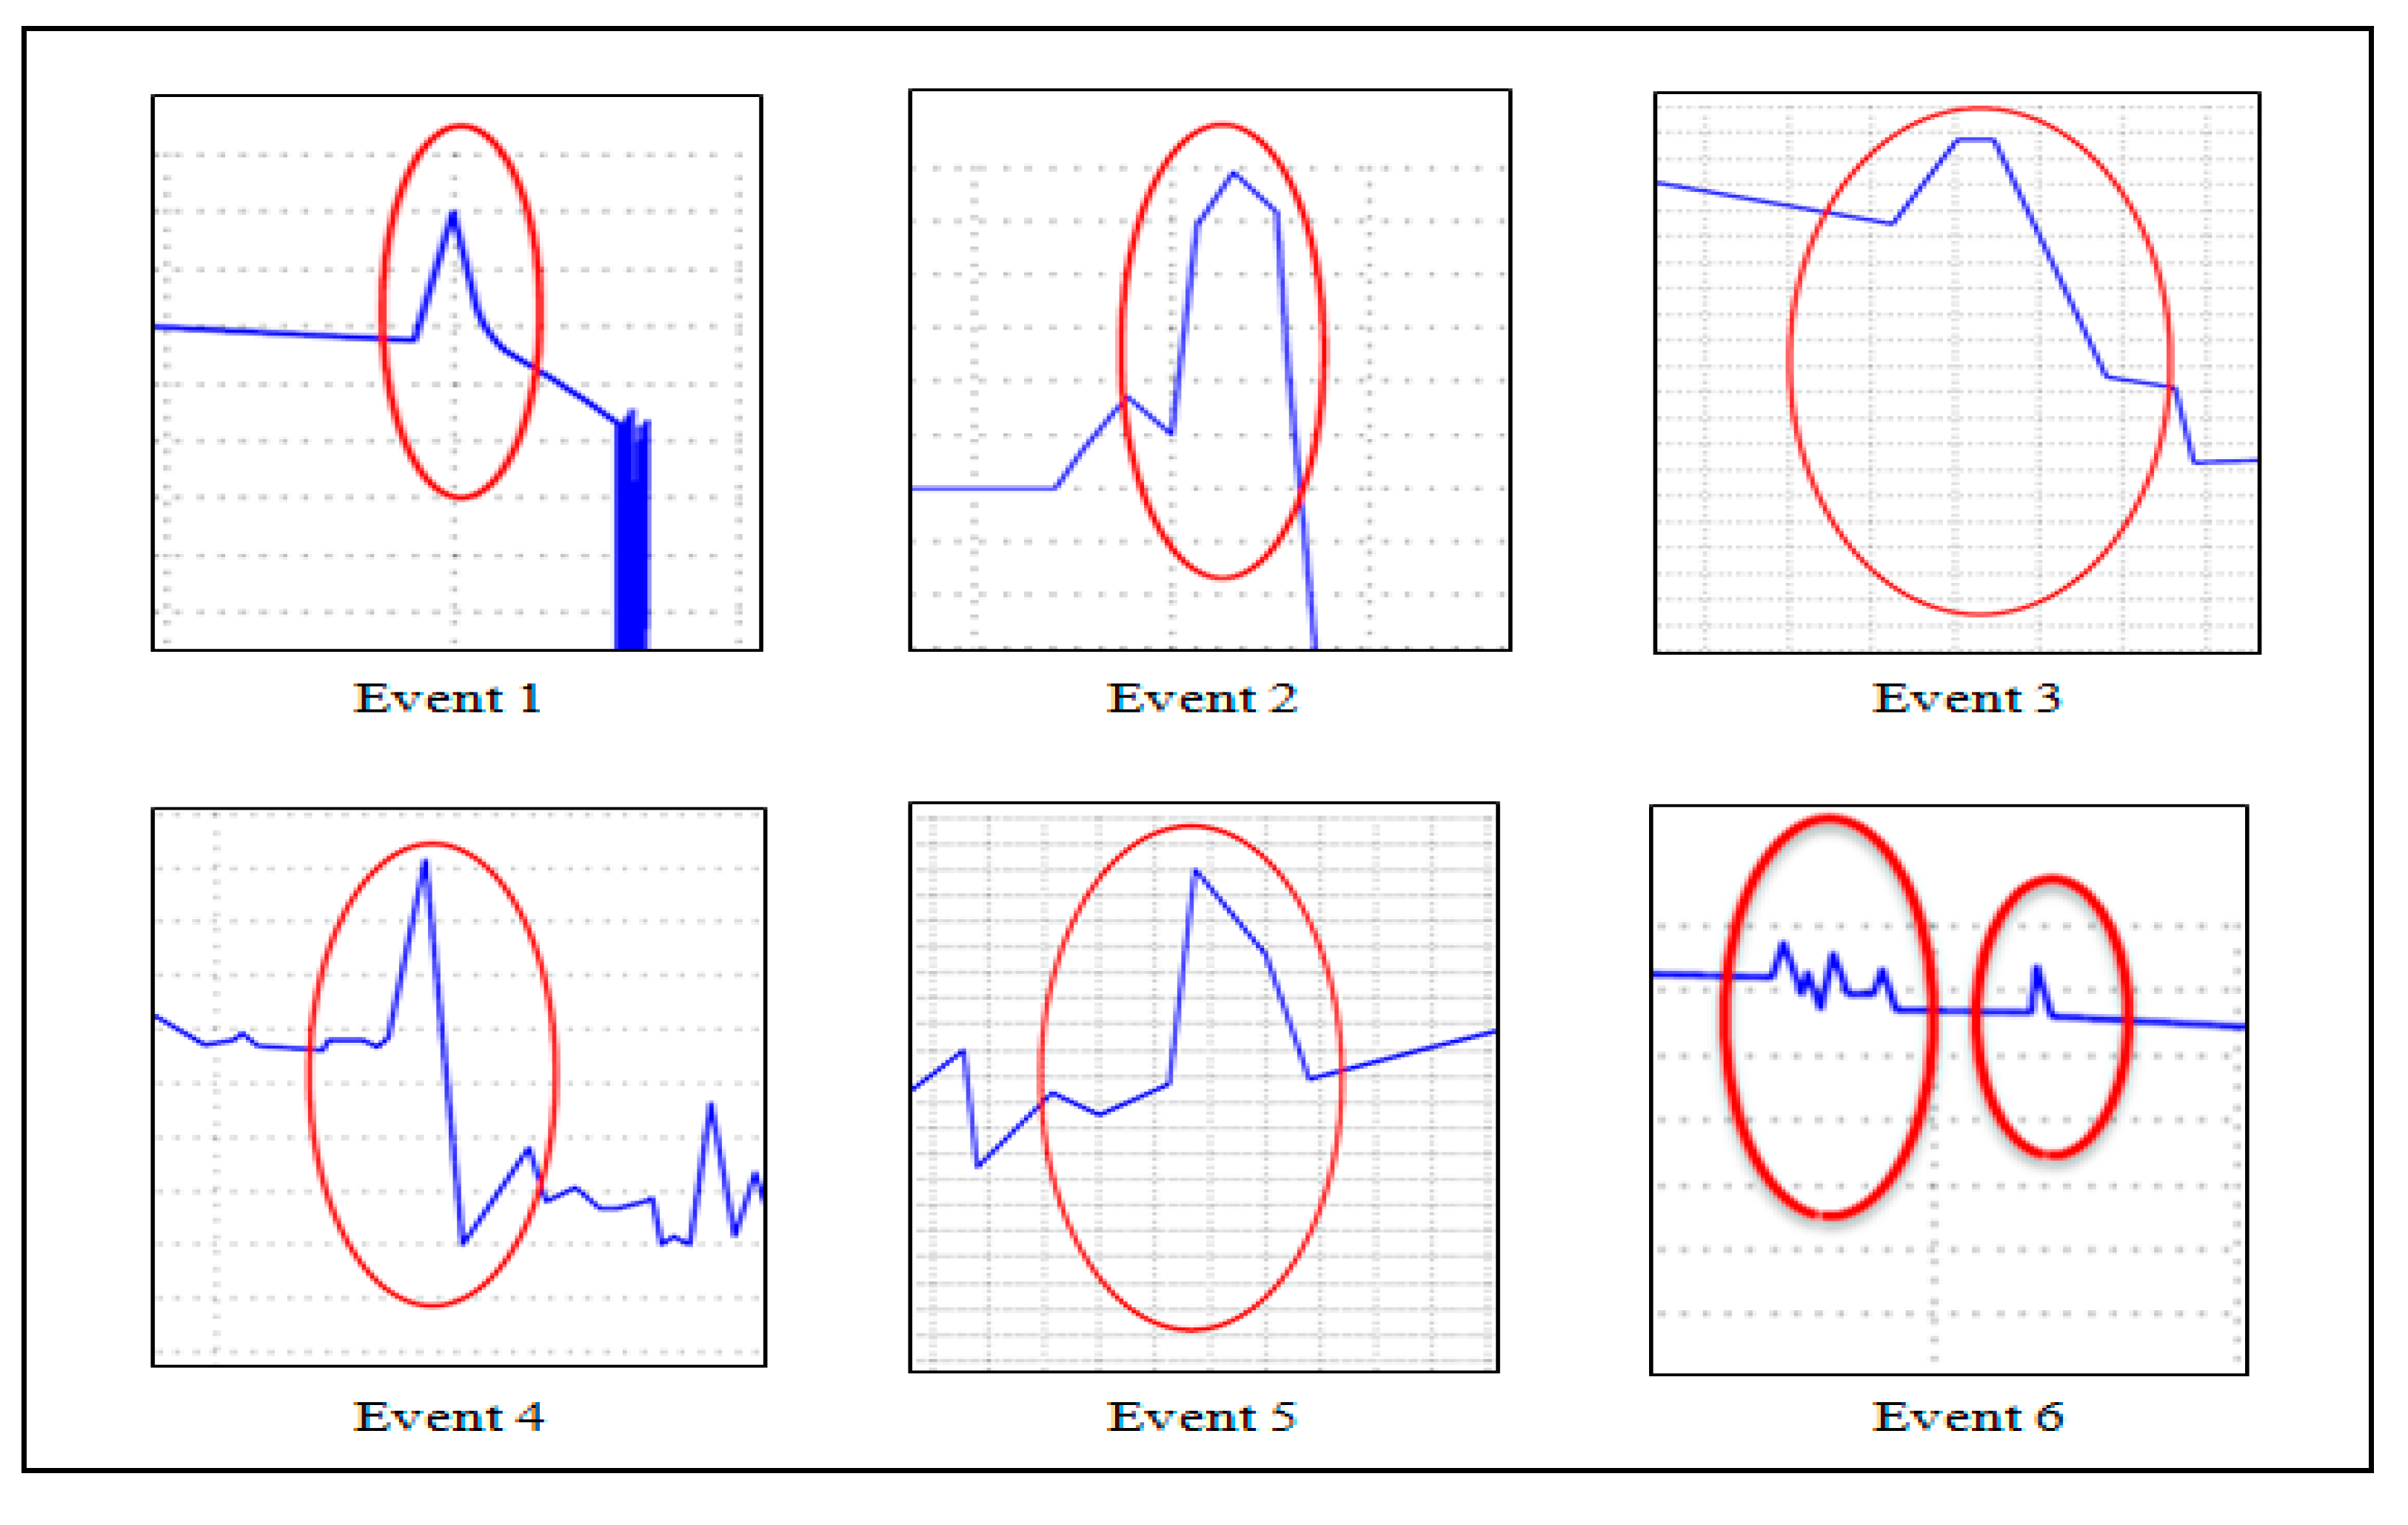
| Defect detected | The shape of a specific pattern indicated to fiber break |
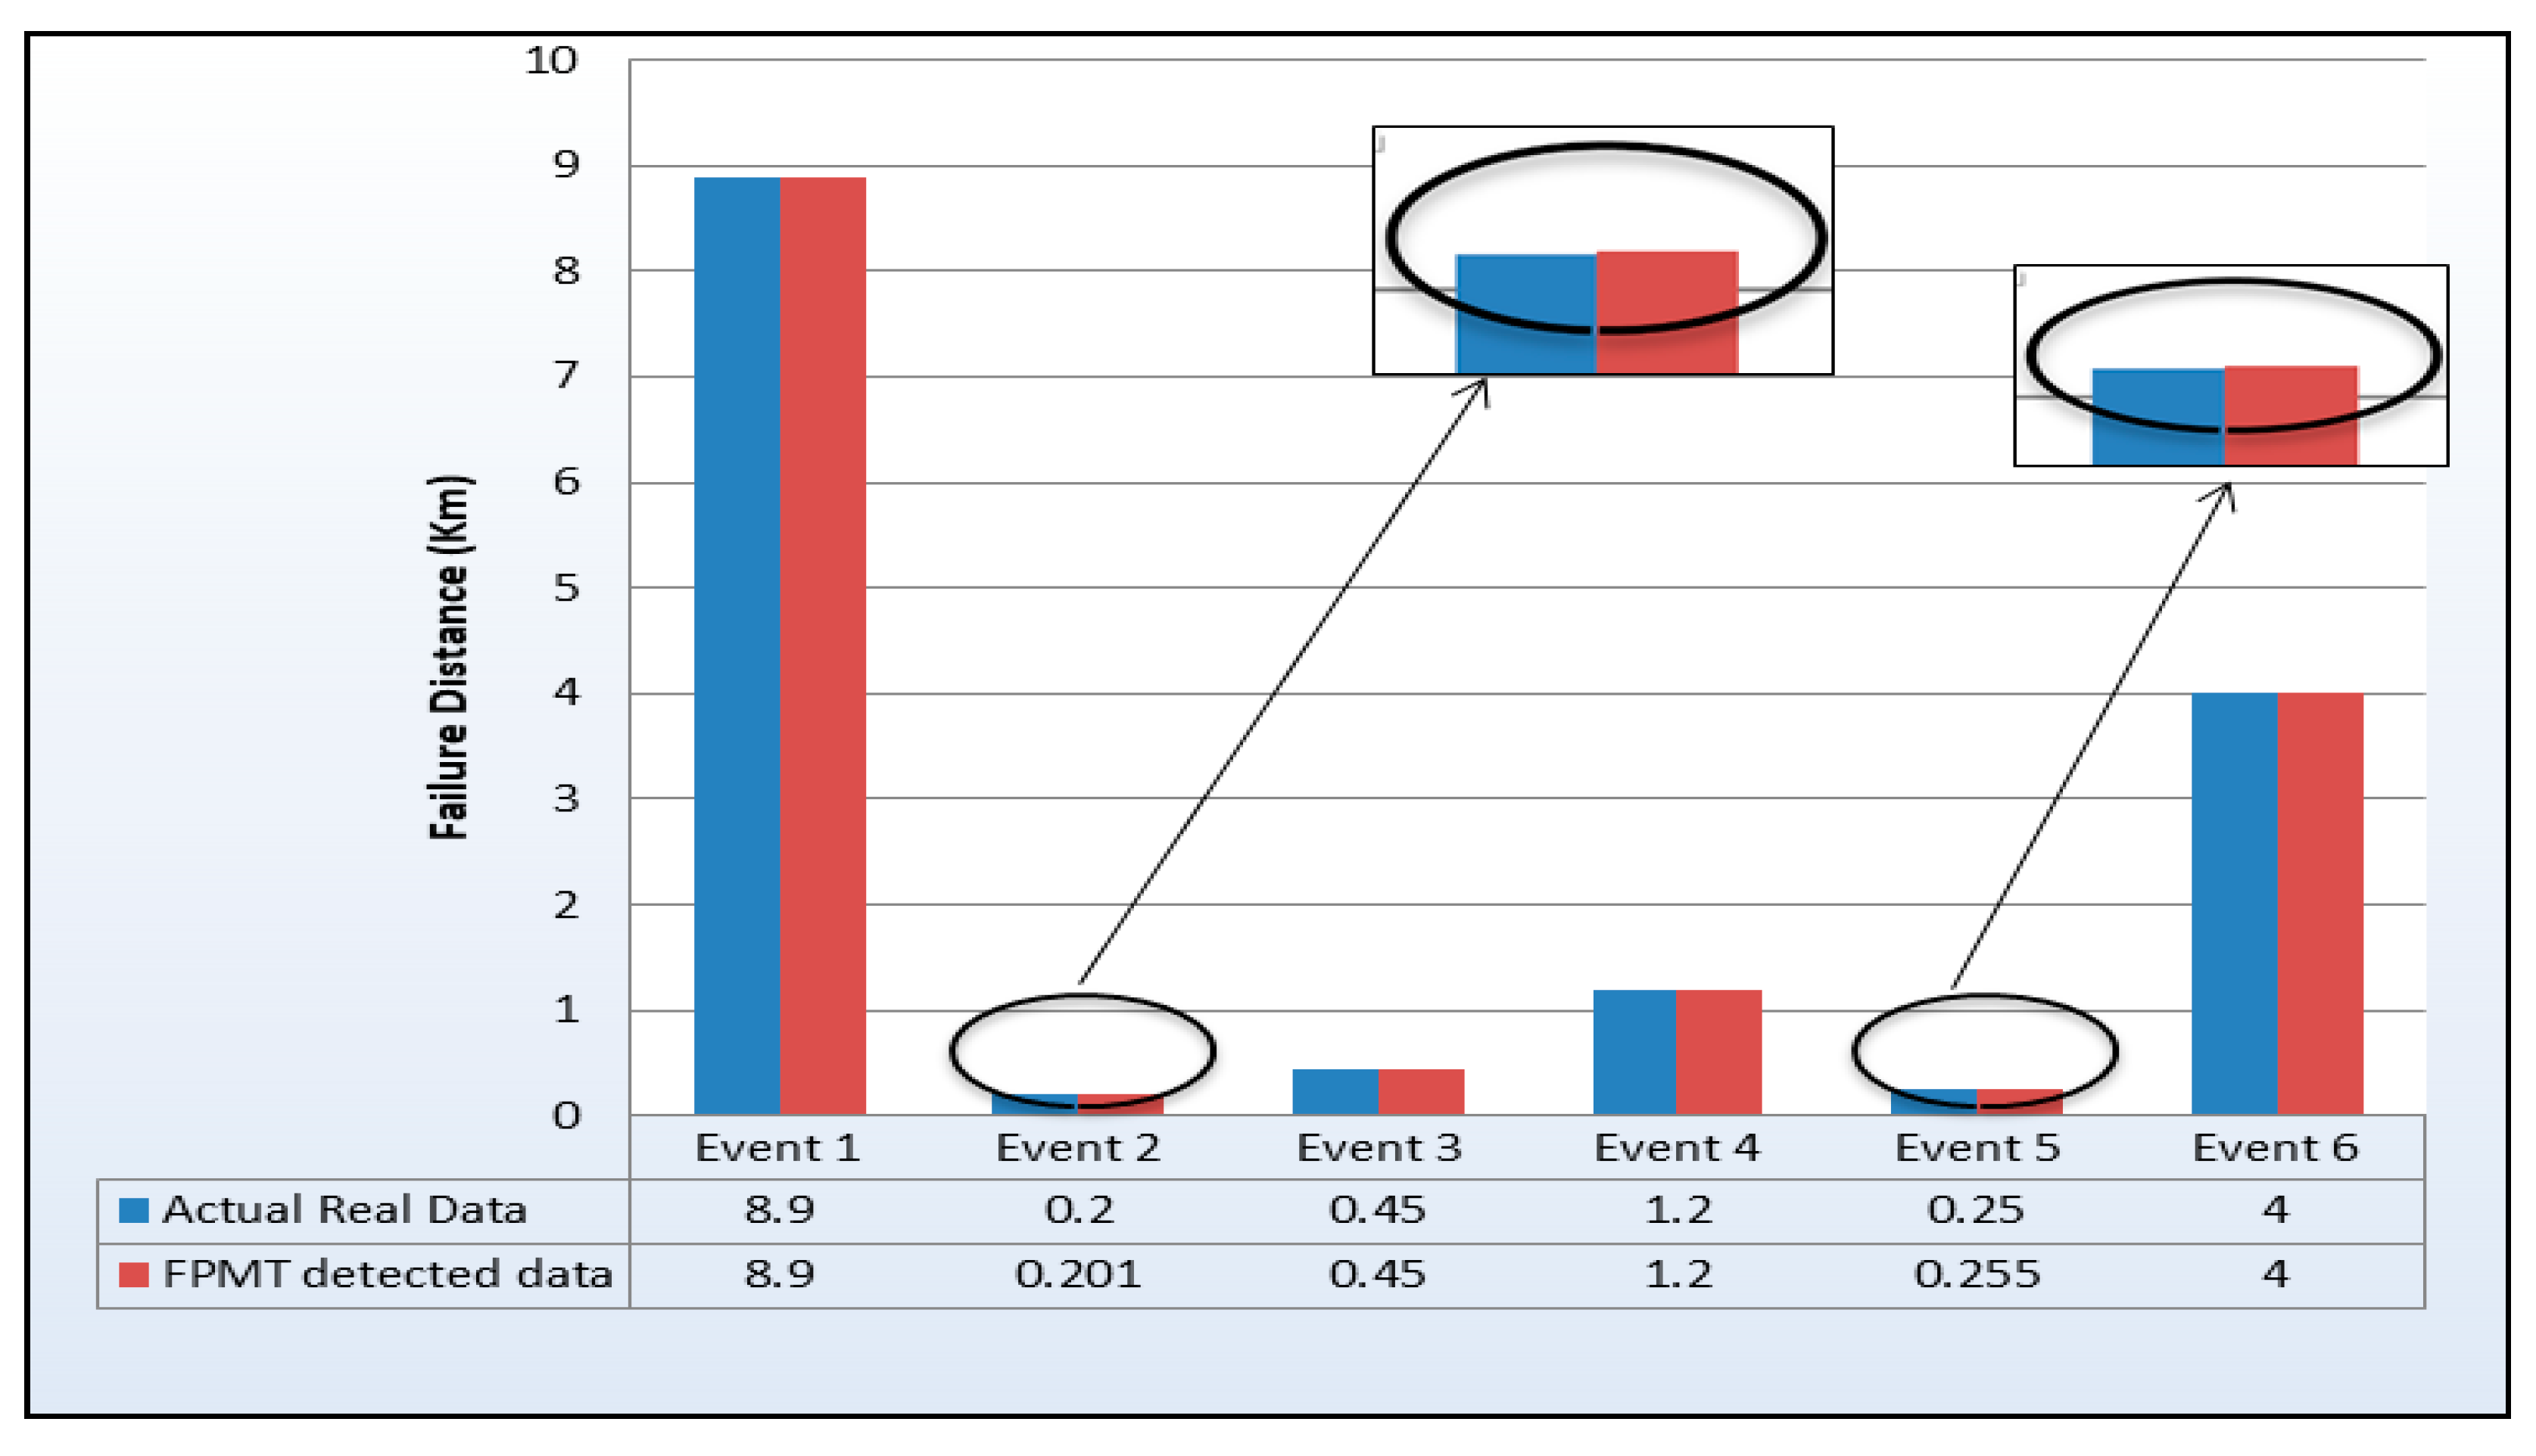
| FPMT fault location distance | 8.9 km |
| Reflection value | −15 dB |
| Detection Signals Generated by | EDFA Optical Amplifier |
|---|---|
| Fiber standard is | G.652 SMF |
| Wavelength | 1550 nm |
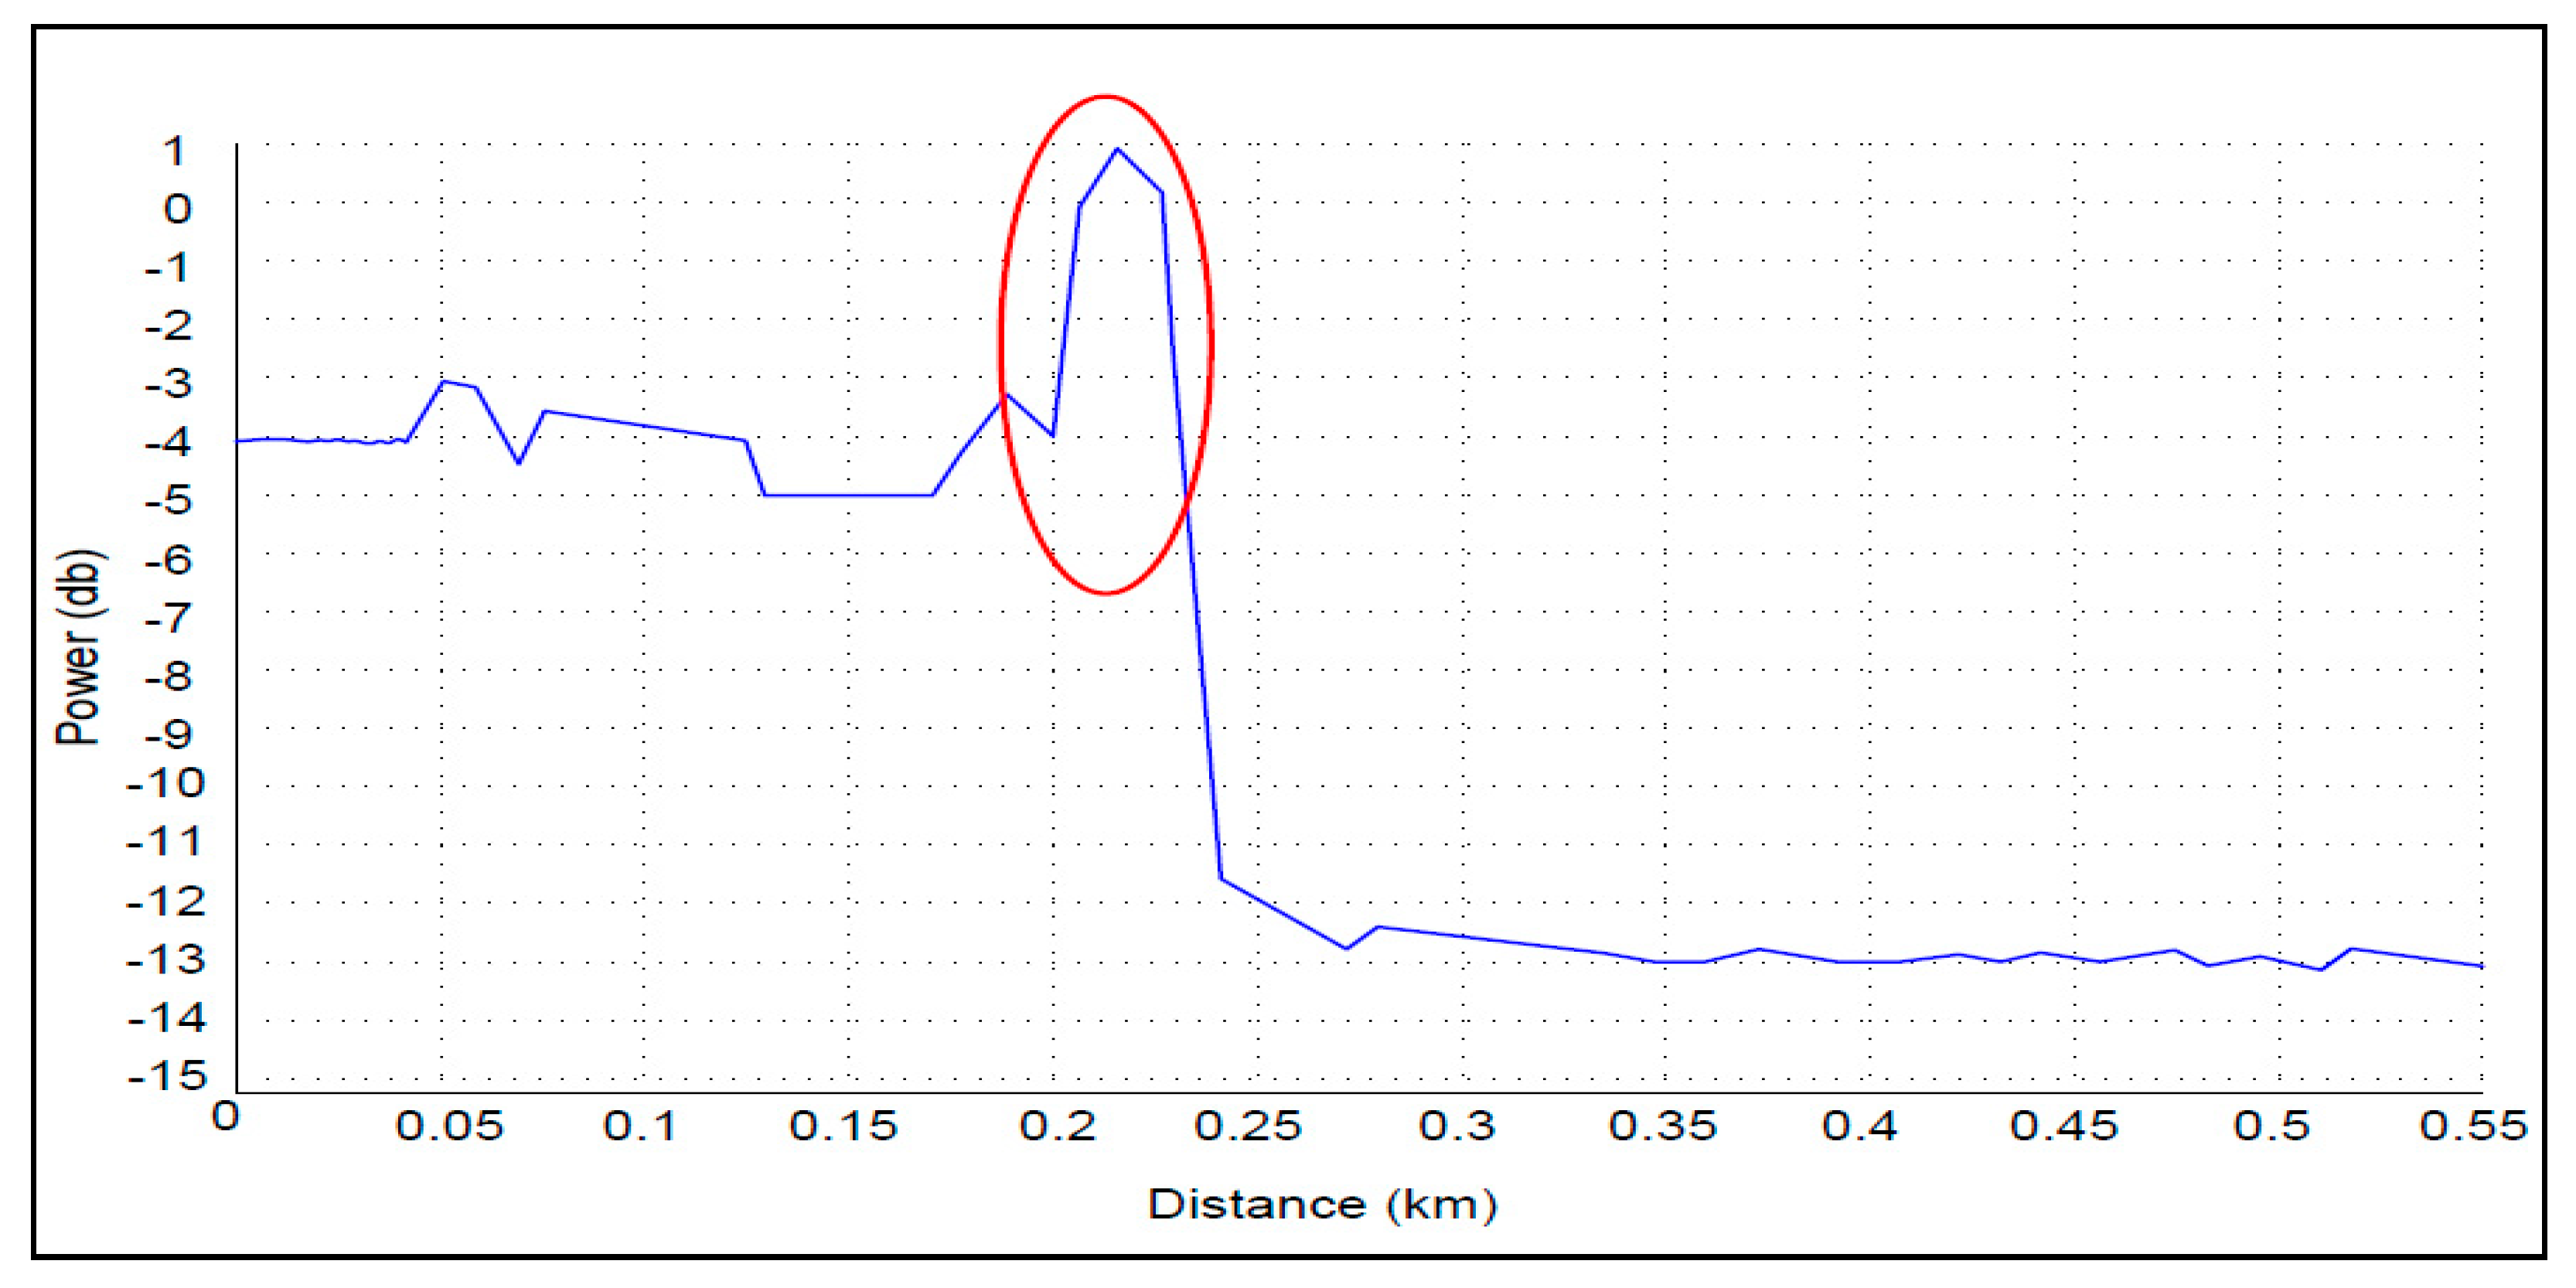
| Defect detected | The shape of a specific pattern indicated fiber-to-end-face contamination |
| FPMT fault location distance | 0.201 km |
| Reflection value | −4 dB |
| Detection Signals Generated by | EDFA Optical Amplifier |
|---|---|
| Fiber standard | G.652 SMF |
| Wavelength | 1550 nm |
| Defect detected | The shape of a specific pattern indicates fiber end-face burning |
| FPMT fault location distance | 0.45 km |
| Reflection value | −8 dB |
| Detection Signals Generated by | EDFA Optical Amplifier |
|---|---|
| Fiber standard | G.652 SMF |
| Wavelength | 1550 nm |
| Defect detected | The pattern shape refers to the large insertion loss on the connector |
| FPMT fault location distance | 1.2 km |
| Reflection value | −2 dB |
| Detection Signals Generated by | EDFA Optical Amplifier |
|---|---|
| Fiber standard | G.652 & G.653 SMF |
| Wavelength | 1550 nm |
| Defect detected | The shape of a specific pattern indicates a mismatch between fiber cables |
| FPMT fault location distance | 0.255 km |
| Reflection value | −1.4 dB |
| Detection Signals Generated by | EDFA Optical Amplifier |
|---|---|
| Fiber standard | G.652 SMF |
| Wavelength | 1550 nm |
| Defect detected | The shape of a specific pattern indicates fiber bending |
| FPMT fault location distance | 0.5 km, 0.6 km, 0.7 km, 1.2 km, 4 km |
| Reflection value | −2 dB, −3 dB, −4 dB, −3 dB, −7 dB |
| Parameter | FPMT Integrating OSC Board | FPMT Integrating EDFA Board |
|---|---|---|
| Longest distance to detecting optical line defects (km) | 150 km | 300 km |
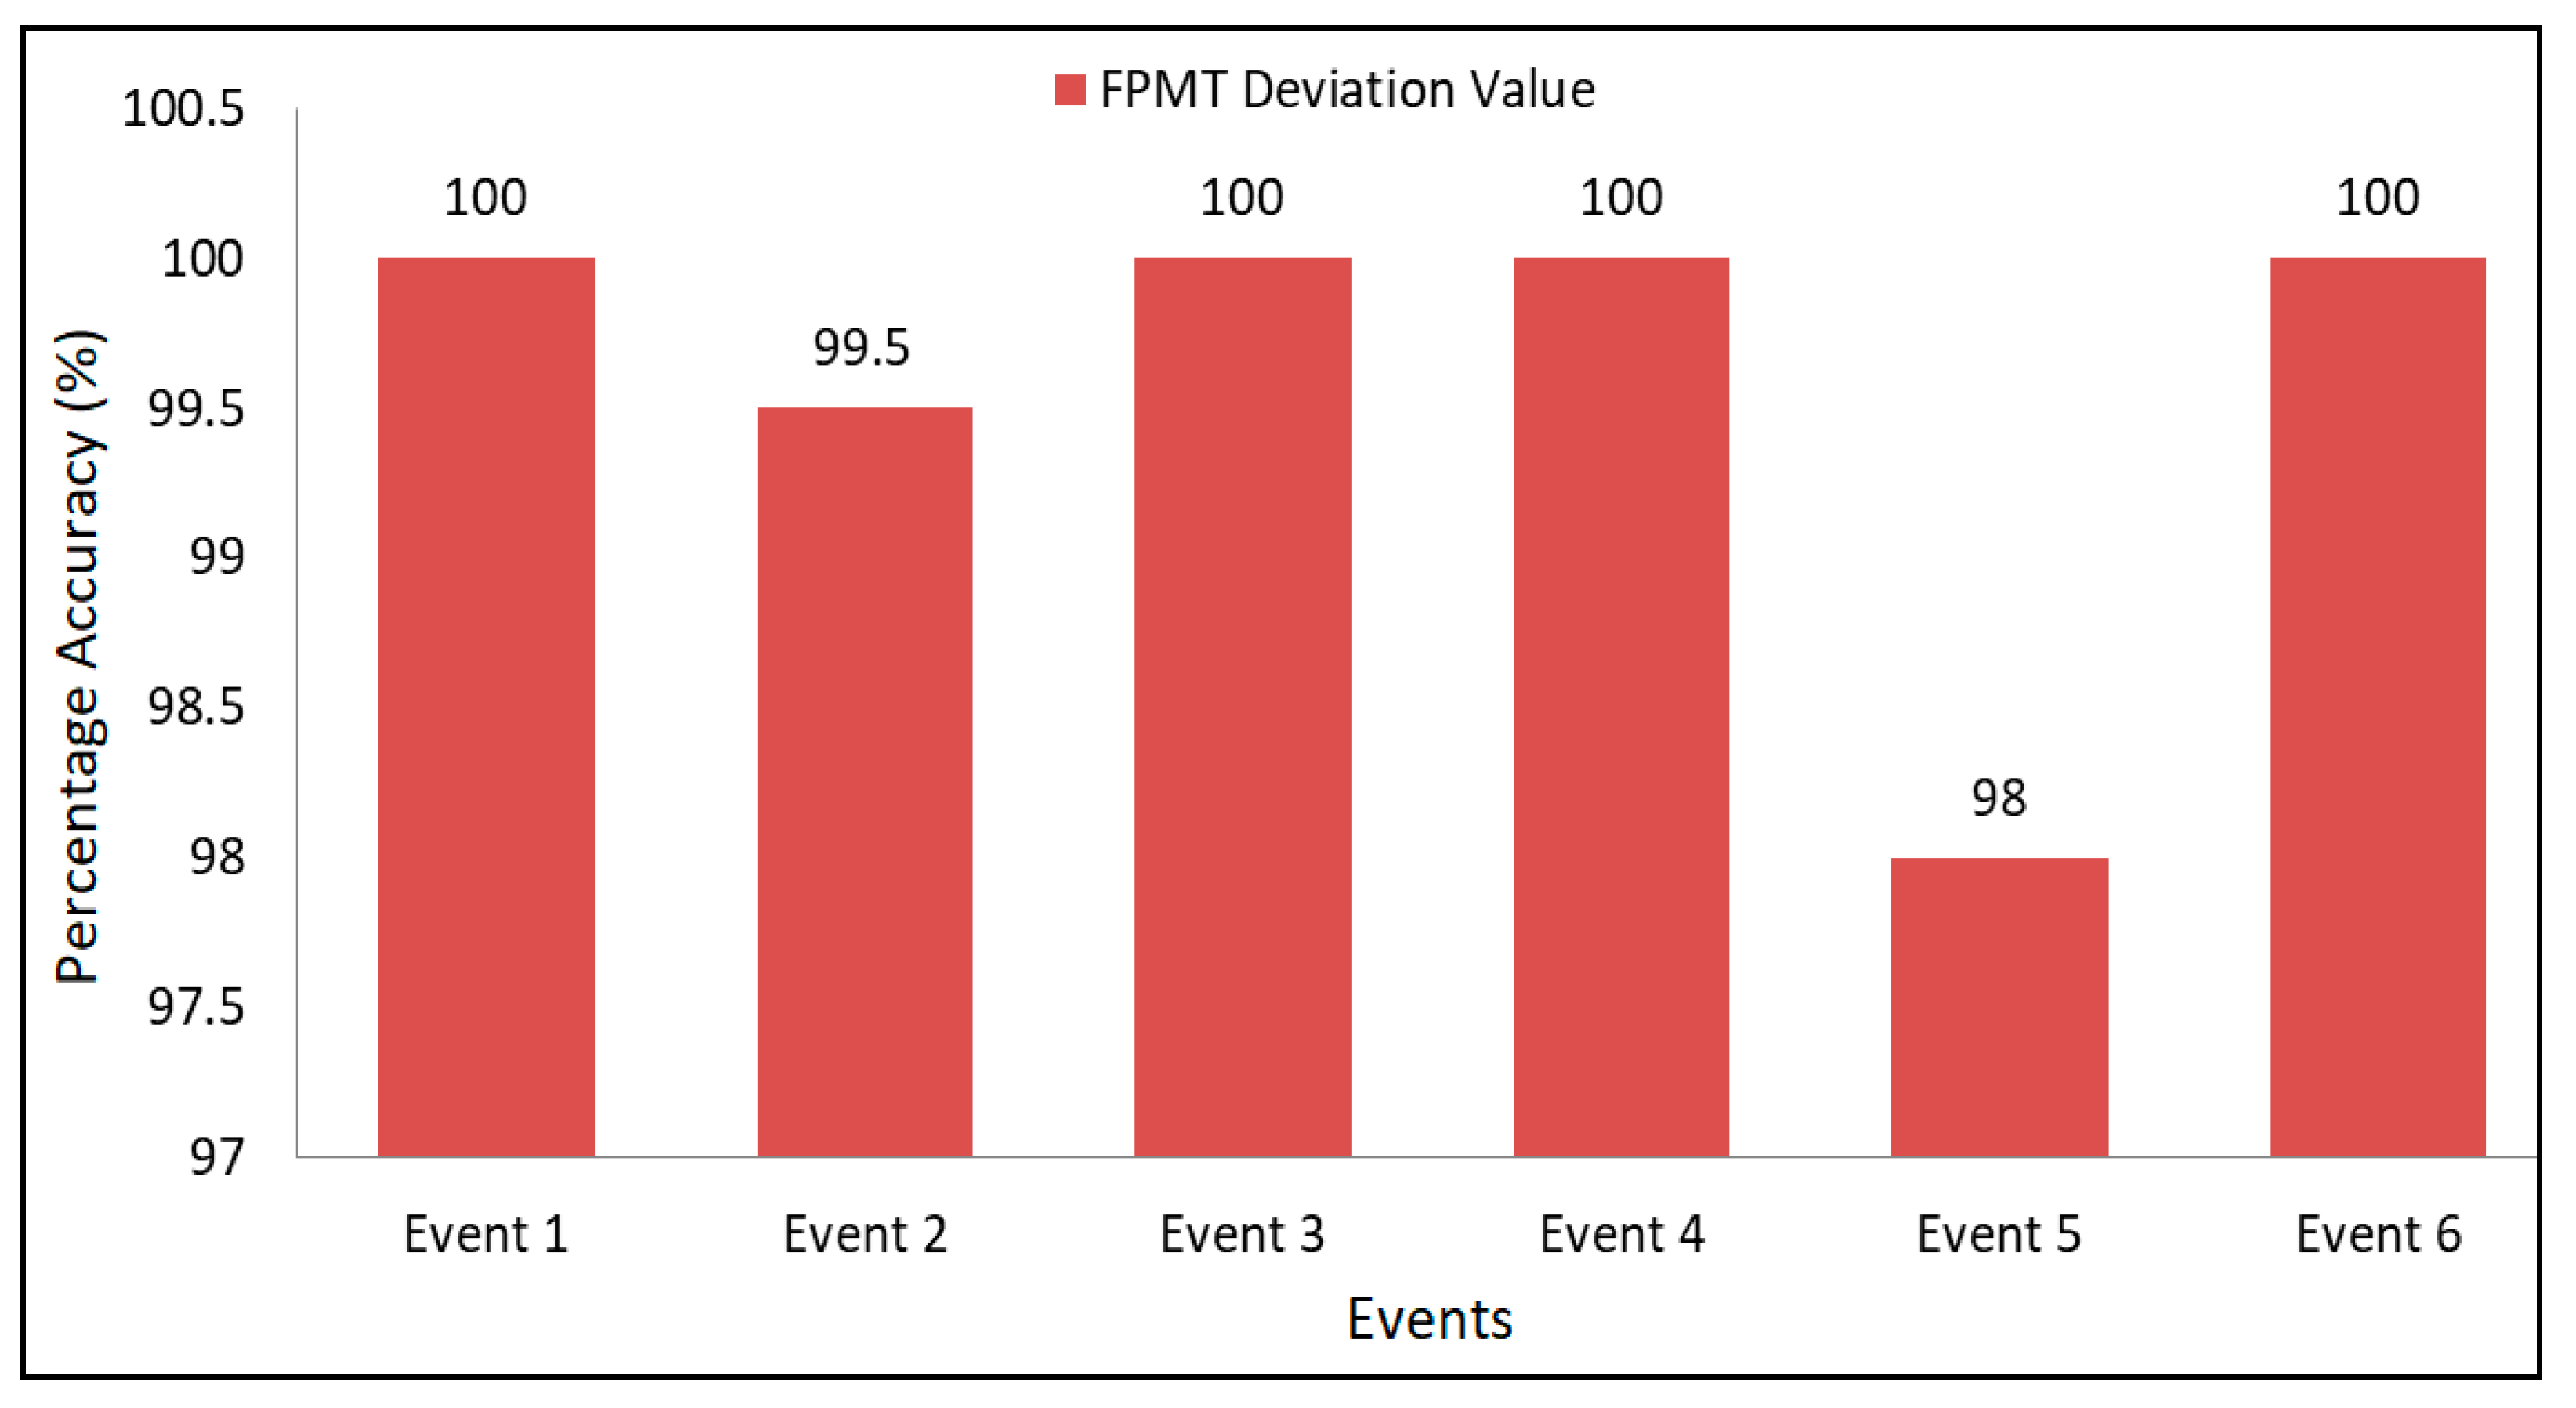
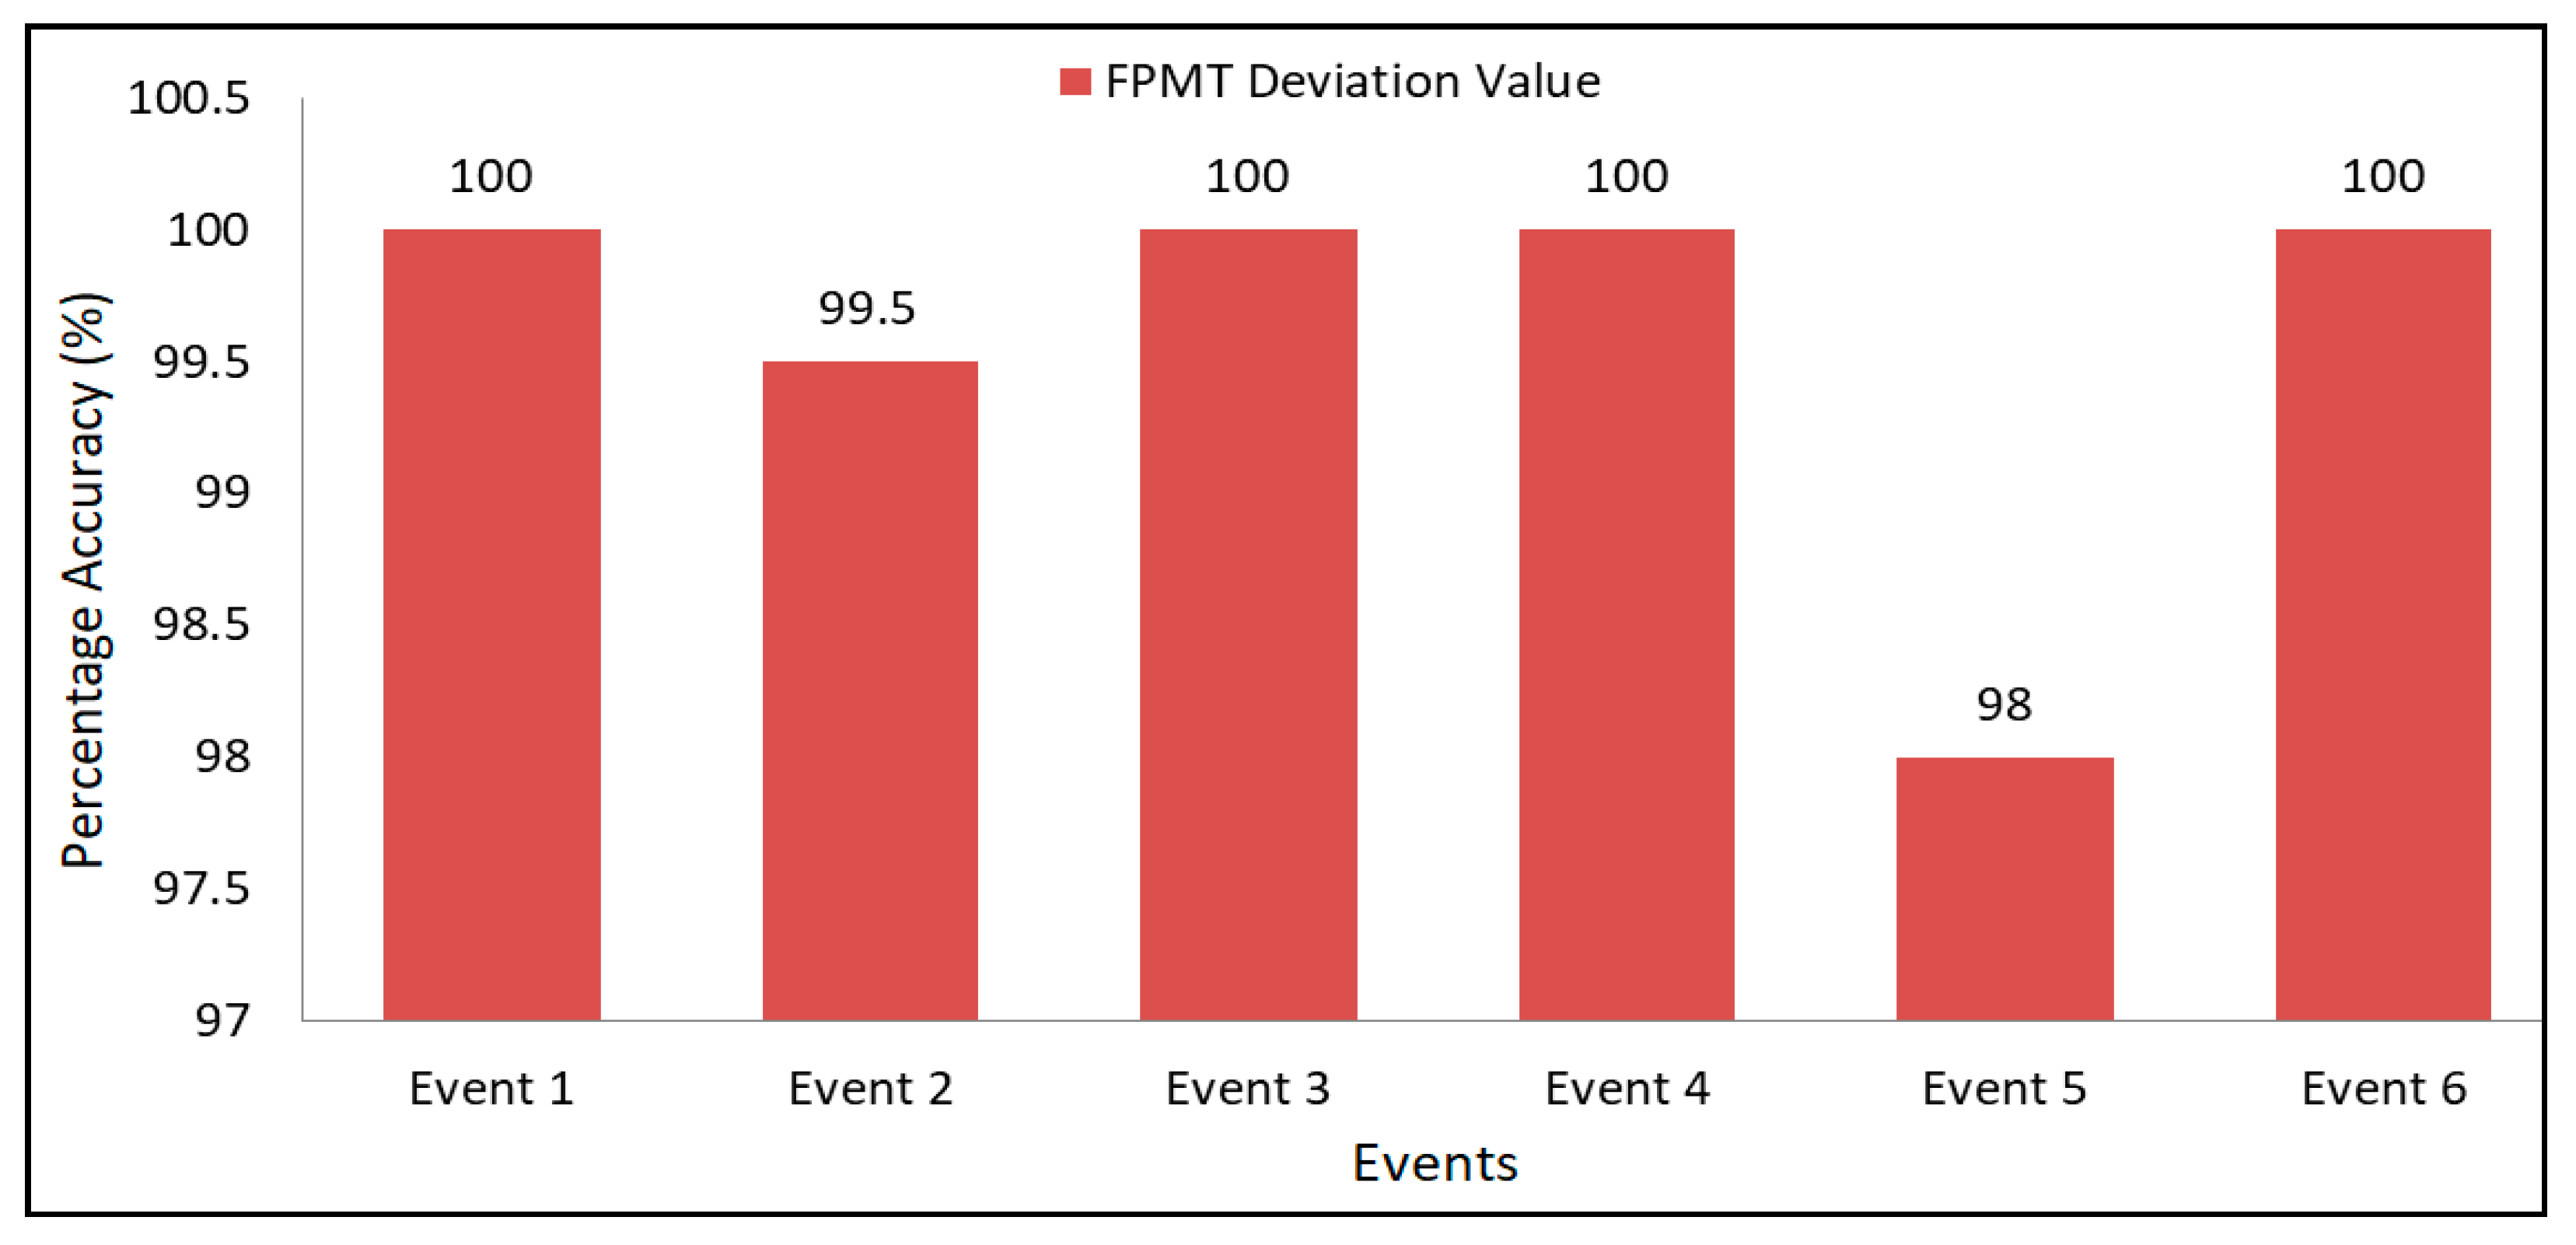
| Measurement accuracy for defect location (%) | 99.8% | 99.9% |
| Tolerance (m) | 10–20 m | 1–5 m |
| Insertion loss (dB) | 1 dB | 0 dB |
| Number of failure types detected and identified in practical experiments | 5 | 6 |
| Longest distance to detecting optical line defects (km) | 150 km | 300 km |
| Methodology | Identification Accuracy | Results (Error) | Classify Faults Type | Faults Type | Ref. |
|---|---|---|---|---|---|
| Fault detection depends on digital signal processing (DSP) algorithms detection, such as pre-error correction (pre-FEC), bit error rate (BER), received optical power (ROP), optical spectra, and filter weights. | -- | 0.14–1.41% | -- | (a) Soft failure without displaying any types. | (2019). [39] |
| Fault detection depends on the digital spectra in soft failure detection (SFD) and soft failure identification (SFI). | 99.55% | 0.42–1.47% | -- | (a) Soft failure without displaying any types. | (2020). [40] |
| Fault detection and localization depend on sharing the same transmitter module and performing in sequences, depending on algorithms, and one or many fiber Bragg gratings with different reflection wavelengths are allocated to each last user for failure detection. | 99.22% 0.005–0.01 dB 2.4–7.7 m | 0.2–0.8% | -- | (a) Fiber breaks. (b) Research mentioning the possibility of measuring other errors not displayed. | (2022). [41] |
| Fault detection depends on the recognition of the reflection spectrum generated by each single-fiber Bragg grating. | 99.5% 0.005–0.01 dB 2.4–7.7 m | 0.16–0.5% | Faults characterization high accurate | (a) Fiber breaks. (b) Research mentions the possibility of measuring other errors not displayed. | (2022). [42,43] |
| Fault detection depends on the pattern shape of the reflection test signal generated from the FPMT technique integrated with the OSC board. | 99.8% 10–20 m | 0.02% | Faults characterization high accurate | (a) Fiber break. (b) Fiber contamination. (c) Fiber end-face burning. (d) Connector loss. (e) Fiber interconnection. | (2022). [16] |
| Fault detection depends on the pattern shape of the reflection test signal generated from the FPMT technique integrated with the EDFA board. | 99.9% 1–5 m | 0.01% | Faults characterization high accurate | (a) Fiber break. (b) Fiber contamination. (c) Fiber end-face burning. (d) Connector loss. (e) Fiber contamination. (f) Fiber bending. | (2022). [proposed improved technique] |
Disclaimer/Publisher’s Note: The statements, opinions and data contained in all publications are solely those of the individual author(s) and contributor(s) and not of MDPI and/or the editor(s). MDPI and/or the editor(s) disclaim responsibility for any injury to people or property resulting from any ideas, methods, instructions or products referred to in the content. |
© 2023 by the authors. Licensee MDPI, Basel, Switzerland. This article is an open access article distributed under the terms and conditions of the Creative Commons Attribution (CC BY) license (https://creativecommons.org/licenses/by/4.0/).
Share and Cite
Ibrahim, A.A.; Fouad, M.M.; Hamdi, A.A. Remote Real-Time Optical Layers Performance Monitoring Using a Modern FPMT Technique Integrated with an EDFA Optical Amplifier. Electronics 2023, 12, 601. https://doi.org/10.3390/electronics12030601
Ibrahim AA, Fouad MM, Hamdi AA. Remote Real-Time Optical Layers Performance Monitoring Using a Modern FPMT Technique Integrated with an EDFA Optical Amplifier. Electronics. 2023; 12(3):601. https://doi.org/10.3390/electronics12030601
Chicago/Turabian StyleIbrahim, Ahmed Atef, Mohammed Mohammed Fouad, and Azhar Ahmed Hamdi. 2023. "Remote Real-Time Optical Layers Performance Monitoring Using a Modern FPMT Technique Integrated with an EDFA Optical Amplifier" Electronics 12, no. 3: 601. https://doi.org/10.3390/electronics12030601