Article

Alleviating Class-Imbalance Data of Semiconductor Equipment Anomaly Detection Study

Department of Electronics Engineering, Myongji University, Myongji-ro 116, Yongin-si 17058, Republic of Korea
*
Author to whom correspondence should be addressed.
Electronics 2023, 12(3), 585; https://doi.org/10.3390/electronics12030585
Submission received: 8 January 2023 / Revised: 21 January 2023 / Accepted: 21 January 2023 / Published: 24 January 2023
(This article belongs to the Special Issue Recent Advances in Data Science and Information Technology)

Abstract

:
Plasma-based semiconductor processing is highly sensitive, thus even minor changes in the procedure can have serious consequences. The monitoring and classification of these equipment anomalies can be performed using fault detection and classification (FDC). However, class imbalance in semiconductor process data poses a significant obstacle to the introduction of FDC into semiconductor equipment. Overfitting can occur in machine learning due to the diversity and imbalance of datasets for normal and abnormal. In this study, we suggest a suitable preprocessing method to address the issue of class imbalance in semiconductor process data. We compare existing oversampling models to reduce class imbalance, and then we suggest an appropriate sampling strategy. In order to improve the FC performance of plasma-based semiconductor process data, it was confirmed that the SMOTE-based model using an undersampling technique such as Tomek link is effective. SMOTE-TOMEK, which removes multiple classes and makes the boundary clear, is suitable for FDC to classify minute changes in plasma-based semiconductor equipment data.

1. Introduction

1.1. Advanced Process Control in Semiconductor Process

The use of the vast amount of data generated during the semiconductor manufacturing process has become increasingly demanding because of recent advancements in machine learning and artificial intelligence. Conventionally, semiconductor process control has relied on engineering heuristics and statistics, but more scientific data-driven process control is recommended [1]. Moreover, the increased number of required process steps for the advanced semiconductor-device fabrication results in a much larger quantity of process and metrology data being available for the data-driven process control. A semiconductor manufacturing process contains both direct and indirect information on the process, as well as numerous effects to enhance the manufacturing efficiency by finding the relationship between the data collected from the equipment and the wafer process result. As a result, the semiconductor industry expects that advanced process control (APC) helps their manufacturing efficiency [2]. APC is a methodology that involves data collecting, data processing, and controlling devices throughout the process based on the data acquired from equipment, sensors, and wafer metrology. Before employing APC, it is beneficial to consider the fault detection and classification (FDC) system, which collects the equipment status data in the form of state variable identification (SVID). An FDC system monitors equipment and sensor data to identify equipment anomalies, analyzes them, and identifies their causes. The collected and stored data become available for engineers to visit the data repository to see how the equipment condition is maintained, and any anomaly from the equipment took place during the manufacturing processes. The advent of FDC systems is essential to boost data processing as semiconductor processes become more complicated. Beyond the FDC system, the APC system is designed to respond fast, reduce equipment downtime, and increase semiconductor process productivity. Currently, the performance required for the FDC algorithm varies depending on the restrictions imposed by each process, data, and equipment; thus, the suitable algorithm must be used [3].

1.2. Literature Review on FDC/APC

To introduce the APC system to the semiconductor process, it is first necessary to select appropriate fault detection (FD) and fault classification (FC) algorithms. Studies have been conducted to select an appropriate algorithm, and boosting algorithms and deep learning-based algorithms have been proposed in previous studies [4]. Machine learning has been developed because of the significant increase in computing performance as semiconductor technology has advanced. As machine learning technology advances, attempts to apply it to numerous industries have increased, and process diagnostic studies to improve the yield of semiconductor processes based on machine learning technology have been performed [5]. FDC is one of the most active fields of machine learning-based process diagnosis research. One of the main causes of yield reduction is process downtime resulting in equipment failure, and experiments have been undertaken to conduct FDC using various algorithms to detect such equipment failures. In a previous study, we analyzed semiconductor process equipment data using a boosting-based algorithm, which generally performs well. The classification performance in defect data was found to be worse due to the imbalance between normal and defect data in the semiconductor equipment data, despite the boosting-based algorithms performing well in FDC of semiconductor equipment. Methods based on semi-supervised learning, such as label propagation and one-class support vector machine, have been proposed to address these issues, but classifying defects remains difficult due to data imbalance [6].
The data class imbalance is a challenge in the anomaly detection and data classification study in the semiconductor manufacturing domain. It is straightforward that the dependability of the equipment has been increased as the technology improves, but manufacturing losses when the equipment failure or malfunction have become much greater than ever before since the equipment now incorporate much more expensive semiconductor chips under fabrication. In other words, the importance of the FDC of semiconductor equipment became more emphasized, but the dataset diversity and imbalance for normality and anomalies may result in overfitting in machine learning. The class imbalance problems can be alleviated by either undersampling or oversampling. Undersampling may be useful for datasets with a lower ratio of class imbalance with replication of patterns [7]. Oversampling is based on the generation of the existing dataset in the manner of copy or creation. One of the most well-known oversamplings is synthetic minority oversampling technique (SMOTE), and a rule classification with an oversampling approach for imbalanced data in semiconductor chip package production lines has recently been reported [8].
The most popular technique for monitoring the plasma process in semiconductor operations is optical emission spectroscopy (OES). Due to its non-invasiveness, OES is typically installed in chambers, and numerous studies are being conducted to make use of it. The amounts of atomic/molecular collisions in the plasma, however, can affect how the output data changes with the plasma glow discharge [9]. In this study, we compared, analyzed, and proposed an appropriate preprocessing method to address the data imbalance issue that frequently afflicts FDC studies using OES data. In Section 2, along with OES and gathered data, the experimental setup for silicon trench etching with SF6, O2, and Ar plasma is described. In Section 3, the sampling model used in the experiment is explained. In Section 4, the FC model employed in the experiment is suggested along with a description of the suitable evaluation methods and data gathered. In Section 5, the findings are arranged and examined.

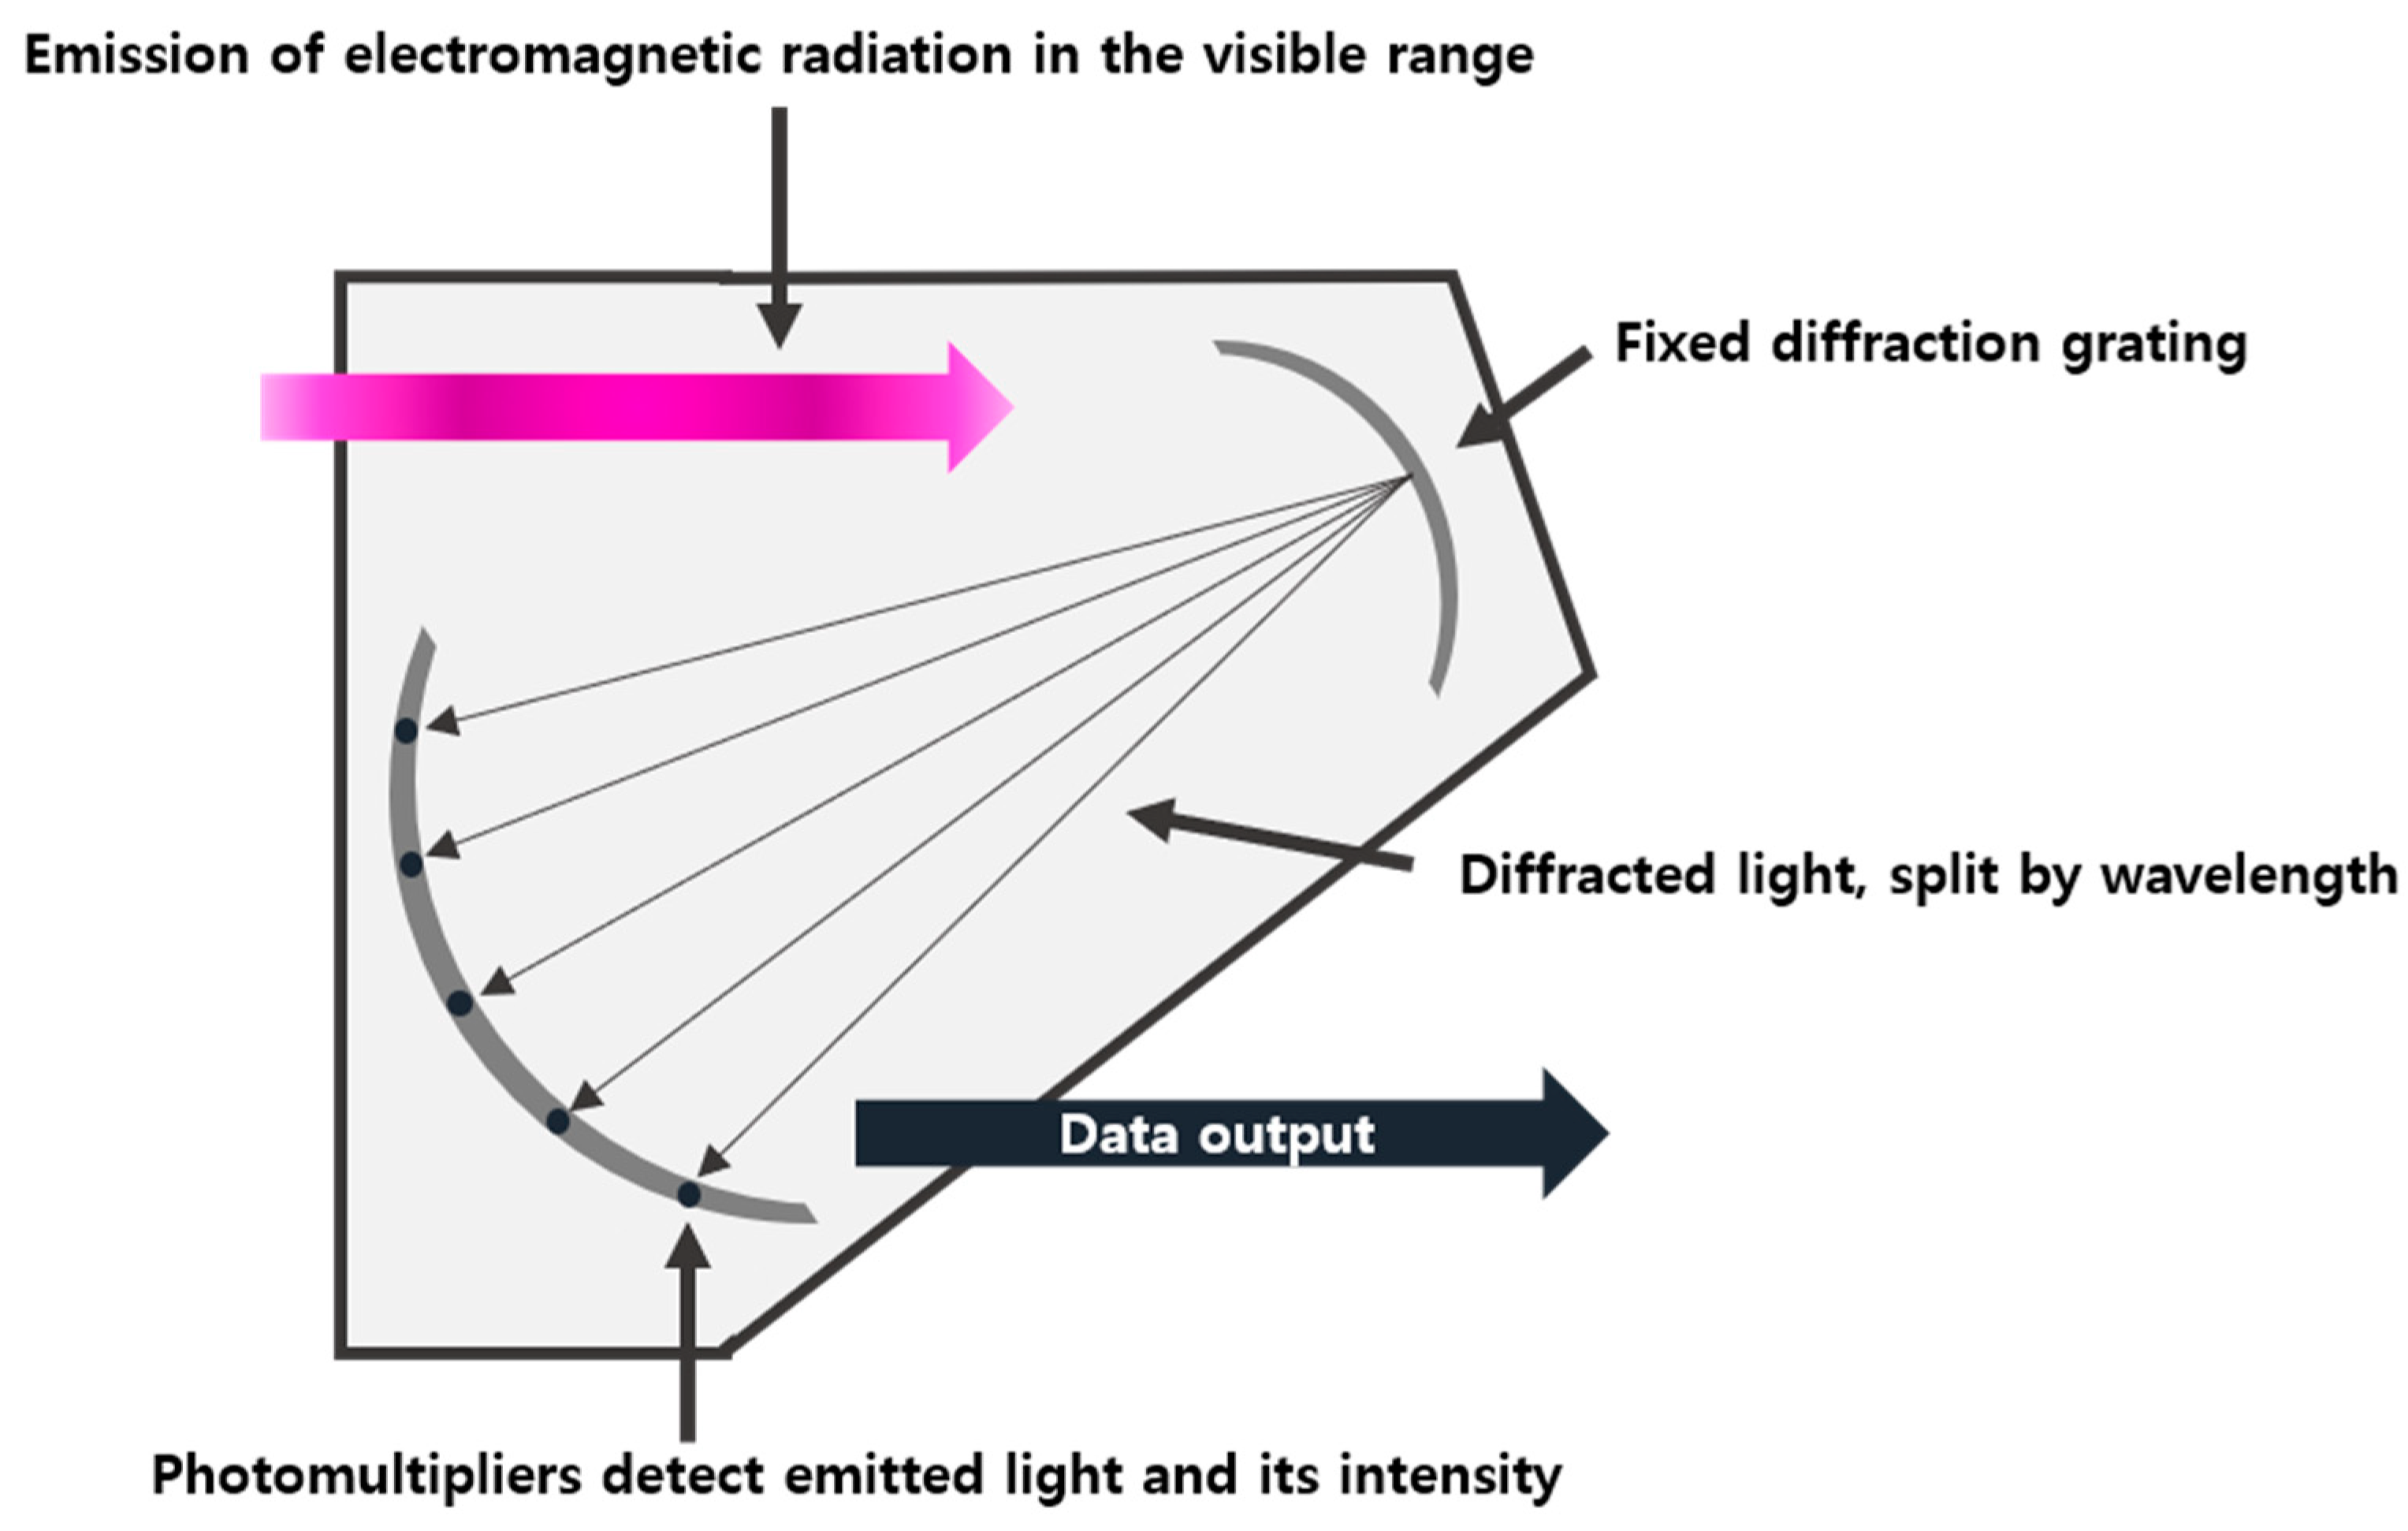
2. Experiment Apparatus

As the degree of integration of semiconductor devices increases dramatically, the manufacturing process becomes more difficult, requiring more processes and equipment. To overcome the limitations of conventional planar NAND, a stacked 3D-NAND flash memory was developed and commercialized. High aspect ratio (HAR) etching necessitates the formation of narrow and deep trenches with a HAR, which necessitates precise etch profile control.
Variations in the process gas flow rate are another factor that can affect the etch profile. A dry etching process using plasma is required for HAR etch. Here, in addition to the F-based gas, a mixture of various gases is used to improve the etch profile. When an O2-containing mixed gas is used, O radicals combine with Si to form SiOxFy on the sidewall to improve the etch profile [9], implying that the etch profile is affected by the process’s gas flow rate change. The reaction of the gas injected during the process can be checked through the plasma, and the relative amounts of ions and radicals inside the chamber can be estimated by analyzing the reaction that occurs in the plasma through the sensor. As a result, most chambers now have sensors attached to analyze plasma. The OES is a non-invasive plasma monitoring sensor that does not interfere with the process and is used to monitor plasma due to its ability to analyze plasma generated during the process.
Attempts to monitor processes using OES have been made in the past. Studies have been conducted to detect internal gas flow by analyzing OES data [10], and attempts have been made to observe faults that occur during the process using an FDC model based on the data [11]. However, these studies all had one thing in common: the problem caused by data imbalance. There is a limit to the amount of data that can be obtained due to a problem of available resources, such as budget, which may occur in a research environment, resulting in data imbalance. Previous studies successfully identified the occurrence of faults by securing an appropriate amount of normal class data, but the classification of fault causes was difficult because abnormal class data sufficient to classify various types and causes of faults were not secured. Various oversampling methods were compared and evaluated in this study to improve the data imbalance problem, and we propose an oversampling model suitable for plasma spectroscopic sensor data that can alleviate the overfitting problem that may occur due to oversampling and undersampling.
The procedure was carried out on LAM Research’s 13.56 MHz RF power transformer-coupled plasma reactive ion-etching 300-mm plasma etch equipment as shown in Figure 1, and plasma monitoring data were collected using an optical emission spectroscopy (OES), manufactured by Ocean Optics, Florida, USA as presented in Figure 2. The following database management system was built to store the collected data, and the SVID and OES data of the equipment were time-synchronized at 1-s intervals and uploaded to the database. OES is a plasma monitoring sensor that analyzes components using visible light spectroscopy generated when plasma reacts. The intensity of the light generated by a plasma glow discharge is measured by OES, allowing for monitoring of the gas reaction inside the plasma. The data collected by OES can be classified by wavelength, and the data were collected by Maria DB and used for data analysis.
As the degree of integration of semiconductor devices has increased, stacked memory was developed, and HAR etch was required for this purpose. A gas mixture was used to improve the etch profile of the HAR etch. In this study, OES was used to track a gas flow-rate problem that might arise during the mixed gas etching process because of equipment failure. Important features were extracted from monitoring results, and the extracted features were collected in the DB, and a machine learning-based FDC model was trained to detect and classify multiple abnormal parts. Various oversampling techniques were compared and analyzed during the process to improve the performance degradation of the FDC model caused by data imbalance.

3. Data Generation Model

OES data are a non-invasive sensor that is used in various plasma-based processes due to its ability to monitor plasma without affecting the process. Previous studies used OES to monitor plasma process, and FC was attempted using these data. To solve the current class-imbalance problem, it was decided that using an oversampling model rather than undersampling, which causes data loss, would be more appropriate, and the following oversampling and undersampling models were used.

3.1. SMOTE-Based Model

One of the representative oversampling techniques is the SMOTE [12]. SMOTE is an oversampling model based on the K-nearest neighbor (KNN) algorithm that improves problems, such as overfitting of oversampling through random sampling. SMOTE oversamples by locating the K-nearest samples among minority classes. Data are now generated on the line between minority classes because a new vector is generated by connecting close samples.
The drawbacks of SMOTE are addressed by the adaptive synthetic sampling approach (ADASYN) [13]. SMOTE cannot reflect the borderline where data from different classes exist adjacently because it is created using only minority class data. In generating minority class data, ADASYN considers the number of surrounding majority classes. Data are generated in the same manner as SMOTE, but this time, the number of nearby majority classes is reflected, resulting in more minority class data as there are more majority class data. As a result, ADASYN generates more data near the borderline, making it easier to distinguish the data boundary.
Borderline SMOTE is a modified model of the existing SMOTE algorithm that generates more data on the boundary between the majority and minority classes [14]. Borderline SMOTE searches all of the data for the nearest neighbors of the minority class, and if the majority class among the nearest neighbors is the majority, it is judged to be close to the borderline. This method is susceptible to noise, but Borderline SMOTE mitigates this by excluding it from the calculation when all nearest neighbors are of the majority class.
A composite sampling model called SMOTE-Tomek combines Tomek and SMOTE links [15]. The user first uses SMOTE to oversample the data before using Tomek link to remove the majority class data. A Tomek link is formed when two pieces of data of different classes are connected, and their distance from one another is less than their distance from other random data nearby. We can identify the borderline of various classes and obtain a clearer borderline using the Tomek link method of removing the majority class data from the two datasets.

3.2. GAN-Based Model

OES data monitoring of the semiconductor process has a data imbalance problem due to the semiconductor process. Undersampling and oversampling techniques are commonly used to solve the problem of data imbalance, but the undersampling technique suffers from information loss due to data removal. As a result, we intend to solve this problem by employing an oversampling technique.
Generative adversarial network (GAN) is a model in which a generator and a discriminator compete with each other to generate data similar to the real data [16]. The generator learns the distribution of data to generate data similar to the input data, and the discriminator learns to determine whether the input data are real data or data generated by the generator as shown in Figure 3.
The loss function of GAN is as follows:
min G max D V D , G = E x ~ p data x log D x + E z ~ p g z log 1 D G z
The discriminator learns to maximize the loss function by returning 1 if the input data are real data and 0 if they are generated data, while the generator learns to minimize the loss function by generating data that are similar to the actual data so that the discriminator can recognize them as real data. It has been suggested that least square GAN (LSGAN) can produce data that are more realistic [17]. Sigmoid decision boundaries are used in conventional GANs. The vanishing gradient issue, however, might arise in this situation during generator update. When data are created, they are far from the real data but can still be considered real data. Using the least square decision boundary, LSGAN penalizes data that are outside the decision boundary, producing samples that are close to the decision boundary and data that are close to the real data.
SMOTE is a representative oversampling technique, but it has the disadvantage of generating only local data and of generating minority class data between majority classes in data with a complex multi-dimensional structure. GAN is a data simulation model that is used for oversampling when minority class data are insufficient. SMOTified-GAN was used in this study to compensate for these drawbacks and to compare with the existing model [18]. Minority class data are oversampled using SMOTE, and GAN is trained using these data in SMOTified-GAN. The problem of a lack of minority class data with GAN can be alleviated by first generating minority class data with SMOTE.

4. Experimental Designs

4.1. Data Acquisition

We used LAM Research’s KIYO-45 etch equipment to perform HAR etch. Semiconductor equipment is made up of various system modules, such as RF, gas, temperature, pressure, and so on, and any malfunction of these modules causes process failure. The change in the gas flow rate, in particular, has an immediate effect on the plasma chemical reaction, and we confirmed the following etching results based on the change in gas flow rate. Based on this, the best-known method (BKM) was defined, and various fault-case data were obtained using the recipe. Fault case data were obtained by assuming an abnormality in the MFC that could change the gas flow rate, and the change in the gas flow rate due to MFC aging was simulated using direct gas-flow control.
The procedure was carried out by adjusting the gas flow rate based on BKM, and OES and SVID data were collected and used for FDC. The acquired OES data were divided into one majority class, normal cases, three minority classes, and fault cases, with each fault case classified based on the flow rate change of the process’s main gases, SF6 and O2. The quantity of acquired data are the same for each class as in Table 1, and the ratio with the normal class is only 3.9%.
The correlation with the process was confirmed through the photoresist strip process of these results. When the O (777.8 nm) peak was compared with the strip rate validated by OES, researchers discovered that the O peak and the strip rate exhibited a linear connection. As the ratio of the added gas increased, the ratio of O2 decreased, confirming that the O dissociation rate decreased, and researchers confirmed that the O dissociation rate was higher in the N2/O2 mixture gas than in the Ar/O2 mixture gas. This is due to the electron density of the N2/O2 mixture gas being greater than that of the Ar/O2 mixture gas, as evidenced by the overall intensity of the OPMS. Furthermore, because the electron temperature did not fluctuate significantly enough to alter O dissociation, researchers established that it did not affect the photoresist strip.

4.2. Oversampling and Undersampling with OES

With the data from the obtained fault example, we attempted oversampling models. The models that were employed were SMOTE, Borderline SMOTE, SMOTE-TOMEK, ADASYN, GAN, and SMOTified-GAN. Section 3 provides more information about each model. The total quantity of data used for learning were 12,014 normal data and 3238, 3208, and 750 defective data, accounting for 16.9%, 16.7%, and 3.9% of the total data, respectively. Data for FDC model learning, as well as data for oversampling and undersampling, were separated. By resampling the majority class and using oversampling and undersampling techniques, the dataset for oversampling and undersampling was made up of 3000 majority classes and 100 minority classes. A total of 12,000 datasets, with 3000 for each class, were finished.

4.3. Fault Classification

To test the oversampling technology for class imbalance resolution, we used a total of three ML FDC models. AdaBoost classifier is a typical boosting algorithm that combines a number of weak classifiers with poor prediction performance to create a high-performance strong classifier. AdaBoost improves accuracy through iterative training by weighting the misclassification of weak classifiers more heavily [19]. Although it performs well, it has the drawback of a high likelihood of overfitting. A distance-based classification algorithm called KNN classifier divides data into groups according to the closest neighbors [20]. When presented with new data, KNN determines the class of the data based on the class data of its KNNs. KNN does not train a model. Instead, it stores training data and bases decisions on those data when faced with new information. As a result, it can learn quicker than the other models. Due to these qualities of KNN and the fact that SMOTE-based algorithms used for oversampling make use of nearest neighbor data such as KNN, we chose KNN as a comparison group for FC algorithms. Compared with other level-wise tree-based models, LightGBM is a leaf-wise tree model that performs more quickly and accurately [21]. LightGBM was chosen as a comparison group for the FC algorithm because it performed well in both these aspects and in earlier studies. For the hyperparameters of all FDC models, the optimal hyperparameters were selected using grid search.
Through the FC model, we sought to identify minute alterations that might take place in plasma-based semiconductor machinery. The FC model is assessed using a confusion matrix, which expresses the classification outcomes as follows. The confusion matrix is divided into the following four categories: True Positive, False Positive, False Negative, and True Negative. Using these four categories, the model can be assessed in various ways. Figure 4 illustrates the general model evaluation methods, including Precision, Recall, Accuracy, and F1 score [22].
Precision is the proportion of data that the model correctly identifies as true. In other words, you can see how accurately the model predicted the values to be true. Recall is the percentage of values that the model correctly predicted from the actual data. Recall, also referred to as Sensitivity, assesses the proportion of data that the model actually discovered to be accurate. Both of these are reflected in the F1 score. The F1 score, which reflects both precision and recall values, is the harmonic average of these two metrics. Accuracy assesses both the outcomes of data for which the model made a true prediction and data for which it made a false prediction. As a result, the model’s overall performance can be assessed. We chose a suitable evaluation strategy before evaluating the FC model. In plasma-based semiconductor processing, our objective is to identify and assess minute changes as they occur to avoid and minimize process errors. To achieve this, the model prioritizes the fault case’s prediction performance over that of the normal class. The classification of a process’ normal class as the fault class is not fatal to the model, but it may have fatal repercussions if the fault class is classified as the normal class [23]. As a result, we assessed the model using the fault-class recall value.

5. Result and Conclusions

We assumed various fault cases and obtained OES data to evaluate the oversampling model to solve the class imbalance problem of OES data, and after oversampling with the acquired OES data, the oversampling performance was verified using the FC model.

5.1. Result

To improve FC performance, we perform data preprocessing using the micro-change data from the plasma-based etch process. Six different algorithms are used to preprocess the data, and oversampling models SMOTE, LSGAN, ADASYN, Borderline SMOTE, SMOTified-GAN, and complex sampling model SMOTE-TOMEK were employed. When learning LightGBM, we used SHAP together and visualized it by identifying wavelengths that significantly impacted FC and using them as standards [24], and the results are presented in Figure 5.
Figure 6 and Figure 7 display the visualization of the data following oversampling. Data preprocessing results were examined for model comparison, and the model and data were assessed based on recall values. Recall values for every fault class in the model were examined. A fault class-sensitive model can be developed using recall, an indicator that measures how many of the actual values for the corresponding classes have been correctly predicted. The results of our training for the three classification models of AdaBoost, KNN, and LightGBM using seven datasets created with real data and six sampling models are shown in Figure 6 and Figure 7.
The classification model typically evaluates its performance using Accuracy or F1 Score. However, you might not be able to properly learn the crucial Fault Case if you use the Accuracy or F1 Score. If you only use real data to learn, accuracy displays a high classification performance of about 0.9, but recall is only about 0.65, demonstrating a poor defect grade performance. This is 0.343 lesser than the recall value shown by the real data, which was close to 0.993 in the normal class, showing how poor the FC model for classifying error cases is when trained on real data. The average recall value from GAN was more than 0.7611, which was more than 0.1111 higher than the defect classification performance of real data when the FC model was trained using datasets preprocessed with various sampling models. This difference demonstrates that the class imbalance issue in the micro-change data of the plasma-based etch process is alleviated when the data are preprocessed through sampling models, which shows the low fault class classification performance of the model trained with real data.
Additionally, we discovered performance variations between the sampling models shown in Table 2. SMOTE-Tomek had the highest recall in AdaBoost, with a score of 0.9. With the highest recall value of 0.9333 in KNN and the highest recall value of 0.95 in LightGBM, SMOTE-Tomek demonstrated the outcome of not missing fault data. However, despite being a widely used oversampling algorithm, LSGAN performed poorly on the micro-change data from the plasma-based HAR etch process. This is also true for the GAN-based SMOTified-GAN. SMOTE-Tomek had the highest average performance and a recall value of 0.8689, while LSGAN had the lowest average performance and a recall value of 0.7611. The SMOTified GAN, which had a recall value of 0.7989, was the model that performed the next worst. We analyzed the recall discrepancy between these models using the characteristics of the data and model.
The GAN model, which is frequently used for data oversampling, creates new data by learning the distribution of the existing data. GAN creates more realistic data than KNN-based oversampling methods because it learns the probability distribution of the entire set of data, mimics it, and oversamples it. LSGAN is a model that addresses the gradient vanishing issue that arises in GAN using the least square loss function in the discriminator. It is intended to produce more accurate data.
However, the semiconductor process data show a complex distribution, but is the distribution is not sufficient. As a result, as shown in Figure 7, the data generated by LSGAN produce data outside the fault-class data distribution rather than data that approximate a complex borderline. All of these data can be called fault cases, but they are not the fault class data we want. Therefore, it is not suitable for use in model training to identify abnormal parts. However, the semiconductor process data show a complex distribution, but the distribution is not sufficient. As a result, unlike data that roughly approximate a complex borderline, the data produced by LSGAN are outside the fault class data distribution. All of these data could be considered fault cases, but we do not need data from the wrong fault class. As a result, it cannot be used to train the models to recognize abnormal parts.
A KNN-based oversampling model is SMOTE. SMOTE performs oversampling based on local data, which is different from GAN, so the performance of overall data simulation is subpar. However, it performs better than GAN-based models in identifying fault classes in the plasma-based etch process fine-change data. This is because, while creating new data based on local data, SMOTE has a lower propensity than GAN to generate data outside the fault class distribution.
Among all FC models, SMOTE-Tomek demonstrated the best fault-class data classification performance. SMOTE-Tomek is a combination of the undersampling model Tomek link and the oversampling model SMOTE. The best performance was displayed by SMOTE-Tomek, as opposed to earlier undersampling models that were avoided because of data loss. Normal class data make up the majority of semiconductor process data, including data from the plasma-based HAR etch process, where the ratio between normal class and fault class data is very different. However, because the data variance is not very high, the process data are not affected by the issue of data loss, which was previously considered to be a drawback of undersampling. By eliminating the fault-class data oversampled through SMOTE and the normal class data making up the Tomek link, SMOTE-Tomek also enhances the classification performance of fault class data. Tomek links are data that are close to the edge of the data, and by removing regular class data, they have the effect of clearing the edge. We overcame SMOTE-Tomek’s drawback of being sensitive to noise using borderline SMOTE rather than general SMOTE.

5.2. Conclusions

In this study, a suitable sampling method was proposed to enhance the performance of the FC model, which was built using micro-change data from the plasma-based etch process. Typically, GAN-based oversampling models are employed to address the issue of class imbalance. However, it was established that the lack of absolute normal class data and the small normal data deviation for semiconductor process data were to blame for the performance degradation of the GAN-based oversampling models. The SMOTE-based model’s suitability as a preprocessing technique for enhancing the FC performance of plasma-based semiconductor process data has been confirmed. It was established that the use of an undersampling technique such as Tomek link together is efficient for enhancing the performance of SMOTE-based models. SMOTE-TOMEK, which eliminates the majority class to make the border line more obvious, is best suited for this task because it is crucial to identify and categorize minute changes in plasma-based semiconductor equipment data. By appropriately sampling the plasma-based semiconductor process data obtained using OES, the class imbalance issue has been improved, and the fault-case detection performance has improved. In the future, PdM and APC research could benefit from these data on fault occurrence frequency and high fault-case detection performance [25].

Author Contributions

Conceptualization, S.J.H. and J.E.C.; experiment and analysis, D.H.S. and C.Y.K.; writing—original draft preparation, D.H.S.; writing—review and editing, C.Y.K. and S.J.H.; visualization, D.H.S.; funding acquisition, S.J.H. All authors have read and agreed to the published version of the manuscript.

Funding

This research was supported by the National Research Council of Science and Technology under the Plasma E. I. (Grant ID: 1711121944, CRC-20-01-NFRI) and authors are grateful to KSRC (Korea Semiconductor Research Consortium) program for meaningful discussion on a potential practical use.

Institutional Review Board Statement

Not applicable for studies not involving humans or animals.

Informed Consent Statement

Not applicable for studies not involving humans.

Data Availability Statement

The data presented in this study are available on request from the corresponding author. The data are not publicly available due to the restrictions of the equipment supplier.

Acknowledgments

The authors are grateful to Researchers in the Fusion Research Group for the technical discussions on Plasma Equipment Intelligence Project.

Conflicts of Interest

The authors declare no conflict of interest.

References

  1. Moyne, J.; Samantaray, J.; Armacost, M. Big Data Capabilities Applied to Semiconductor Manufacturing Advanced Process Control. TSM 2016, 29, 283–291. Available online: https://ieeexplore.ieee.org/document/7480394 (accessed on 18 December 2022). [CrossRef]
  2. Moyne, J.; Schulze, B.; Iskandar, J.; Armacost, M. Next Generation Advanced Process Control: Leveraging Big Data and Prediction. In Proceedings of the 2016 27th Annual SEMI Advanced Semiconductor Manufacturing Conference (ASMC), Saratoga Springs, NY, USA, 16 May 2016; pp. 191–196. [Google Scholar] [CrossRef]
  3. Moyne, J.; Iskandar, J. Big Data Analytics for Smart Manufacturing: Case Studies in Semiconductor Manufacturing. Processes 2017, 5, 39. [Google Scholar] [CrossRef] [Green Version]
  4. Park, H.; Choi, J.E.; Kim, D.; Hong, S.J. Artificial Immune System for Fault Detection and Classification of Semiconductor Equipment. Electronics 2021, 10, 944. [Google Scholar] [CrossRef]
  5. Jiang, D.; Lin, W.; Raghavan, N. A Novel Framework for Semiconductor Manufacturing Final Test Yield Classification Using Machine Learning Techniques. Access 2020, 8, 197885–197895. Available online: https://ieeexplore.ieee.org/document/9244159 (accessed on 18 December 2022). [CrossRef]
  6. Kim, S.H.; Kim, C.Y.; Seol, D.H.; Choi, J.E.; Hong, S.J. Machine Learning-Based Process-Level Fault Detection and Part-Level Fault Classification in Semiconductor Etch Equipment. TSM 2022, 35, 174–185. Available online: https://ieeexplore.ieee.org/document/9740077 (accessed on 18 December 2022). [CrossRef]
  7. Devi, D.; Biswas, S.K.; Purkayastha, B. A Review on Solution to Class Imbalance Problem: Undersampling Approaches, Piscataway. In Proceedings of the 2020 International Conference on Computational Performance Evaluation (ComPE), Shillong, India, 2–4 July 2020; pp. 626–631. [Google Scholar] [CrossRef]
  8. Mathew, J.; Luo, M.; Pang, C.K.; Chan, H.L. Kernel-Based SMOTE for SVM Classification of Imbalanced Datasets. In Proceedings of the IECON 2015-41st Annual Conference of the IEEE Industrial Electronics Society, Yokohama, Japan, 9–12 November 2015; pp. 001127–001132. [Google Scholar] [CrossRef]
  9. Kim, D.H.; Choi, J.E.; Hong, S.J. Analysis of optical emission spectroscopy data during silicon etching in SF6/O2/Ar plasma. Plasma Sci. Technol. 2021, 23, 125501. [Google Scholar] [CrossRef]
  10. Qayyum, A.; Zeb, S.; Naveed, M.A.; Rehman, N.U.; Ghauri, S.A.; Zakaullah, M. Optical emission spectroscopy of Ar–N2 mixture plasma. J. Quant. Spectrosc. Radiat. Transf. 2007, 107, 361–371. [Google Scholar] [CrossRef]
  11. Kwon, H.; Hong, S.J. Use of Optical Emission Spectroscopy Data for Fault Detection of Mass Flow Controller in Plasma Etch Equipment. Electronics 2022, 11, 253. [Google Scholar] [CrossRef]
  12. Chawla, N.; Bowyer, K.; Hall, L.; Kegelmeyer, W. SMOTE: Synthetic minority over-sampling technique. J. Artif. Intell. Res. 2002, 16, 321–357. Available online: https://search.proquest.com/docview/2086828282 (accessed on 18 December 2022). [CrossRef]
  13. He, H.; Bai, Y.; Garcia, E.A.; Li, S. ADASYN: Adaptive Synthetic Sampling Approach for Imbalanced Learning. In Proceedings of the 2008 IEEE International Joint Conference on Neural Networks (IEEE World Congress on Computational Intelligence), Hong Kong, 1–8 June 2008; pp. 1322–1328. [Google Scholar] [CrossRef] [Green Version]
  14. Han, H.; Wang, W.; Mao, B. Borderline-SMOTE: A New Over-Sampling Method in Imbalanced Data Sets Learning. Lect. Notes Comput. Sci. 2005, 3644, 878. [Google Scholar] [CrossRef]
  15. Batista, Gustavo E A P A; Monard, M.C.; Bazzan, A.L.C. Balancing Training Data for Automated Annotation of Keywords: A Case Study. In Knowledge Exploration in Life Science Informatics; Springer: Berlin/Heidelberg, Germany, 2004. [Google Scholar]
  16. Goodfellow, I.; Pouget-Abadie, J.; Mirza, M.; Xu, B.; Warde-Farley, D.; Ozair, S.; Courville, A.; Bengio, Y. Generative adversarial networks. Commun. ACM 2020, 63, 139–144. [Google Scholar] [CrossRef]
  17. Mao, X.; Li, Q.; Xie, H.; Lau, R.Y.K.; Wang, Z.; Smolley, S.P. Least Squares Generative Adversarial Networks. In Proceedings of the IEEE International Conference on Computer Vision, Venice, Italy, 22–29 October 2017; pp. 2813–2821. [Google Scholar] [CrossRef]
  18. Wang, X.; Wang, K.; Li, X.; Lian, S. SMOTified-GAN for class imbalanced pattern classification problems. arXiv.org 2022. [Google Scholar]
  19. Viola, P.; Jones, M.J. Robust Real-Time Face Detection. Int. J. Comput. Vis. 2004, 57, 137–154. [Google Scholar] [CrossRef]
  20. Liao, Y.; Vemuri, V.R. Use of K-Nearest Neighbor classifier for intrusion detection. Comput. Secur. 2002, 21, 439–448. [Google Scholar] [CrossRef]
  21. Ke, G.; Meng, Q.; Finley, T.; Wang, T.; Chen, W.; Ma, W.; Ye, Q.; Liu, T. Lightgbm: A Highly Efficient Gradient Boosting Decision Tree. NIPS. In In Proceedings of the 31st International Conference on Neural Information Processing Systems, Long Beach, CA, USA, 4–9 December 2017. [Google Scholar] [CrossRef]
  22. Buckland, M.; Gey, F. The relationship between recall and precision. J. Am. Soc. Inf. Sci. 1994, 45, 12–19. [Google Scholar] [CrossRef]
  23. Huang, Q.; Fang, C.; Mittal, S.; Blanton, R.D. Improving Diagnosis Efficiency via Machine Learning. In Proceedings of the 2018 IEEE International Test Conference (ITC), Phoenix, AZ, USA, 15–17 August 2018; pp. 1–10. Available online: https://ieeexplore.ieee.org/document/8624884 (accessed on 18 December 2022).
  24. Lundberg, S.M.; Lee, S. A Unified Approach to Interpreting Model Predictions. In Advances in Neural Information Processing Systems, NIPS’17: Proceedings of the 31st International Conference on Neural Information Processing Systems, Long Beach, CA, USA, 4–9 December 2017; Curran Associates Inc.: Red Hook, NY, USA, 2017. [Google Scholar] [CrossRef]
  25. Umeda, S.; Tamaki, K.; Sumiya, M.; Kamaji, Y. Planned Maintenance Schedule Update Method for Predictive Maintenance of Semiconductor Plasma Etcher. IEEE Trans. Semicond. Manuf. 2021, 34, 296–300. [Google Scholar] [CrossRef]
Figure 1. Schematic of the ICP etcher.
Electronics 12 00585 g001
Figure 2. Schematic of optical emission spectroscopy.
Electronics 12 00585 g002
Figure 3. Overview of GAN structure.
Electronics 12 00585 g003
Figure 4. Confusion matrix: Precision, Recall, Accuracy, and F1 score.
Electronics 12 00585 g004
Figure 5. SHAP values with LightGBM.
Electronics 12 00585 g005
Figure 6. Results of oversampling and undersampling.
Electronics 12 00585 g006
Figure 7. Undersampling and oversampling with FDC recall value.
Electronics 12 00585 g007
Table 1. Proportion of Data.
ClassNumber of DataProportion of Data
Normal12,01462.5%
Abnormal_1323816.9%
Abnormal_2320816.7%
Abnormal_37503.9%
Table 2. Undersampling and oversampling with FDC recall value.
FC MethodsUndersampling and Oversampling Methods
RealSMOTEBorderline SMOTESMOTE TOMEKADASYNGANSMOTified GAN
AdaBoost0.6500 0.8667 0.8367 0.9000 0.8333 0.7100 0.7833
KNN0.6500 0.9000 0.8733 0.9333 0.8433 0.7067 0.7967
LightGBM0.6667 0.8800 0.8833 0.9500 0.8400 0.8667 0.8167
AVG0.6556 0.8822 0.8644 0.9278 0.8389 0.7611 0.7989
Disclaimer/Publisher’s Note: The statements, opinions and data contained in all publications are solely those of the individual author(s) and contributor(s) and not of MDPI and/or the editor(s). MDPI and/or the editor(s) disclaim responsibility for any injury to people or property resulting from any ideas, methods, instructions or products referred to in the content.

