Article

Predicting Loneliness through Digital Footprints on Google and YouTube

1
School of Communication & Information, Rutgers University, New Brunswick, NJ 08901-8554, USA
2
Department of Computer Science, Rutgers University, New Brunswick, NJ 08901-8554, USA
3
School of Public Health, Rutgers University, New Brunswick, NJ 08901-8554, USA
4
Institute for Data, Systems, and Society, Massachusetts Institute of Technology, Cambridge, MA 02139-4307, USA
*
Author to whom correspondence should be addressed.
These authors contributed equally to this work.
Electronics 2023, 12(23), 4821; https://doi.org/10.3390/electronics12234821
Submission received: 20 October 2023 / Revised: 21 November 2023 / Accepted: 23 November 2023 / Published: 29 November 2023
(This article belongs to the Special Issue Application of Data Mining in Social Media)

Abstract

:
Loneliness is an increasingly prevalent condition with many adverse effects on health and quality of life. Accordingly, there is a growing interest in developing automated or low-cost methods for triaging and supporting individuals encountering psychosocial distress. This study marks an early attempt at building predictive models to detect loneliness automatically using the digital traces of individuals’ online behavior (Google search and YouTube consumption). Based on a longitudinal study with 92 adult participants for eight weeks in 2021, we find that users’ online behavior can help create automated classification tools for loneliness with high accuracy. Furthermore, we observed behavioral differences in digital traces across platforms. The “not lonely” participants had higher aggregated YouTube activity and lower aggregated Google search activity than “lonely” participants. Our results indicate the need for a further platform-aware exploration of technology use for studies interested in developing automated assessment tools for psychological well-being.

1. Introduction

Loneliness, defined as the “discrepancy between a person’s desired and actual social relationships”, has been identified as the next critical public health issue [1,2]. Indeed, a recent study reported that 61% of young adults in the United States actively feel lonely [3]. Moreover, influential figures like the United States Surgeon General, Vivek Murthy [4], have also called loneliness an “epidemic”. Research provides validity to such claims by showing that loneliness directly affects public health, causing an increased risk of mortality [5], cancer [6], high blood pressure [7], anxiety [8], and depression [9].
Recently, research has called for the analysis of digital traces (e.g., Google search history and YouTube consumption logs) to shed light on factors related to “health and well-being” such as loneliness [10,11]. This development is unsurprising, given the amount of time individuals spend online. According to recent findings, more than 90% of Americans are online, and nearly 46% can “no longer imagine everyday life without the Internet” [12]. This development is also reasonable, given that both the theoretical and empirical literature suggest a relationship between technology use and well-being.
Theories within media, communication, psychology, and other fields posit that technology use and well-being are related. For instance, Uses and Gratifications Theory (UGT) proposes that people actively choose the types of media they engage with to satisfy their needs [13,14]. According to UGT, psychological factors motivate individuals to use media [14]. Previous research applied UGT to examine the influence of various constructs like depression as motivators of technology use. For instance, Pittman et al. [15] highlight the role of social media in gratifying users’ social, intimacy, and affection needs. On the other hand, Elhai et al. [14] show the role of smartphones in alleviating anxiety.
Empirical evidence also indicates a relationship between psychological well-being and online behavior. For instance, Boursier et al. [16] used structural equation modeling (SEM) to discover that loneliness is positively related to excessive social media use (ESMU) and ESMU is, in turn, positively correlated to other problems, such as anxiety. Meanwhile, Yoder et al. [17] applied multiple linear regression to find that Internet pornography is directly associated with loneliness.
Thus, the literature has discerned meaningful insights into the complex relationship between technology use and factors related to well-being. Still, studies have yet to analyze the degree to which automated technology, such as machine learning models built upon multi-platform online behavior, could be created to help individuals monitor and improve their health. In addition, although research has shown that online behavioral data can be used to predict mental health factors, such as suicidal risk, depression, and anxiety, it has not yet examined, to our knowledge, how individuals’ multi-platform digital data coming from Google and YouTube could be used to infer their loneliness scores [11,18,19,20].
In line with other “AI for health” studies, we aim to fill this gap in the literature by researching whether machine learning models can accurately assess loneliness [21]. Based on theoretical and empirical literature that suggests that online platforms differ in their ability to influence health and psychological well-being, we examine two platforms in this study: Google and YouTube [13,14]. We focus on these platforms since they are very commonly used and are relatively different from one another. For instance, while Google search is a text-based search engine, YouTube is primarily an image and video-based platform. Research finds that image-based platforms are more effective at provoking feelings of social presence and intimacy than text-based platforms [15]. We also examine these platforms since studies show they fulfill different needs and underscore contrasting facets of online behavior. For example, Google is primarily associated with active information seeking, whereas YouTube is more often connected with passive media consumption [22].
Using a combination of self-reported survey data and digital trace data provided by 92 individuals during a period of extended isolation from February to April 2021, we aim to answer the following research questions in this study:
  • RQ1: Can machine learning models use trace data from online platforms to predict loneliness?
  • RQ2: Are there systematic differences in terms of the predictive ability of online platforms (Google search, YouTube) for loneliness?
Hence, the key contributions of this study are (a) to propose a novel approach to use digital trace data to predict loneliness and (b) to systematically analyze the differences in user behavior across Google and YouTube based on their loneliness levels. Based on the analysis, we find that digital trace data could be used to create relatively accurate and cost-effective prediction models for individuals to track their loneliness. We also uncover additional support for theories like UGT that posit that technology use may influence well-being differently based on how satisfied individuals are with their digital use, both in terms of usage and the model’s predictive ability. With refinements, we believe the proposed approach could contribute towards digital health dashboards for individuals, wherein their data, combined with models running on their computers (e.g., as web plugins), could be used for triaging health, and provide support and guidance via awareness material or referrals.

2. Related Research

2.1. Theoretical Background: Motivations behind Online Media Usage

The effects of media use on users’ personal lives, health, and well-being have been studied in media, communication, and psychology. According to the Uses and Gratifications Theory (UGT), people actively choose media and engage in technology to gratify their specific needs [13,15]. Since UGT considers diverse motivations ranging from sociodemographic to psychological characteristics [14], emotions are one of the causes that motivate people to use media. Previous studies have applied UGT to analyze the influence of social media usage on loneliness, happiness, and satisfaction with life [15] and the effect of increased smartphone use on depression severity and emotion regulation of users [9].
A recent study reported that people watch vlogging videos to fulfill informational and entertainment needs [23]. In turn, the motivation they had to watch these videos significantly impacted their level of engagement (emotional and otherwise). Another study found that YouTube was used more for entertainment purposes than information (e.g., to obtain political or medical information) [24]. Further, we note that recommendations, subscriptions, and passive consumption significantly impact YouTube utilization and the associated user experience. Hence, we consider YouTube’s behavior to be relatively more passive and more entertainment centric than Google’s search behavior that is more active and more information centric.

2.2. Loneliness and Online Behavior

Similarly, multiple empirical studies have suggested an interconnection between loneliness and online behavior. For instance, Lee et al. [22] used structural equation modeling and found a connection between YouTube use and loneliness. Yoder et al. [17] suggested a link between online porn consumption and loneliness. Haridakis et al. [25] argued that “… while people watch videos on YouTube for some of the same reasons identified in studies of television viewing, there is a distinctly social aspect to YouTube use that reflects its social networking characteristics”. Being empirical, these studies did not try to build predictive models for loneliness. This fact is partially surprising, given the studies that report the use of social media to build predictive models for other mental health issues, including depression, anxiety, and suicide risk [11,26]. As closely related efforts, we note the study by Mazuz et al. [27] who used individual Reddit posts to predict loneliness, and Brodeur et al. [3] who used aggregated search behavior, as opposed to individual-level behavior, to predict loneliness. Hence, using individual online data to predict loneliness, especially as a combination of YouTube and Google logs, still needs to be explored.
Our study follows the recommendations from a recent review article on loneliness and social media use by O’day et al., who stated that “Loneliness is a risk factor for problematic SMU” (Social Media Use). They further state that “To date, problematic SMU has been defined in terms of frequency rather than pattern of use. Most research has relied on self-report cross sectional examinations of these constructs. More experimental and longitudinal designs are needed to elucidate potential bidirectional relationships between social anxiety, loneliness, and social media use” [28]. We go beyond self-report and focus on the patterns of use rather than frequency alone to study predictive interconnections between loneliness and online media use. Specifically, we perform this in the context of predictive models created using individual-level Google and YouTube traces since this connection, motivated by the past literature, is yet to be explored systematically. Further, we analyze the differences in use patterns across platforms as they relate to loneliness, and interpret the differences based on potential user motivations.

3. Materials and Methods

3.1. Data Collection

We collected two types of data from consenting participants over ten weeks between February and April 2021 as part of a project called the “Rutgers Wellness Study” [29] and shared the data with researchers through a secure mechanism. Meanwhile, behavioral data, including loneliness information, was provided by participants through the completion of an online questionnaire on Qualtrics every week.
For this study, we considered adults over the age of 18 living in the United States. Additionally, we reserved participation for participants who were active users of Google search, Google Mail, and Google Location Services three months prior to the study. Recruitment efforts focused on using online advertisements, social media, and university mailing lists to enlist subjects. Potentially, because of the recruitment process, most participants were affiliated with a large public university in the Northeastern United States. A total of 101 participants signed up for the study and 92 completed the study. The data presented in this article were obtained from these 92 participants.

3.2. Ethical Considerations and Permissions

The Rutgers University Institutional Review Board (IRB) reviewed and approved the study. Participants were informed of the study’s goals and data collection procedure before involvement. They were also informed that they could withdraw from the study at any point during the ten weeks. All participants were provided consent forms, and only those who agreed to the terms participated in the study. The participants were compensated monetarily for their time.
Several steps were performed before data analysis to protect participants’ confidential information. First, Google’s Cloud Data Loss Prevention (DLP) API was used to de-identify participants’ data (e.g., names, addresses, and phone numbers) before it was shared with the research team. Next, data were stored using a secure and confidential system. Third, a mental health clinician was included in the research team and available to deal with unexpected scenarios and provide referrals to those in need. Finally, findings based on participants’ data are only reported as aggregate trends or associations instead of individual results.

3.3. Variables of Interest

Loneliness (Target Variable): We measured loneliness using the University of California (UCLA) loneliness scale [1], which contains 20 statements, such as “I am unhappy doing so many things alone”, and measures items on a 4-point Likert-type scale ranging from 1 (“I never feel this way”) to 4 (“I often feel this way”). The scale, which has been widely validated and used in the literature [30,31,32], ranges from 20 to 80. Using the past research [6], we considered scores between 20–34 to denote low degrees of loneliness and those higher to denote moderate-to-high degrees of loneliness. Accordingly, to convert the modeling into a binary classification problem, we labeled subjects with low degrees of loneliness (<35) as “not lonely” and those with high degrees of loneliness (≥35) as “lonely” on a weekly basis.
Demographic Features: We employed 11 sociodemographic features in our research. Participants’ age, race, gender, income, household size, living situation, marital status, employment status, pets, veteran status, etc., were measured using multiple-choice and open-ended questions.
Digital Features: We utilized 44 digital trace features in our study. These features were based on individuals’ Google search and YouTube engagement data. They contained various temporal aggregate features to measure the immediate and long-term impact of different types of technology use. For example, “num_google_searches” measured the weekly number of times Google search was used and allowed us to analyze weekly longitudinal trends. On the other hand, “url_category_x” and “yt_category_x” underscore the different ways Google and YouTube were used by participants in our study. These categories (e.g., sports, technology, and music) were obtained using third-party APIs. Given the sparsity in these categorical data, we retained only those categories that were utilized by at least half the users at any point during the study period. Table 1 provides a list of the primary digital trace information that was used in this study.

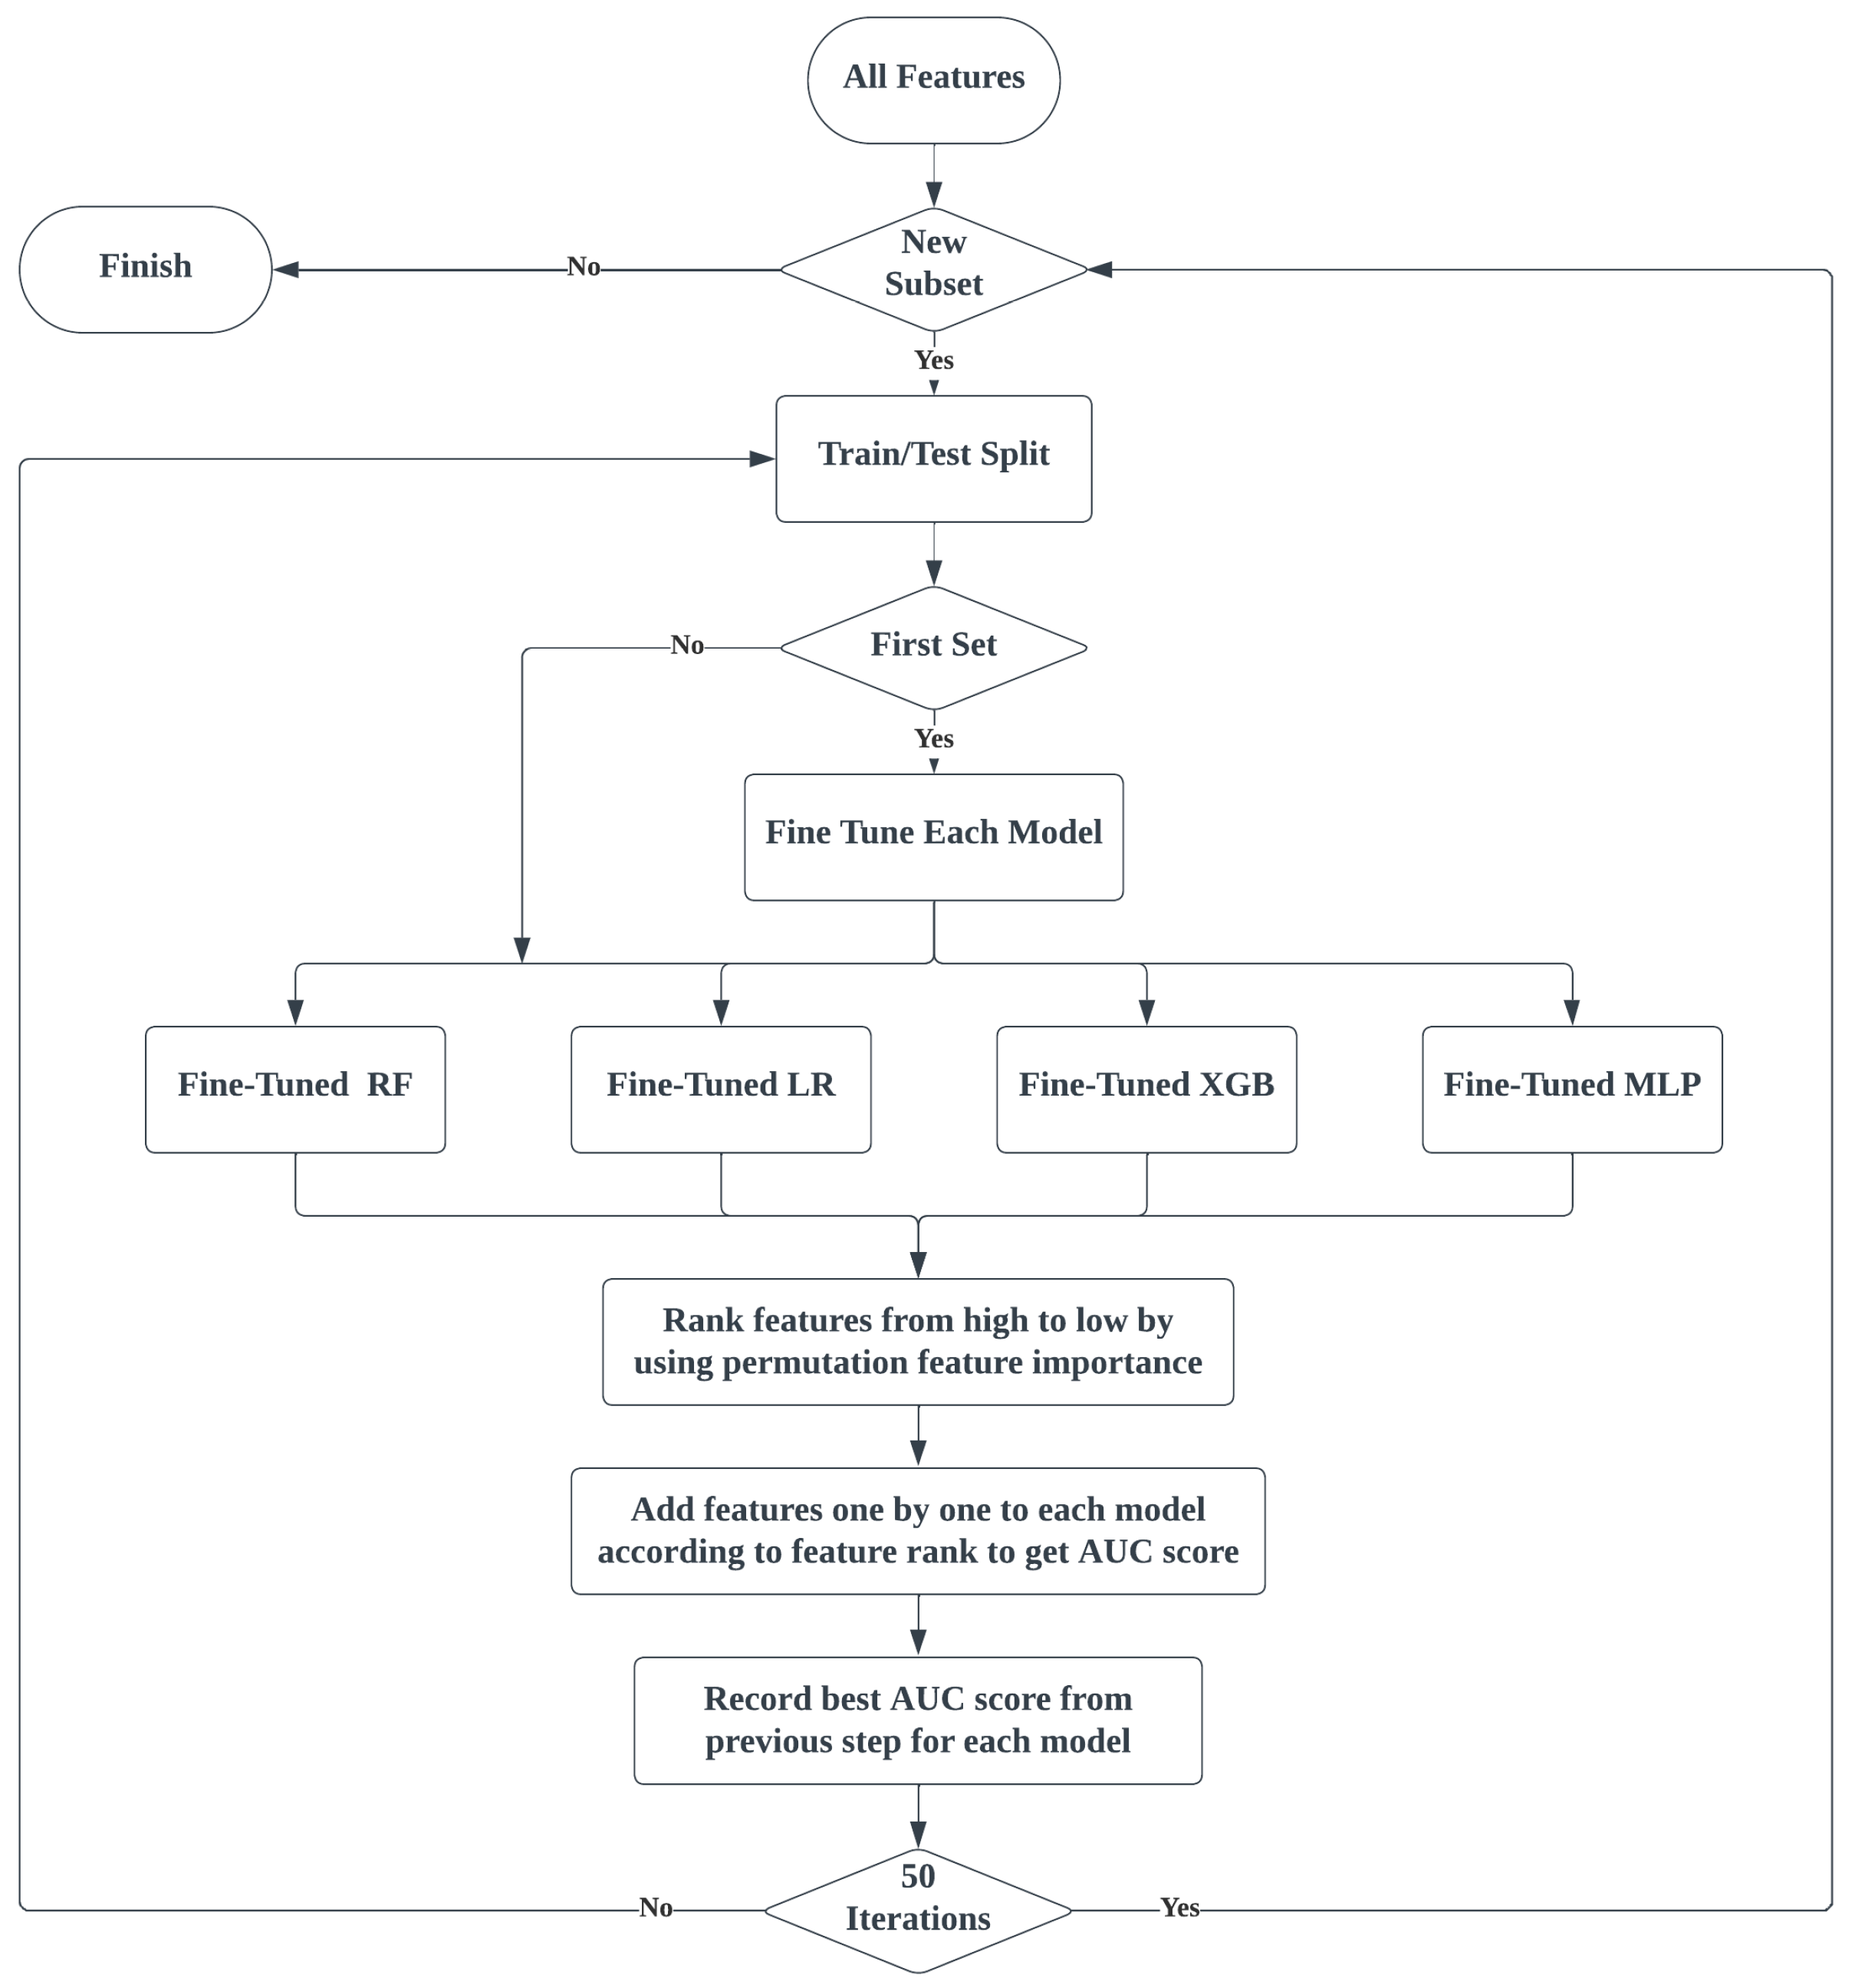
3.4. Data Preprocessing and Modeling

Weeks 1 and 10 were discarded due to inconsistencies in the data. For example, week 1 was dropped due to a ramping-up effect, whereas some people signed up on Monday, and others joined on Sunday. On the other hand, week 10 experienced the reverse scenario; while some participants stopped sharing data on Monday, others waited until Sunday. Hence, we analyzed data from eight weeks out of the ten-week period.
We also implemented a strict “iron curtain” policy for the evaluation of the machine learning models. We used the data from 75% of the participants from weeks 2 to 7 as the training set and tested the model on the remaining 25% of the participants for the remaining two weeks (weeks 8 and 9). Hence, there is no overlap of time and individuals between the training set and the test set.
Four machine learning models were used for testing in this classification study: Random Forest (RF), eXtreme Gradient Boosting (XGboost), Logistic Regression (LR), and Multilayer Perceptron Neural Network (MLP). Random Forest is an ensemble learning technique that, during training, builds many decision trees and outputs the mode of the classes for classification problems or the average prediction for regression tasks. By merging various trees, it reduces overfitting and improves forecast accuracy [35]. XGBoost, or eXtreme Gradient Boosting, is an efficient and scalable gradient-boosting algorithm. It successively constructs a sequence of decision trees, each rectifying the errors of the preceding one, and employs a regularization term to control model complexity [36]. Logistic Regression is a binary classification linear model that predicts the likelihood of an instance belonging to a specific class. It employs the logistic function to predict the outcomes [37]. A multilayer perceptron is an artificial neural network. It consists of numerous layers of interconnected nodes or neurons. It learns complicated patterns in data using an activation function and backpropagation, making it appropriate for various tasks, including classification and regression in both structured and unstructured datasets [38].
Modeling was performed using Python 3.8 and Python libraries, such as sklearn and XGboost. Missing values were replaced with median values. We consider the area under the curve (AUC) as the primary evaluation metric in this study because it can handle data imbalances quite gracefully. We also consider standard accuracy and F1 score as supporting metrics to evaluate the models [39]. To better understand the predictive role of sociodemographic factors and different digital platforms we tested the model on all features and subsets of the complete data.
Figure 1 demonstrates the steps we have taken to execute our data analysis. We first took all the features we obtained from the dataset and divided them into three different subsets, which are Sociodemographic features, Google features, and YouTube features. Then, we combined these subsets with one another to obtain a total of six combinations. For each combination of the subsets, we trained and tested four model types (Random Forest, Logistic Regression, XGBoost, and Multi-layer Perceptron) a total of 50 times. In each such iteration, a different set of rows was randomly selected to be part of the training and test set, respectively. To ensure a robust design for our analysis, we only tuned the hyper-parameters for each of the machine learning models based on the first training set. For each model, we undertook forward feature selection, i.e., the features were ranked based on their permutation importance [40], and added one by one to the model. The best performing feature selection was retained, and its performance was recorded. The average scores for 50 such iterations are reported in the Section 4.

4. Results

4.1. Sample Population

A majority of the 92 participants in the study identified as female (68.48%). Although participants ranged in age from 18 to “65 and older”, a significant portion was between the ages of 18 and 21 (43.48%). The two biggest racial groups represented in the study are White (39.13%) and Asian (34.78%), and most of the participants were single (81.52%). Table 2 provides the primary sociodemographic details of this study’s sample population.

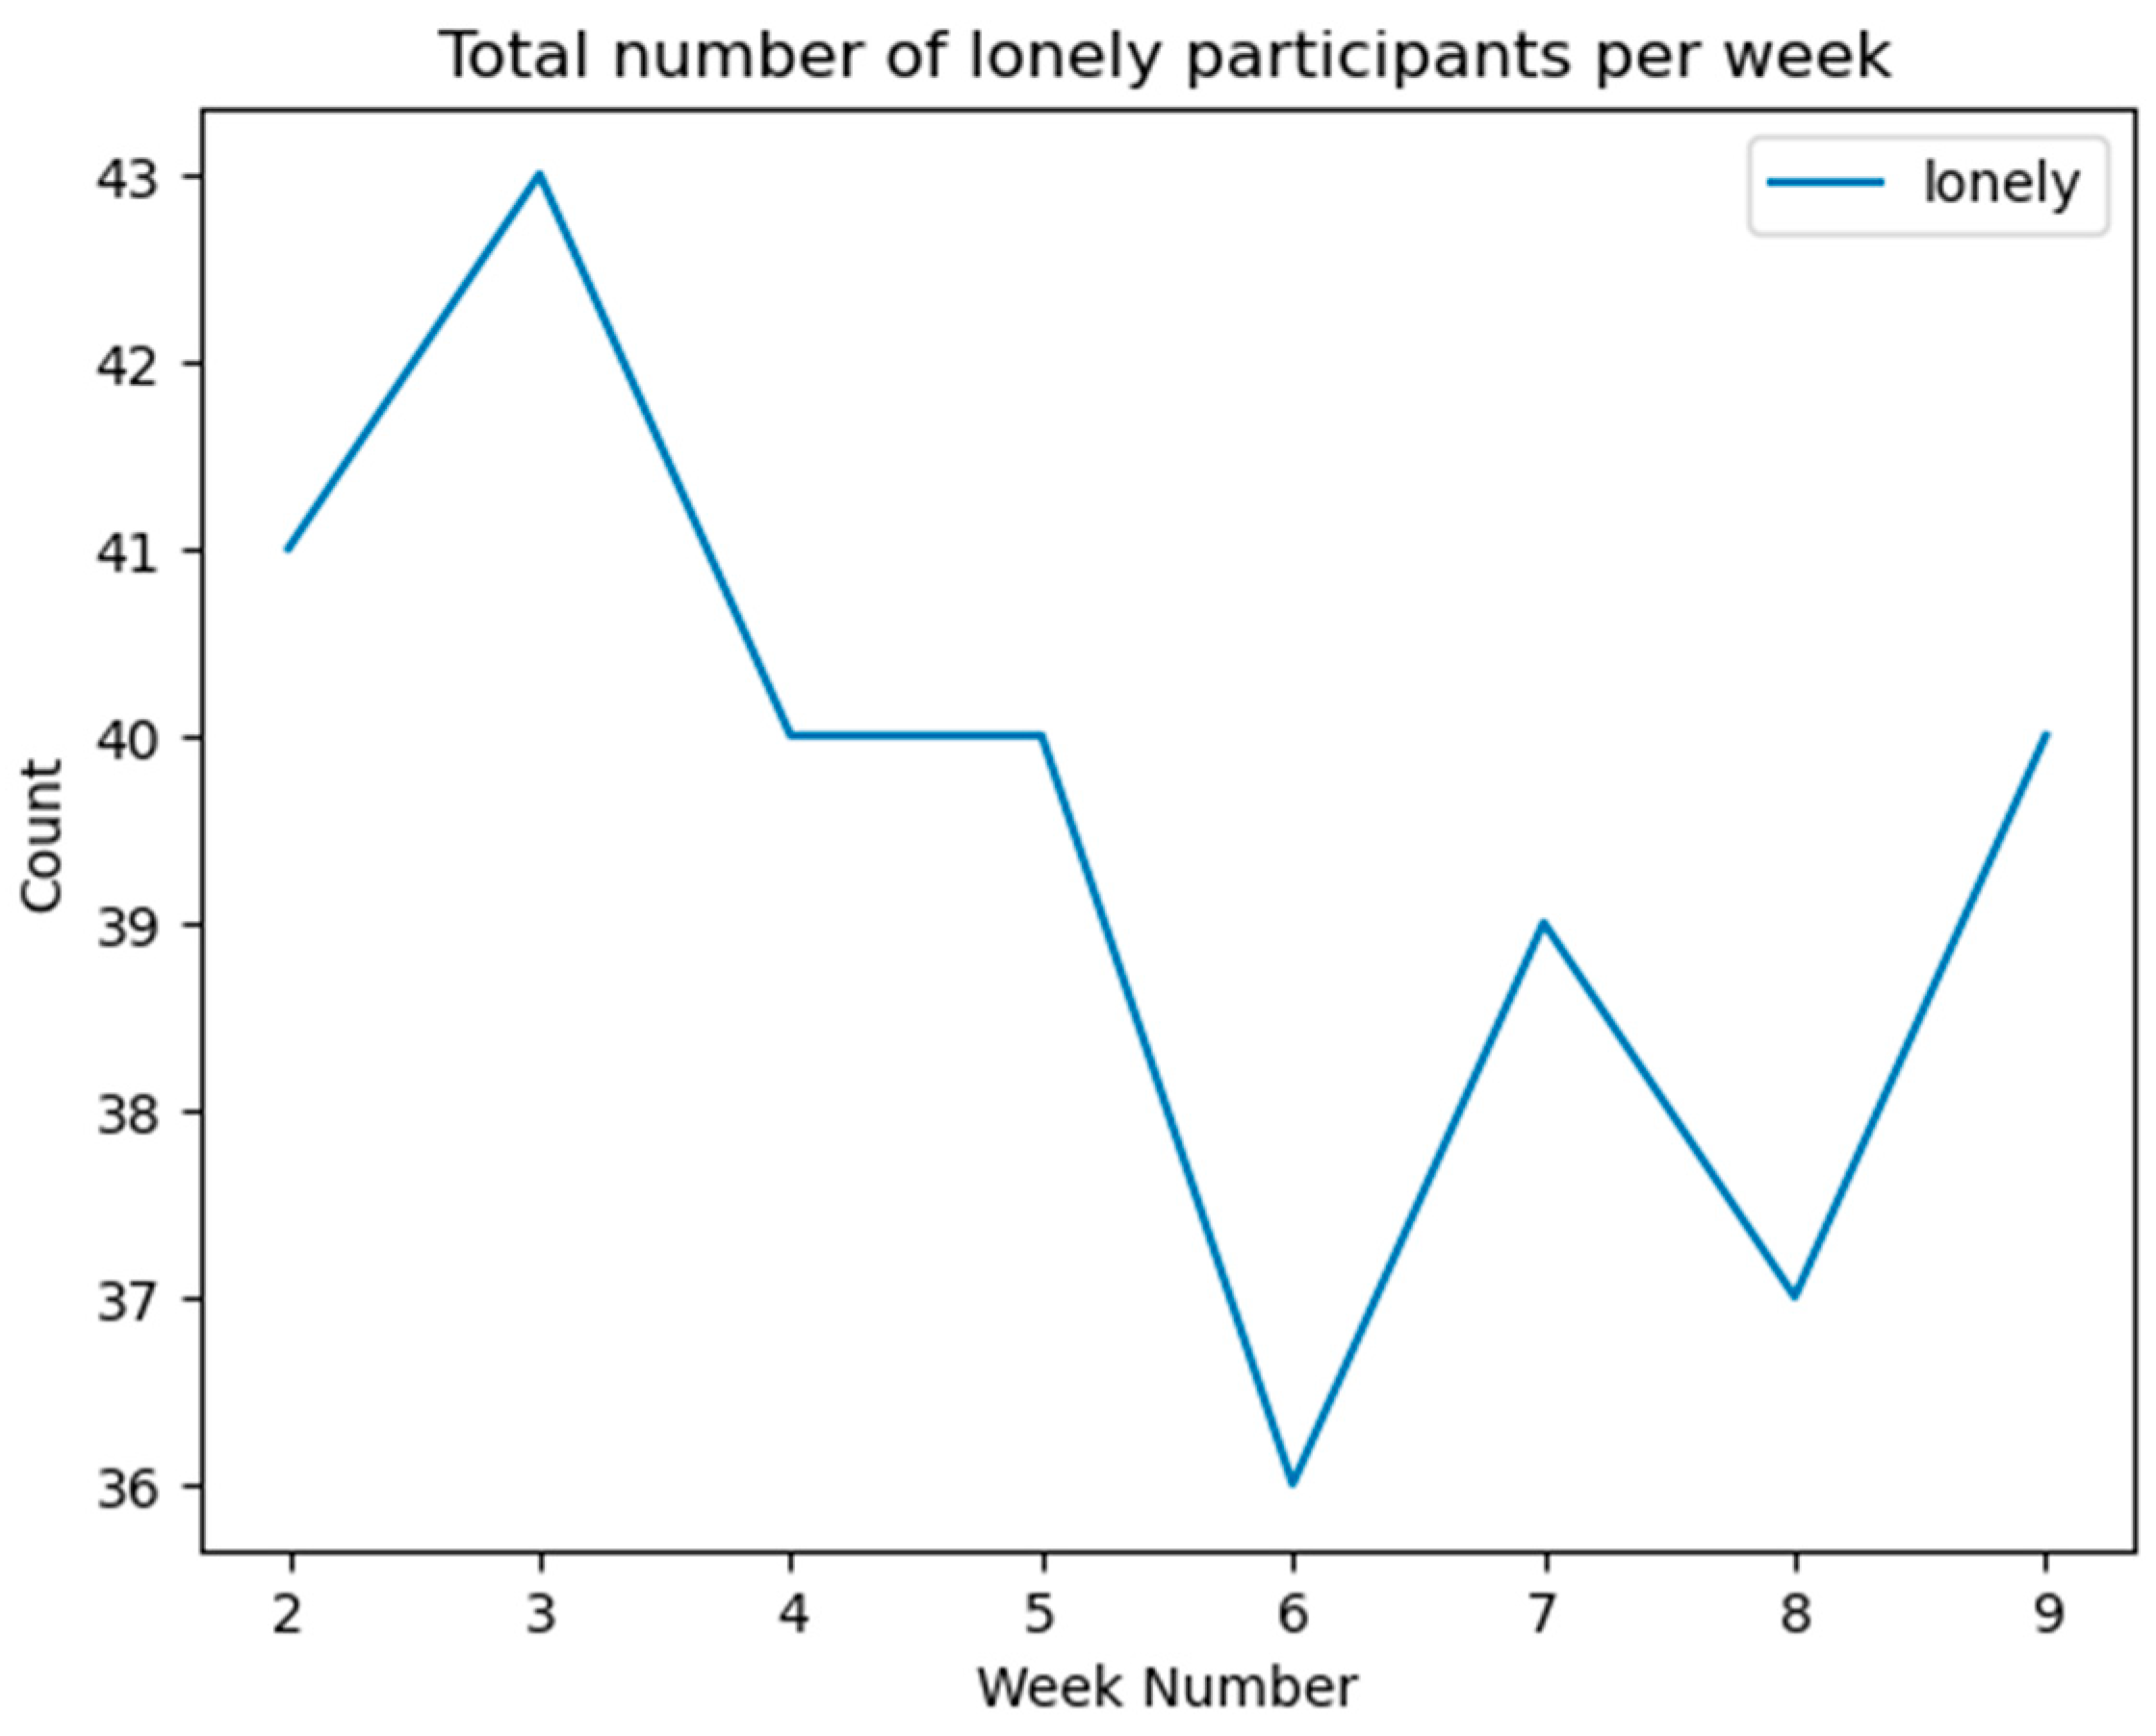
4.2. Loneliness in Participants

There was some variation in the weekly number of lonely participants, as shown in Figure 2. The total number of lonely participants in a week ranged from 36 to 43, with a mean of around 40 lonely participants weekly. We found that 26 out of 92 participants experienced significant shifts in their well-being status, particularly in their classification as “lonely” or “not lonely” throughout the study. We note that the lowest loneliness levels were observed for week 6, corresponding to the student’s spring break.

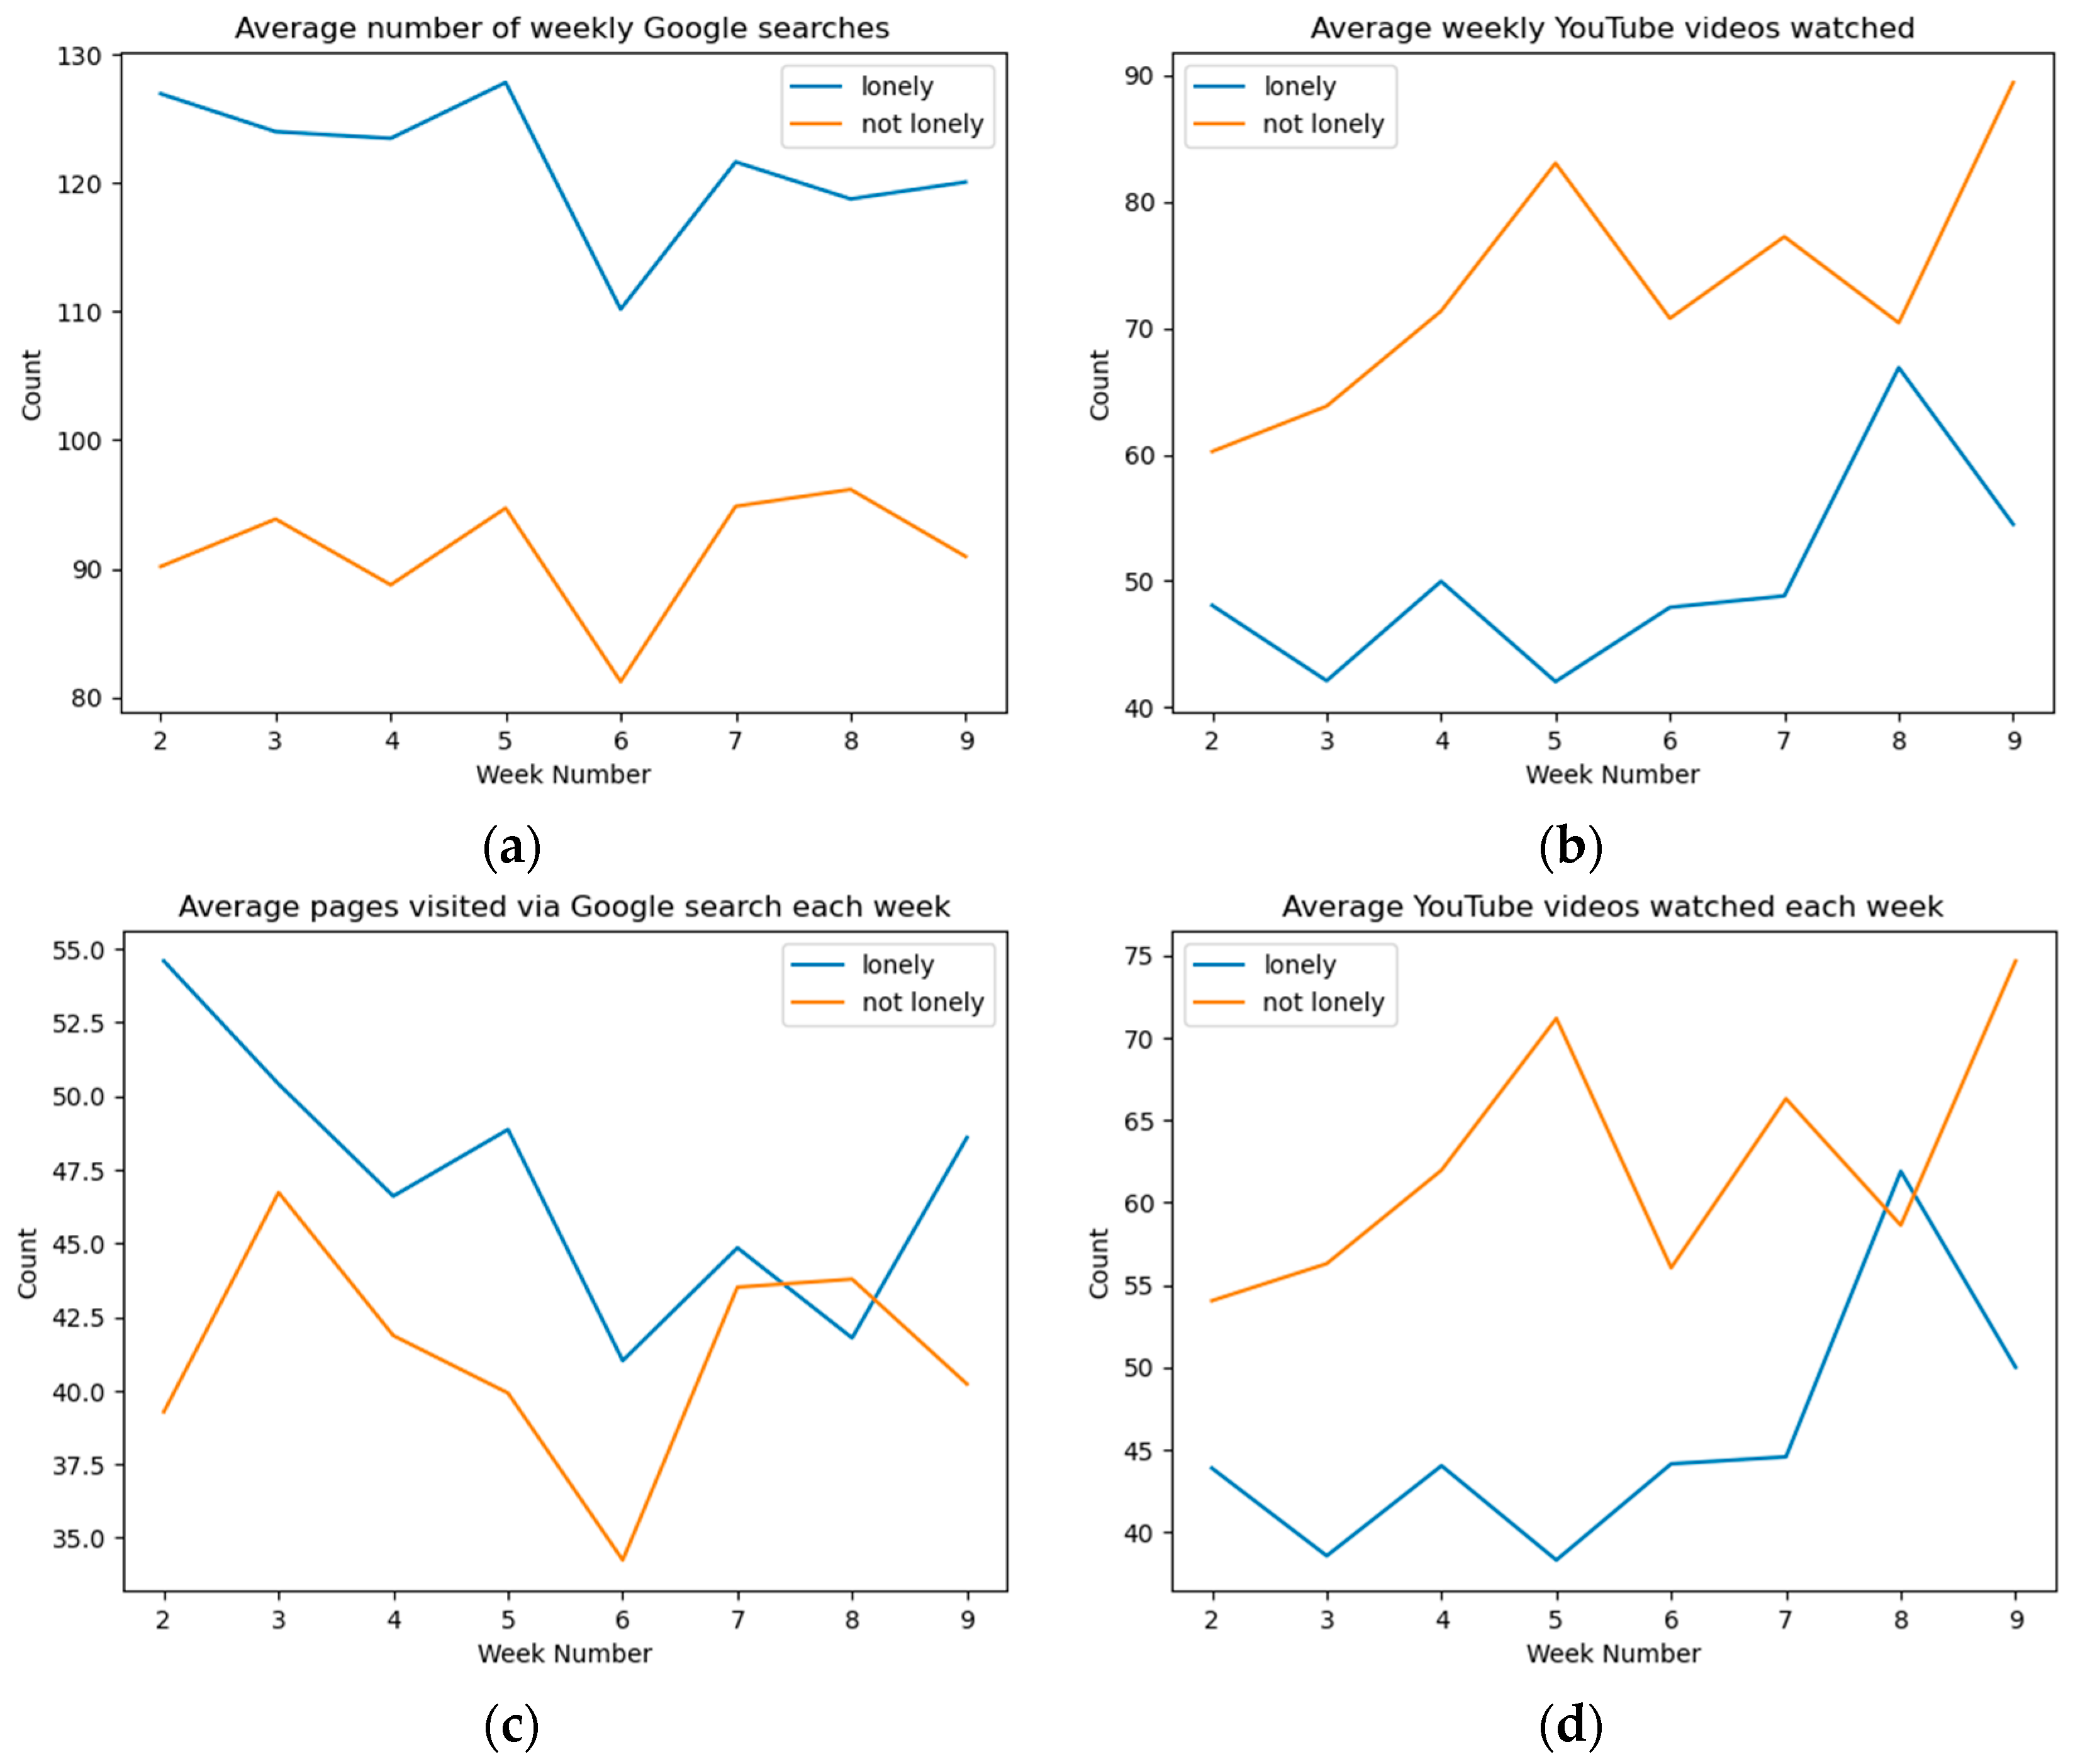
4.3. Online Behavior and Loneliness

Figure 3a,b shows the variation in weekly aggregate activity regarding the total number of Google searches and the total number of YouTube videos watched. As demonstrated in Figure 3, “lonely” participants used Google search more than the “not lonely” participants. Interestingly, the trend was inverse in terms of YouTube videos watched. The “not lonely” participants used YouTube more than the “lonely” participants. Figure 3c,d show the trend of the weekly average of pages visited via Google search for the selected 21 categories and the weekly average of YouTube videos watched for 11 selected categories across all participants, which demonstrated similar trends to Figure 3a,b. However, Figure 3c,d have overlaps at week 8. Similarly, the patterns in week 8 are different from earlier weeks in Figure 3b (relatively smaller gap between the two groups). This suggests that these features are likely to be useful but not absolute predictors of the level of loneliness.

4.4. Biggest Differences Observed

The differences between the mean values of the digital trace data of participants from the “lonely” and “not lonely” categories also provide insight into how different individuals use online platforms. Table 3 reports the top three features with the highest positive (similarly negative) difference between the “lonely” and “not lonely” groups (inclusion criteria: minimum one search/watching activity per week on average for that specific feature). It shows that although high usage of “Sports”, “Music”, and “Education” related YouTube content was much more common for “not lonely” participants, the “lonely” group more frequently utilized Google search to search/browse information related to “Hobbies and Interests”, “Miscellaneous”, and “COVID”. Given the thematic closeness between “Hobbies and Interests” and “Sports”, “Music”, and “Education”, we posit that the platform characteristics (e.g., active Google search vs. Passive YouTube) play an important role in the association with loneliness.

4.5. Prediction Results

We tested four machine learning models in this study: Random Forest (RF), Logistic Regression (LR), eXtreme gradient boosting (XGB), and Multilayer Perceptron Neural Networks (MLP). We divided our features into the following sub-categories: Sociodemographic (Demo), Google-based features including those about aggregated search activity, websites visited via search, and their categorical distribution (Google Features), and YouTube-based features including aggregated activity level and their categorical distribution (YouTube Features). For each model, we computed the performance based on all combinations of the sub-categories mentioned above. Feature subset selection was undertaken in each setting to optimize for the ROC curve (AUC), which we used as the primary comparison metric to find the best-performing machine learning model. The results of the evaluation are shown in Table 4.
As can be seen from Table 4, MLP with Demo and Google Features provided the highest AUC for the different settings considered. The MLP model generally outperformed other predictive models. We also notice that while the sociodemographic features yielded a strong predictive power, adding digital traces to sociodemographic features showed higher predictive power than using only sociodemographic features.
For completeness and interpretability, we repeat the same process optimizing feature selection for accuracy and F1-score, respectively, and report the results in Table 5 and Table 6, respectively. The same setting (Multi-Layer Perceptron with Demo + Google features) that obtained the highest score in terms of AUC also recorded the highest scores in terms of accuracy and F-1 scores (80.17% and 74.49%, respectively). Similarly, we notice that the Multi-Layer Perceptron outperformed other ML models in most settings. Overall, these performance scores are modest but illustrative of the potential of using digital traces like Google and YouTube features for similar tasks in the future.
We also note that these results are based on a setting where the test data does not overlap with the training data in terms of participants or time. If specific settings require generalization along only one of those two axes, the model will have opportunities to learn from more data and yield higher performance. For example, if we used the data from the first six weeks to predict values for the next two weeks for the same individuals, the XGBoost model yielded an AUC of 93.45%. For comparison, a baseline model that labels loneliness in week 8 simply as the label from week 2 will obtain an AUC of 79.72%. Finally, if, in specific settings, the application designers want to only use passive digital traces, and not collect self-reported data on demographics, then MLP could be used to yield an AUC of 73.89%.

5. Discussion

5.1. Initial Remarks

In this study, we examined whether users’ online behavior could be used to predict and prevent them from developing well-being-related health issues, particularly loneliness. In conjunction with sociodemographic information, we found that Google and YouTube data could infer an individual’s loneliness levels with reasonable accuracy (AUC = 84.69). As a result, machine learning models could be utilized to develop low-cost screening tools to support individual health. Furthermore, our study finds that digital trace information improves loneliness prediction across a variety of machine learning approaches. However, MLP performed better than others in the current study.
Further, we observed systematic differences between online platforms. In terms of aggregate use, “lonely” participants used Google search more than the “not lonely” participants. On the other hand, “not lonely” participants used YouTube more than the “lonely” participants. Different platforms also yielded different degrees of predictive power in terms of the prediction model. As reported in Table 4, Google data had higher predictive power than YouTube data in three of the four settings. These results underscore that different online platforms influence individuals differently, depending on how the participants use them and their motivations. Hence, the results support theories like UGT by showing that technology used for different purposes can influences people differently and can have different predictive ability.

5.2. Deployment Scenarios

Online platforms, such as Google and YouTube, have powerful potential and can be used to develop automated tools that rely on machine learning methods to mitigate and prevent serious health problems. For example, loneliness, referred to as an “epidemic,” is one of the many facets of mental well-being that involves social stigma and prevents individuals from seeking help [4]. Digital trace data present a unique opportunity for individuals to utilize their online data for self-evaluation purposes. This is especially pertinent for individuals who either experience stigma, do not wish to receive professional help, cannot access professional help, or cannot afford professional help. With refinement and clinical validation, the method illustrated in this study can be used to create a browser plug-in or lightweight computer application to provide periodic tips on mental health or re-referrals to mental health facilities depending on users’ loneliness scores.

5.3. Limitations

Our study has a few limitations. First, we acknowledge the privacy and ethical concerns associated with assigning a health score to individuals based on passive data collection, as pointed out by Tufekci [41]. To address these concerns, we recommend that automated tools created based on machine learning models, such as our own, explicitly request permission to access users’ data. We also suggest that tools are designed to be self-evaluation guides, and only trained health professionals and physicians can evaluate individuals’ circumstances further. Such approaches can play a small role in creating automated tools that can alleviate the burden on individuals and healthcare professionals while reducing costs.
Next, we acknowledge the limitations relating to the findings of our study. Our study also relies on findings from a relatively homogenous sample during the COVID-19 pandemic, a period of increased isolation, social distancing, and loneliness [42]. Thus, while findings could be generalized to a similar population, they may not apply to vastly different populations. They may also be different depending on the time. Accordingly, we recommend that future studies test objective claims from this study using causal methods that investigate different (non-COVID) periods with various sample populations.

6. Conclusions

Our work represents the first effort, to our knowledge, to analyze and uncover the ability of multiplatform digital trace data (Google and YouTube) to predict loneliness. Our study also provides additional theoretical and empirical knowledge on how online platforms, such as Google and YouTube, differ from one another and impact individuals differently. The combination of the activity level and category of content utilized allowed the algorithms to create algorithms that yielded high accuracy at predicting loneliness. Given the widespread increase in loneliness levels and calls for the early detection of loneliness to undertake counter actions, this study can serve as an important building block for healthcare applications. Our approach can be used to create personal digital health dashboards that use the individuals’ data and models running on their own devices (such as web plugins) to triage their health status and offer assistance and guidance through relevant information or referrals.

Author Contributions

Conceptualization, E.A., H.K., A.M., V.S. and V.K.S.; Methodology, E.A., L.X., A.S., V.S. and V.K.S.; Software, L.X. and A.S.; Investigation, V.S.; Resources, V.K.S.; Data curation, A.S. and A.M.; Writing—original draft, E.A. and A.S.; Writing—review and editing, L.X., H.K., A.M., V.S. and V.K.S.; Visualization, L.X.; Supervision, V.S. and V.K.S.; Project administration, A.M.; Funding acquisition, V.K.S. All authors have read and agreed to the published version of the manuscript.

Funding

This research was partially funded by a Rutgers Center for COVID-19 Response and Pandemic Preparedness and a Rutgers School of Communication & Information Scholarly Futures grant.

Data Availability Statement

Data are unavailable to maintain the privacy of the participants.

Conflicts of Interest

The authors declare no conflict of interest.

References

  1. Russell, D.; Peplau, L.A.; Cutrona, C.E. The Revised UCLA Loneliness Scale: Concurrent and Discriminant Validity Evidence. J. Personal. Soc. Psychol. 1980, 39, 472–480. [Google Scholar] [CrossRef]
  2. Leland, J. How Loneliness Is Damaging Our Health. The New York Times. 20 April 2022. Available online: https://www.nytimes.com/2022/04/20/nyregion/loneliness-epidemic.html (accessed on 26 September 2023).
  3. Brodeur, A.; Clark, A.E.; Fleche, S.; Powdthavee, N. Assessing the Impact of the Coronavirus Lockdown on Unhappiness, Loneliness, and Boredom Using Google Trends. arXiv 2020, arXiv:2004.12129. [Google Scholar] [CrossRef]
  4. Murthy, V.; Work and the Loneliness Epidemic. Harvard Business Review. Available online: https://hbr.org/2017/09/work-and-the-loneliness-epidemic (accessed on 26 September 2023).
  5. Holt-Lunstad, J.; Smith, T.B.; Baker, M.; Harris, T.; Stephenson, D. Loneliness and Social Isolation as Risk Factors for Mortality: A Meta-Analytic Review. Perspect. Psychol. Sci. 2015, 10, 227–237. [Google Scholar] [CrossRef]
  6. Deckx, L.; van den Akker, M.; Buntinx, F. Risk Factors for Loneliness in Patients with Cancer: A Systematic Literature Review and Meta-Analysis. Eur. J. Oncol. Nurs. 2014, 18, 466–477. [Google Scholar] [CrossRef]
  7. Alun, J.; Murphy, B. Loneliness, Social Isolation and Cardiovascular Risk. Br. J. Card. Nurs. 2019, 14, 1–8. [Google Scholar] [CrossRef]
  8. Beutel, M.E.; Klein, E.M.; Brähler, E.; Reiner, I.; Jünger, C.; Michal, M.; Wiltink, J.; Wild, P.S.; Münzel, T.; Lackner, K.J.; et al. Loneliness in the General Population: Prevalence, Determinants and Relations to Mental Health. BMC Psychiatry 2017, 17, 97. [Google Scholar] [CrossRef]
  9. Elhai, J.D.; Tiamiyu, M.F.; Weeks, J.W.; Levine, J.C.; Picard, K.J.; Hall, B.J. Depression and Emotion Regulation Predict Objective Smartphone Use Measured over One Week. Personal. Individ. Differ. 2018, 133, 21–28. [Google Scholar] [CrossRef]
  10. Guntuku, S.C.; Schneider, R.; Pelullo, A.; Young, J.; Wong, V.; Ungar, L.; Polsky, D.; Volpp, K.G.; Merchant, R. Studying Expressions of Loneliness in Individuals Using Twitter: An Observational Study. BMJ Open 2019, 9, e030355. [Google Scholar] [CrossRef]
  11. Zhang, B.; Zaman, A.; Silenzio, V.; Kautz, H.; Hoque, E. The Relationships of Deteriorating Depression and Anxiety with Longitudinal Behavioral Changes in Google and YouTube Use during COVID-19: Observational Study. JMIR Ment. Health 2020, 7, e24012. [Google Scholar] [CrossRef]
  12. Petrosyan, A. Topic: Internet Usage in the United States. Statista. Available online: https://www.statista.com/topics/2237/internet-usage-in-the-united-states/#topicOverview (accessed on 26 September 2023).
  13. Katz, E.; Blumler, J.G.; Gurevitch, M. Uses and gratifications research. Public Opin. Q. 1973, 37, 509–523. [Google Scholar] [CrossRef]
  14. Elhai, J.D.; Levine, J.C.; Hall, B.J. The Relationship between Anxiety Symptom Severity and Problematic Smartphone Use: A Review of the Literature and Conceptual Frameworks. J. Anxiety Disord. 2019, 62, 45–52. [Google Scholar] [CrossRef]
  15. Pittman, M.; Reich, B. Social Media and Loneliness: Why an Instagram Picture May Be Worth More than a Thousand Twitter Words. Comput. Hum. Behav. 2016, 62, 155–167. [Google Scholar] [CrossRef]
  16. Boursier, V.; Gioia, F.; Musetti, A.; Schimmenti, A. Facing Loneliness and Anxiety during the COVID-19 Isolation: The Role of Excessive Social Media Use in a Sample of Italian Adults. Front. Psychiatry 2020, 11, 586222. [Google Scholar] [CrossRef]
  17. Yoder, V.C.; Virden, T.B.; Amin, K. Internet Pornography and Loneliness: An Association? Sex. Addict. Compulsivity 2005, 12, 19–44. [Google Scholar] [CrossRef]
  18. Du, J.; Zhang, Y.; Luo, J.; Jia, Y.; Wei, Q.; Tao, C.; Xu, H. Extracting Psychiatric Stressors for Suicide from Social Media Using Deep Learning. BMC Med. Inform. Decis. Mak. 2018, 18, 43. [Google Scholar] [CrossRef]
  19. Reece, A.G.; Danforth, C.M. Instagram Photos Reveal Predictive Markers of Depression. EPJ Data Sci. 2017, 6, 15. [Google Scholar] [CrossRef]
  20. Cheng, Q.; Li, T.M.; Kwok, C.-L.; Zhu, T.; Yip, P.S. Assessing Suicide Risk and Emotional Distress in Chinese Social Media: A Text Mining and Machine Learning Study. J. Med. Internet Res. 2017, 19, e243. [Google Scholar] [CrossRef]
  21. Kim, J.; Lee, D.; Park, E. Machine Learning for Mental Health in Social Media: Bibliometric Study. J. Med. Internet Res. 2021, 23, e24870. [Google Scholar] [CrossRef]
  22. Lee, J.M. An Exploratory Study on Effects of Loneliness and YouTube Addiction on College Life Adjustment in the Distance Education During COVID-19. J. Korea Contents Assoc. 2020, 20, 342–351. [Google Scholar]
  23. Silaban, P.H.; Chen, W.-K.; Nababan, T.S.; Eunike, I.J.; Silalahi, A.D.K. How Travel Vlogs on YouTube Influence Consumer Behavior: A Use and Gratification Perspective and Customer Engagement. Hum. Behav. Emerg. Technol. 2022, 2022, 4432977. [Google Scholar] [CrossRef]
  24. Möller, A.M.; Kühne, R.; Baumgartner, S.E.; Peter, J. Exploring User Responses to Entertainment and Political Videos: An Automated Content Analysis of YouTube. Soc. Sci. Comput. Rev. 2019, 37, 510–528. [Google Scholar] [CrossRef]
  25. Haridakis, P.; Hanson, G. Social Interaction and Co-Viewing With YouTube: Blending Mass Communication Reception and Social Connection. J. Broadcast. Electron. Media 2009, 53, 317–335. [Google Scholar] [CrossRef]
  26. Coppersmith, G.; Leary, R.; Crutchley, P.; Fine, A. Natural Language Processing of Social Media as Screening for Suicide Risk. Biomed. Inform. Insights 2018, 10, 1178222618792860. [Google Scholar] [CrossRef]
  27. Mazuz, K.; Yom-Tov, E. Analyzing Trends of Loneliness through Large-Scale Analysis of Social Media Postings: Observational Study. JMIR Ment. Health 2020, 7, e17188. [Google Scholar] [CrossRef]
  28. O’Day, E.B.; Heimberg, R.G. Social Media Use, Social Anxiety, and Loneliness: A Systematic Review. Comput. Hum. Behav. Rep. 2021, 3, 100070. [Google Scholar] [CrossRef]
  29. Willard, B.; Fair, G. Introducing Data Transfer Project: An Open Source Platform Promoting Universal Data Portability. Google Open Source Blog. Available online: https://opensource.googleblog.com/2018/07/introducing-data-transfer-project.html (accessed on 16 November 2023).
  30. Donovan, N.J.; Blazer, D. Social Isolation and Loneliness in Older Adults: Review and Commentary of a National Academies Report. Am. J. Geriatr. Psychiatry 2020, 28, 1233–1244. [Google Scholar] [CrossRef]
  31. Hudiyana, J.; Lincoln, T.M.; Hartanto, S.; Shadiqi, M.A.; Milla, M.N.; Muluk, H.; Jaya, E.S. How Universal Is a Construct of Loneliness? Measurement Invariance of the UCLA Loneliness Scale in Indonesia, Germany, and the United States. Assessment 2022, 29, 1795–1805. [Google Scholar] [CrossRef]
  32. Lim, M.H.; Eres, R.; Vasan, S. Understanding Loneliness in the Twenty-First Century: An Update on Correlates, Risk Factors, and Potential Solutions. Soc. Psychiatry Psychiatr. Epidemiol. 2020, 55, 793–810. [Google Scholar] [CrossRef]
  33. WHOIS API|565M+ Active Domains & 7596 TLDs Tracked|WhoisXML API. Available online: https://whois.whoisxmlapi.com (accessed on 16 November 2023).
  34. VideoCategories: List|YouTube Data API. Google for Developers. Available online: https://developers.google.com/youtube/v3/docs/videoCategories/list (accessed on 16 November 2023).
  35. Breiman, L. Random Forests. Mach. Learn. 2001, 45, 5–32. [Google Scholar] [CrossRef]
  36. Chen, T.; Guestrin, C. XGBoost: A Scalable Tree Boosting System. In Proceedings of the 22nd ACM SIGKDD International Conference on Knowledge Discovery and Data Mining, San Francisco, CA, USA, 13–17 August 2016. [Google Scholar] [CrossRef]
  37. Dreiseitl, S.; Ohno-Machado, L. Logistic Regression and Artificial Neural Network Classification Models: A Methodology Review. J. Biomed. Inform. 2002, 35, 352–359. [Google Scholar] [CrossRef]
  38. Murtagh, F. Multilayer Perceptrons for Classification and Regression. Neurocomputing 1991, 2, 183–197. [Google Scholar] [CrossRef]
  39. Müller, A.C.; Guido, S. Introduction to Machine Learning with Python: A Guide for Data Scientists, 1st ed.; O’Reilly Media, Inc.: Sebastopol, CA, USA, 2017. [Google Scholar]
  40. Altmann, A.; Toloşi, L.; Sander, O.; Lengauer, T. Permutation Importance: A Corrected Feature Importance Measure. Bioinformatics 2010, 26, 1340–1347. [Google Scholar] [CrossRef]
  41. Tufekci, Z. Algorithmic Harms beyond Facebook and Google: Emergent Challenges of Computational Agency. Colo. Technol. Law J. 2015, 13, 203. [Google Scholar]
  42. Ernst, M.; Niederer, D.; Werner, A.M.; Czaja, S.J.; Mikton, C.; Ong, A.D.; Rosen, T.; Brähler, E.; Beutel, M.E. Loneliness before and during the COVID-19 Pandemic: A Systematic Review with Meta-Analysis. Am. Psychol. 2022, 77, 660–677. [Google Scholar] [CrossRef]
Figure 1. Process flow chart for the evaluation.
Electronics 12 04821 g001
Figure 2. Total number of lonely participants per week.
Electronics 12 04821 g002
Figure 3. (a) Average number of weekly Google searches; (b) average weekly YouTube videos watched; (c) average pages visited via Google search each week (for the selected 21 categories); and (d) average YouTube videos watched each week (for the 11 selected categories). All results presented are means across all participants.
Electronics 12 04821 g003
Table 1. Digital trace data used in this study and their explanation.
Platform 1FeatureExplanation
Googlenum_google_searchesWeekly number of Google searches
num_websites_visitedWeekly number of websites visited through Google search
weekly_use_count_googleWeekly number of engagements with Google products (e.g., Search and GMail)
COVID_terms_google_searchWeekly Google searches with COVID-19 related glossary terms
url_category_xWeekly number of websites visited using Google search per category using the WhoisXML API [33]. Here, we focus on 21 categories that were used by at least half the users during the study period. (21 different features.)
unique-url_cat_visited_weeklyWeekly number of unique Google search categories visited over the week
total_url_weekly_top_catsWeekly sum of pages visited via Google search (for the selected 21 categories)
YouTubenum_videos_watchedWeekly number of videos watched on YouTube
average_num_sessions_per_weekWeekly number of YouTube sessions. Here, two videos belong in a session if they were watched within 60 min of each other
weekly_use_count_youtubeWeekly number of times YouTube is used (e.g., videos watched and comments)
yt_category_xWeekly number of videos watched on YouTube per category as defined by the YouTube API [34]. We retain 11 such categories based on active use by the participants (11 different features).
num_commentsWeekly number of YouTube comments
unique_yt_cat_visited_weeklyWeekly number of unique YouTube categories visited
total_yt_weekly_top_catsWeekly sum of YouTube videos watched for the 11 selected categories
Table 2. Sociodemographic characteristics of participants.
Sociodemographic FeatureCategoryFrequencyPercentage
GenderFemale6469.57%
Male2830.43%
Race/EthnicityWhite3639.13%
Asian3234.78%
Other2426.09%
Marital StatusSingle7581.52%
Married88.70%
Other99.78%
Age18–214043.48%
22–252325.00%
26 and older2931.52%
Table 3. Mean differences in online behavior of participants (by category).
Digital Trace Feature Overall MeanMean:
“Not Lonely”
Mean:
“Lonely”
Difference
in Means
Percent
Difference
YouTube: Sports category3.074.820.744.08132.78%
YouTube: Music category12.0314.928.186.7556.09%
YouTube: Education category2.613.081.981.1042.09%
URLs visited: Miscellaneous category15.7213.3618.85−5.49−34.91%
Google search: COVID related terms1.751.472.11−0.64−36.62%
URLs visited: Hobbies and Interest category 1.170.921.50−0.58−49.93%
Table 4. The area under the ROC curve (AUC) of machine learning models on different feature sets. The best performing models are bolded.
FeaturesRFXGBLRMLP
Demo78.07%79.94%79.52%80.66%
Google Features68.02%65.52%65.11%73.89%
YouTube Features62.11%61.96%66.27%68.09%
Google Features + YouTube Features66.16%66.56%68.04%73.89%
Demo + Google Features78.13%79.95%78.65%84.69%
Demo + YouTube Features79.83%80.30%84.42%83.65%
Demo + Google Features + YouTube Features75.50%80.60%78.88%82.59%
Table 5. The accuracy of machine learning models on different feature sets.
FeaturesRFXGBLRMLP
Demo75.74%74.61%74.78%77.65%
Google Features64.39%65.17%62.48%71.13%
YouTube Features62.48%62.43%59.83%64.39%
Google Features + YouTube Features65.83%65.13%61.17%69.35%
Demo + Google Features72.78%75.26%75.17%80.17%
Demo + YouTube Features77.04%72.87%78.57%77.26%
Demo + Google Features + YouTube Features73.43%75.04%77.65%77.91%
Table 6. The F-1 scores of machine learning models on different feature sets.
FeaturesRFXGBLRMLP
Demo71.34%70.27%69.54%74.01%
Google Features54.70%57.37%52.81%66.21%
YouTube Features42.76%47.97%34.37%58.83%
Google Features + YouTube Features57.16%58.40%55.26%62.22%
Demo + Google Features67.64%70.75%70.79%74.49%
Demo + YouTube Features71.96%67.80%74.28%72.31%
Demo + Google Features + YouTube Features68.06%70.58%73.14%73.34%
Disclaimer/Publisher’s Note: The statements, opinions and data contained in all publications are solely those of the individual author(s) and contributor(s) and not of MDPI and/or the editor(s). MDPI and/or the editor(s) disclaim responsibility for any injury to people or property resulting from any ideas, methods, instructions or products referred to in the content.

