Article

Deploying a Low-Cost Wi-Fi-Based Vehicular Ad Hoc Network in a Shopping Mall Parking Lot: An Empirical Study

1
Department of Computer Science and Software Engineering, Auckland University of Technology, Auckland 1010, New Zealand
2
Department of Computer Networks, College of Computer Science & IT, King Faisal University, Al-Ahsa 31982, Saudi Arabia
*
Author to whom correspondence should be addressed.
Electronics 2023, 12(22), 4672; https://doi.org/10.3390/electronics12224672
Submission received: 20 September 2023 / Revised: 10 November 2023 / Accepted: 13 November 2023 / Published: 16 November 2023
(This article belongs to the Special Issue Feature Papers in "Networks" Section)

Abstract

:
Vehicular ad hoc networks (VANETs) have the potential to reduce car accidents by facilitating connectivity and warning message exchange between vehicles, both on roads and in parking lots. This research endeavored to accomplish three primary goals: conducting a field measurement in the parking lot of a large shopping mall in Auckland, developing an OPNET-based simulation model to analyze and validate the system performance, and analyzing the compatibility between five selected radio propagation models (Free-space, Shadowing Path-loss, Egli, Hata, and COST231). These models were selected based on their popularity and relevance to our study. We found that the “Free Space” model outperforms in the scenario in which measurements were conducted from the Level-1 car park to the Roadside. The received signal strengths in the parking lot ranged from −45 dBm to −92 dBm. This research also examines the coverage distance for the successful transmission of warning messages, achieving up to 57 m, 17.5 m, 9.4 m, and 68 m at parking levels 1, 2, 3, and the roadside, respectively. Research findings reveal that a low-cost Wi-Fi-based VANET system can be utilized to prevent car accidents in parking lots. Finally, we provide guidelines for network planners to deploy Wi-Fi-based VANET systems in parking lots.

1. Introduction

The increasing number of vehicles on the road has resulted in a rise in accidents and traffic congestion, causing significant economic losses and safety concerns. As of December 2023, the number of licensed vehicles in New Zealand is estimated to be around 4.5 million [1]. Traffic-related issues such as congestion, jams, and poor road conditions contribute to the constant threat of accidents. Vehicular ad hoc networks (VANETs) offer a potential solution for improving road safety and addressing these challenges. VANETs utilize wireless communication technology, such as Wi-Fi, to enable vehicles to communicate with each other in a point-to-point manner. Researchers have been actively working on enhancing road safety through advancements in vehicular technology and wireless communication. These VANETs have great potential to transform future vehicle applications and allow them to actively participate in communication, reducing accidents and improving the overall road conditions [2]. Road safety and efficiency can be achieved by enabling vehicle-to-vehicle (V2V) communication. The idea is to monitor the vehicle speeds and mitigate accident risks through various warning messages [3]. VANETs facilitate the exchange of safety-related information, such as traffic updates and collision warnings, to enhance road safety. The main challenges in VANET operation are due to dynamic network topology. However, IEEE 802.11-based VANETs are gaining popularity because of their cost-effectiveness and standards [4]. However, issues such as performance degradation, online management, radio channel utilization, high mobility, environmental conditions, security, and privacy are still open challenges that need to be overcome before the practical deployment of VANETs.
The main objective of this study was to conduct a feasibility study for the deployment of a low-cost IEEE 802.11-based (Wi-Fi) VANET in the parking lot of the WestCity Auckland shopping mall. We aim to evaluate the system performance with respect to the received signal strengths (RSS) and response times. To fulfil this objective, a field trial measurement was conducted using 802.11n cards. We use simulation software such as the OPNET Modeler to generalize the research findings and to validate the system performance.
This study provides an insight into the deployment of a low-cost Wi-Fi-based VANET in the parking lot of a large shopping mall in Auckland City. We also outline a system performance testing environment, collecting and analyzing data with theoretical radio propagation models to achieve an accurate and realistic RSSI and transmission time. The research questions/challenges and research contributions are discussed next.

1.1. Research Challenges

This study utilized a quantitative approach in collecting field data from a large West City Auckland shopping mall parking lot; a propagation measurement approach. The idea was to set up and evaluate the system’s performance in the shopping mall parking lot. Various OPNET-based simulation scenarios were developed to analyze the system’s performance. Another major challenge was to find the closest match between the field trial measurements and propagation models. In this paper, we address the three following research questions:
  • Question 1: What Wi-Fi-based VANET can be deployed in a large shopping mall parking lot to reduce car accidents?
  • Question 2: What best practice guidelines can be provided to network designers and planners for implementing a low-cost VANET in parking lots?
  • Question 3: What propagation model would best fit (closest match) with field measurement data?

1.2. Research Contribution

The key contributions of this paper are summarized as follows:
  • We conduct field measurements using wireless laptops and cards to collect a rich dataset in a large shopping mall parking lot in Auckland. To this end, we performed an extensive field measurement campaign to evaluate and validate the system’s performance.
  • We identify and measure the key parameters including received signal strengths, packet send/receipt, and response times between two experimental vehicles equipped with 802.11n cards. These field data form a rich data set to be used by system planners to predict the system’s performance in a similar parking lot elsewhere. We also evaluate and validate the system’s performance through various field experiments.
  • We develop simulation models using OPNET Modeler to study the system’s performance. To this end, we design five practical simulation scenarios to analyze and validate the system’s performance.
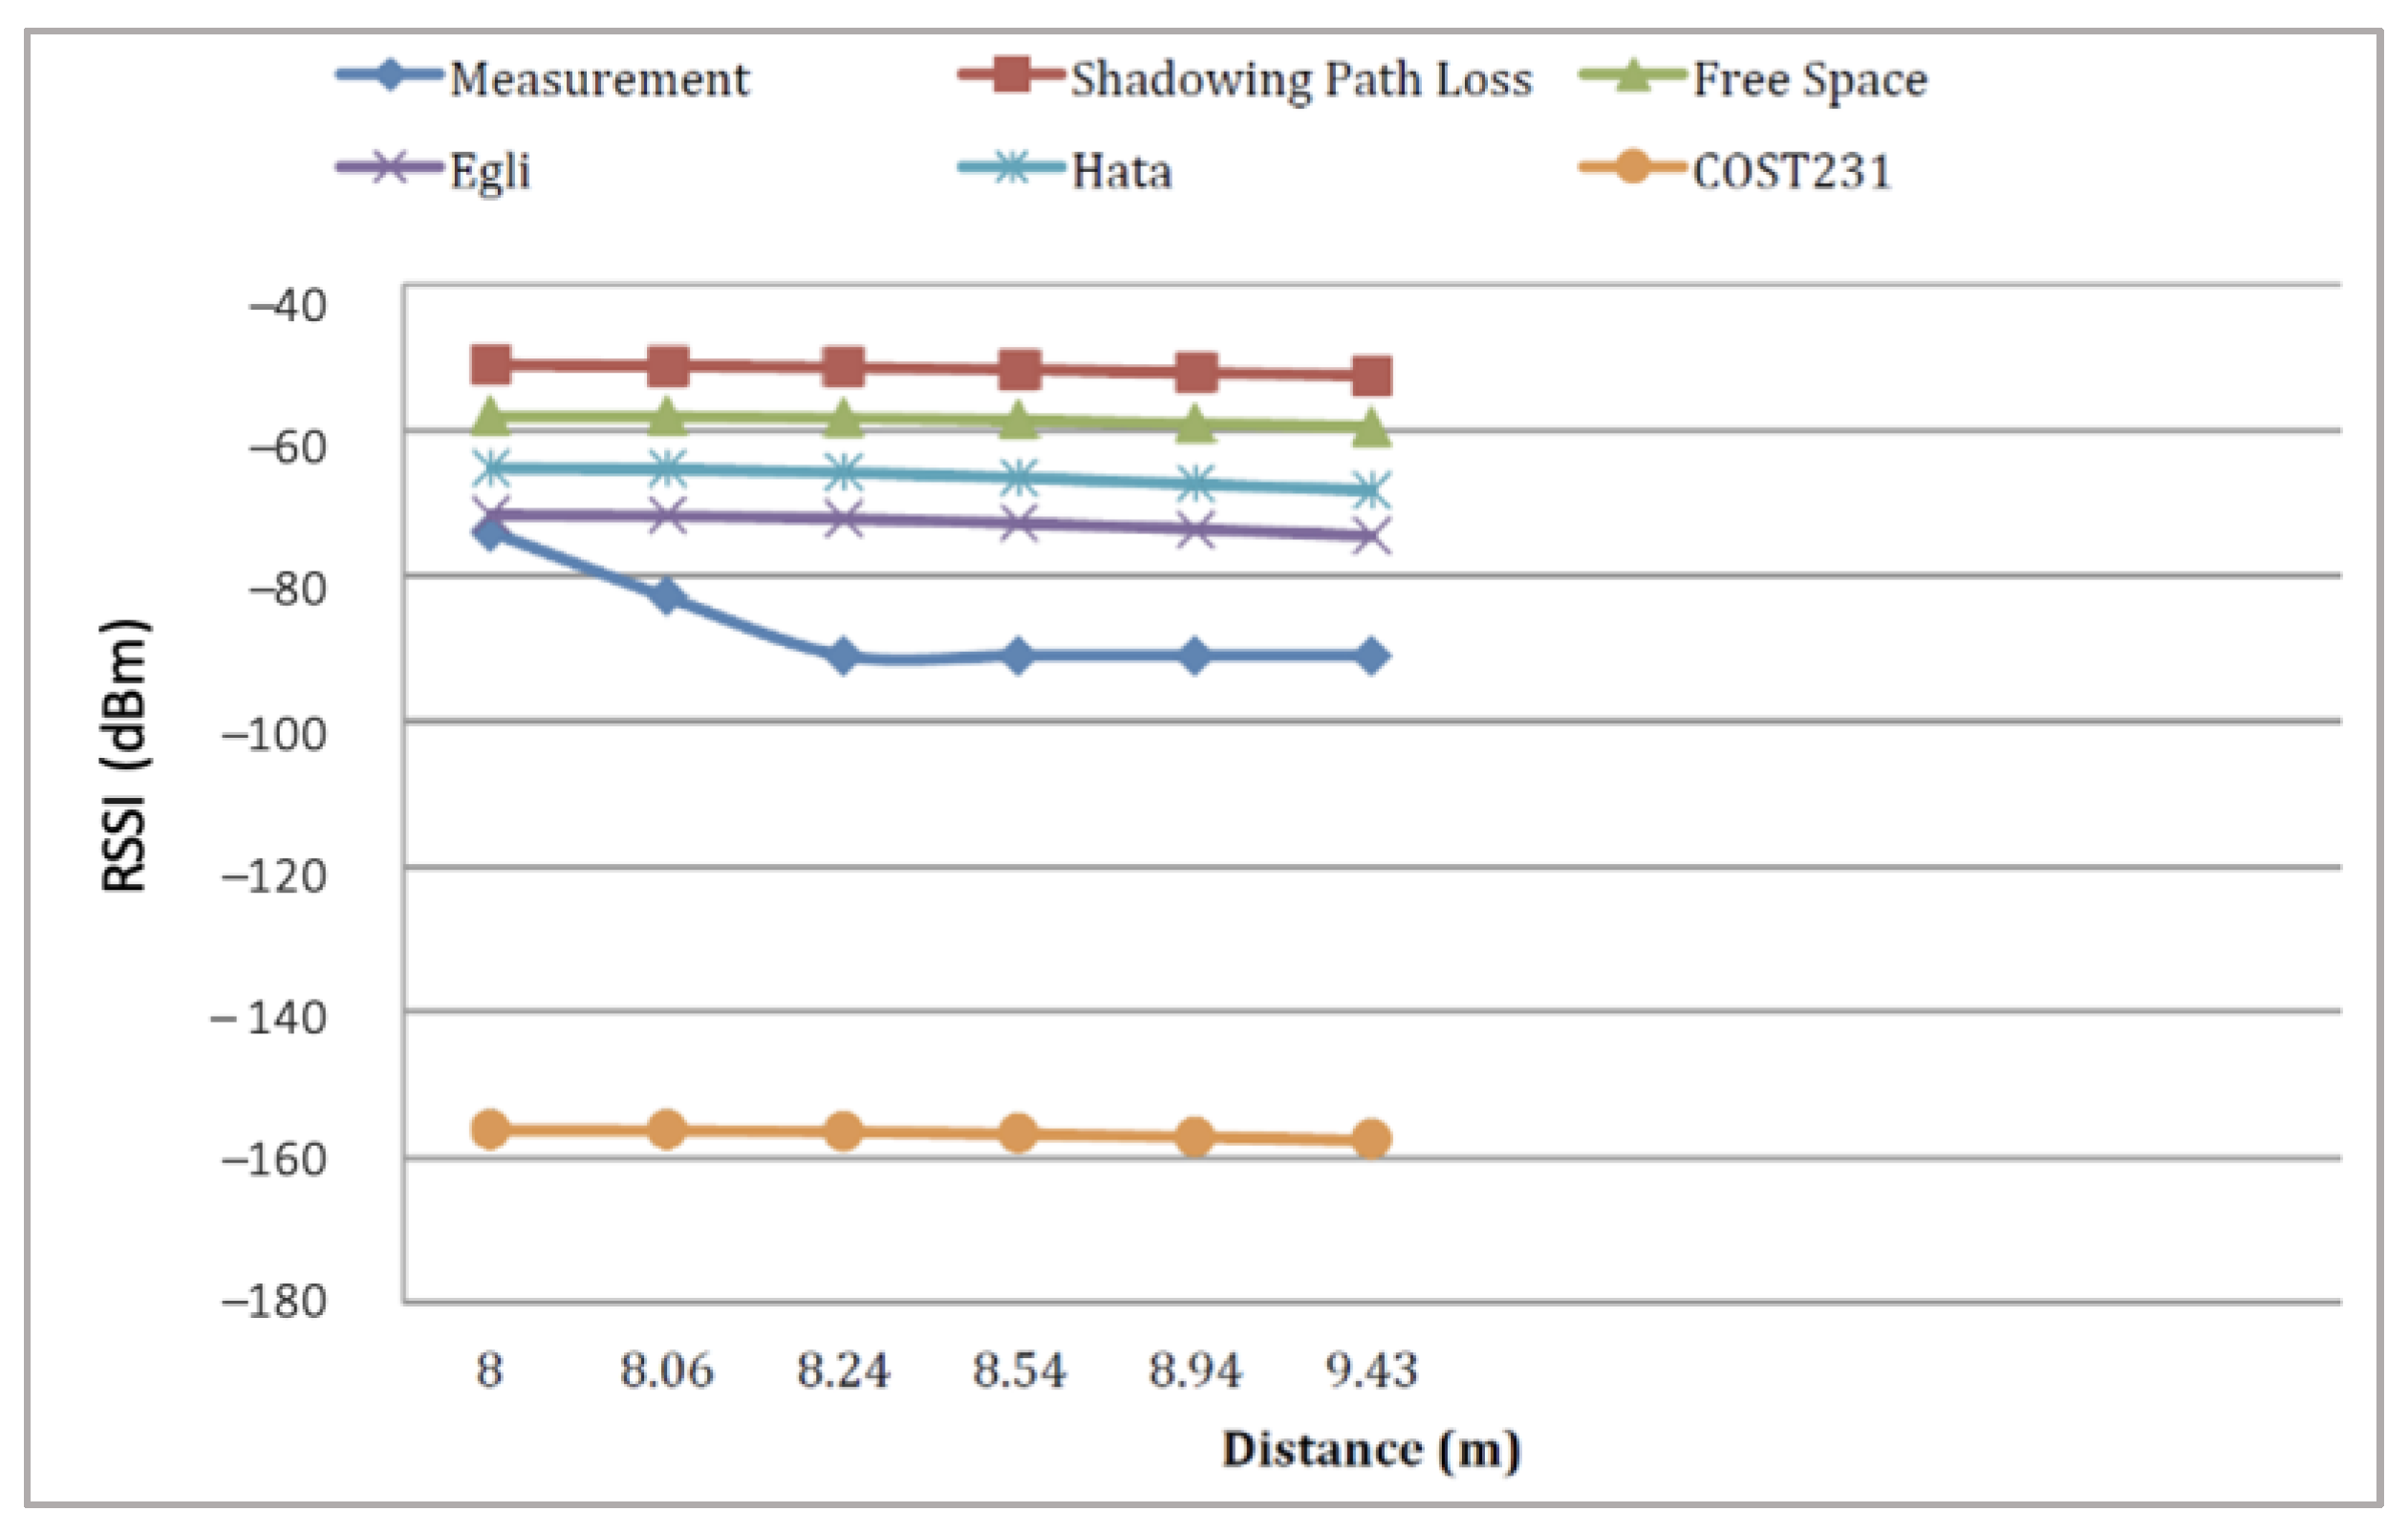
  • We analyze and find the best fit model that closely matches the field data to the propagation models. We consider and analyze five well-known propagation models (Free Space, Shadowing Path Loss, Egli, Hata, and COST 231). We have selected these models due to their popularity and relevance to our study.
This paper is organized as follows. The background information and related work are presented in Section 2. The research design, including setting up the field trial measurements, is presented in Section 3. Section 4 presents the measurement results and validation. The simulation results are discussed in Section 5. The practical implications for the system design and deployment are discussed in Section 6. Finally, a brief discussion in Section 7 ends the paper. Table 1 lists the abbreviations used in this paper.

2. Background and Related Work

This section provides some background information on ad hoc networks, specifically on VANETs. While the primary objective of this paper is to investigate the impact of the signal strength in ad hoc networks on the performance of VANETs, a literature review of the existing research is also essential to establish a measurement framework and choose the analysis methods for the results.
VANETs are provided as an important component of Intelligent Transportation Systems (ITS) especially for enhancing traffic safety [5,6,7]. The primary goal of VANETs is to improve the safety of drivers and passengers by facilitating the exchange of information between vehicles. VANETs can be considered an extreme form of mobile ad hoc networks (MANETs). While both MANETs and VANETs involve nodes communicating in an ad hoc manner without requiring fixed infrastructure, VANETs exhibit distinct characteristics [8,9]. The network topology in VANETs undergoes frequent changes due to high-speed mobility, and vehicles typically move in specific directions within the network.
Tufail, Fraser et al. [10] investigated the existing Wi-Fi protocol for Vehicle-to-Vehicle (V2V) communications in high speed environments. They demonstrated that Wi-Fi can be used for vehicular communication at high speeds and suggested some useful applications. Moreover, VANET provides massive opportunities for online vehicle entertainment such as through the local ad hoc networks sharing pictures, video, files, gaming, and chatting. Figure 1 shows a typical VANET application scenario consisting of in-vehicle and roadside sensors, their positions, intersection maps, and both-way wireless communications.
We observe that the VANET exchanges messages and establishes a communication link for Vehicle-to-Vehicle (V2V), Vehicle-to-Infrastructure (V2I), and roadside network infrastructure for Vehicle-to-Roadside (V2R) communications. Figure 2 illustrates various VANET applications. A number of applications have already been proposed which are likely to be designed for next-generation vehicles, including safety monitoring, map localization, parking localization, distance warning, V2V communication, vehicle collision warning, cooperative intersection safety, internet access, and driver assistance [11].
VANETs utilize short-range communication based on IEEE 802.11 wireless technology and rely on geographic positions for information exchange between network nodes. GPS receivers in vehicles enable node positions but challenges such as intermittent availability and signal loss remain.
Intelligent Digital Twin-based Software-Defined Vehicular Networks (IDT-SDVN) are an improvement to the Software-Defined Vehicular Network (SDVN) architecture highlighted in [12]. Its purpose is to overcome the constraints that are commonly associated with routing policies in vehicular networks. The methodology suggested, called ELITE routing, comprises the following four stages: policy training, policy generation, policy deployment, and relay selection. By utilizing Digital Twins, this system generates virtual instances of physical objects and constructs virtual network spaces, thereby facilitating the development of complex routing policies. The paper referenced above presents simulation results that indicate that ELITE routing provides significant enhancements in packet delivery ratio, end-to-end latency, and communication overhead when compared to currently employed techniques. However, specific information regarding the extent of these enhancements and the pragmatic factors to be considered when implementing this methodology is absent from the paper. Additional investigation might be required to authenticate the practical feasibility of IDT-SDVN and ELITE routing.
An extension of the above study is presented in [13], in which the authors presented IGNITE, a solution to address the issues in Vehicle Edge Computing (VEC) by leveraging clustering algorithms and Deep Reinforcement Learning (DRL). The system enhances the process of determining when to offload tasks in the constantly changing network structure of VEC, while also incorporating a mechanism for receiving and responding to feedback. Although the study shows potential, it is intricate, and the practical use and scalability of this method have not been explored. The inclusion of an analysis of the real-world viability and practicability of the paper’s findings, together with recommendations for future research work, would enhance its overall value.
A novel deep learning-driven methodology for the selection of analog beams in millimeter-wave (mm Wave) was investigated in [14]. By using wide beam measurements and two codebooks with varying beam widths, this scheme estimates and predicts the received powers of narrow beams. The problem is conceptualized as a super-resolution task, in which super-resolution techniques are used to derive high-resolution beam images from low-resolution beam images. Furthermore, spatial, and temporal correlations between beam qualities are incorporated into the method used to approach optimal beam selection performance. The simulation outcomes provide evidence that the suggested method for beam selection substantially mitigates the expenses linked to beam training, all the while preserving optimal performance.
Another related study on enhancing the efficacy of beamforming at the base station (BS) was conducted in [15]. This study introduced a composite beam and power allocation strategy for multiuser millimeter-wave (mm Wave) networks that is guided by deep learning (DL). Several obstacles in mm Wave networks, such as user and vehicle mobility, beam reselections, mismatched beamforming weights from DL-based methods, and beam conflicts in co-located user devices, motivate further research. By integrating supervised learning with super-resolution technology, the authors accomplished beam and power allocation with minimal overhead. The DL-based approach analyzes the correlation between high-resolution and low-resolution beam images to forecast beam quality. Following this, a strategy for beam and power allocation based on DL is formulated, which permits precise allocation by utilizing a subset of the time-sequential low-resolution images that are currently accessible. The paper focused on theoretical and numerical evidence supporting the efficacy of this approach; however, further emphasis can be placed on generating precise quantitative outcomes or the practical implications for real world scenarios. Additional investigation would help to authenticate the feasibility and enhancements in the performance of this DL-guided allocation technique within mm Wave networks.

2.1. VANET Applications and Classifications

VANET primarily aims to provide both safety and non-safety assistance through various applications which can be classified into two main groups: message and file delivery, and internet connectivity. Safety applications are prioritized in VANETs. However, transmission collisions can occur when multiple safety messages need to be sent simultaneously. Localization techniques can be beneficial for certain VANET applications, but accurately determining the physical location of nodes can be challenging. GPS receivers with a Geographic Information System (GIS) are commonly used for mapping location, but their accuracy (up to 20–30 m) is limited. This makes it difficult for them to work indoors or in urban environments where higher reliability and accuracy are important.
For safety-critical applications, combining GPS information with other localization techniques such as cellular localization, and image/video localization, may be necessary for enhanced accuracy and security. While VANET applications can function without localization, incorporating localization can improve the system performance when the vehicle’s position is known (Table 2).
VANETs use short-range networks for vehicle communication, allowing drivers to exchange messages with neighboring drivers [16,17]. This includes exchanging information about road safety, traffic conditions, and even parking spaces. Caliskan et al. [18] investigated the costs of searching for parking spaces and also closely investigated two cars on the move searching for a parking spot [19].

2.2. VANET Design Issues and Challenges

Nzouonta et al. [20] discussed various issues in VANET applications, including hidden and exposed node problems, stability, scalability, reliability, and security. High mobility and rapid network topology changes in vehicular networks can impact system operations. Scalability, as well as hidden and exposed node problems, also affect the system performance. Liu, Khorashadi et al. [21] studied VANET performance under various traffic loads. Karim [22] investigated the potential of VANET for safety applications and focused on security and privacy issues. Researchers have explored various aspects of VANET, including traffic, infrastructure requirements, and security measures. Yamamoto et al. [23] developed an accident prevention technique using real-time warnings to drivers. Overall, VANETs offer promising safety applications but their security and infrastructure considerations require attention. The challenges pertaining to the security and applications of VANET have been the subject of recent studies [24,25].

2.3. The 802.11 Protocol for VANET

The 802.11-based Wi-Fi protocol is a part of the 802 family, including the 802.11p amendment for Wireless Access in Vehicular Environments (WAVE) [26]. The 802.11 standard primarily focuses on physical and MAC layers in the OSI model. Figure 3 shows the relationship between the 802.11 and OSI layers. The combination of the logical link control (LLC) and MAC sub-layer are known as the data link layer in the OSI model. Various versions of the 802.11 standards, such as 802.11a, 802.11b, 802.11g, and 802.11n share a common MAC and LLC layer while adopting various physical layers. Table 3 summarizes review of literature on Wi-Fi-based VANETs.

3. Research Design

This experimental design involves a combination of Wi-Fi hardware and application software, and the setting up of field measurement scenarios. Performance metrics are also highlighted in this section.

3.1. Performance Metrics

The performance of a Wi-Fi-based VANET system is evaluated by considering both external and internal measurements. External measurements assess the effectiveness of the protocol and include metrics such as delay, debit, acquisition time, and the percentage of segments received out of sequence [36]. Internal measurements focus on the protocol’s internal efficiency and include metrics such as the average number of transmitted/received data bits, control bits, packets, and data [36].
The packet delivery ratio is a crucial metric for evaluating routing in any network. It can be calculated by dividing the total number of received packets by the total number of packets sent. This can be represented mathematically using the following equation:
Number of packets receive Number of packets sent
The end-to-end packet delay is measured as the time taken for a packet to be transmitted across a network from source to destination. It can be written as
d end end = N d trans + d prop + d proc
where dend-end = end-to-end delay, dtrans = transmission delay, dprop = propagation delay, dproc = processing delay, and N = number of links (number of routers + 1).
Packet losses occur when one or more packets across a network fail to reach their destination. These can be written as
PL = nSentPackets nReceivedPackets nSentPackets
where nReceivedPackets = number of received packets, and nSentPackets = number of sent packets.
Throughput is measured as the number of transactions per second an application can handle. Throughput depends on various factors such as type of test, computer specifications, network card speed, and software support. The network throughput can be written as
Throughput ( Mbps ) = Data Size ( MB ) Transmission Time ( s )

3.2. Hardware Specifications

To ensure accuracy of field trial data, the same wireless laptops, Wi-Fi cards, and APs were used throughout. The specifications of the hardware used are provided in Table 4.

3.3. Software Specifications

The study involved the use of various software applications and operating systems. The software used included Colligo Workgroup Edition 3.2 for file transfer and collaboration, WirelessMon for monitoring Wi-Fi signals, Windows OS 7 Professional for the operating system, OPNET for network performance simulation, and inSSIDer for Wi-Fi scanning and signal analysis. Each software served different purposes in the study, such as enhancing collaboration, monitoring signal strength, simulating network performance, and analyzing Wi-Fi conditions.

4. Results and Discussion

4.1. Measurement Environment

This study involved performing propagation measurements in different scenarios at the Henderson WestCity mall parking levels 1, 2, 3, and 4. The measurements were conducted to obtain significant results under various test conditions. Two types of files, a small text file (71 bytes) and a larger image file (1.05 MB), were used for the measurement tests. Colligo workshop software was utilized for file transfer and sharing, while WirelessMon was used to collect data such as the signal strength, bandwidth, data rate, and transfer time. Figure 4 illustrates the measurement area at Henderson WestCity shopping center.
The measurements were performed on different levels of the WestCity mall parking lot. Level 1 (Figure 5a) had dimensions of 35 m wide by 100 m long, while the remaining levels (including Level 2) had dimensions of 35 m wide by 50 m long, as shown in Figure 5b. The mall’s exterior flooring and walls are made of concrete, and each level has concrete ramps, lifts, and stairs. There is approximately a 4 m separation between each floor level. The measurements were conducted across all parking levels of the mall.
To conduct the field measurements, we took the following preparation steps, as shown in Figure 6. Figure 6a shows that the intended route that each car is allocated is in three segments: the start position, start-to-end parking measurements, and the end position. The most important part of this segment is the parking measurement. Figure 6b shows that the distance of the parking measurement is 1m from approach to departure. Figure 6c shows that the measurement process continues to cover up to 100 m.
The flowchart of the field measurement process is shown in Figure 7. It involved setting up the necessary hardware and installing the required software. The same procedure was repeated for another computer. The Wi-Fi connections of both computers were checked, and their IP addresses were provided to establish communication between them. The required distance for measurement was determined and marked as the destination. Data collection was then initiated, starting with the first measurement and proceeding to subsequent measurements.

4.2. Measurement Scenarios

The field trial measurement tests aimed to validate the functionality of the rescue VANET system through integrated testing. The tests provided quantitative performance data and valuable insights for future improvements. Two cars, namely Car A and Car B, were used in the field study; Car A was used as the transmitter and Car B as the receiver. Figure 8 illustrates a typical V2V scenario that was tested, and each test and scenario involved different VANET schematic demonstrations.
All scenarios were conducted with non-line of sight (NLOS) conditions in which the wireless router had a fixed height of 1m, and the transmitter was moved along the parking lot. Table 5 lists the five practical scenarios that we considered in this study in a controlled environment.

4.3. Field Measurement Results

The preliminary trials in the parking lot of the WestCity Auckland shopping mall were successful, but there were significant connectivity issues during the network assessment. These issues resulted in delays and packet loss during packet transmission. The assessment involved using a laptop connected to an IEEE 802.11n USB Wireless Adapter and IEEE 802.11n 2.4 GHz Antenna. Prior to the official measurements, the inSSIDer software was used to test the network and it detected a high number of SSIDs (19 to 36) in all scenarios (Figure 9), indicating interference from other networks.
In all scenarios (1 to 5), the network strength, as depicted in Figure 10, was found to be inconsistent and unreliable. The received signal strengths (RSSI) for Scenarios 1 to 5 ranged from −75 to −87 dBm, −74 to −90 dBm, −67 to −87 dBm, −74 to −90 dBm, and −67 to −88 dBm, respectively. These measurements indicate that the network had low performance and was not reliable, in terms of signal strength quality, across all scenarios.

4.4. Analysis of Results

The summary of the field measurement results (all 5 Scenarios) is shown in Figure 11a–e. The result for each scenario is discussed next.
Scenario 1 (Level 1): The measurements were conducted on Level 1 of the WestCity Auckland shopping mall parking lot using two wireless laptops (802.11n cards) equipped with two experimental cars. The TX and RX were positioned at specific distances, and file sharing was initiated from TX to the RX. The field trial results from Scenario 1 (Figure 11a) showed that the received signal strength indicator (RSSI) had the best reliability at around −45 dBm within 1 m to 2 m, while it had its lowest performance at approximately −90 dBm to −92 dBm, in the range of 50 m to 58 m. The transmission time and the number of missing packets increased as the distance between the TX and RX increased. This indicates that network performance and reliability decreased with increasing distance, with significant packet losses observed at longer distances.
Scenario 2 (Level 1 to Level 2): The measurements were conducted between Level 1 and Level 2 of the WestCity shopping mall parking lot using two cars equipped with wireless laptops. The RSSI and packet transmission were assessed over increasing distances. The best RSSI performance was observed at approximately 4 m to 4.12 m but degraded beyond that range (Figure 11b). As the distance increased, the number of missing packets during transmission also increased significantly. This was observed for both text and image files, indicating a decrease in network performance and reliability with increasing distance. Factors such as wall barriers and blocked roofs likely contributed to the signal degradation and packet losses.
Scenario 3 (Level 1 to Level 3): The measurements were conducted between Level 1 and Level 3 of the WestCity shopping mall parking lot using two cars equipped with laptops. The RSSI, missing packets, and file sharing were assessed at different distances. The best RSSI performance was observed at approximately 8m, indicating the optimal reliability between the two levels (Figure 11c). However, as the distance increased beyond 8.24 m, the RSSI decreased significantly, indicating poor reliability. Beyond 9.43 m, connection was lost (no signal) between the transmitter (TX) and receiver (RX). The number of missing packets increased as the distance increased, leading to a decreased reliability in file transmission. For both text and image files, successful transmission was observed up to 8.06 m, but frequent disconnections occurred beyond 8.6 m. The transmission time between the TX and RX was approximately 1.6 ms.
Scenario 4 (Level 1 to Level 4): The measurements in the WestCity shopping mall parking lot were conducted between Level 1 and Level 4, using two cars equipped with laptops, labeled TX and RX. However, we did not obtain any results due to the connection loss between TX and RX at a separation of 12 m.
Scenario 5 (Level 1 to Roadside): Measurements were conducted from Level 1 of the parking lot to Edsel Street. As before, two cars with laptops were used, where one laptop acted as the TX on Level 1 and the other one as RX on Edsel Street. The measurements were carried out at varying distances, and file sharing was initiated from the TX to the RX (Figure 11e). In this scenario, the RSSI showed the highest reliability at distances ranging from 11 m to 31 m, with RSSI values ranging from −55 dBm to −74 dBm. However, at distances between 41 m and 68 m, the RSSI indicated poor reliability, with values ranging from −81 dBm to −92 dBm.
For the transmission of a text file, the number of missing packets increased with the separation between the TX and RX. We found about 275, 412, 1125, and 1155 lost packets for 11 m, 26 m, 57 m, and 68 m, respectively. Similarly, for the transmission of an image file (1.5 MB), a significant number of missing packets were observed at increasing distances. For instance, we found 156,870, 170,990, and 181,000 missing packets at distances of 11 m, 31 m, and 50 m, respectively.

4.5. Validation of the Results

The Wi-Fi signal strength quality was measured in %, and the corresponding signal strength values in dB. However, we found that signal strengths of 90% and above were regarded as strong signals (−55 dB), whereas the low-quality signals had an approximate RSS of 30% (−80 dB). An RSS of below −80 dB is regarded as a very weak signal. Access points are needed to boost the signal strength for vehicular ad hoc networks.
In open road environments, heavy traffic can negatively impact V2V communications in the 2.4 GHz band. Similarly, crowded scenarios in highway settings lead to the 60 GHz frequency band experiencing higher path loss. Previous research has focused on improving the physical and MAC layer protocols, transmission power control, and channel assignment in VANETs. Field trial measurements and propagation studies highlight the importance of optimal access point placement to enhance VANET performance.
The field measurement was repeated three times for each scenario to ensure accurate data were collected. The parking lot in the mall is usually crowded seven days a week, especially during opening hours. We performed field measurements at lunchtime, when less people and cars were moving around the parking lot. Firewalls and anti-virus software were disabled. During the field measurements there were quite a few neighboring wireless networks detected. To avoid co-channel interference with the system performance, the access points (APs) were set to a different channel.

5. Simulation Study

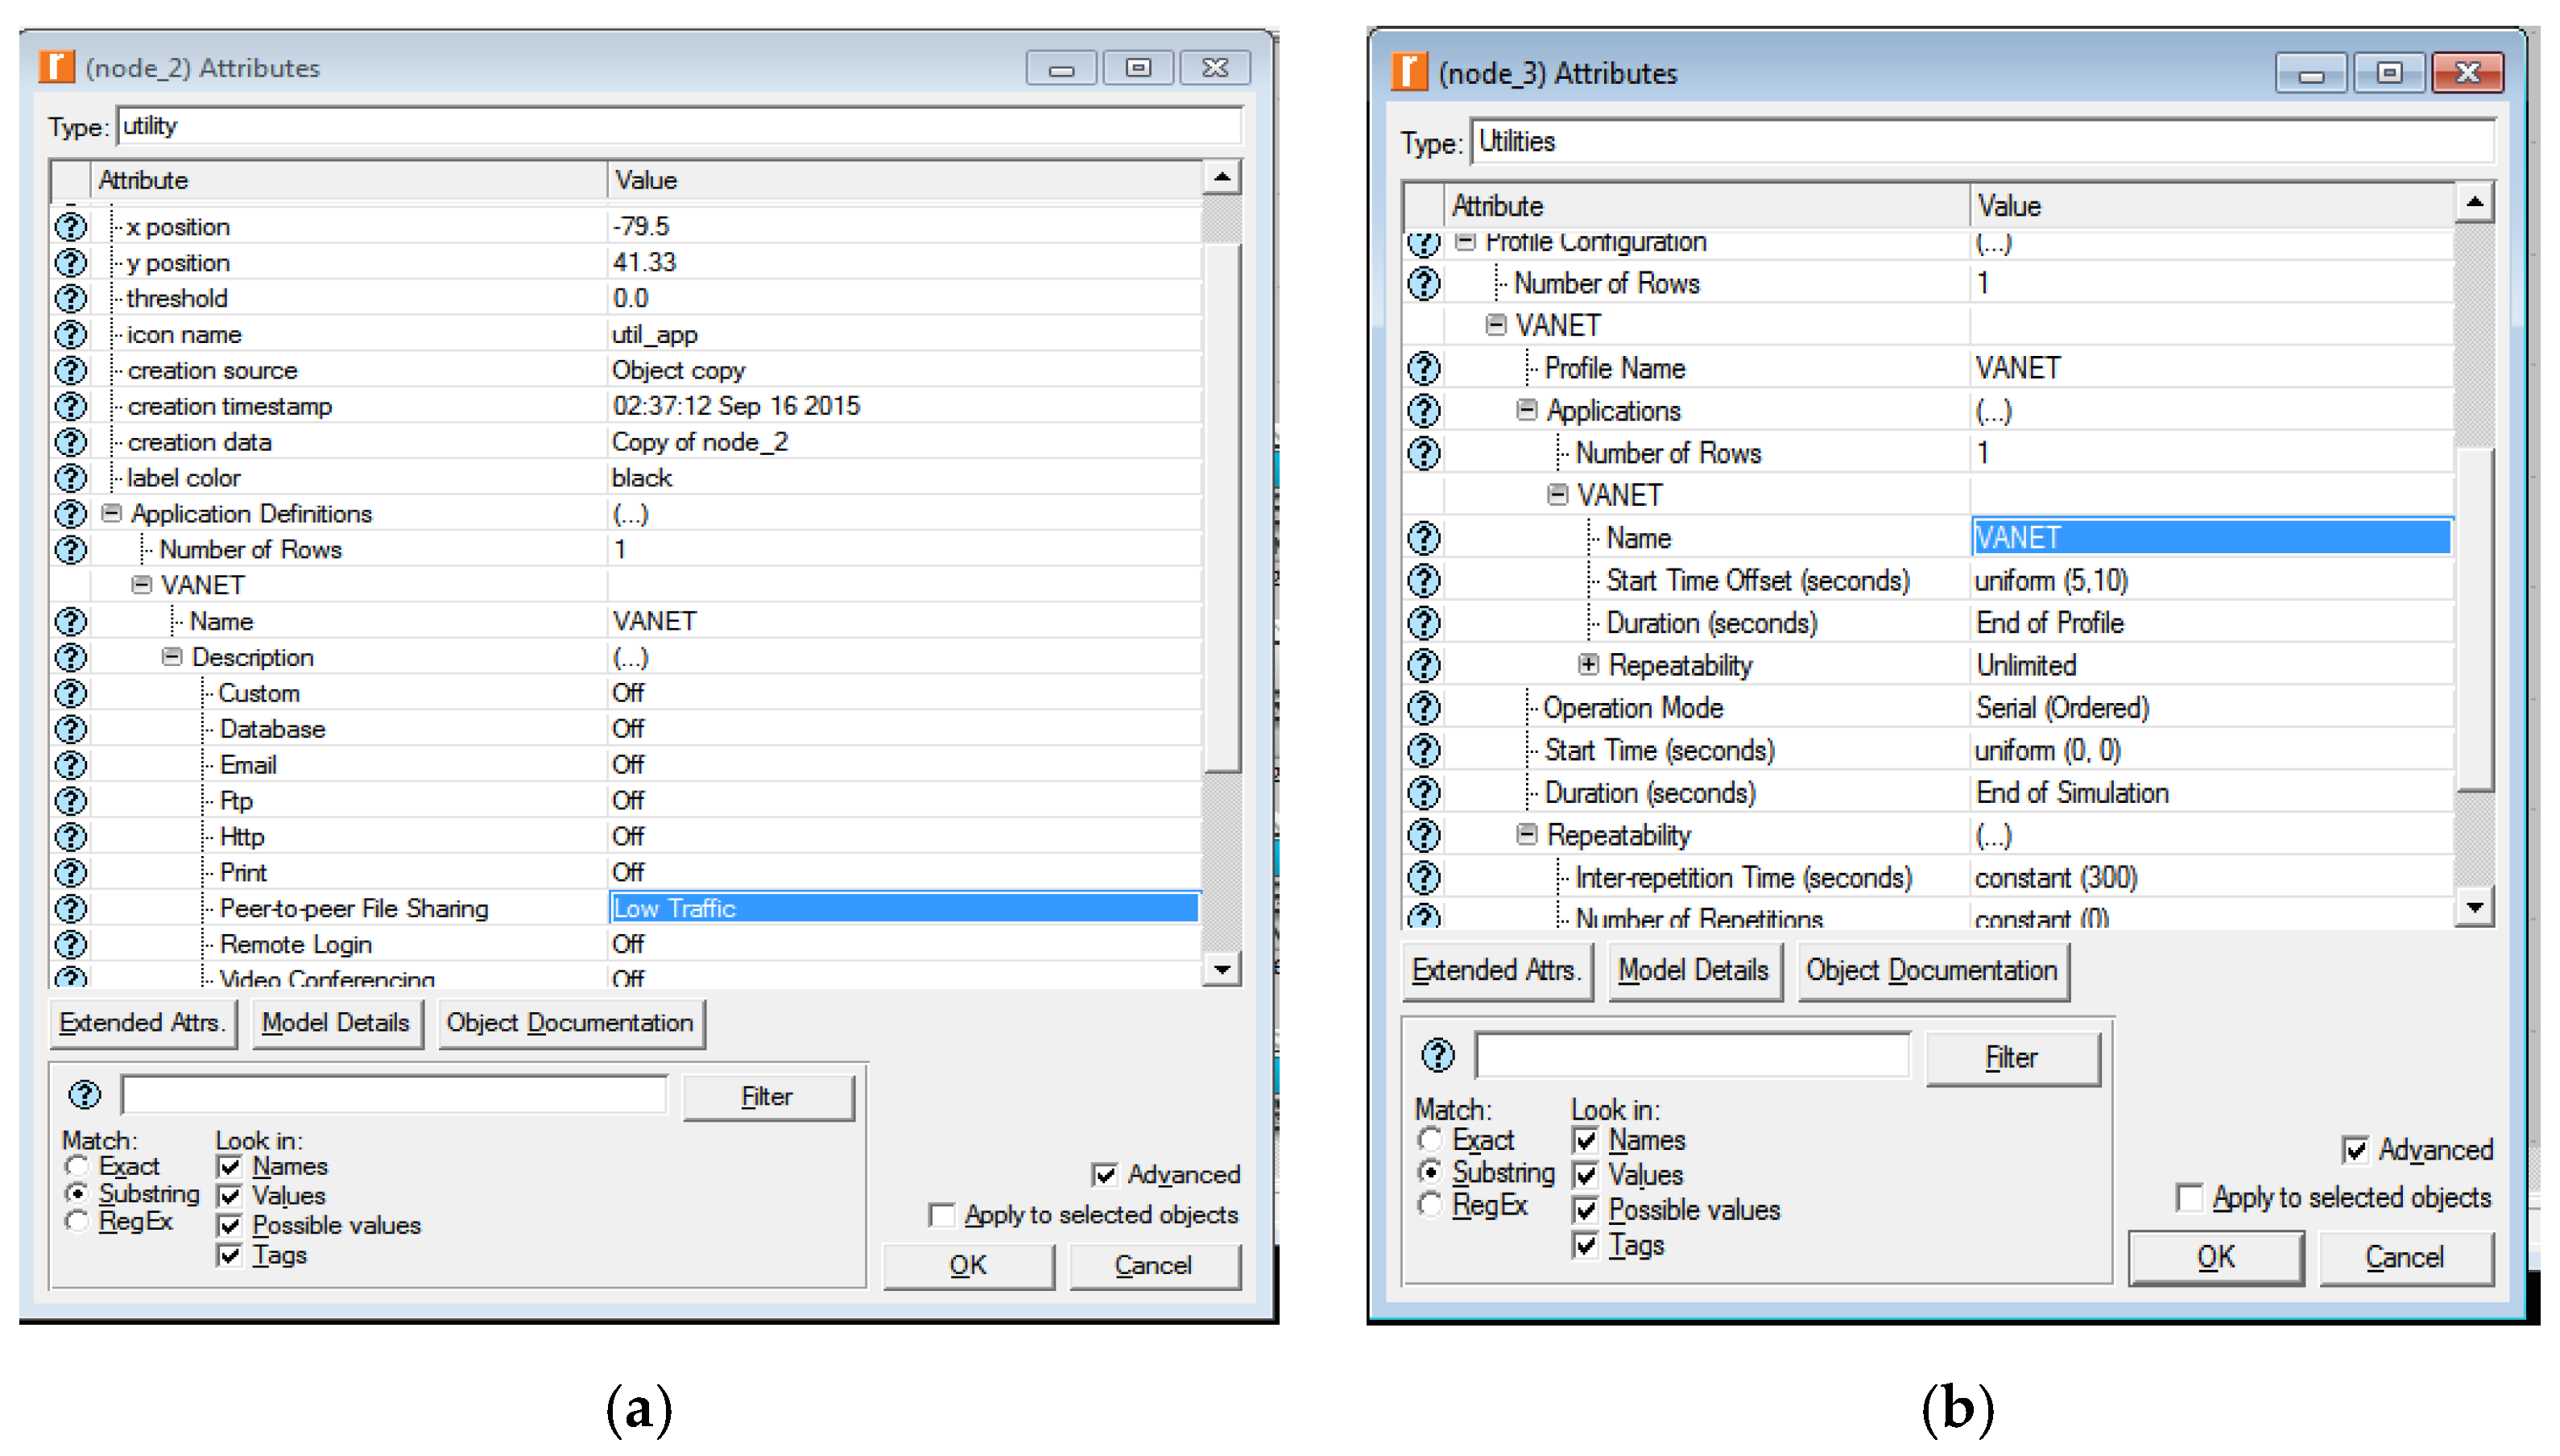
5.1. Modeling the Network

We used the OPNET Modeler simulation package because of its availability and credibility. Figure 12 shows the simulation network topology, with a network size of 50 nodes. Table 6 lists the parameters used in the simulation (default settings). We have conducted various simulation experiments and measured the key performance metrics, including average packet delay, throughput, traffic sent, traffic received, download file size, and download response time. The network configuration used in the simulation is shown in Figure 13a. The simulation aimed to assess the impact on ad hoc network performance of varying node densities, from N = 2 to 50 nodes. We considered both FTP and P2P traffic for the study of the system’s performance.

5.2. Simulation Results and Discussion

We observe the effect of increasing the number of wireless nodes on system performance. Using the OPNET Modeler simulator, we measure packet delays, throughput, P2P file sharing, download file size, response time, traffic sent, traffic received, and the FTP file sharing download response time, upload time, traffic sent, and traffic received. The simulations run for 300 s with varying nodes, and the results are recorded and analyzed. The summary of the simulation results is presented in Figure 14a–j.
Figure 14a shows that the network throughput of the 802.11n infrastructure network increases with the number of nodes (N), with a more significant increase for N > 30. Figure 14b shows that the packet delays increase with the number of nodes. Figure 14c,d show the results of P2P file sharing download response time. We observe that there is a significant difference in download response times between low- and high-traffic scenarios with an increasing number of nodes. The download response times show a fluctuating trend with an increasing number of nodes.
Figure 14e,f show the traffic sent and received, respectively, for different P2P file-sharing scenarios with an increasing number of nodes. There is a noticeable difference between low and high traffic in terms of increasing traffic sent and received. Figure 14g,h show the results for the download and upload response time, respectively, for various FTP traffic loads. The download response times increase with the number of nodes, while upload response times fluctuate.
Figure 14i,j show the relationship between traffic sent and traffic received for various FTP loads (low, medium, and high) for an increasing number of nodes. The results show a significant increase in the FTP traffic sent as the number of nodes increases, with no clear relationship between traffic sent and the number of nodes. Additionally, there is not much disparity between the traffic received and traffic sent, although the mean traffic received increases with the number of nodes.

5.3. Model Validation

Although the OPNET Modeler is one of the credible network simulators, it may produce invalid results if the simulation parameters are not correctly configured. We validated our simulation results in three different ways. First, the simulation log files were checked to ensure that there were no errors, and the simulation models ran correctly. We ran the simulation for 300 s, ensuring that enough data were collected to obtain a steady state in the simulation results. Second, we checked network compatibility to ensure that there were no technical issues, and that the simulation ran smoothly. Third, we tested the network performance with a small number of nodes and compared it with testbed results. Finally, we compared our simulation results with similar work published in the literature for correctness [37,38,39].

6. Propagation Models Versus Measurements

To find the best propagation model that matches the measurement results, we consider the following five well-known propagation models: (i) Free Space; (ii) Shadowing Path Loss; (iii) Egli; (iv) Hata; and (v) COST 23. These propagation models and their implications when deploying Wi-Fi-based VANETs in a large shopping mall are discussed next.
This section also highlights the superior performance of the “Free Space” and Hata models in Scenario 1, the close agreement of the Egli model with measurement data in Scenario 2, the slight advantage of the Egli model in Scenario 3, and the good agreement of the “Free Space” model in Scenario 5. For the path loss calculation, factors such as transmitter power, receiver sensitivity, cables, antennas, free space loss, and other losses are considered. All the models used are suitable for their intended purposes, but they all operate in the “Far field region”. Table 7 provides an overview of the parameters used in the five empirical propagation models.
Figure 15, Figure 16, Figure 17 and Figure 18 show the accumulated path losses for the five selected propagation models. The received signal strength versus the distance plot is also presented, revealing the performance of the five models. Upon comparing the practical measurement path losses with the theoretical model values, a difference is observed. It is important to note that the theoretical data may not precisely match real-world applications due to environmental factors and operating conditions. However, it is evident that higher frequencies generally result in greater losses.
Figure 15 compares different propagation models’ path losses in Scenario 1, with the “Free Space” and “Hata” models displaying the lowest predictions. The RSSI values decrease as the distance increases. The “Free Space” model has the superior path loss prediction, while the “COST 231”, “Egli”, and “Shadowing Path Loss” models overestimate path loss. The “Hata” and “Free Space” models closely match the measured data and are recommended for evaluating signal propagation under non-line-of-sight conditions.
Figure 16 compares the path loss models in Scenario 2. The “Egli” model has the lowest path loss prediction, while the “Hata” model exhibits the highest. The “Hata” model slightly distorts the power–distance relationship under NLOS conditions but agrees well with the measured data. Other models overestimate path loss. Therefore, the “Hata” model is recommended for accurate signal propagation evaluation in Scenario 2.
Figure 17 compares path loss predictions of the different propagation models in Scenario 3. The “Egli” model shows the lowest path loss, ranging from −71.64 dBm to −74.54 dBm, for distances of 8 m to 9.43 m. Under non-line-of-sight conditions, the “Egli” model slightly distorts the power–distance curve but aligns well with the measured data. The “Shadowing Path Loss”, “Free Space”, “Hata”, and “COST 231” models yield higher path loss predictions, which are considered unrealistic and disregarded under NLOS conditions. Based on the measured and model results, the “Egli” model is the closest match and demonstrates good agreement with the data. It is recommended for evaluating signal propagation under NLOS conditions in Scenario 3, providing accurate path loss estimates compared to other models.
In Figure 18, the path loss of different models in Scenario 5 is compared. The “Free Space” and “Shadowing Path Loss” models have the lowest path loss predictions, while the “Egli”, “Hata”, and “COST 231” models have the highest. Under non-line-of-sight conditions, the “Free Space” and “Shadowing Path Loss” models perform well, while others are unrealistic. The “Free Space” model is recommended for accurate signal propagation evaluation in Scenario 5, as it provides closer estimates to the actual values and better matches the measured data.
In our comparison of different indoor propagation models with the field measurement data, we found that only five models closely approximate the actual measurement characteristics: the “Free Space”, “Shadowing Path Loss”, “Egli”, “Hata”, and “COST 231” models. All other models deviated significantly from the measured data, indicating their inefficiency for network planning in this region. However, the “Free Space” propagation model, after correction, showed a good fit with the measured received signal power for the required distances, as observed in Figure 15, Figure 16, Figure 17 and Figure 18.

7. Practical Implications

Figure 19 shows practical Wi-Fi-based VANET deployment scenarios in a shopping mall parking lot in Auckland City. Wireless access points (APs) serve as central transmitters and receivers for Wi-Fi networks. Each AP has its radio range, typically 20 m to 100 m, depending on the technology and the environment in which it operates. Multiple APs ensure the coverage and capacity of the system. Careful channel assignment can avoid co-channel interference and therefore improve the system’s performance. Minimizing this inter-access-point interference is crucial for co-channel users, and achieved through careful RF channel assignment and deployment. Migrating to the 5 GHz spectrum in 802.11n networks can reduce channel reuse problems and boost the system performance. Wi-Fi extenders can be used to extend coverage by rebroadcasting signals from the base AP to users at a distance or behind barriers. Smart antenna technology with multiple elements enhances performance by increasing gain, coverage, and data rates. Metal shielding and toroidal helical antennas improve signal propagation. These steps and techniques optimize inter-floor signal propagation in the buildings in which a Wi-Fi network operates.
One can observe that two access points (APs) are deployed on each floor for better coverage and performance, given the floor plan of the WestCity shopping mall. If more than two APs (per floor) are deployed, the cost versus coverage (i.e., deployment costs) will be higher and co-channel interference will potentially be increased.
We provide the following four best practice guidelines for practitioners:
  • Identifying the VANET deployment requirements (a feasibility study) such as the facility required and any issues/restrictions for system deployment.
  • Determining practical deployment scenarios such as shopping mall parking lots, single-floor, multi-floor, or campus environments.
  • Identifying technical requirements such as the minimum signal strength, signal-to-noise ratio, delay/jitter tolerance, and the maximum transmitting power.
  • Conducting preliminary field trial measurements for Wi-Fi-based VANETs using real hardware and software.

8. Conclusions

We studied the performance of a Wi-Fi-based vehicular ad hoc network (VANET) for deployment in shopping mall parking lots using field trial measurements and simulations. We developed an OPNET-based simulation model to validate the system’s performance. The system’s performance was validated by configuring and analyzing various simulation scenarios. The research findings reported in this paper provide some insights into the deployment of VANETs with the goal of enhancing road safety and communication efficiency in the WestCity shopping mall parking lot in Auckland.
Finally, we analyzed the compatibility of five selected theoretical propagation models (Free Space, Shadowing Path Loss, Egli, Hata, and COST 231). The results obtained have shown that the best-fit model (a close match with the measurements) is based on the measurement scenario/location. For instance, the “Free Space” model is one of the best-fit models for the scenario in which measurements are conducted from Level 1 of the car park to the roadside. The received signal strengths in the parking lot ranged from −45 dBm to −92 dBm. We also examined the coverage distance for the successful transmission of warning messages, achieving up to 57 m, 17.5 m, 9.4 m, and 68 m at parking levels 1, 2, 3, and the roadside, respectively. These findings are valuable for configuring similar networks and aiding the decision-making of administrators. We emphasized the impact of the separation distance and received signal strength on system performance, highlighting the need for practical measurements and comprehensive analysis beyond theoretical models. The challenges of identifying and addressing misbehavior in VANETs, particularly for safety and congestion avoidance applications are suggested as key areas of future work.

Author Contributions

Conceptualization, N.I.S. and F.A.; Methodology, N.I.S. and F.A.; Software, N.I.S.; Validation, N.I.S. and F.A.; Formal analysis, N.I.S. and F.A.; Investigation, F.A.; Resources, N.I.S.; Data curation, N.I.S. and S.G.; Writing—original draft, F.A.; Writing—review & editing, N.I.S. and S.G.; Visualization, N.I.S., F.A. and S.G; Supervision, N.I.S.; Project administration, N.I.S.; Handling reviewer comments, N.I.S. and S.G. All authors have read and agreed to the published version of the manuscript.

Funding

This research received no external funding.

Data Availability Statement

Data are contained within this article.

Conflicts of Interest

The authors declare no conflict of interest. We also confirm that our paper has not been previously published and is not currently under consideration by any other journals.

References

  1. Total Number of licensed vehicles in New Zealand from 2014 to 2023, in Statista. 2023: New Zealand. Available online: https://www.statista.com/statistics/735099/new-zealand-currently-licensed-vehicles/#:~:text=There%20were%20approximately%204.5%20million,3.6%20million%20vehicles%20in%202014 (accessed on 14 November 2023).
  2. Raya, M.; Hubaux, J.-P. Securing vehicular ad hoc networks. J. Comput. Secur. 2007, 15, 39–68. [Google Scholar] [CrossRef]
  3. Naumov, V.; Baumann, R.; Gross, T. An evaluation of inter-vehicle ad hoc networks based on realistic vehicular traces. In Proceedings of the 7th ACM International Symposium on Mobile Ad Hoc Networking and Computing, Florence, Italy, 22–25 May 2006. [Google Scholar]
  4. Lagraa, N.; Yagoubi, M.B.; Benkouider, S. Localization technique in VANets using Clustering (LVC). Int. J. Comput. Sci. Issues (IJCSI) 2010, 7, 10–16. [Google Scholar]
  5. Gaurav, A.; Gupta, B.B.; Chui, K.T. Edge Computing-Based DDoS Attack Detection for Intelligent Transportation Systems. In Cyber Security, Privacy and Networking: Proceedings of ICSPN 2021; Springer: Singapore, 2022; pp. 175–184. [Google Scholar]
  6. Lansky, J.; Rahmani, A.M.; Hosseinzadeh, M. Reinforcement Learning-Based Routing Protocols in Vehicular Ad Hoc Networks for Intelligent Transport System (ITS): A Survey. Mathematics 2022, 10, 4673. [Google Scholar] [CrossRef]
  7. Ahmad, F.; Adnane, A.; Franqueira, V.N.L.; Kurugollu, F.; Liu, L. Man-in-the-middle attacks in vehicular ad-hoc networks: Evaluating the impact of attackers’ strategies. Sensors 2018, 18, 4040. [Google Scholar] [CrossRef] [PubMed]
  8. Cunha, F.; Villas, L.; Boukerche, A.; Maia, G.; Viana, A.; Mini, R.A.F.; Loureiro, A.A.F. Data communication in VANETs: Protocols, applications and challenges. Ad Hoc. Netw. 2016, 44, 90–103. [Google Scholar] [CrossRef]
  9. Schoch, E.; Kargl, F.; Weber, M. Communication patterns in VANETs. IEEE Commun. Mag. 2008, 46, 119–125. [Google Scholar] [CrossRef]
  10. Tufail, A.; Fraser, M.; Hammad, A.; Hyung, K.K.; Yoo, S.W. An empirical study to analyze the feasibility of WIFI for VANETs. In Proceedings of the 2008 12th International Conference on Computer Supported Cooperative Work in Design, Xi’an, China, 16–18 April 2008; IEEE: Piscataway, NJ, USA, 2008. [Google Scholar]
  11. Boukerche, A.; Oliveira, H.A.; Nakamura, E.F.; Loureiro, A.A. Vehicular ad hoc networks: A new challenge for localization-based systems. Comput. Commun. 2008, 31, 2838–2849. [Google Scholar] [CrossRef]
  12. Zhao, L.; Bi, Z.; Hawbani, A.; Yu, K.; Zhang, Y.; Guizani, M. ELITE: An intelligent digital twin-based hierarchical routing scheme for softwarized vehicular networks. IEEE Trans. Mob. Comput. 2022, 22, 5231–5247. [Google Scholar] [CrossRef]
  13. Zhao, L.; Zhao, Z.; Zhang, E.; Hawbani, A.; Al-Dubai, A.Y.; Tan, Z.; Hussain, A. A Digital Twin-Assisted Intelligent Partial Offloading Approach for Vehicular Edge Computing. IEEE J. Sel. Areas Commun. 2023, 41, 3386–3400. [Google Scholar] [CrossRef]
  14. Echigo, H.; Cao, Y.; Bouazizi, M.; Ohtsuki, T. A deep learning-based low overhead beam selection in mmWave communications. IEEE Trans. Veh. Technol. 2021, 70, 682–691. [Google Scholar] [CrossRef]
  15. Cao, Y.; Ohtsuki, T.; Maghsudi, S.; Quek, T.Q.S. Deep Learning and Image Super-Resolution-Guided Beam and Power Allocation for mmWave Networks. IEEE Trans. Veh. Technol. 2023. [Google Scholar] [CrossRef]
  16. Wang, K.; Song, T.; Wang, Y.; Fang, C.; He, J.; Nirmalathas, A.; Lim, C.; Wong, E.; Kandeepan, S. Evolution of short-range optical wireless communications. J. Light. Technol. 2023, 41, 1019–1040. [Google Scholar] [CrossRef]
  17. Molina-Masegosa, R.; Gozalvez, J. LTE-V for sidelink 5G V2X vehicular communications: A new 5G technology for short-range vehicle-to-everything communications. IEEE Veh. Technol. Mag. 2017, 12, 30–39. [Google Scholar] [CrossRef]
  18. Caliskan, M.; Graupner, D.; Mauve, M. Decentralized discovery of free parking places. In Proceedings of the 3rd International Workshop on Vehicular ad Hoc Networks, Los Angeles, CA, USA, 29 September 2006. [Google Scholar]
  19. Xu, B.; Ouksel, A.; Wolfson, O. Opportunistic resource exchange in inter-vehicle ad-hoc networks. In Proceedings of the IEEE International Conference on Mobile Data Management, Berkeley, CA, USA, 19–22 January 2004; IEEE: Piscataway, NJ, USA, 2008. [Google Scholar]
  20. Nzouonta, J.; Rajgure, N.; Wang, G.; Borcea, C. VANET routing on city roads using real-time vehicular traffic information. IEEE Trans. Veh. Technol. 2009, 58, 3609–3626. [Google Scholar] [CrossRef]
  21. Liu, B.; Khorashadi, B.; Ghosal, D.; Chuah, C.N.; Zhang, M.H. Assessing the VANET’s local information storage capability under different traffic mobility. In Proceedings of the 2010 Proceedings IEEE INFOCOM, San Diego, CA, USA, 15–19 March 2010; IEEE: Piscataway, NJ, USA, 2010. [Google Scholar]
  22. Karim, R. VANET: Superior system for content distribution in vehicular network applications. Rutgers Univ. Dep. Comput. Sci. Tech. Rep. 2008, 364–370. Available online: https://people.cs.rutgers.edu/~rmartin/teaching/fall08/cs552/position-papers/011-01.pdf (accessed on 14 November 2023).
  23. Yamamoto, M.; Fujita, K.; Ohnishi, K.; Seto, M.; Kamata, K. Development of vehicle-infrastructure cooperative systems—Field operational test of hiroshima DSSS. In Proceedings of the ITS World Congress, New York, NY, USA, 16–20 November 2008. [Google Scholar]
  24. Hamdi, M.M.; Audah, L.; Rashid, S.A.; Mohammed, A.H.; Alani, S.; Mustafa, A.S. A review of applications, characteristics and challenges in vehicular ad hoc networks (VANETs). In Proceedings of the 2020 International Congress on Human-Computer Interaction, Optimization and Robotic Applications (HORA), Ankara, Turkey, 26–27 June 2020; IEEE: Piscataway, NJ, USA, 2010. [Google Scholar]
  25. Sharma, B.; Sharma, M.S.P.; Tomar, R.S. A survey: Issues and challenges of vehicular ad hoc networks (VANETs). In Proceedings of the International Conference on Sustainable Computing in Science, Technology and Management (SUSCOM), Amity University Rajasthan, Jaipur, India, 26–28 February 2019. [Google Scholar]
  26. Talukder, S.; Ira, S.T.B.; Khanom, A.; Sneha, P.B.; Saleh, W. A survey on 802.11 MAC industrial standards, architecture, security & supporting emergency traffic: Future directions. J. Ind. Inf. Integr. 2021, 24, 100225. [Google Scholar]
  27. Abdulshaheed, H.R.; Yaseen, Z.T.; Salman, A.M.; Al_Barazanchi, I. Vehicle Collision Detection & Prevention Using VANET Based IoT with V2V. arXiv 2022, arXiv:2205.07815. [Google Scholar]
  28. Abdulshaheed, H.R.; Yaseen, Z.T.; Salman, A.M.; Al_Barazanchi, I. A survey on the use of WiMAX and Wi-Fi on vehicular ad-hoc networks (VANETs). In IOP Conference Series: Materials Science and Engineering; IOP Publishing: Assiut, Egypt, 2020. [Google Scholar]
  29. Martelli, F.; Renda, M.E.; Santi, P.; Volpetti, M. Measuring voip performance in ieee 802.11 p vehicular networks. In Proceedings of the 2012 IEEE 75th Vehicular Technology Conference (VTC Spring), Yokohama, Japan, 6–9 May 2012; IEEE: Piscataway, NJ, USA, 2012. [Google Scholar]
  30. Ramteke, M.A.; Krishna, R. Realistic simulation for vehicular ad-hoc network using ZigBee technology. Int. J. Eng. 2012, 1, 1–5. [Google Scholar]
  31. Ho, I.W.-H.; Leung, K.K.; Polak, J.W. A methodology for studying vanet performance with practical vehicle distribution in urban environment. arXiv 2012, arXiv:1211.6251. [Google Scholar]
  32. Grilli, G. Data Dissemination in Vehicular Networks. Ph.D. Thesis, University of Rome, Tor Vergata, Italy, 2010. [Google Scholar]
  33. Buchenscheit, A.; Schaub, F.; Kargl, F.; Weber, M. A VANET-based emergency vehicle warning system. In Proceedings of the 2009 IEEE Vehicular Networking Conference (VNC), Tokyo, Japan, 28–30 October 2009; IEEE: Piscataway, NJ, USA, 2009. [Google Scholar]
  34. Perahia, E. IEEE 802.11 n development: History, process, and technology. IEEE Commun. Mag. 2008, 46, 48–55. [Google Scholar] [CrossRef]
  35. Qian, Y.; Moayeri, N. Design of secure and application-oriented VANETs. In Proceedings of the VTC Spring 2008-IEEE Vehicular Technology Conference, Singapore, 11–14 May 2008; IEEE: Piscataway, NJ, USA, 2008. [Google Scholar]
  36. Corson, S.; Macker, J. RFC2501: Mobile ad Hoc Networking (MANET): Routing Protocol Performance Issues and Evaluation Considerations. RFC Editor. 1999. Available online: https://www.rfc-editor.org/rfc/rfc2501.html (accessed on 14 November 2023).
  37. Sarkar, N.I.; Sowerby, K.W. Wi-Fi performance measurements in the crowded office environment: A case study. In Proceedings of the 2006 International Conference on Communication Technology, Guilin, China, 27–30 November 2006; IEEE: Piscataway, NJ, USA, 2006. [Google Scholar]
  38. Sarkar, N.I.; Lo, E. Indoor propagation measurements for performance evaluation of IEEE 802.11 g. In Proceedings of the 2008 Australasian Telecommunication Networks and Applications Conference, Adelaide, SA, Australia, 7–10 December 2008; IEEE: Piscataway, NJ, USA, 2008. [Google Scholar]
  39. Sarkar, N.I.; Lo, E. Performance studies of 802.11 g for various AP configuration and placement. In Proceedings of the 2011 IEEE Symposium on Computers & Informatics, Kuala Lumpur, Malaysia, 20–23 March 2011; IEEE: Piscataway, NJ, USA, 2011. [Google Scholar]
Figure 1. A typical vehicular ad hoc network (VANET) scenario.
Electronics 12 04672 g001
Figure 2. VANET applications [11].
Electronics 12 04672 g002
Figure 3. IEEE 802 Family of Protocols.
Electronics 12 04672 g003
Figure 4. Field trial measurement environment (a) city mall parking lot and (b) experimental vehicle equipped with wireless laptop and cards.
Electronics 12 04672 g004
Figure 5. WestCity Auckland shopping mall parking layouts.
Electronics 12 04672 g005
Figure 6. Field measurement planning and setup.
Electronics 12 04672 g006
Figure 7. Flowchart of field measurement process.
Electronics 12 04672 g007
Figure 8. Illustrating V2V communications.
Electronics 12 04672 g008
Figure 9. Number of SSIDs identified in the WestCity Auckland shopping mall parking lot.
Electronics 12 04672 g009
Figure 10. RSSI (dBm) for different scenarios in a West city Auckland shopping mall parking lot.
Electronics 12 04672 g010
Figure 11. Summary of field measurement results. (a) Scenario 1; (b) Scenario 2; (c) Scenario 3; (d) Scenario 4; and (e) Scenario 5.
Electronics 12 04672 g011aElectronics 12 04672 g011b
Figure 12. OPNET representation of 802.11n network model with N = 50 nodes.
Electronics 12 04672 g012
Figure 13. Sample OPNET simulation configurations. (a) Application configuration and (b) profile configuration.
Electronics 12 04672 g013
Figure 14. Summary of simulation results (aj). (a) Effect of increasing the number of nodes on packet delays; (b) effect of increasing the number of nodes on throughput; (c) P2P file sharing download file size versus nodes; (d) P2P file sharing download response time versus nodes; (e) P2P file sharing traffic sent versus nodes; (f) P2P file sharing traffic received versus nodes; (g) FTP file sharing download response time versus nodes; (h) FTP file sharing upload response time versus nodes; (i) FTP file sharing traffic sent versus nodes; and (j) FTP file sharing traffic received versus nodes.
Electronics 12 04672 g014
Figure 15. Scenario 1—RSSI versus distance for NLOS conditions: comparison between the measurement and five models.
Electronics 12 04672 g015
Figure 16. Scenario 2—RSSI versus distance for NLOS conditions: Comparison between the measurement and five models.
Electronics 12 04672 g016
Figure 17. Scenario 3—RSSI versus distance for NLOS conditions: Comparison between the measurement and five models.
Electronics 12 04672 g017
Figure 18. Scenario 5—RSSI versus distance for NLOS conditions: Comparison between the measurement and five models.
Electronics 12 04672 g018
Figure 19. A practical VANET deployment scenario in a shopping mall parking lot in Auckland.
Electronics 12 04672 g019
Table 1. List of abbreviations used in this paper.
AbbreviationDefinitionAbbreviationDefinition
APAccess PointmsMilliseconds
AODVAd hoc On-demand Distance VectormWMilliwatts
BSSBasic Service SetNLOSNon-Line of Sight
CACollision AvoidanceOPNETOptimized Network Engineering Tool
CICASCooperative Intersection Collision Avoidance Systems InitiativeP2PPeer-to-Peer
CPUCentral Processing UnitPERPacket Error Rate
CSMACarrier Sense Multiple AccessPCFPoint Coordination Function
dBDecibelPLCPPhysical Layer Convergence Protocol
dBmdB-milliwattsPMDPhysical Medium
DCFDistributed Coordinated FunctionPHYPhysical Layer
DSSSDriving Safety Support SystemsOSIOpen Systems Interconnection model
EDCAEnhanced Distributed Channel AccessQoSQuality of Service
ESSExtended Service SetRFRadio Frequency
FHSSFrequency-Hopping Spread SpectrumRSSIReceived Signal Strength Indicator
FSPLFree-space Path LossRSURoadside Equipment
FTPFile Transfer ProtocolRWPRandom Way Point
GPSGlobal Positioning SystemSNRSignal-to-Noise Ratio
IBSSIndependent Basic Service SetSRDShort Range Destination
ISMInformation Systems ManagementSSIDService Set Identifier
IRInfraredTCPTransmission Control Protocol
ITSIntelligent Transportation SystemsUDPUser Datagram Protocol
IVCInter Vehicular CommunicationsVANETVehicular Ad hoc Network
IWFInformation Warning FunctionVCWSVehicle Collision Warning Systems
LANLocal-Area NetworkV2IVehicle to Infrastructure
LLCLogical Link ControlV2RVehicle-to-Roadside
MACMedium Access ControlV2VVehicle-to-Vehicle
MANETMobile Ad hoc NetworkWAVEWireless Access in Vehicular Environment
MHMap HackWDSWireless Distribution System
MPDUMAC Protocol Data UnitWLANWireless Local-Area Network
muMicrosecondsWMNWireless Mash Network
Table 2. VANET application areas [11].
TechniqueLocalization Accuracy
LowMediumHigh
Routingx--
Data Disseminationx--
Map Localizationx--
Coop. Adapt. Cruise Control Coop. Intersection Safety-x-
Blind Crossing-x-
Platooning-x-
Vehicle Col. Warn. System Vision Enhancement-x-
Automatic Parking--x
Vision Enhancement--x
Table 3. Key researchers and their main contributions to Wi-Fi-based VANETs.
ResearcherMain ContributionYearKey Concept/Description
Talukder et al. [27]Investigated V2V communication.2022Analyzes the emergency alert system in case of vehicle collision.
Haider et al. [28]Wi-Fi/WiMAX for VANETs2020Surveys WiMAX and WiFi for VANETs.
Martelli et al. [29]VoIP performance in a IEEE 802.11p VANET2012VoIP performance in IEEE 802.11p-based VANET with on-the-field measurements.
Ramteke and Krishna [30]VANET using ZigBee2012Uses AODV simulation evaluation.
Ho et al. [31]VANET performance2012Analyzes protocol performance in a VANET.
Liu et al. [21]Assessing VANETs under different traffic mobility2010Analyzes and formulates the “storage capability” of VMesh (one-way and highway).
Grilli [32]VANET data dissemination2010802.11g, Bluetooth, ZigBee, and WAVE.
Lagraa [4]VANET clustering2010GPS localization in VANET clustering.
Nzouonta et al. [20]VANET simulation2009GPS receivers, communications, and radars.
Buchenscheit et al. [33]VANET Vehicle Warning2009Developed a system prototype.
Tufail et al. [10]Wi-Fi-based VANETs2008Feasibility of Wi-Fi based VANETs.
Karim [22]Vehicular applications2008802.11p for roadside communication.
Perahia [34]Vehicular ad hoc network2008Propagation models used in VANET.
Qian and Moayeri [35]Secure VANETs2008Proposes a secure framework for VANETs.
Table 4. Hardware specifications.
EquipmentSpecifications
Laptop 1Vendor: Acer
Model: Aspire E1-531
Processor: Intel (R) Pentium (R)
CPU: 2.2 GHz (2 CPUs)
Memory: 8 GB
Operating systems: Windows 8 64-bit
Laptop 2Vendor: Hewlett Packard
Model: HP Elitebook 2570p
Processor: Intel (R) core (TM) i5-3360M
CPU: 2.8 GHz
Memory: 8 GB
Operating systems: Windows 7 professional 64-bit
IEEE 802.11n USB Wireless AdapterVendor: OutLink
Model: 0301SH300278
Wireless Standards: IEEE 802.11n, IEEE 802.11g, IEEE 802.11b
Output Power: 300 Mbps
Frequency band: 2.4 GHz
Channel: 1–14 channels
Data Security: 16/128-bit WEP Encryption WPA, WPA-PSK, WPA2, WPA2-PSK, TKIP/AES
Host Interface: High speed USB2.0/1.1 Interface 38
IEEE 802.11n 2.4 GHzVendor: D-link
Model: ANT24-0700
Directivity: Omni-Directional Indoor Antenna
Frequency Range: 2.4 GHz to 2.5 GHz
Power Level of Antenna: 7dbi
HPBW/H-Plane (Horizontal): 360 degrees
Table 5. Wi-Fi-based vehicular ad hoc network using field measurement scenarios.
ScenarioDescription
1In Level 1 of the field trial, two cars (TX and RX) were positioned 1 m apart to study the effects of gradually increasing the distance between them. The purpose was to determine the maximum communication range between the two vehicles. Scenario 1 involved sharing a text and image file and collecting data on signal strength, data rate, and transmission time.
2In scenario 2, the field trial involved placing the TX on Level 1 and the RX on Level 2, with a 4 m distance between them. The purpose was to study the impact of gradually increasing the distance between the TX and RX in small increments to determine the maximum communication range between the two vehicles. This scenario involved sharing a text file and an image file, and data on signal strength, data rate, and transmission time were collected to gain insights into the quality of the communication.
3In scenario 3, the field trial involved placing the TX on Level 1 and the RX on Level 3, with an 8 m distance between them. The objective was to examine the effects of gradually increasing the distance between the TX and RX in small increments to determine the maximum communication range between the two vehicles. The scenario included sharing a text file and image file, and data on signal strength, data rate, and transmission time were collected to gain insights into the quality of the communication.
4In scenario 4, the field trial involved placing the TX on Level 1 and the RX on Level 4, with a 12 m distance between them. The purpose was to investigate the effects of gradually increasing the distance between the TX and RX in small increments to determine the maximum communication range between the two vehicles. The scenario included sharing a text file and image file, and data on signal strength, data rate, and transmission time were collected to gain insights into the performance of the communication.
5In scenario 5, the field trial involved parking on the road with a minimum distance of 1 m between Level 1 and the road surface. The objective was to investigate the effects of gradually increasing the distance between the TX and RX in small increments to determine the maximum communication range between the two vehicles. During this scenario, a text file and an image file were shared, and data on signal strength, data rate, and transmission time were collected to gain insights into the quality of the communication.
Table 6. General parameters used in the simulations.
ParameterValue
Network scaleOffice
Area50 × 100 Square meters
Network size (number of nodes)Up to 50
Mobility modelRandom way point
Data rate26 Mbps (base/240 Mbps (max))
Physical characteristicsHT PHY 2.4 GHz (802.11n)
Transmit power (W)0.005
Packet reception power−92 dBm
ChannelAuto assign
Buffer size (bits)256,000
FTP trafficLow load (1000 bytes)
Medium load (5000 bytes)
High load (50,000 bytes)
P2P file sharingLow traffic:
 Minimum outcome 10,000 (bytes)
 Maximum outcome 100,000 (bytes)
High traffic:
 Minimum outcome 100,000 (bytes)
 Maximum outcome 10,000,000 (bytes)
Simulation time300 s
Table 7. Parameters used in the propagation models.
ParameterValue
Frequency (f)2.4 GHz
Speed of light (c)3 × 10⁸ m/s
Wavelength (λ)0.125 m
Linear size of the antenna (D)0.25 m
Reference distance (d0)1 m
Power of radio wave on the transmitting antenna (Pt)0.03162 W
Power of radio wave on the reference distance (Pr = d0)3.93 × 10⁻⁵ W
Disclaimer/Publisher’s Note: The statements, opinions and data contained in all publications are solely those of the individual author(s) and contributor(s) and not of MDPI and/or the editor(s). MDPI and/or the editor(s) disclaim responsibility for any injury to people or property resulting from any ideas, methods, instructions or products referred to in the content.

