Article

A Measurement Method for the Charging Potential of Conductors in the Vicinity of HVDC Overhead Lines Based on a Non-Contact Electrometer

1
Key Laboratory of Regional Multi-Energy System Integration and Control of Liaoning Province, Shenyang Institute of Engineering, Shenyang 110136, China
2
State Grid Jiangsu Electric Power Co., Ltd., Research Institute, Nanjing 211103, China
3
State Key Laboratory of Alternate Electrical Power System with Renewable Energy Sources, North China Electric Power University, Beijing 102206, China
4
China Electric Power Research Institute, Beijing 100192, China
*
Author to whom correspondence should be addressed.
Electronics 2023, 12(22), 4567; https://doi.org/10.3390/electronics12224567
Submission received: 1 August 2023 / Revised: 24 October 2023 / Accepted: 26 October 2023 / Published: 8 November 2023
(This article belongs to the Topic High Voltage Systems and Smart Technologies)

Abstract

:
Charging potential appears when a conductor insulated to the ground is exposed to an electrostatic field. A modified measurement method based on a non-contact electrometer is presented in this article. This system is appropriate for measuring the charging potential of a conductor near high-voltage direct-current (HVDC) overhead lines. Compared with the contact measurement method, the modified method is hardly affected by the internal resistance of the electrometer, which helps ensure measurement accuracy in the electrostatic field. In contrast with the traditional non-contact electrometer, the electric field generated by HVDC lines and the space charges around the electrometer probe are shielded using a grounding cage. The effectiveness of the modified measurement method was verified via experiments. The impacts of the structure and position of the measurement system on the measured charging potential are discussed.

1. Introduction

HVDC transmission technology is widely employed in large-capacity and long-distance power transmission. The operation of HVDC overhead lines creates electrostatic fields in their surroundings [1,2]. Corona discharge occurs when the electric field around the surface of an HVDC line exceeds the corona onset value. The space charges generated by the corona move under the force of the electrostatic field and then form an ion flow field [3,4]. Meanwhile, in some regions in which a better electromagnetic environment is required, such as residential areas or converter stations, the degree of corona discharge can be weakened or even eliminated by optimizing the structure of the transmission lines. In this case, the electrostatic field will be a space-charge-free electric field.
For a conductor insulated to the ground, the charging potential may increase due to the charges on the conductor; this is known as the charging potential problem of conductors. When a ground-insulated conductor is exposed to a space-charge-free electric field, the conductor is induced with the same number of charges of different polarities. In this case, there is a potential difference between the conductor and the Earth [5,6,7,8,9]. In contrast, if the conductor is located in an ion flow field, the charging potential is mainly influenced by the ion current, and the conductor’s steady-state potential is determined by the balance of the current flowing from the HVDC line and the voltage across the leakage resistance to the ground [10,11,12,13,14].
Conductors on well-insulated supports are very common in areas near HVDC overhead lines—for example, an iron wire on a wooden stake, a human body with rubber shoes, and a vehicle on tires. The potential of these conductors in the electrostatic field can be up to several kilovolts. Electrostatic discharge (ESD) may occur when the human body touches conductors with charging potentials [15,16], and the feeling of ESD may disturb the normal work and daily lives of people.
In the engineering design of HVDC lines, the effect of ESD is confined by limiting the electric field strength on the ground. The charging potential of a conductor is a more relevant index for evaluating the severity of ESD. Calculation methods for the charging potential near HVDC lines have been proposed [11,12], but the measurement of the charging potential is rarely discussed. In general, the electrostatic voltage on a conductor can be monitored by using either a contact or non-contact electrometer. The contact method is primarily used to measure the voltages on conductive objects [13]. The usage of contact electrometers is similar to that of ordinary voltmeters. To prevent the accumulated charges on the conductor from leaking into the ground, the internal resistance of the electrometer should be at the Giga-ohm (GΩ) level and above.
The non-contact measurement method is very effective when measuring the distribution of potential on insulated dielectrics [17,18,19]. A non-contact electrometer converts a DC electrostatic field into a periodic signal via an additional rotating or vibrating device [20]. Because the electrometer and the measured object are isolated by an air gap, there are hardly any charge leakage problems in non-contact measurements. The non-contact method can also be employed to measure the potential of conductors. The measured signals obtained via the non-contact method are calibrated using a standard voltage source before they are used so that the influence of the shape of the field domain on the measured values can be corrected. The amplitude of the inductive signal in a non-contact electrometer is a second-order problem with respect to the distance between the measured object and the measurement probe. Thus, the measurement range is easily adapted. However, the distance between the probe and the measured object should be fixed after calibration, which is problematic when dealing with arbitrarily shaped charging conductors. The signals induced in the non-contact electrometer can also be severely interfered with by the electric fields generated by HVDC lines or space charges. Therefore, a non-contact measurement instrument cannot be used to directly measure the potential near HVDC lines.
The main contributions of this study are the following:
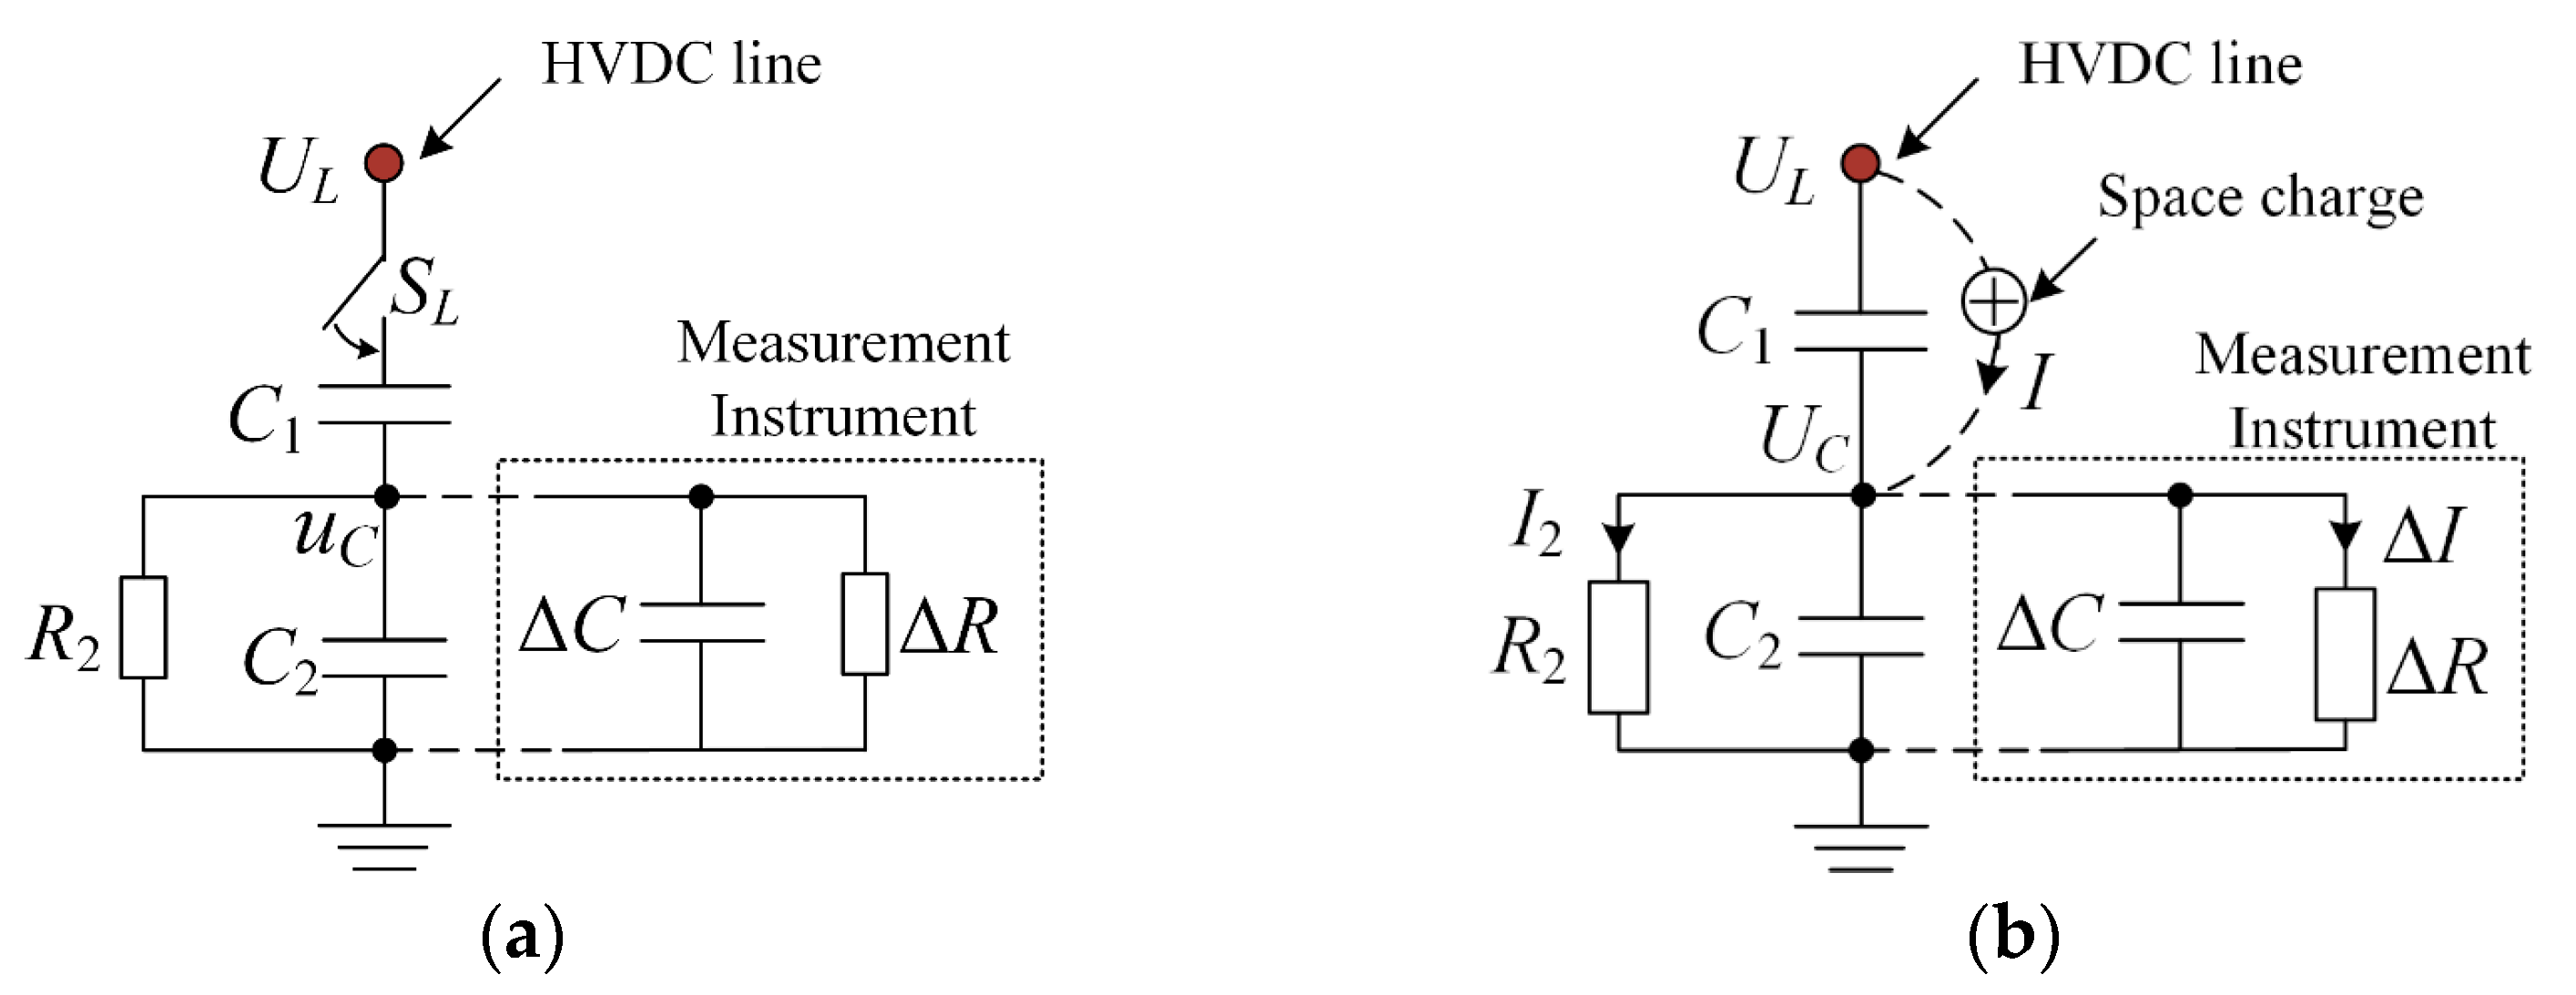
  • A modified measurement device was designed based on a non-contact electrometer to measure the charging potential near HVDC lines. The measurement principle is analyzed based on the circuit model and electromagnetic field model.
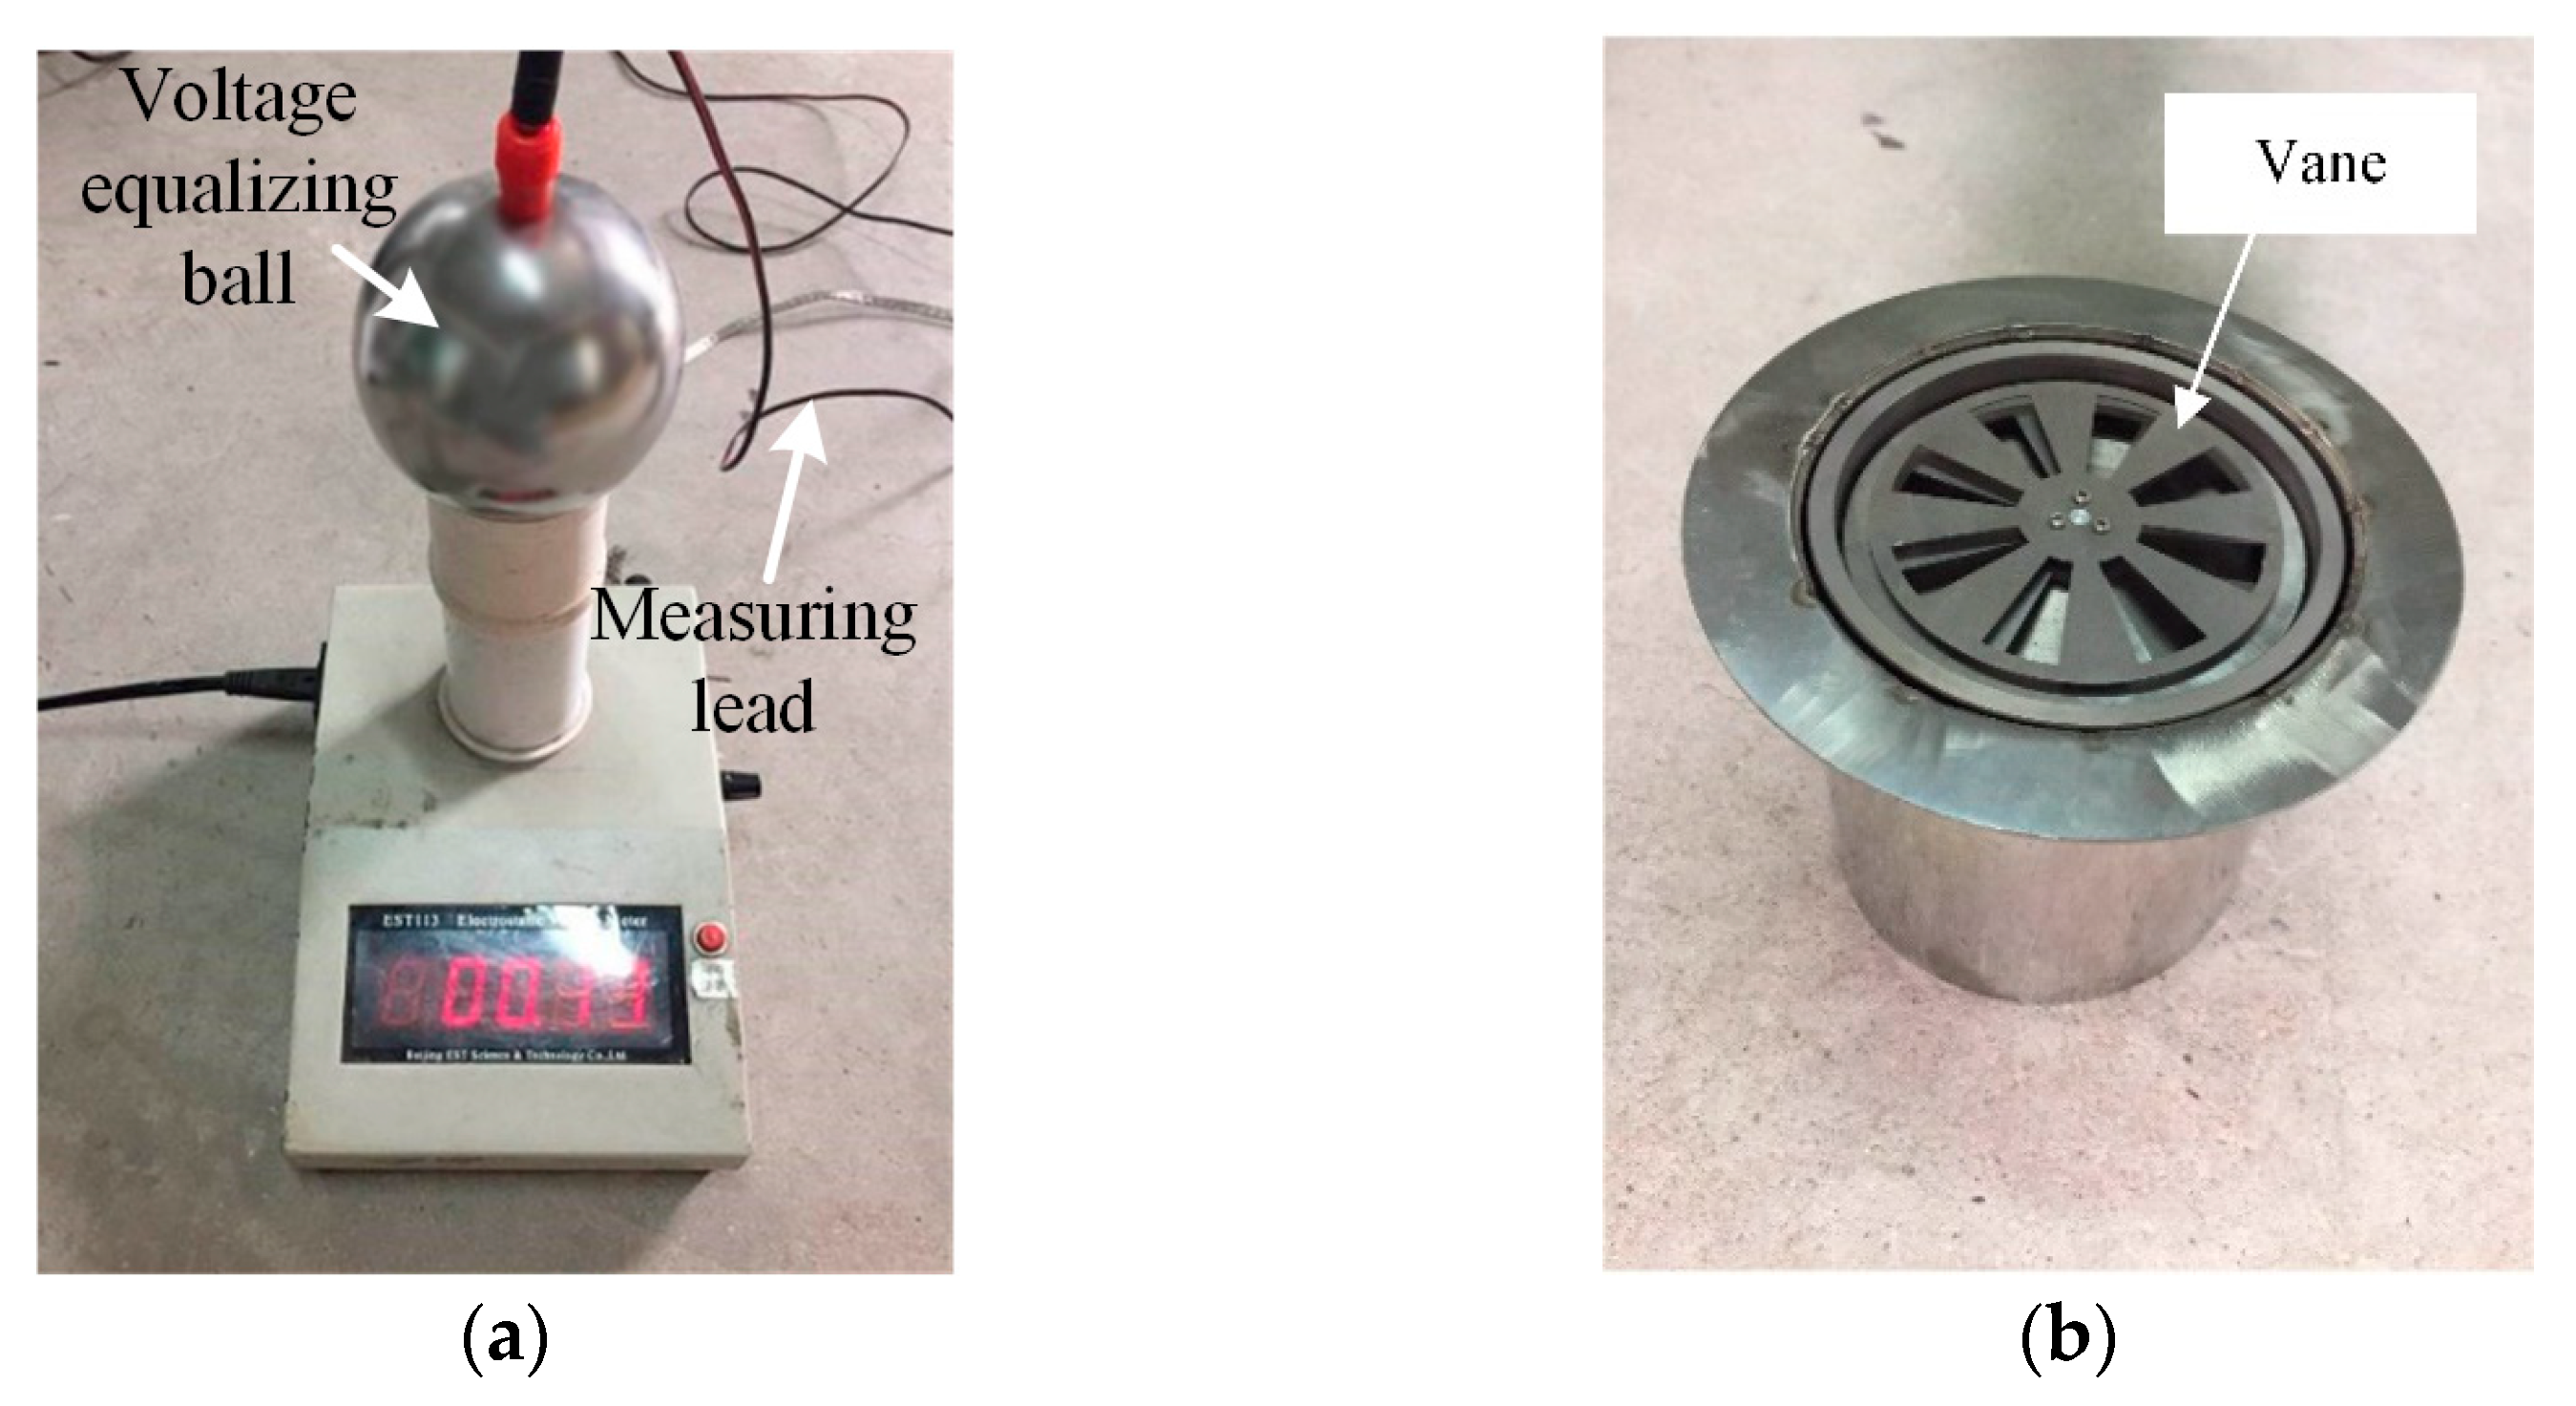
  • The charging potentials on a conductor model were measured with both a contact electrometer and the modified measurement system. The measurement errors were analyzed.
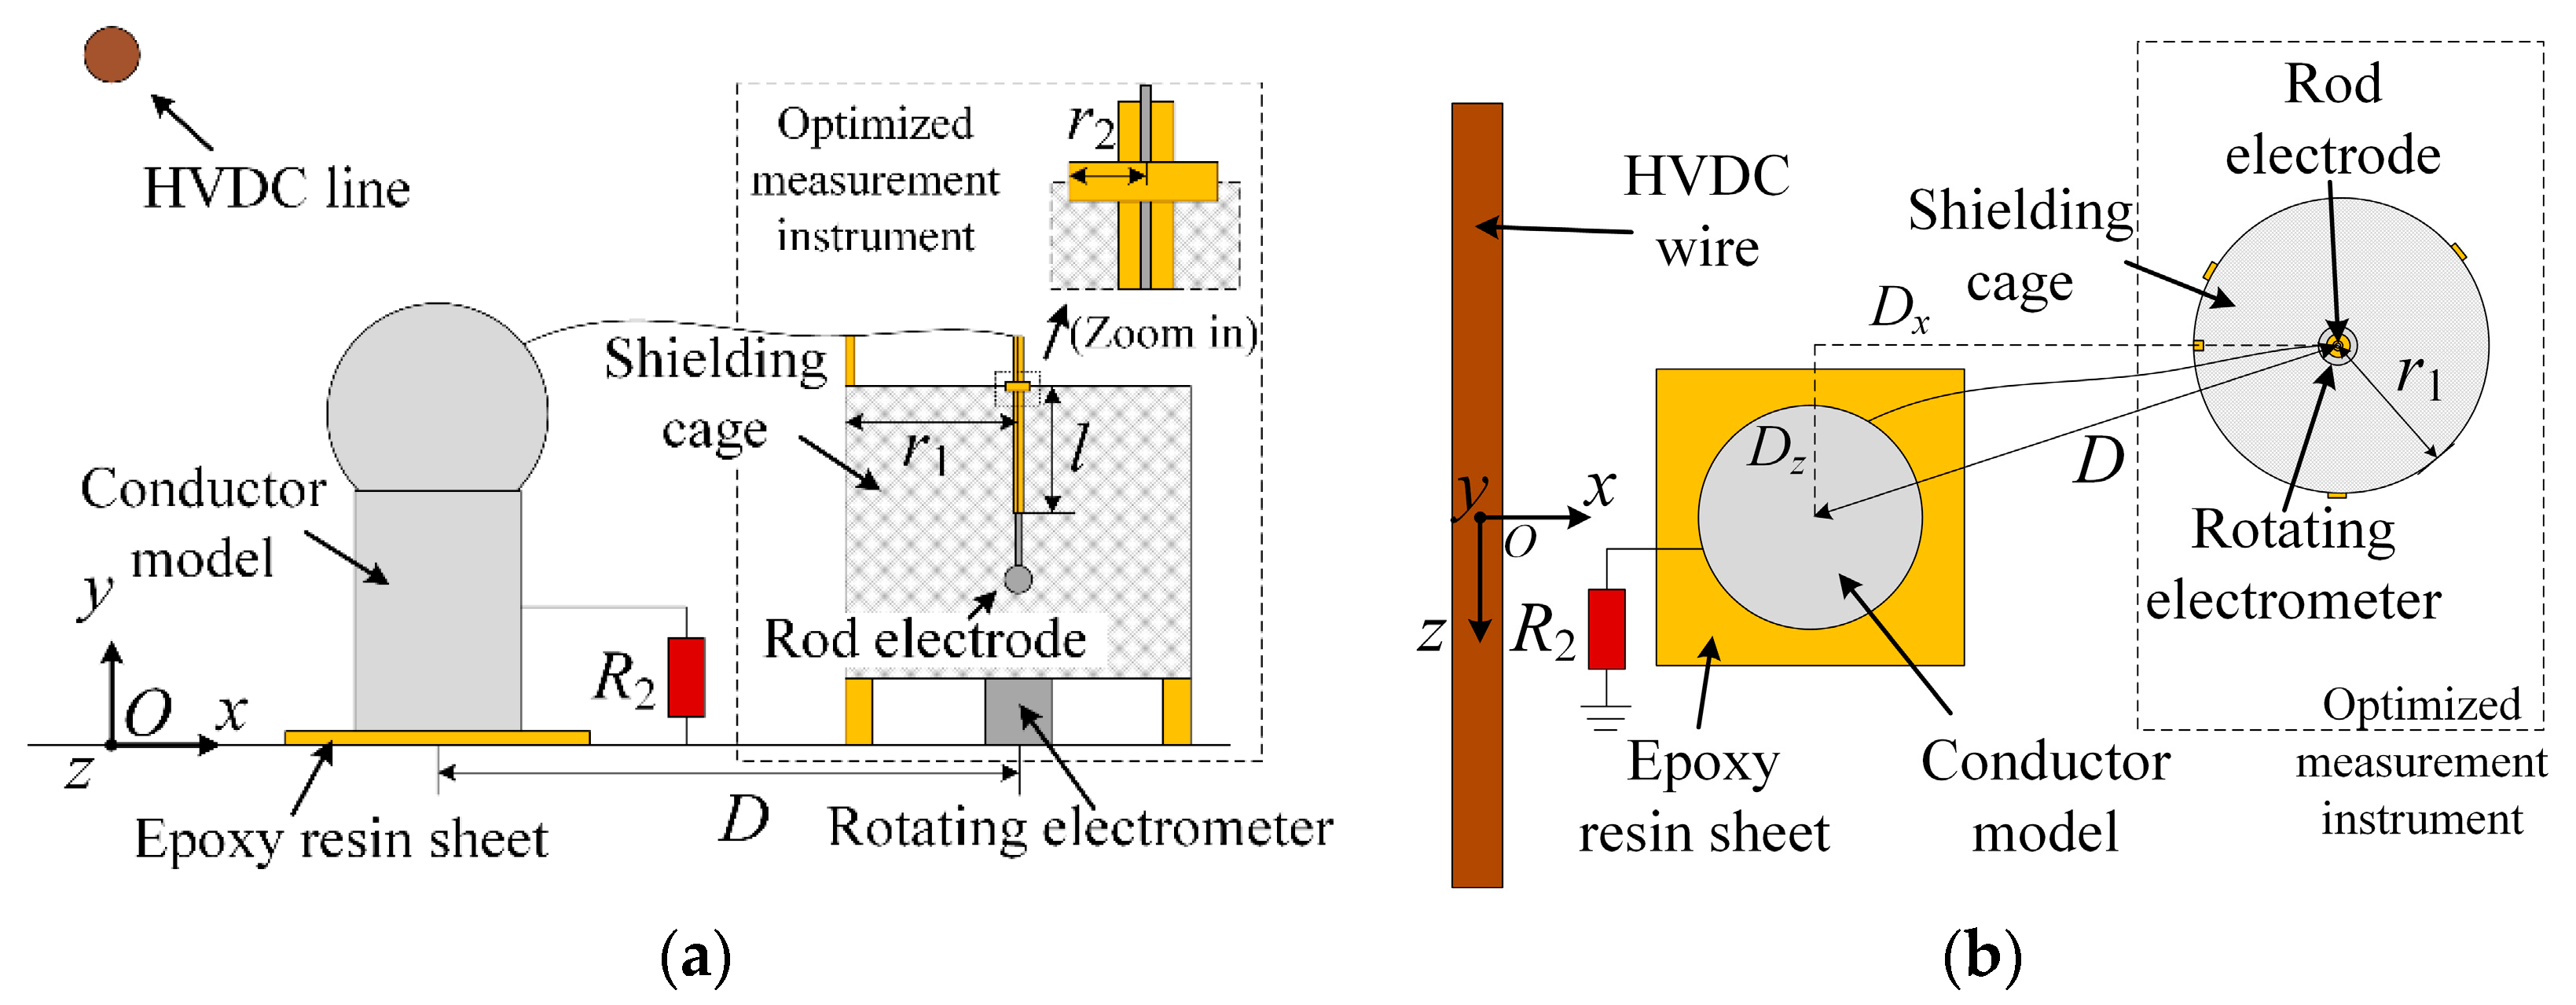
  • The impacts of the geometric structure and position of the modified method on the measured results are discussed.
The conclusions of this study are useful for assessing and optimizing the electromagnetic environment in the vicinity of HVDC transmission lines.

2. Methodology

2.1. Mathematical Models of Electrostatic Fields

When the electric field intensity on the conductor surface of HVDC lines is lower than the intensity of the electric field at corona onset, the charging potential on the ground-insulated conductor is induced by the surface charge on the HVDC lines. The governing equation of a space-charge-free electric field is Laplace’s equation.
2 φ = 0
where φ is the electric potential in the space. The electric field strength vector E is established in (2):
E = φ
The boundary condition of (1) is
{ φ | Γ L = U L φ | Γ G = 0 φ | Γ C = U C
where ΓL, ΓG, and ΓC represent the boundaries of the HVDC lines, ground, and ground-insulated conductor, respectively; UL and UC are the voltages on the HVDC lines and ground-insulated conductor, respectively.
When the electric field near the surface of the HVDC lines exceeds the electric field at corona onset, the air is ionized, and space charges will move along with the lines of the electric field [3]. The electric field distribution is influenced not only by the surface charges on HVDC lines but also by the moving space charges. The governing equations of the unipolar ion flow field are
2 φ = ρ ε 0
J = 0
J = k ρ E
where ρ is the space charge density, ε0 is the permittivity in the air, J is the ion current density, and k is the ion mobility rate.
Equation (3) is also the boundary condition of (4). In addition, Kaptzov’s hypothesis is adopted as the indirect boundary condition for (5).
φ n | Γ L = E o n
where Eon is the electric field at corona onset in the HVDC lines and n is the normal direction of the boundary of the calculation.
The electric field distributions in both the space-charge-free field and the ion flow field can be solved with the finite element method (FEM), and the space charge distribution in the ion flow field is calculated using upstream elements. An appropriate initial value of UC should be set before the calculation, and all of the boundary conditions are met after iterative corrections [15,16,21].

2.2. Factors Affecting the Charging Potential

Figure 1 illustrates the circuit of a conductor model with charging potential located close to an HVDC line. C1 is the capacitance between the HVDC line and the conductor model; R2 and C2 are the resistance and capacitance between the conductor model and the ground, respectively. ΔR and ΔC are the resistance and capacitance of the measurement instrument, respectively. The total resistance R and capacitance C between the conductor model and ground are
R = R 2 Δ R R 2 + Δ R
C = C 2 + Δ C
The charging potential in the conductor model in a space-charge-free electrostatic field will decline with time. In Figure 1a, the voltage in the conductor model is marked as uC. A switch SL is used to simulate the exposure of the conductor model to an electric field. By using the Laplace transformation, the circuit can be described as
( s C 1 + s C + 1 R ) U C ( s ) = s C 1 U L ( s )
where s is an independent variable in the complex frequency domain. The charging potential is
U C ( s ) = s C 1 U L ( s ) C 1 + C s + 1 ( C 1 + C ) R
The voltage in the conductor model in the time domain is
u C ( t ) = C 1 U L C 1 + C e t τ
where t is the time after switch SL is closed, and the time constant in the circuit τ is
τ = ( C 1 + C ) R
According to (10) and (13), the maximum value of uC occurs after the instant that SL is closed (t = 0+), and the corresponding charging potential in this situation satisfies
C 1 ( U L u C 0 ) = ( C 2 + Δ C ) u C 0
where uC0 is the value of uC at t = 0+.
From (14), it can be seen that uC0 is increased with the decrease in C2. If the surface of the conductor is relatively small or the distance between the conductor and the ground is very long, the charging potential problem in a space-charge-free electric field might be more serious.
The parameters of measurement instruments ΔR and ΔC influence the charging potential. The internal resistance ΔR should be adequately high; otherwise, the induced charge in the conductor model will quickly flow into the ground. Because of the existence of an air gap, the value of ΔR in the non-contact method is easy to guarantee. The capacitance between the measurement instrument and the ground ΔC influences the amplitude of the measured potential. To improve the measurement accuracy, the value of ΔC should be as small as possible.
The capacitances in Figure 1a were obtained through a simulation. For a given structure in the experiment, the Maxwell capacitance matrix was abstracted based on the FEM; then, the mutual capacitances C1, C2, and ΔC were calculated. The influence of ΔC on uC0 is analyzed in the following. The maximum charging potential that is unaffected by the measurement instrument is given as follows:
C 1 ( U L u C 0 ) = C 2 u C 0
where u′C0 is the potential without the influence of ΔC at t = 0+. Substituting (15) into (14), the relationship between uC0 and u′C0 is
u C 0 = ( C 2 + Δ C ) U L u C 0 C 2 U L + Δ C u C 0
The value of uC0 or u′C0 at t = 0+ can be determined by calculating the electric field on the surface of the conductor model. According to (4), (5), and (6) of the charge conservation principle, the electric field on ΓC satisfies
ε 0 Γ C E d S = 0
where S is the area of ΓC.
Due to the influence of the ion current, the potential of the conductor in the ion flow field remains at a constant value with the passing of time. The amount of space charge in the ion flow field is always much larger than the amount of induced charge in the space-charge-free field. To reduce the complexity of the analysis, only the steady-state charging potential in the ion flow field (t = ∞) is studied.
As shown in Figure 1b, the space charges flow into the conductor model and the charging potential is considerably increased. Meanwhile, the increase in the charging potential prevents the entrance of space charges. In the end, a dynamic balance is formed [10]. The steady-state charging potential in the conductor model is marked as UC. According to Ohm’s law, the relationships of voltage and current are
U C = I R
I = I 2 + Δ I = Γ C J d S
where I is the ion current flowing into the conductor model, and I2 and ΔI are the currents flowing through R2 and ΔR, respectively. From Equations (8), (18), and (19), it can be concluded that the value of ΔR has a larger impact on UC than ΔC in the ion flow field does.
To calculate UC, an appropriate initial value should be set first. Then, the ion current density J is calculated by solving (4) and (5). In the following, a new value of UC is obtained by using (18) and (19). The calculation is complete if the new UC is equal to the initial one; otherwise, the initial UC should be updated and the calculation process needs to be repeated.

3. Experiments

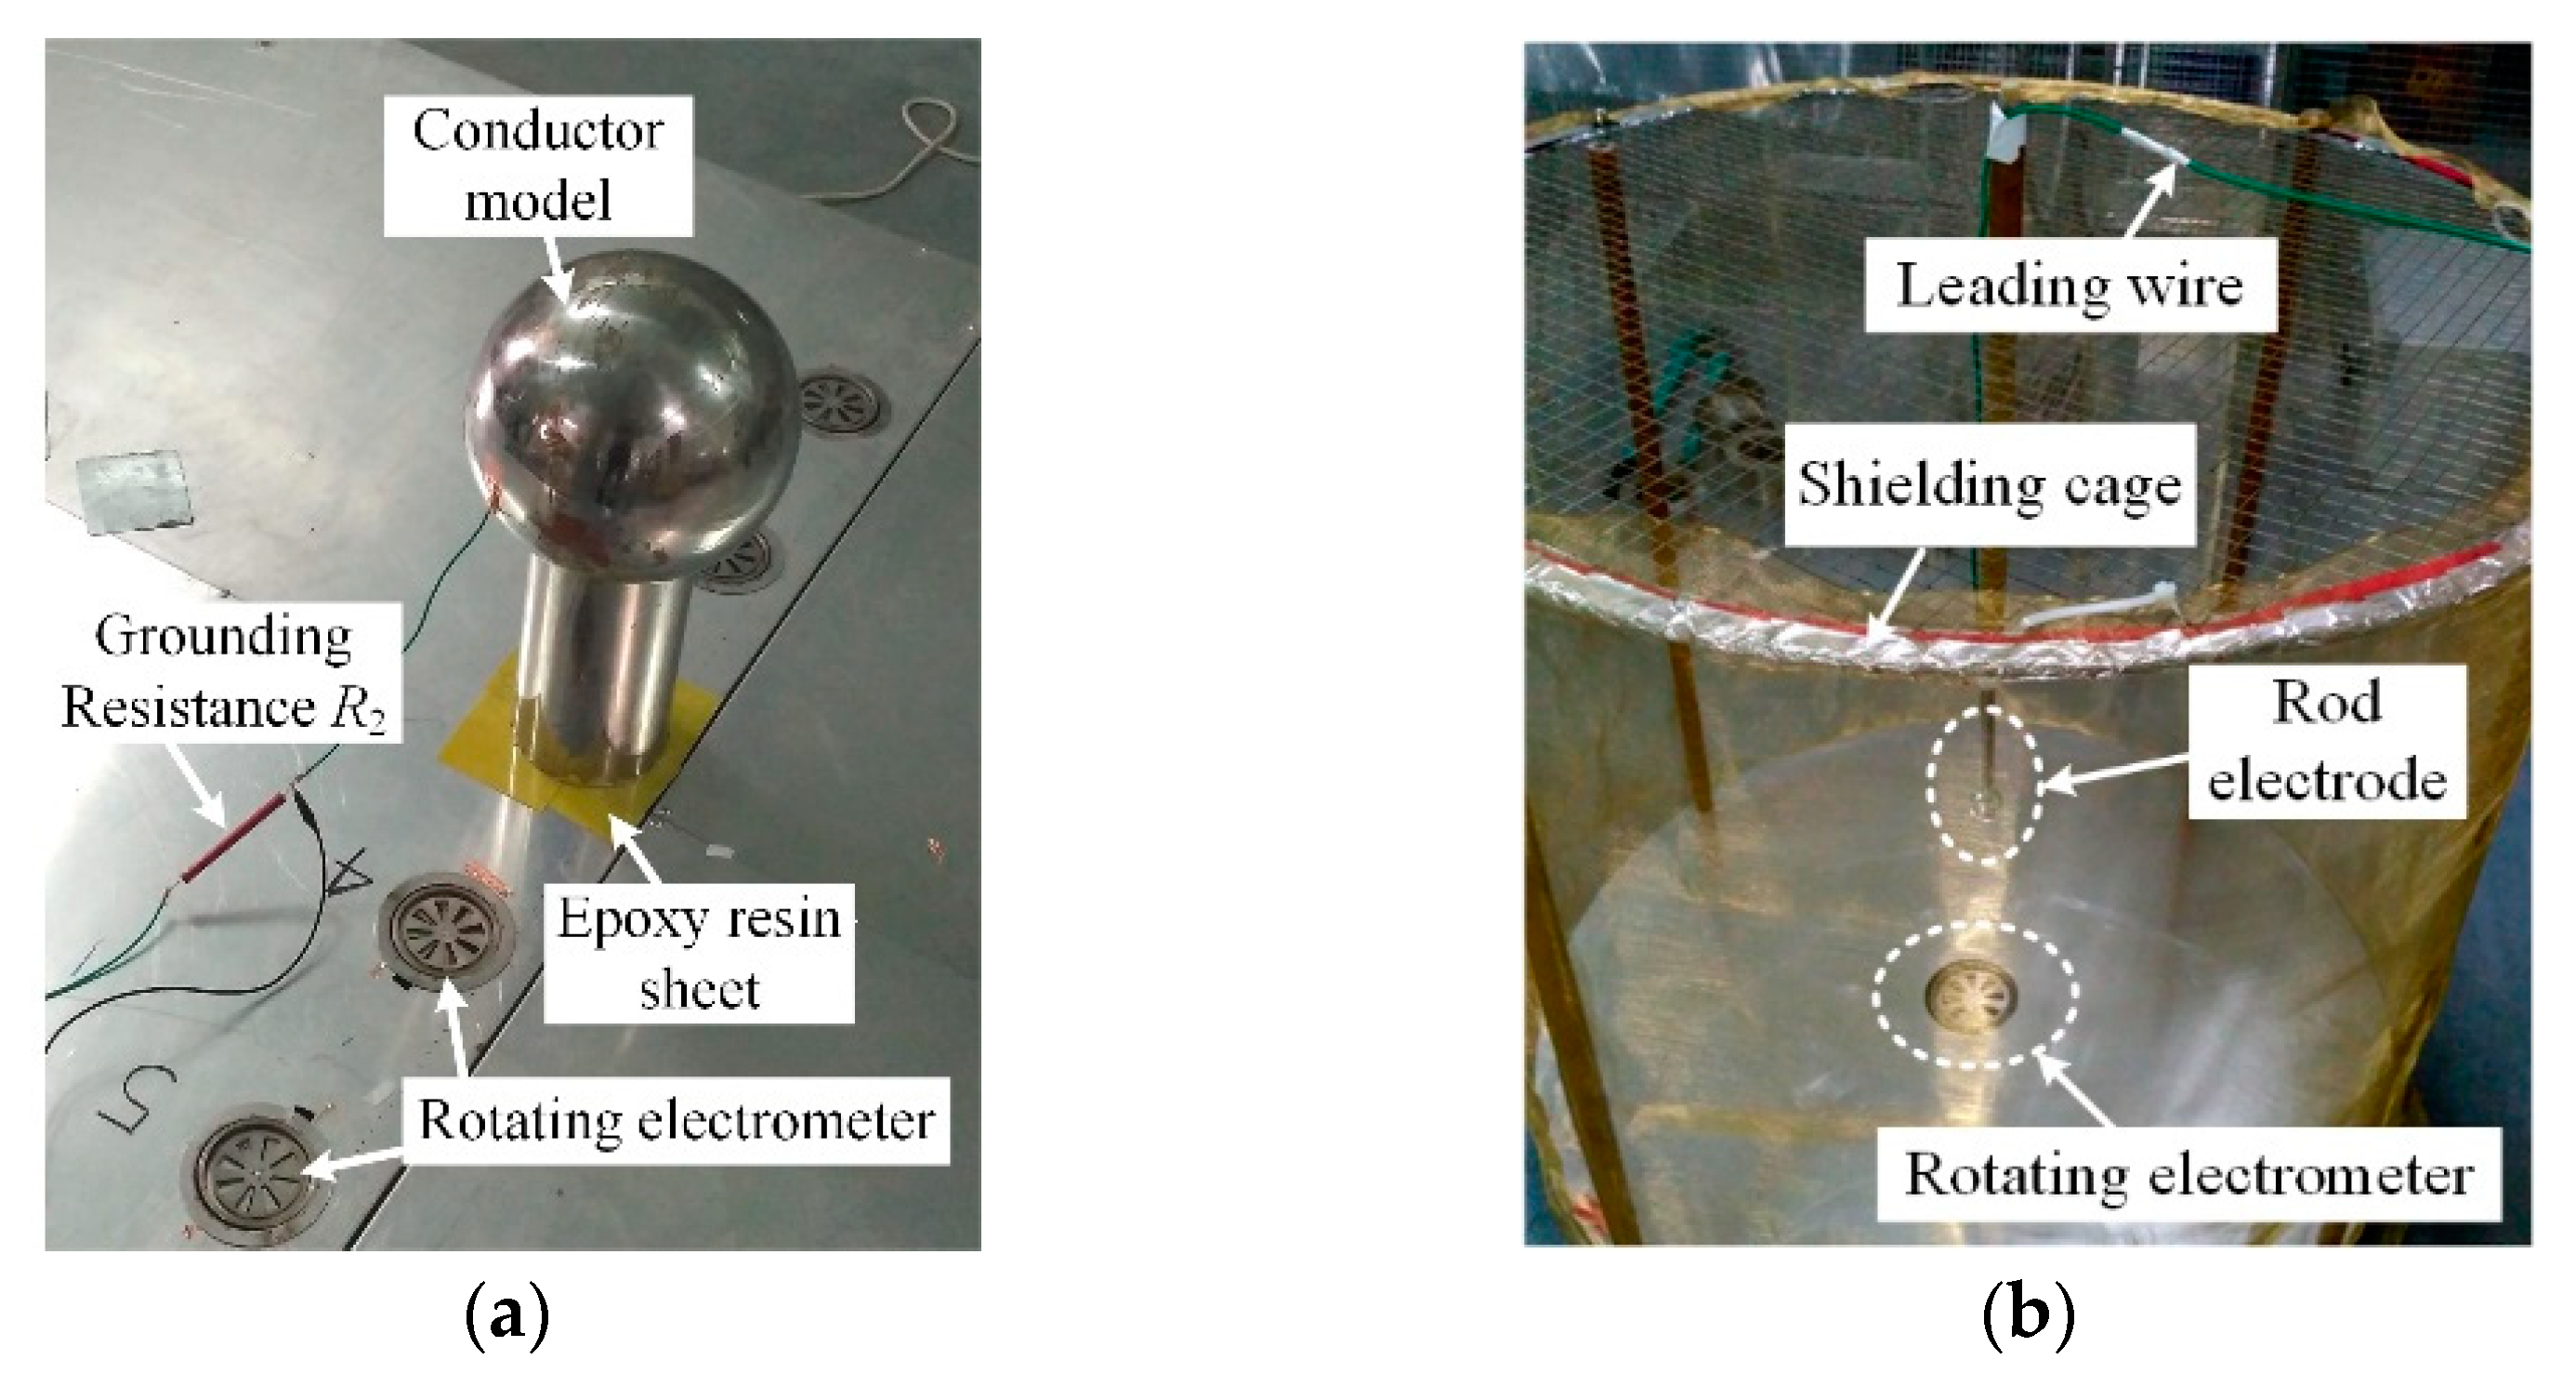
3.1. Establishment of the Experimental Platform

The contact and non-contact electrometers are presented in Figure 2. The test sample and the contact electrometers were connected by a measuring lead, and the sample with the measured potential was grounded through a high internal resistance. The potential was obtained by measuring the current flowing through the internal resistor. The internal resistance of the contact electrometer was ΔR = 20.3 GΩ, and this was measured by using a digital insulation resistance tester (PeakMeter MS5205). The rotation of the vane on the non-contact electrometer caused the total electric flux received on the sensing element to change periodically, and the corresponding induced charge also changed periodically. The corresponding potential was obtained by using the current formed by the periodically changing charge. Four non-contact electrometers were also placed on the ground to measure the electric fields [22,23]. The structure of the experimental platform established in the laboratory is given in Figure 3. The left part shows the conductor model and HVDC line. The height of the HVDC line was 80 cm, and the radius was 1.12 mm. A conductor model made of stainless steel was situated on a piece of an epoxy resin sheet. The distance between the center of the conductor model and the HVDC line in the x direction was 50 cm. The size of the epoxy resin sheet was 20 cm × 20 cm × 0.4 cm. The voltage on the HVDC line was supplied by a high-voltage power source (Matsusada AU-120).
The right part of Figure 3 shows the modified measurement method based on a non-contact electrometer. The rotating electrometer was located at the bottom of the shielding cage. The radius of the shielding cage was r1 = 40 cm. The conductor model and the rod electrode were connected by a leading wire. The leading wire near the shielding cage was fastened with an epoxy resin rod. The length of the epoxy resin rod inside the shielding cage was l = 40 cm. The leading wire was covered with an insulating coat. The area where the leading wire crossed the grounded shielding cage was also filled with epoxy resin, as shown in the zoomed-in schematic in the top-right corner of Figure 3. The radius of the hole of the leading wire was r2 = 1 cm. The distance between the center of the conductor model and the shielding cage was D = 160 cm. A photo of the experimental site is presented in Figure 4.
The capacitances between the conductors were calculated based on the FEM. The value of C2 was 137.07 pF. In the calculation of ΔC, the capacitance between the leading wire coming out of the shielding cage and its surroundings was neglected. The calculated capacitance of ΔC was 11.45 pF. By referring to (16), the measured voltage on the conductor model in the space-charge-free electric field was corrected. The influence of ΔC on u′C0 was about 7.7%.

3.2. Experimental Results

The electric field without space charges and the ion flow field were calculated using the method described in Section 2.1. To ensure the accuracy of the electric field calculation, the calculated ground-level electric fields near the conductor were compared with the measurements. The corona onset voltage of the HVDC line Eon was 44.6 kV; therefore, the voltages on the HVDC line (UL = 40 kV and 55 kV) were able to generate a space-charge-free electric field and ion flow field, respectively. In the calculation, the grounding resistance of the conductor model was R2 = 10 GΩ. The ground-level electric field around the conductor model is shown in Figure 5. The maximum relative error between the measurements and calculations was 6.8%.
The measured charging potentials on the conductor model are presented in Figure 6. In the experiment shown in Figure 6a, a 10 GΩ high-voltage glass glaze resistance (RI80-10GJ) was used to connect the conductor model and the ground. According to (13), the time constant τ in this system was about 1 s. The sampling period of the rotating electrometer in the experiment was 5 s. The boost speed of the HVDC line’s potential was about 2 kV/s. In a space-charge-free electric field, the measured charging potential was recorded as 0 kV. The corresponding calculated potentials presented in Figure 6a are specified as uC0. After the corona discharge occurred, the charging potential was raised with the increase in UL. Because of the influence of ΔR, the measured values obtained with the contact method were lower than those obtained with the modified method in the ion flow field. Meanwhile, the measurements obtained with the modified method showed good agreement with the calculations.
In the experiment shown in Figure 6b, the 10 GΩ glass glaze resistance was removed, and the conductor model was directly grounded through the epoxy resin sheet. In the calculation, the values of R2 and ΔR were regarded as infinite. When UL reached 50 kV and above, corona discharge occurred around the whole surface of the HVDC line. The measured charging potentials in this situation were higher than the potentials when R2 = 10 GΩ. The measurements obtained with the modified method were higher than those obtained with the contact electrometer and were closer to the calculations because of the higher value of ΔR. In reality, the charge was dissipated through the epoxy resin sheet and air, but there was not a strict floating potential. Therefore, the calculated potentials were higher than the potentials measured with the modified method.
The measured potentials when UL ≤ 40 kV according to the modified method and contact electrometer were significantly different. The measurements obtained with the modified method were still closer to the calculations. The contact electrometer was not able to reflect the charging potential in the conductor model because of its lower ΔR. In addition, when UL exceeded 30 kV, partial corona discharge could happen in some areas near the surface of the HVDC line, and the space charges influenced the charging potential. Therefore, these measurements obtained with the modified method were slightly higher than the calculated values.

4. Discussion

4.1. Comparison of the Measurement Methods

The advantages and disadvantages of different measurement methods are analyzed in the following.
Compared with that in the contact measurement method, the impact of the internal resistance of the electrometer was effectively reduced, and the measurement range was easily adapted by changing the distance between the rod electrode and the electrometer. This made the improved measurement method more suitable for measuring the charging potential of conductors with large resistance and capacitance to the ground. The disadvantages of the modified method came from the inherent weakness of non-contact measurement. The non-contact electrometers used in the modified method required calibration before each use, and the measurement results of the modified method were not as stable as those of the contact measurement method.
Unlike a traditional non-contact electrometer, this electrometer was not subjected to interference due to the electric field from HVDC lines and space charges, and the distance between the electrometer and the conductor model did not need to be fixed in the measurement process. The disadvantages were due to the influence of the shielding cage. The capacitance between the measured conductor and the ground will be increased and the charging potential in the conductor may be influenced if the distance between the conductor model and the shielding cage is too small.

4.2. Influence of the Shielding Cage of the Measurement System

Because of the usage of a shielding cage and leading wire, the modified measurement method was able to avoid interference from the ambient electric field of the environment. However, some new problems were created at the same time. The capacitance ΔC of the modified measurement method was higher than that of the traditional non-contact electrometer. In a space-charge-free electric field, if the capacitance of a conductor model C2 can be calculated or measured, the measured charging potential can be corrected by using (16). Otherwise, the value of ΔC should be reduced to improve the measurement accuracy.
The radius of the shielding cage r1, the radius of the hole of the leading wire r2, and the length of the leading wire inside the shielding cage l, as shown in Figure 3, were selected to analyze the impact factors of ΔC. The calculated results are shown in Figure 7. In Figure 7a, the value of l has an approximate linear relationship with ΔC. Therefore, ΔC can be effectively reduced by shrinking the length of the leading wire in the shielding cage. Meanwhile, the leading wire should also be long enough for the adjustment of the measurement range of the system. ΔC can also be decreased with the increase in r1, as shown in Figure 7b. When r1 is more than 30 cm, the curve is relatively smooth. Increasing r1 will make the measurement instrument larger, causing it to have a greater influence on the electric field around it and less of an effect on the reduction in capacitance. To limit the volume of the measurement instrument, it is recommended to set the value of r1 to 30 cm. As shown in Figure 7c, r2 has little effect on ΔC; hence, this parameter can be properly increased to improve the insulating properties around the hole of the leading wire.
The value of ΔC can also be reduced by shrinking the length of the leading wire outside of the shielding cage. Nevertheless, if the distance between the conductor model and the shielding cage D is too small, the grounding cage will also influence the charging potential in the conductor model. In the following, the charging potential UC is calculated while considering the existence of a shielding cage in an ion flow field, and the results are presented in Figure 8.
The existence of a shielding cage reduces the measured charging potential. The influence can be weakened with an increase in the distance between the center of the conductor model and the shielding cage D. In the following, the location of the shielding cage is discussed. As shown in Figure 3, Dx is a path that is perpendicular to the HVDC line and Dz is a path that is parallel to the HVDC line.
The measured charging potentials are shown in Figure 8. Compared with Figure 8a and Figure 8b, it can be concluded that when the shielding cage is in the path of Dx, the influence of the shielding cage on the charging potential is smaller than when the cage is in the path of Dz. To minimize the influence of the shielding cage, it is recommended for the length of D to be larger than 150 cm, and the connecting line between the conductor model and the shielding cage should be perpendicular to the HVDC line.
The design principles of the modified non-contact measurement method are summarized as follows: (1) The measurement instrument needs to be equipped with a shielding cover to eliminate the influence of the external electric field and space charges. (2) The measurement instrument should be far away from the measured object to reduce the influence on the electric field distribution near the measured object. (3) The capacitance inside the measurement instrument should be reduced as much as possible.

5. Conclusions

A modified measurement method based on a non-contact electrometer was designed to measure the charging potential of conductors near HVDC transmission lines. By using this method, the problems of contact and traditional non-contact charging potential measurement methods in the ion flow field environment were solved. The non-contact electrometer was covered with a shielding cage to eliminate the interference of the ambient electric field of the environment. Compared with the contact measurement method, the modified method was more accurate and was less affected by the internal resistance of the electrometer. The validity of the modified method was verified with a theoretical analysis and experiments.
The capacitance of the measurement system influenced the measured results in a space-charge-free electric field. The influence could be reduced by increasing the radius of the shielding cage or reducing the length of the leading wire. However, due to the shielding cage being grounded, a larger shielding cage or a closer distance between the measured conductor and the cage may reduce the charging potential of the conductor. For the sake of avoiding this problem, the connecting line between the conductor model and the shielding cage should be perpendicular to the HVDC line, and the distance between the shielding cage and the HVDC line should be greater than the distance between the conductor model and the HVDC line. The distance between the shielding cage and the conductor model should be more than 150 cm.

Author Contributions

Conceptualization, J.S. and D.W.; methodology, J.S.; software, D.W.; validation, J.S., X.G., and B.C.; formal analysis, Y.Z.; investigation, A.Z.; resources, Y.Z.; data curation, A.Z.; writing—original draft preparation, B.C. and J.S; writing—review and editing, X.G. and D.W.; visualization, J.S.; supervision, Y.Z.; project administration, D.W.; funding acquisition, D.W. All authors have read and agreed to the published version of the manuscript.

Funding

This research was funded by the Basic Scientific Research Projects of Universities in Liaoning Province (Youth Project) (LJKQZ2021080).

Data Availability Statement

Not applicable.

Conflicts of Interest

The authors declare no conflict of interest.

Nomenclature

IndicesMeaningIndicesMeaning
HVDCHigh-voltage direct currentR2, C2The resistance and capacitance between the conductor model and the ground
ESDElectrostatic dischargeΔR, ΔCThe resistance and capacitance of the measurement instrument
FEMFinite element methodR, CTotal resistance and capacitance between the conductor model and ground
φElectric potential in spaceuCVoltage in the conductor model in a space-charge-free electrostatic field
EElectric field strengthSLA switch to simulate the exposure of the conductor model in the electric field
ΓLThe boundaries of HVDC linessThe independent variable in the complex frequency domain
ΓGThe boundaries of the groundtThe time after SL is closed
ΓCThe boundaries of the ground-insulated conductorτThe time constant in the circuit
SThe area of ΓCuC0The value of uc at t = 0+
ULThe voltages on the HVDC linesu′C0The potential without the influence of ΔC at t = 0+
UCThe voltages on the ground-insulated conductorIIon current flowing into the conductor model
ρSpace charge densityI2, ΔIThe currents flowing through R2 and ΔR
ε0Permittivity in the airr1The radius of the shielding cage
JIon current densitylLength of the epoxy resin rod inside the shielding cage
kIon mobility rater2The radius of the hole of the leading wire
EonCorona-onset electric field of HVDC linesDThe distance between the center of the conductor model and the shielding cage
nThe normal direction of the calculation boundaryDxThe distance between the centers of the conductor model and the cage when they are located at the same x-coordinate
C1The capacitance between the HVDC line and the conductor modelDzThe distance between the centers of the conductor model and the cage when they are located at the same z-coordinate

References

  1. Qiao, J.; Zhang, P.; Zhang, J.; Lu, Y.; Zou, J.; Yuan, J.; Huang, S. An iterative flux tracing method without Deutsch assumption for ion-flow field of AC/DC hybrid transmission lines. IEEE Trans. Magn. 2018, 54, 1–4. [Google Scholar] [CrossRef]
  2. Cheng, Q.; Zou, J.; Lu, T.; Yuan, J.; Wan, B.; Zhang, J. Adaptive refinement method for solving ion-flow field of HVDC transmission line. IEEE Trans. Magn. 2020, 56, 1–4. [Google Scholar] [CrossRef]
  3. Lu, T.; Xiong, G.; Cui, X.; Rao, H.; Wang, Q. Analysis of corona onset electric field considering the effect of space charges. IEEE Trans. Magn. 2011, 47, 1390–1393. [Google Scholar] [CrossRef]
  4. Wang, D.; Lu, T.; Li, Q.; Chen, B.; Li, X. 3-D electric field computation of steeple rooftop houses near HVDC transmission lines. IEEE Trans. Magn. 2017, 53, 1–4. [Google Scholar] [CrossRef]
  5. Konrad, A.; Graovac, M. The finite element modeling of conductors and floating potentials. IEEE Trans. Magn. 1996, 32, 4329–4331. [Google Scholar] [CrossRef]
  6. Takuma, T.; Kawamoto, T. Numerical calculation of electric fields with a floating conductor. IEEE Trans. Dielectr. Electr. Insul. 1997, 4, 177–181. [Google Scholar] [CrossRef]
  7. Fu, W.; Ho, S.L. Dealing with floating conductors in finite element method of electrostatic field. In Proceedings of the Digests of the 2010 14th Biennial IEEE Conference on Electromagnetic Field Computation, Chicago, IL, USA, 9–12 May 2010. [Google Scholar]
  8. Wan, S.; Bian, X.; Chen, L.; Yu, D.; Wang, L.; Guan, Z. Electrostatic discharge effect on safe distance determination for 500 kV AC power line’s helicopter inspection. J. Electrost. 2013, 71, 778–780. [Google Scholar] [CrossRef]
  9. Yu, D.; Wan, S.; Chen, F.; Bian, X.; Chen, L.; MacAlpine, M.; Zhang, J.; Zhang, L.; Wang, L. The effect of floating-potential conductors on the electric field near overhead transmission lines. J. Electrost. 2012, 70, 339–345. [Google Scholar] [CrossRef]
  10. Zhen, Y.; Cui, X.; Lu, T.; Li, X.; Fang, C.; Zhou, X. 3-D finite-element method for calculating the ionized electric field and the ion current of the human body model under the UHVDC lines. IEEE Trans. Power Deliv. 2013, 28, 965–971. [Google Scholar] [CrossRef]
  11. Wang, Z.; Lu, T.; Bian, X.; Hiziroglu, H.R.; Li, X. Modulation effect produced by adjacent AC voltage on the characteristics of negative corona current pulses in a wire-cylinder electrode configuration. J. Electrost. 2016, 84, 54–62. [Google Scholar] [CrossRef]
  12. Li, X.; Cui, X.; Zhen, Y.; Lu, T.; Luo, Z.; Fang, C.; Zhou, X. The ionized fields and the ion current on a human model under ±800 kV HVDC transmission lines. IEEE Trans. Power Deliv. 2012, 27, 2141–2149. [Google Scholar] [CrossRef]
  13. Wang, D.; Lu, T.; Li, X.; Chen, B.; Li, X.; Xie, L.; Ju, Y. Simulation and analysis of human body micro-shocks in the ion flow field near HVDC transmission lines. J. Electrost. 2018, 93, 10–16. [Google Scholar] [CrossRef]
  14. Chen, B.; Lu, T.; Bai, B.; Shen, N.; Zhang, Y.; Wang, D. The influence of greenhouse support structures on ion flow field under overhead high voltage direct current lines. Electr. Power Syst. Res. 2021, 196, 107260. [Google Scholar] [CrossRef]
  15. Kleber, D. Electrostatic behavior of wood and laminate floor coverings and current situation in standardization. J. Electrost. 2017, 88, 218–224. [Google Scholar] [CrossRef]
  16. Katsivelis, P.S.; Gonos, I.F.; Stathopulos, I.A. Human-to-metal electrostatic discharge current measurements—Notes on the ESD current waveform. J. Electrost. 2015, 77, 182–190. [Google Scholar] [CrossRef]
  17. Kacprzyk, R. Measurements of electrical potential of constant charge objects. IEEE Trans. Dielectr. Electr. Insul. 2012, 19, 134–139. [Google Scholar] [CrossRef]
  18. Yong, S.; Hosseinbeig, A.; Yang, S.; Heaney, B.M.; Pommerenke, D. Noncontact human body voltage measurement using microsoft kinect and field mill for ESD applications. IEEE Trans. Electromagn. Compat. 2019, 61, 842–851. [Google Scholar] [CrossRef]
  19. Wang, D.; Lu, T.; Wang, Y.; Chen, B.; Li, X. Measurement of surface charges on the dielectric film based on field mills under the HVDC corona wire. Plasma Sci. Technol. 2018, 20, 51–60. [Google Scholar] [CrossRef]
  20. Cui, Y.; Yuan, H.; Song, X.; Zhao, L.; Liu, Y.; Lin, L. Model, design, and testing of field mill sensors for measuring electric fields under high-voltage direct-current power lines. IEEE Trans. Ind. Electron. 2018, 65, 608–615. [Google Scholar] [CrossRef]
  21. Zou, Z.; Cui, X.; Lu, T. Upstream boundary element method for calculating the ionized field of the high voltage direct current conductor. IEEE Trans. Power Deliv. 2017, 32, 2424–2431. [Google Scholar] [CrossRef]
  22. Zhang, B.; Wang, W.; He, J. Impact factors in calibration and application of field mill for measurement of DC electric field with space charges. CSEE J. Power Energy Syst. 2015, 1, 31–36. [Google Scholar] [CrossRef]
  23. Gu, X.; Cui, Y.; Wang, Q.; Yuan, H.; Zhao, L.; Wu, G. Received signal strength indication-based localisation method with unknown path-loss exponent for HVDC electric field measurement. High Volt. 2017, 2, 261–266. [Google Scholar] [CrossRef]
Figure 1. The circuit model of the charging potential (a) in the space-charge-free electric field and (b) in the ion flow field.
Electronics 12 04567 g001
Figure 2. Electrometers: (a) contact electrometer; (b) non-contact rotating electrometer.
Electronics 12 04567 g002
Figure 3. A diagram of the experimental platform: (a) front view; (b) top view.
Electronics 12 04567 g003
Figure 4. Experimental setup: (a) charging conductor model in the vicinity of an HVDC line; (b) modified measurement method based on a non-contact electrometer.
Electronics 12 04567 g004
Figure 5. Ground-level electric fields around the conductor model.
Electronics 12 04567 g005
Figure 6. Comparison of the measurements and calculations. (a) The conductor model was grounded with R2 = 10 GΩ. (b) The conductor model was potentially floating.
Electronics 12 04567 g006
Figure 7. Influence of the shielding cage on ΔC. (a) Length of the leading wire l. (b) The radius of the shielding cage r1. (c) The radius of the whole of the leading wire r2.
Electronics 12 04567 g007
Figure 8. Influence of the distance between the conductor and the cage on the charging potential (a) on the path of Dx and (b) on the path of Dz.
Electronics 12 04567 g008
Disclaimer/Publisher’s Note: The statements, opinions and data contained in all publications are solely those of the individual author(s) and contributor(s) and not of MDPI and/or the editor(s). MDPI and/or the editor(s) disclaim responsibility for any injury to people or property resulting from any ideas, methods, instructions or products referred to in the content.

