Article

Fault Diagnosis of Vibration Sensors Based on Triage Loss Function-Improved XGBoost

1
Hunan Key Laboratory of Mechanical Equipment Health Maintenance, Hunan University of Science and Technology, Xiangtan 411201, China
2
Department of Aeronautical and Aviation Engineering, Hong Kong Polytechnic University, Hong Kong 999077, China
3
Zhengzhou BYD Automotive Co., Ltd., Zhengzhou 451162, China
*
Author to whom correspondence should be addressed.
Electronics 2023, 12(21), 4442; https://doi.org/10.3390/electronics12214442
Submission received: 18 September 2023 / Revised: 17 October 2023 / Accepted: 26 October 2023 / Published: 29 October 2023
(This article belongs to the Topic Artificial Intelligence in Sensors, 2nd Volume)

Abstract

:
Vibration sensors are prone to bias, drift, and other failures. To avoid misjudgments in state monitoring systems and potential safety accidents caused by vibration sensor failures, it is significant to diagnose the faults of vibration sensors. Existing methods for vibration sensor fault diagnosis are primarily based on Deep Learning, but Extreme Gradient Boosting stands out due to its excellent interpretability, and compared to other ensemble learning algorithms, it boasts superior accuracy and efficiency. Therefore, a vibration sensor fault diagnosis method based on Extreme Gradient Boosting is proposed to diagnose seven common types of faults in vibration sensors. To prevent the model from being overwhelmed by simple negative cases during training, a new loss function named Triage Loss is designed to improve the classifier’s performance. The vibration sensor fault diagnosis has confirmed the efficacy and practicality of the suggested approach. The experimental results indicate that the training of the model done using Triage Loss outperforms the training model done using the default loss function, with a maximum improvement of 5.4% accuracy, 5.45% in the F1-score, and 9.87% in the mean Average Precision under different fault rates.

1. Introduction

Reliability and safety of equipment in industrial production processes are critical concerns, and equipment health monitoring has received widespread attention [1,2]. Sensor measurements provide real-time information about the operating status of equipment. However, when sensors malfunction or provide inaccurate readings, it can result in misjudgments in control systems. In industrial production, the lifespan of equipment is often much longer than that of sensors, leading to situations where sensors may fail before the equipment. Therefore, the vibration sensor fault diagnosis (VSFD) is particularly important.
The methods for sensor fault diagnosis mainly include hardware redundancy, analytic redundancy, model-based methods, and Machine Learning (ML)-based methods. In hardware redundancy, two or more sensors are used to measure the same physical quantity, and Barberree [3] designed a self-validating temperature sensor based on this principle. Analytic redundancy utilizes the correlation between sensors to detect the fault, and Wang [4] proposed a fault detection method for flow sensors and temperature sensors based on this approach. In model-based methods, by establishing a system output model, one can calculate the discrepancy between the outputs of the model and the system and then judge whether there is a fault based on the set threshold. Willsky [5] initially proposed this method. Ferdowsi [6] proposes a new model-based method to diagnose nonlinear systems’ faults, including sudden and early faults and the duration of fault occurrence. Ng [7] used a Bayesian approach combined with the physical relationship between water flow and temperature in a pipeline system to develop a model for detecting deviations in sensors of chilled water plant. Yu [8] proposed an improved model based on voltage and current for current sensor diagnosis. Hardware redundancy may incur high costs and complexity in industrial equipment with limited redundancy. Analytic redundancy does not require additional hardware, but is susceptible to noise and relies on empirical analysis, which may compromise reliability. Model-based methods depend on accurate models, which are challenging to establish in practice, especially for systems with nonlinear dynamics and complex sensor behaviors.
Over the past few years, due to the emergence of ML, machine learning has shown a strong performance in fault diagnosis, and the application of early fault diagnosis in equipment has become widespread. Jana [9] used convolutional neural networks to achieve sensor fault diagnosis. Sun [10] collected experimental data on gas turbines under different working conditions, and a database of five typical faults was established. An ML-based method was used to achieve higher diagnostic accuracy for gas turbine sensors. Gao [11] mainly aimed at the drift fault of the chiller sensor. The residual generator generates the residual vector, and the accumulated residual improves the fault detection ability of the model. Ai [12] used a Temporal Convolutional Network for diagnosing Hypersonic Air Vehicle sensors. Xiao [13] used regularized extreme machine learning to detect sensors at different circuit positions. Niu [14] used principal component analysis and improved the Petri net to analyze the speed data of high-speed trains, and the intermittent fault or time-varying fault of the speed sensor was diagnosed. Elnour [15] used auto-associative neural networks to diagnose HVAC system sensors. Although deep neural networks show a strong performance, they have long been criticized for their poor interpretability. In addition, there are some methods for the fault diagnosis of sensors using prediction methods, for example [16,17], Facebook’s Prophet, the Auto-regressive Integrated Moving Average, and other models, which are used to predict the output of sensors. When the actual output exceeds the predicted upper and lower bounds, it is judged as an anomaly, but such methods usually cannot detect the sensor fault type.
Extreme Gradient Boosting (XGBoost) [18], based on decision trees, has been recognized for its excellent interpretability and advantages of requiring less training data and a shorter training time. XGBoost has demonstrated high accuracy and efficiency compared to other ensemble learning algorithms [19,20,21,22], making it widely applied in classification and regression tasks. This paper proposed a VSFD method based on XGBoost to address the seven common fault recognition issues related to vibration sensors. By inputting historical data into XGBoost for training, a classifier is obtained for diagnosing common faults in vibration sensors. Historical data for vibration sensor faults are often imbalanced; the class imbalance in the data can result in the model’s loss being heavily dominated by the majority class during the training process, leading to poor accuracy. Therefore, the Triage loss (TL) was designed for training XGBoost, aiming to address this issue. By introducing a dynamic scaling factor, the model can dynamically scale loss based on the predicted difficulty of the sample. Ultimately, this results in the better classification accuracy and performance of the classifier in classifying faults in vibration sensors.
  • This paper proposed a VSFD method based on XGBoost, which can identify seven common faults in vibration sensors. The method exhibits high accuracy.
  • In order to prevent the model from being overwhelmed by simple negative samples in the training process, a new loss function TL is designed to train XGBoost, thereby improving the classification performance of the model.
  • Finally, the performance of the classification model trained by the default loss function (softmax), focal loss function (FL), and TL is evaluated by experiments on both public and experimental datasets. The results show that the TL-trained model has a higher classification accuracy and better comprehensive performance.
The rest of the paper is as follows: In Section 2, the common types of faults in vibration sensors were introduced. Section 3 presents the proposed method in detail. In Section 4, the experimental validation of the method is conducted. Finally, in Section 5, the paper is summarized.

2. Basic Theory of Typical Faults of Sensors

Deviations between the sensor outputs and expected behavior are considered faults. This paper finds seven common faults in vibration sensors, including bias fault, drift fault, spike fault, data-loss fault, stuck fault, erratic fault, and random faults, to identify the early stages of sensor faults, as shown in Figure 1. s ( t ) = h ( t ) + η is defined as the expected output of the sensor in the absence of faults, where h ( t ) + η , representing the data collected at time t, and η ~ N ( 0 , δ η 2 ) is noise. The definitions of different types of faults are as follows:
  • Bias fault
If the expected output is increased by a constant value, it may result in a deviation from the usual value, which could be due to the poor calibration of the sensor unit or a short circuit. This fault is represented by Equation (1):
s ( t ) = h ( t ) + η + v , v = c o n s t a n t
  • Drift fault
When the expected output increases linearly with time, it is called a drift fault. Possible causes of this type of fault include material corrosion over time in the sensor or physical damage caused under extreme conditions. This fault is represented by Equation (2):
s ( t ) = h ( t ) + η + b ( t ) , b ( t ) = b ( t 1 ) + v
where b ( t ) is the bias that varies over time added to the output at time t, which grows linearly with time.
  • Spike fault
When the sensor’s output exhibits sharp spikes at regular intervals, it is referred to as a spike fault. This is caused by abnormal vibrations from other system components, affecting the sensor’s output. This fault is represented by Equation (3):
s ( t ) = { h ( t ) + η + v ( t ) ; t = v × τ , h ( t ) + η ;   o t h e r w i s e , v = { 1,2 , } ,       τ 2
where τ represents the time interval at which the spikes occur.
  • Erratic/precision degradation fault
When a noise with zero mean and high variance is added to the sensor output, resulting in significantly higher friction than the normal state, it is called an accuracy degradation fault. This could be due to sparse connections in the circuit, high-frequency noise in the system, or physical damage. This fault is represented by Equation (4):
s ( t ) = h ( t ) + η + v , v ~ N ( 0 , δ v 2 ) , δ v 2 δ n 2
  • Stuck fault
When the output of a sensor is stuck at a fixed value temporarily or permanently, it is referred to as a stuck fault. Short circuits, open circuits, or sensor material damage in the circuitry may cause this. This fault is represented by Equation (5):
s ( t ) = v
  • Data-loss fault
A data-loss fault is when the sensor output detects missing values in the time series. This is primarily caused by hardware damage or improper calibration.
  • Random faults
Random faults are characterized by the occurrence of multiple positive or negative disturbances in the output of the sensor, which happen very rapidly and may be attributed to the random occurrence of the faults described earlier.

3. Proposed Method

The proposed method is a VSFD method based on XGBoost. In the training process of the XGBoost model, the loss is often occupied by simple negative classes, which leads to a decrease in diagnostic accuracy. Therefore, TL was designed for training XGBoost, aiming to address this issue.

3.1. XGBoost

XGBoost is an additive model based on the improvement of Gradient Boosting Decision Trees (GBDT). In comparison to the GBDT that utilizes a first-order Taylor expansion for the objective function, XGBoost employs a second-order Taylor, incorporating both first-order and second-order derivative information. This feature makes the XGBoost more accurate.

3.2. Triage Loss

We are optimizing the objective function by adjusting model parameters to achieve better performance on the test set to achieve the purpose of learning. The Loss function is utilized to calculate the error between the real value and the predicted value, and the regularization term used to prevent the model from overfitting constitutes the objective function of XGBoost.
For a dataset D = { ( x i , y i ) } ( | D | = n , x i R m , y i R ) with n examples and m features, the K additive functions are used to predict the outputs.
y ^ i = ( x i ) = K = 1 K f k ( x i ) , f k F
where F = { f ( x ) = ω q ( x ) } : ( q : R m T ,   ω R T ) is the space of regression trees, where q represents the structure of each regression tree, and T is the number of leaf nodes. f k depends on q and weight w, and different q and weight w will result in different f k . The objective function of XGBoost is defined as:
L ( t ) = i = 1 n l ( y i , y ^ i ( t 1 ) + f t ( x i ) ) + Ω ( f t )
where Ω ( f t ) = γ T + λ ω 2 / 2 , l is a second-order differentiable convex loss function, used to measure the difference between predicted values y ^ i and true values y i . This makes the objective function non-continuous and difficult to optimize. Hence, the objective function can be approximated through the second-order Taylor expansion, making it easier to optimize.
L ( t ) i = 1 n [ l ( y i , y ^ ( t 1 ) ) + g i f t ( x i ) + h i f t 2 ( x i ) / 2 ) ] + Ω ( f t )
where g i = y ^ ( t 1 ) l ( y i ,   y ^ ( t 1 ) ) and h i = y ^ ( t 1 ) 2 l ( y i ,   y ^ ( t 1 ) ) represent the first-order and second-order derivatives, so it is at least necessary to ensure that the loss function is second-order differentiable when choosing the loss function.

3.2.1. Cross Entropy and Focal Loss

In classification tasks, Cross Entropy (CE) is commonly used as the loss function to measure the difference between predicted and true values in classification tasks. The binary CE is expressed as Formula (9):
C E ( p , y ) = l o g ( p ) ,       i f     y = 1 l o g ( 1 p ) ,       o t h e r w i s e
where y represents the true label, while p [ 0,1 ] denotes the estimated probability by the model for the category with label y = 1 . The multi-class task can be regarded as a collection of individual binary tasks, and the overall classification loss is the sum of the losses for each binary classification task. Definition p t :
p t = p ,       i f     y = 1 1 p ,       o t h e r w i s e
Then, C E ( p , y ) = C E ( p t ) = l o g ( p t ) .
The FL [23] has improved the CE by introducing modulation factors and weighting factors. The model is equipped to focus on challenging samples during its predictions. The formula for FL is as follows:
F L ( p t ) = α t ( 1 p t ) γ l o g ( p t )
where ( 1 p t ) γ represents the modulation factor that increases the penalty for difficult samples. α t represents the weighting factor analogously to the defined p t , and it is used to address the issue of sample imbalance.

3.2.2. Triage Loss Definition

FL has been shown to significantly improve the performance of models, as demonstrated in various datasets, such as the COCO dataset. However, the performance of FL may be better in some tasks, as concluded in the paper [24] and similar to the findings of this study. When used for training XGBoost models , FL may not outperform models trained with default. Therefore, in this study, a new loss function was designed to enable the trained classifiers to outperform models trained with default in various evaluation metrics. Drawing on the concept of FL, in the loss calculation, as is shown in Algorithm 1, TL increases the significance of challenging samples by assigning them greater weight, making the model more focused on handling challenging samples and aiming to achieve improved classification performance. Furthermore, TL demonstrated significant effectiveness in the task of fault classification for vibration sensors. TL is defined as:
T L ( p t ) = ( 1 ) γ + 1 α l o g γ ( p t ) l o g ( p t )
Algorithm 1: TL based on XGBoost
Input: predt, predictive value
Output: grid and hess, first derivative and second derivative of loss
1 mpredt.shape[0] // m is number of training set
2 npredt.shape[1] // n is number of classification
3 for r = 1 to m do
4    y t u r e l a b e l s r ;
5    y p r e s o f t m a x ( p r e d r ) ;
6   for c = 1 to n do
7       g r i d T L ( y t u r e c , y p r e c ) / y p r e ;
8       h e s s 2 T L ( y t u r e c , y p r e c ) / 2 y p r e
9   end
10 end
Figure 2 shows the Triage loss when α = 1 , γ [ 0,4 ] . We amplify the proportion of loss for hard samples using a modulation factor of l o g ( p t ) γ , making the model focus more on difficult samples. The loss becomes significantly large when p t 0 , l o g ( p t ) γ 1 , the loss becomes significantly small when p t 1 , l o g ( p t ) γ 0 . TL exhibits a more pronounced adjustment on the loss compared to FL, reduces the proportion of loss contributed by easy samples, and alleviates the issue of gradient domination by easy samples. When γ 0 , as the value of γ increases, the modulation effect of TL becomes more pronounced. When γ = 0 , the TL degenerates to CE. Compared with CE, when γ = 1 , p t = 0.9 and the loss becomes 1% of CE, and when p t = 0.1 , the loss becomes five times of CE, increasing the proportion of difficult sample loss in the overall loss. The use of static weighting factor α t to address the issue of sample imbalance has been proposed in prior works [25,26]. Meanwhile, studies [23,24] have found that the modulation factor and weighting factor interact with each other, and thus these two parameters need to be selected together. In the present work, it was found that the use of a static weighting factor did not lead to higher accuracy in the model. Therefore, in this study, the modulation factor α was introduced as a replacement for α t . After experimentation, it was found that this approach led to improved model performance. During the course of this study’s experiments, it was determined that optimal performance was attained when α = 0.1 , γ = 1 .

3.3. Vibration Sensor Fault Diagnosis Based on Triage Loss and XGBoost

This paper presents a data-driven approach based on XGBoost, which utilizes TL to train the model for improved recognition accuracy in VSFD. As shown in the data preparation module in Figure 3, vibration data are selected from the device monitoring database, and a segment of data is extracted as a data sample. The data sample is then further divided into smaller samples. For experimental purposes, bias fault, drift fault, spike fault, erratic fault, stuck fault, data-loss fault, and random fault are injected into each small sample separately, as described in Section 4, and the samples are labeled accordingly. The data are input into XGBoost, and each tree in XGBoost is trained for regression. Then, to get the ultimate regression outcome, the regression measurements of all the trees are combined. The total regression value is then mapped to a probability between 0 and 1, with a representation of the likelihood of the sample being part of a specific category.

4. Experimental Analysis

In order to prove the validity of the proposed method, experiments were carried out on a self-test data set and open data set aiming at seven common faults of vibration sensors at multiple failure rates. The models trained with the three loss functions are compared using various performance metrics such as Accuracy, the F1-score, mean Average Precision (mAP), Precision, and Recall.

4.1. Experiments Were Performed on the Measured Dataset

4.1.1. Data Acquisition

Due to the difficulty of obtaining vibration data with real fault patterns and the lack of publicly available datasets for VSFD, this study uses healthy sensors to acquire vibration data. The seven types of faults are then injected into normal data with varying rates of fault (0.2, 0.4, 0.6, 0.8, 1), as described in the previous section. Other researchers [27,28] have also employed similar methods to obtain fault datasets in their studies. The data used in this experiment were obtained from bearing vibration data on the low-speed and heavy-load test stand. The vibration sensor model is SK601D, and the sampling frequency of the data acquisition equipment was 1 KHz. As shown in Figure 4, vibration data were selected from the equipment monitoring database, and a 350 s signal segment was extracted as the raw data for this experiment. The seven types of faults were injected into the data with different fault rates to simulate faults that occur over very short or very long periods of time. Labels were assigned to the data accordingly, where a value of 0.2 represents the mildest fault with a fault signal proportion of 0.2, and a value of 1 represents the most severe fault. The data were further divided into 70 small samples, resulting in a dataset size of 5 × 8 × 70 × 5000, where there are five different fault rates and eight different fault types, each with 70 samples, and each sample contains 5000 data points. The dataset was split into 5 × 8 × 50 small samples for training and 5 × 8 × 20 small samples for testing. The original vibration data segments are shown in Figure 5.

4.1.2. Experimental Result

It is inappropriate to rely solely on accuracy as a performance measure in ML. When dealing with imbalanced datasets where positive samples are in the minority, a high accuracy may not necessarily indicate that the model’s actual performance is satisfactory. For instance, in a dataset where positive samples constitute only 2%, a model could achieve an accuracy of 98% by simply predicting all samples as negative. However, in reality, the model would not have made any meaningful predictions. Therefore, this study employs multiple metrics to assess the model’s performance.
Table 1 summarizes the algorithm hyperparameters used in this study for training XGBoost with different loss functions, including both the XGBoost algorithm hyperparameters and loss function hyperparameters.
The use of different loss functions for model training results in classifiers with varying classification performances, as shown in Table 2. It can be observed that, except for a fault rate of 0.4, the classifier trained with Softmax performs better. However, for other fault rates, the classifiers trained with the TL show a significant improvement in accuracy. On the other hand, the model trained with the FL could perform better in terms of accuracy at various fault rates.
To further illustrate, 
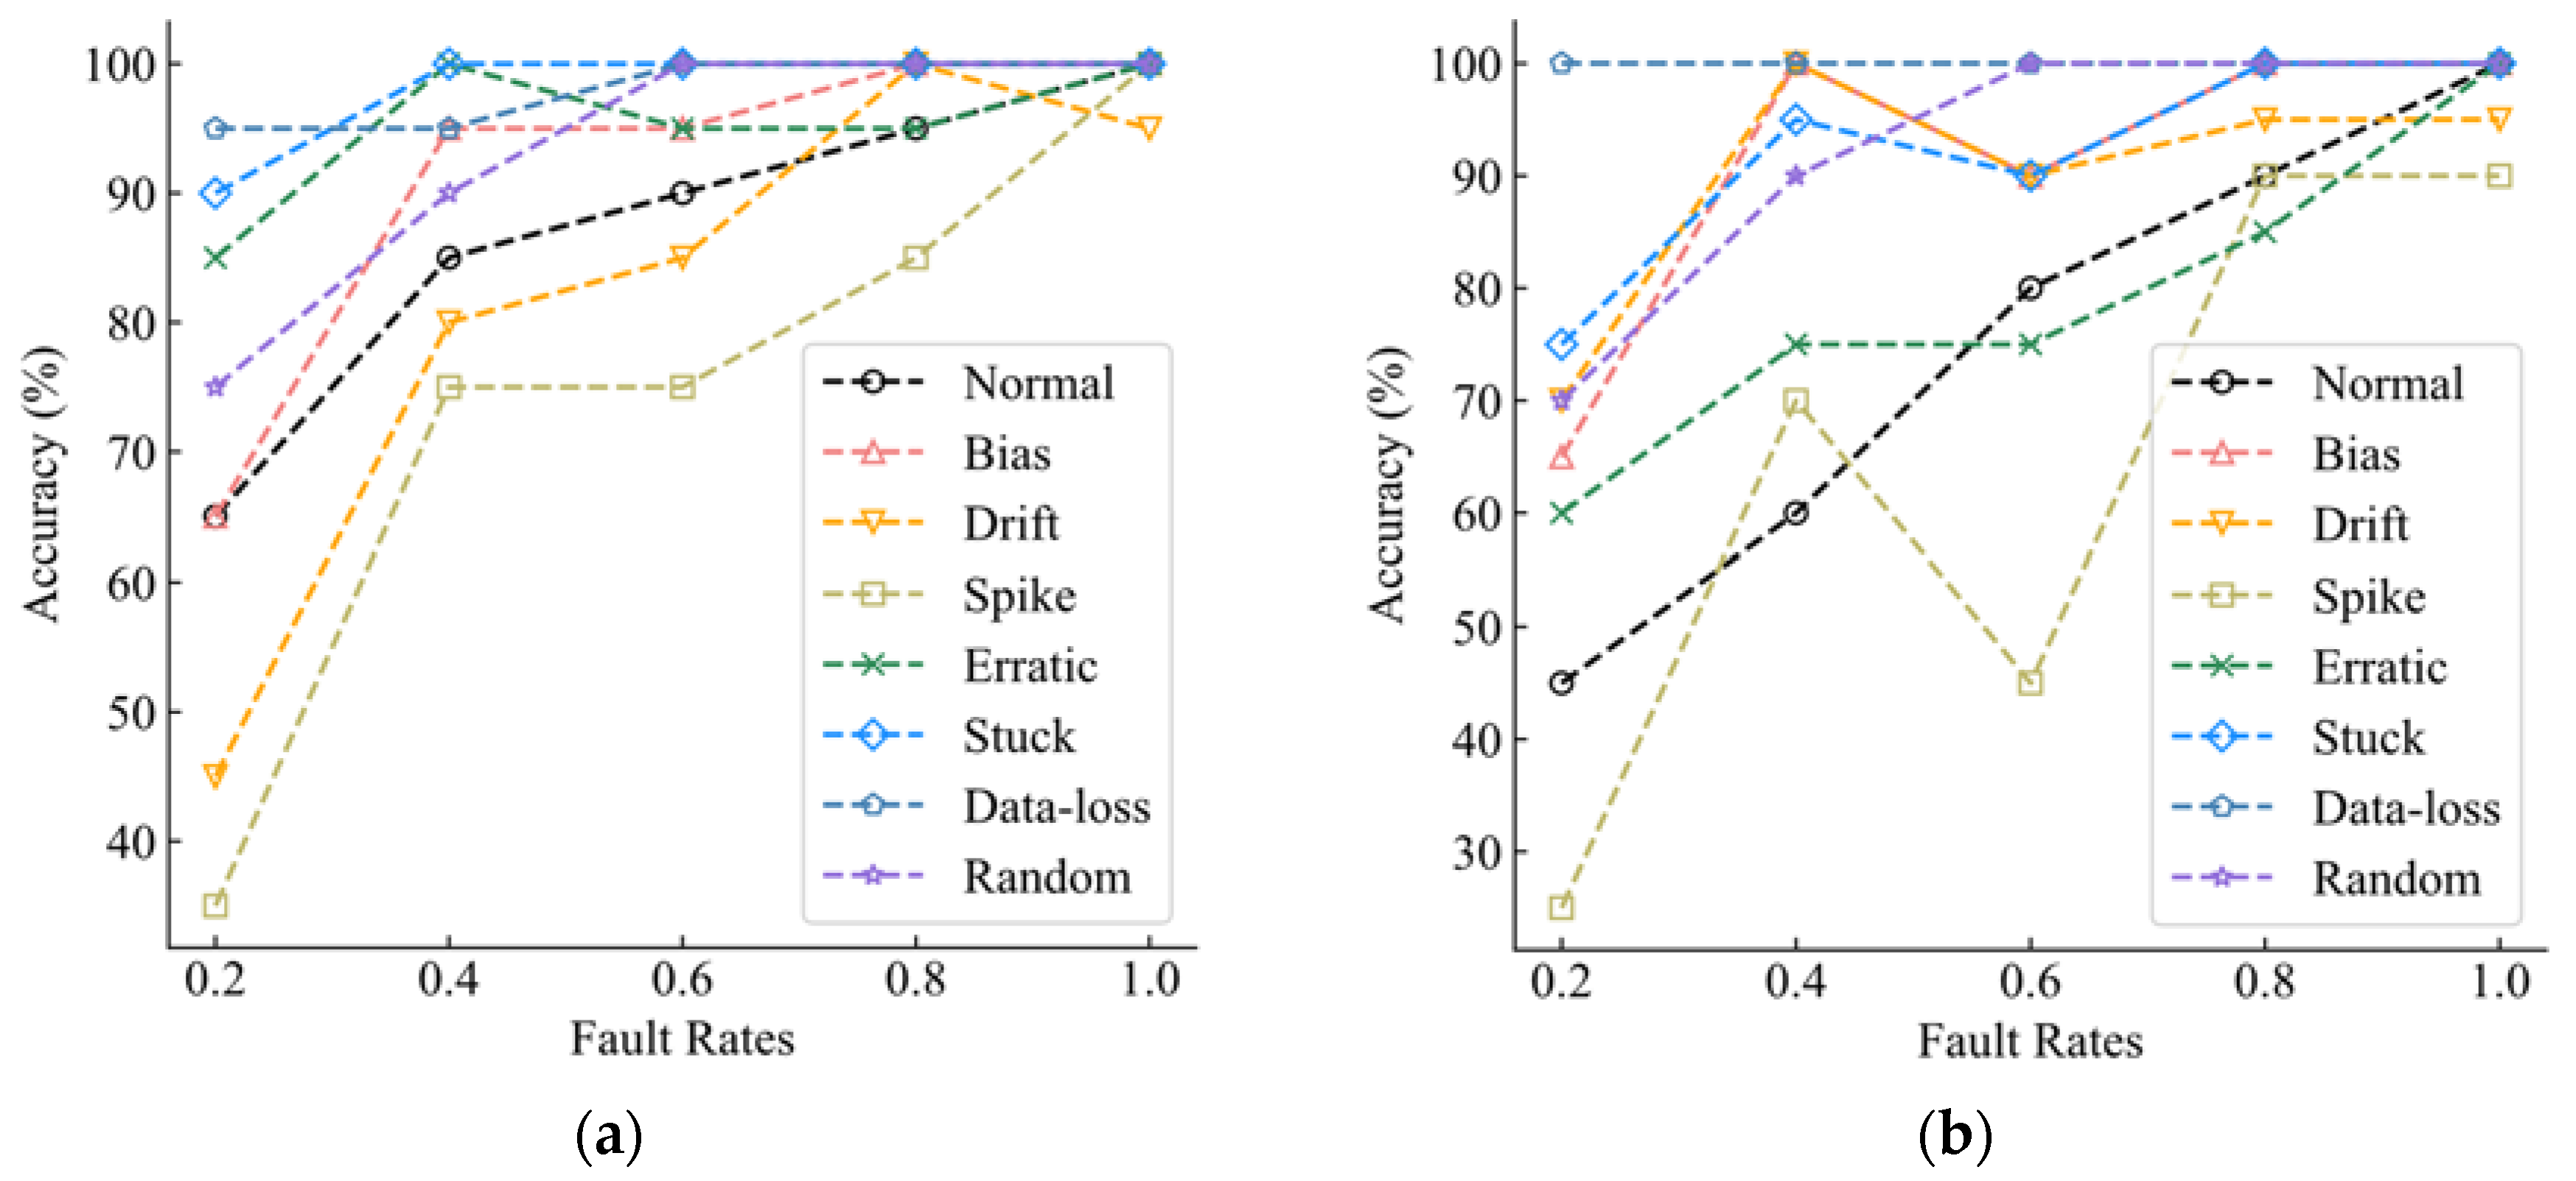
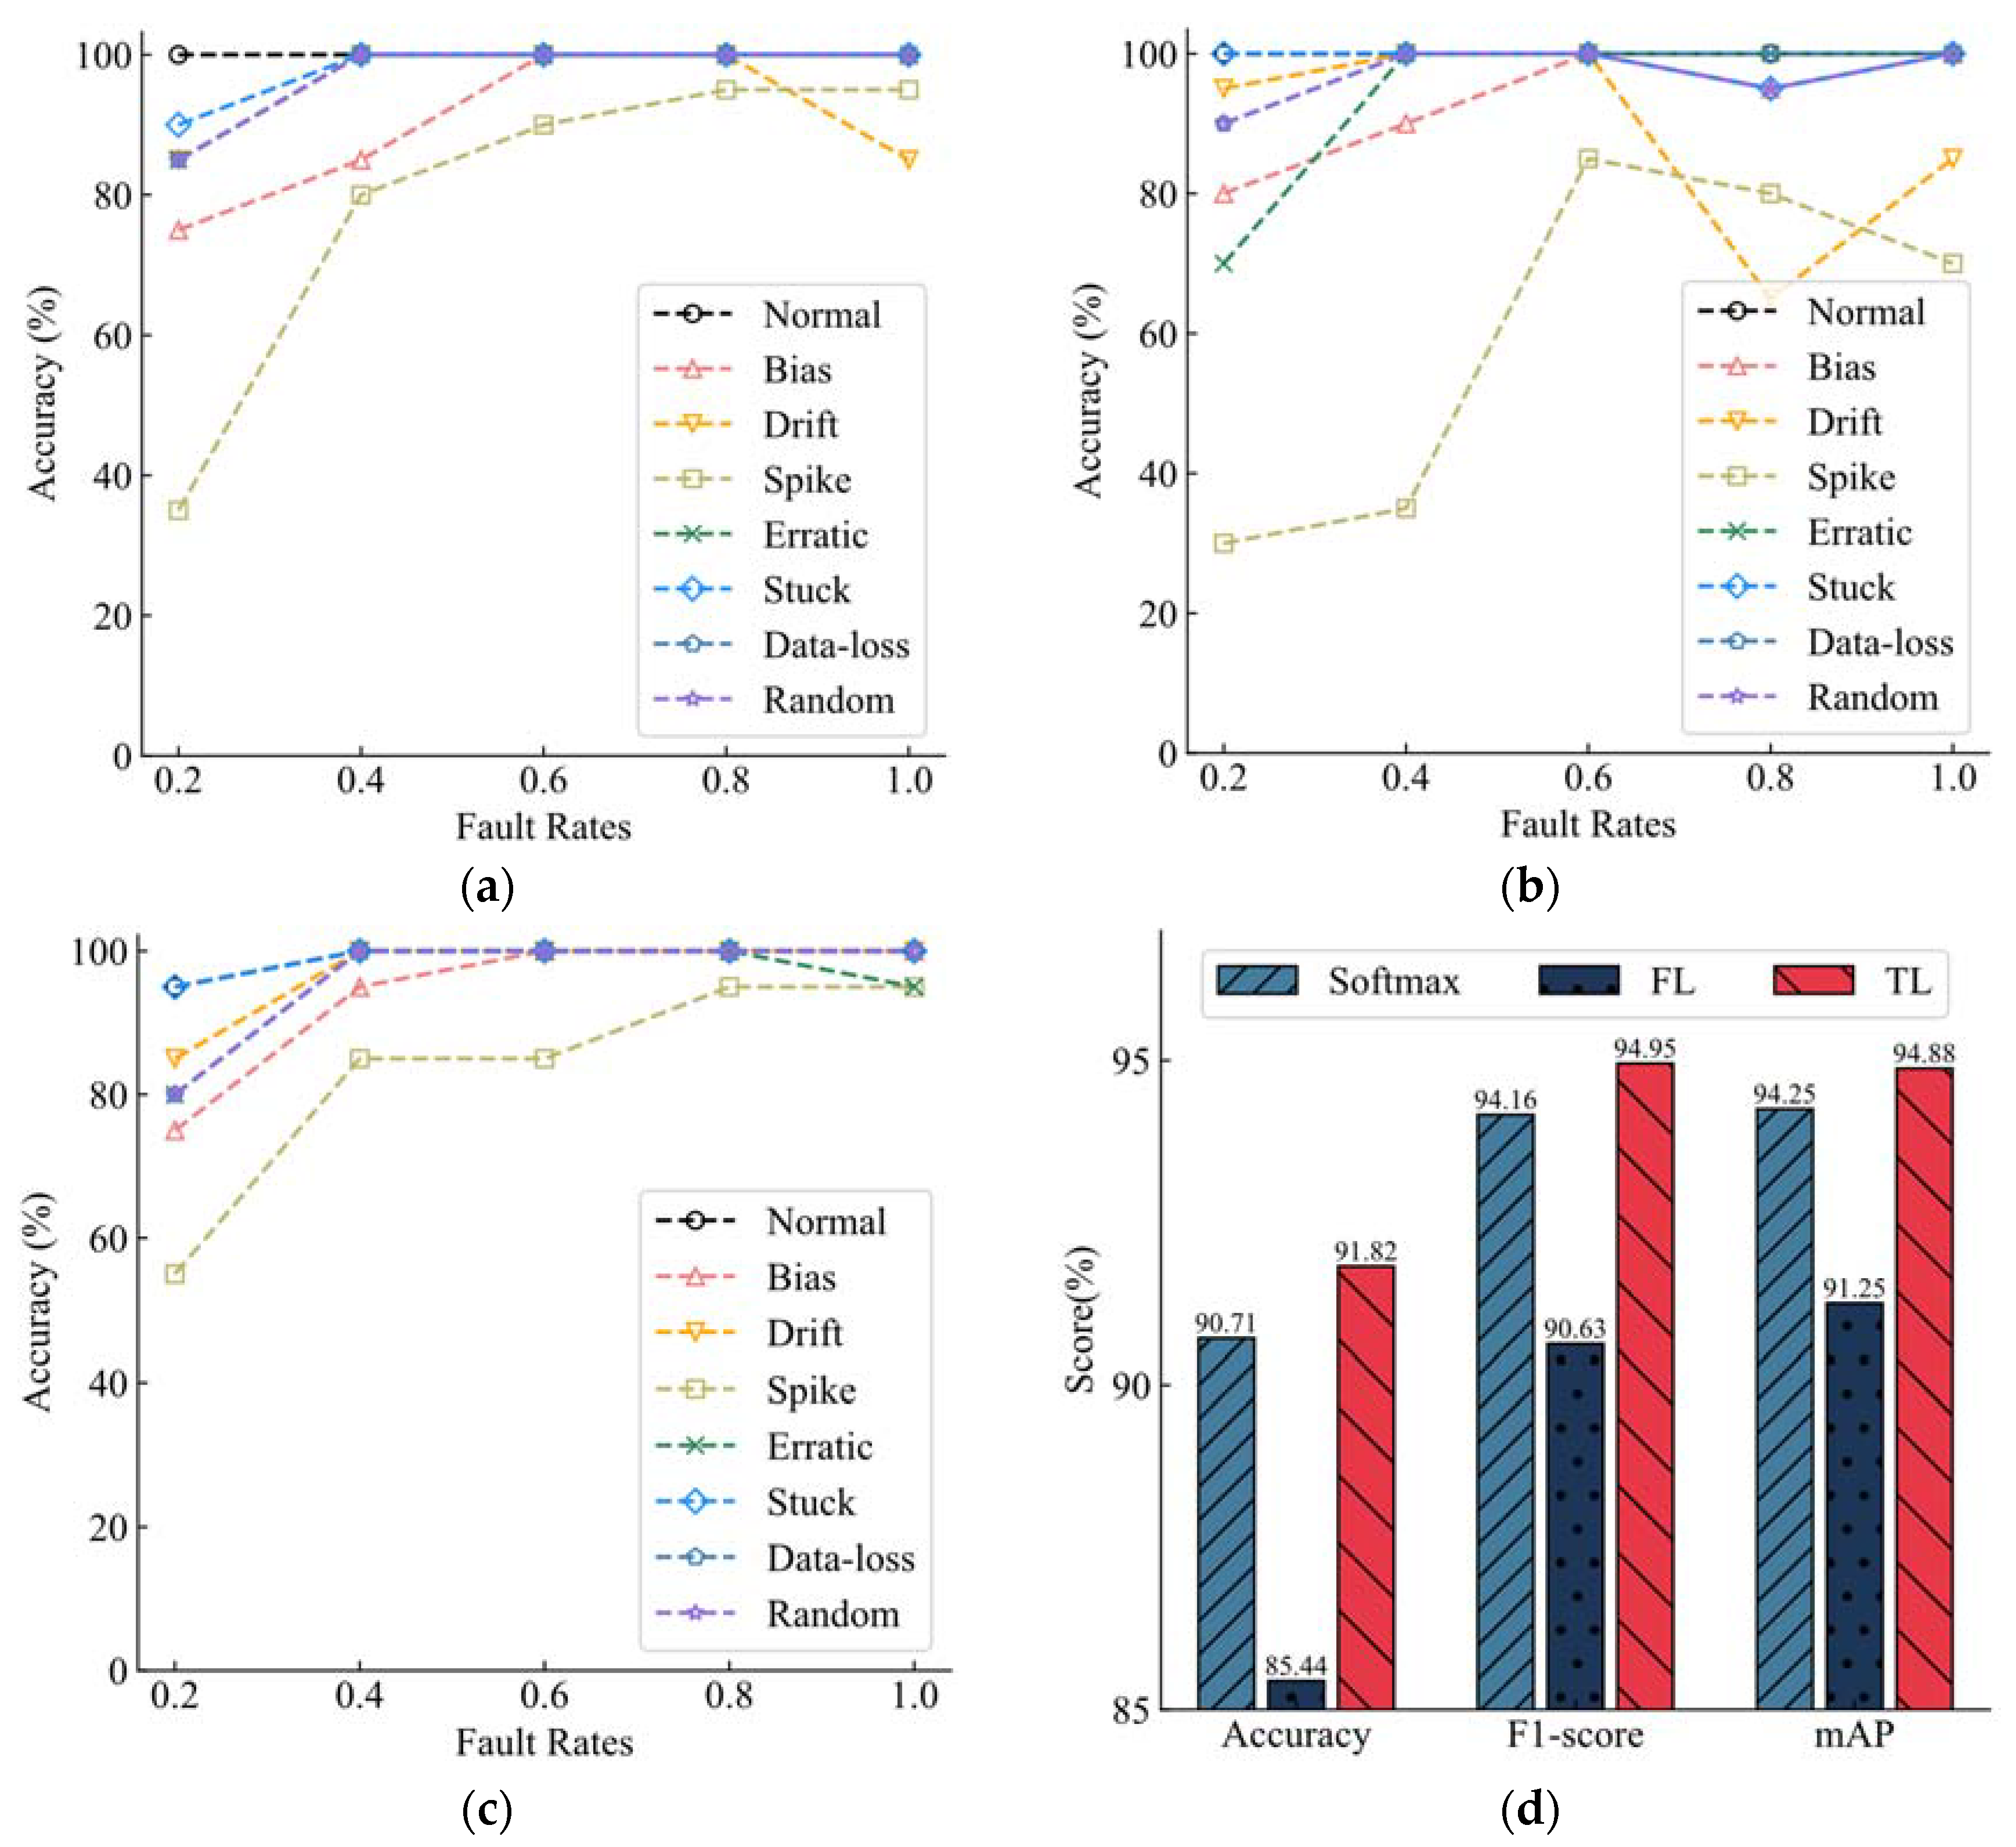
Figure 6a,b shows the recognition accuracy of the three classifiers for the eight categories under different fault rates. In order to better demonstrate the superiority of the proposed method, 
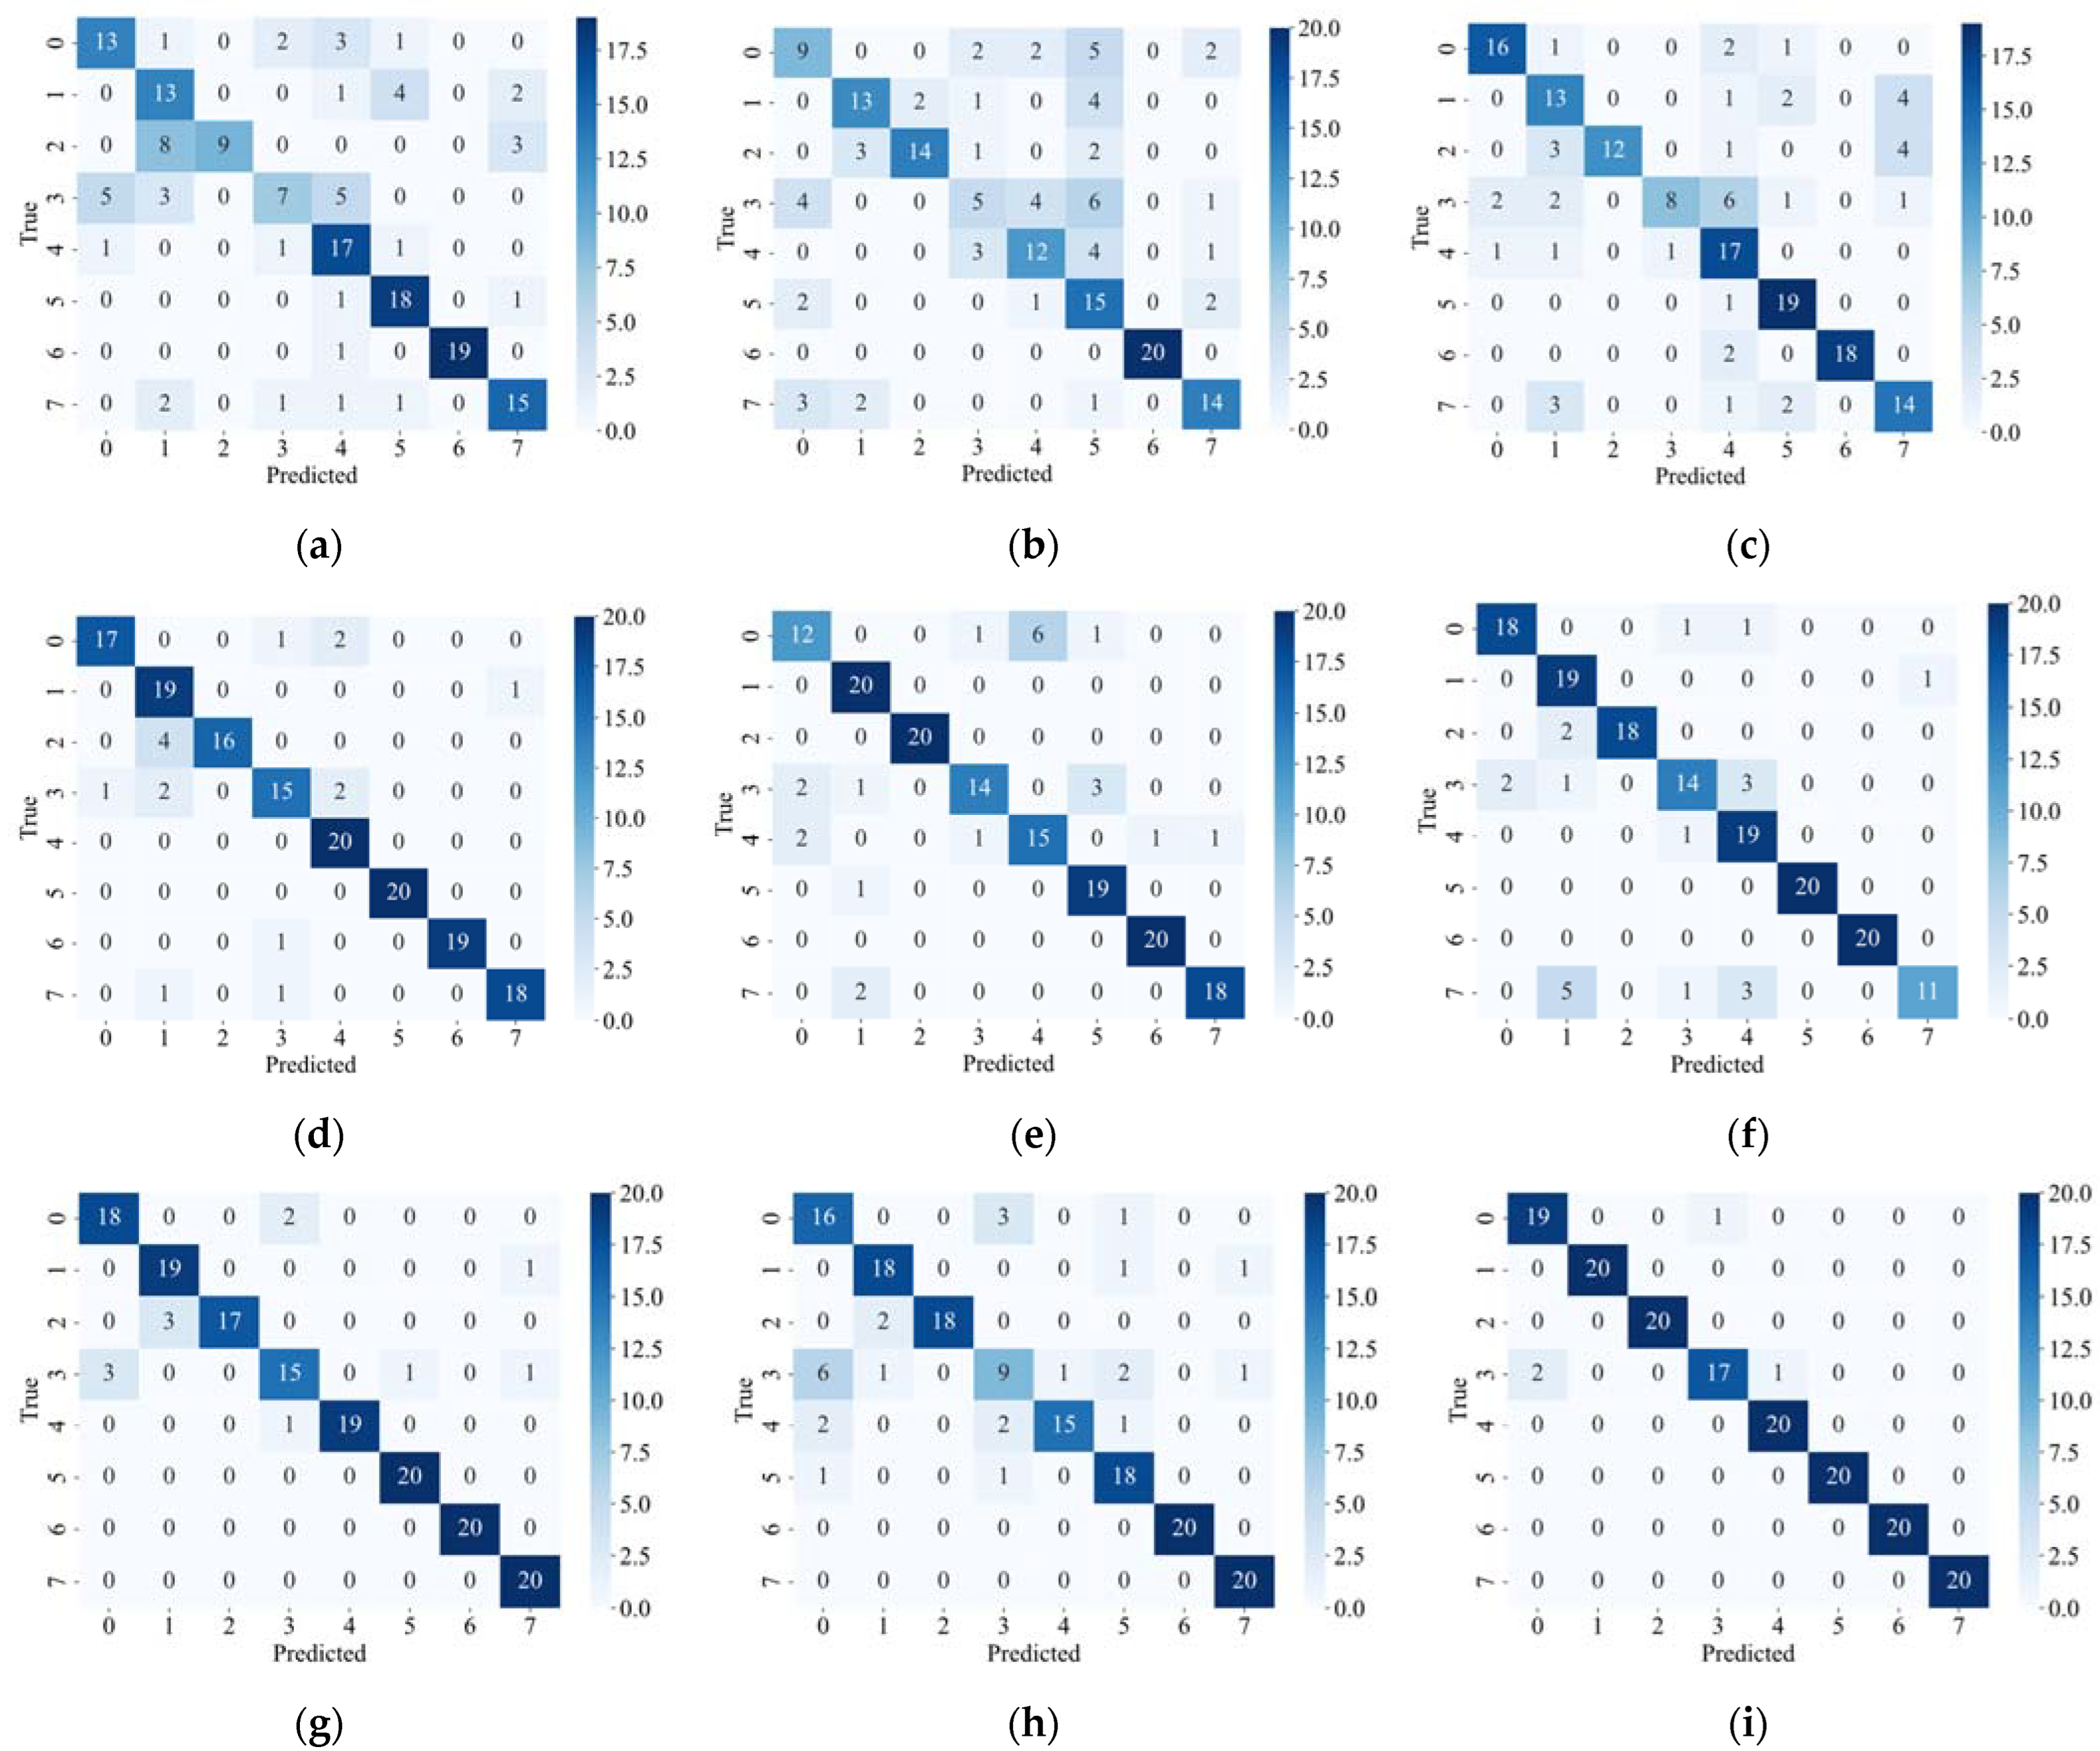
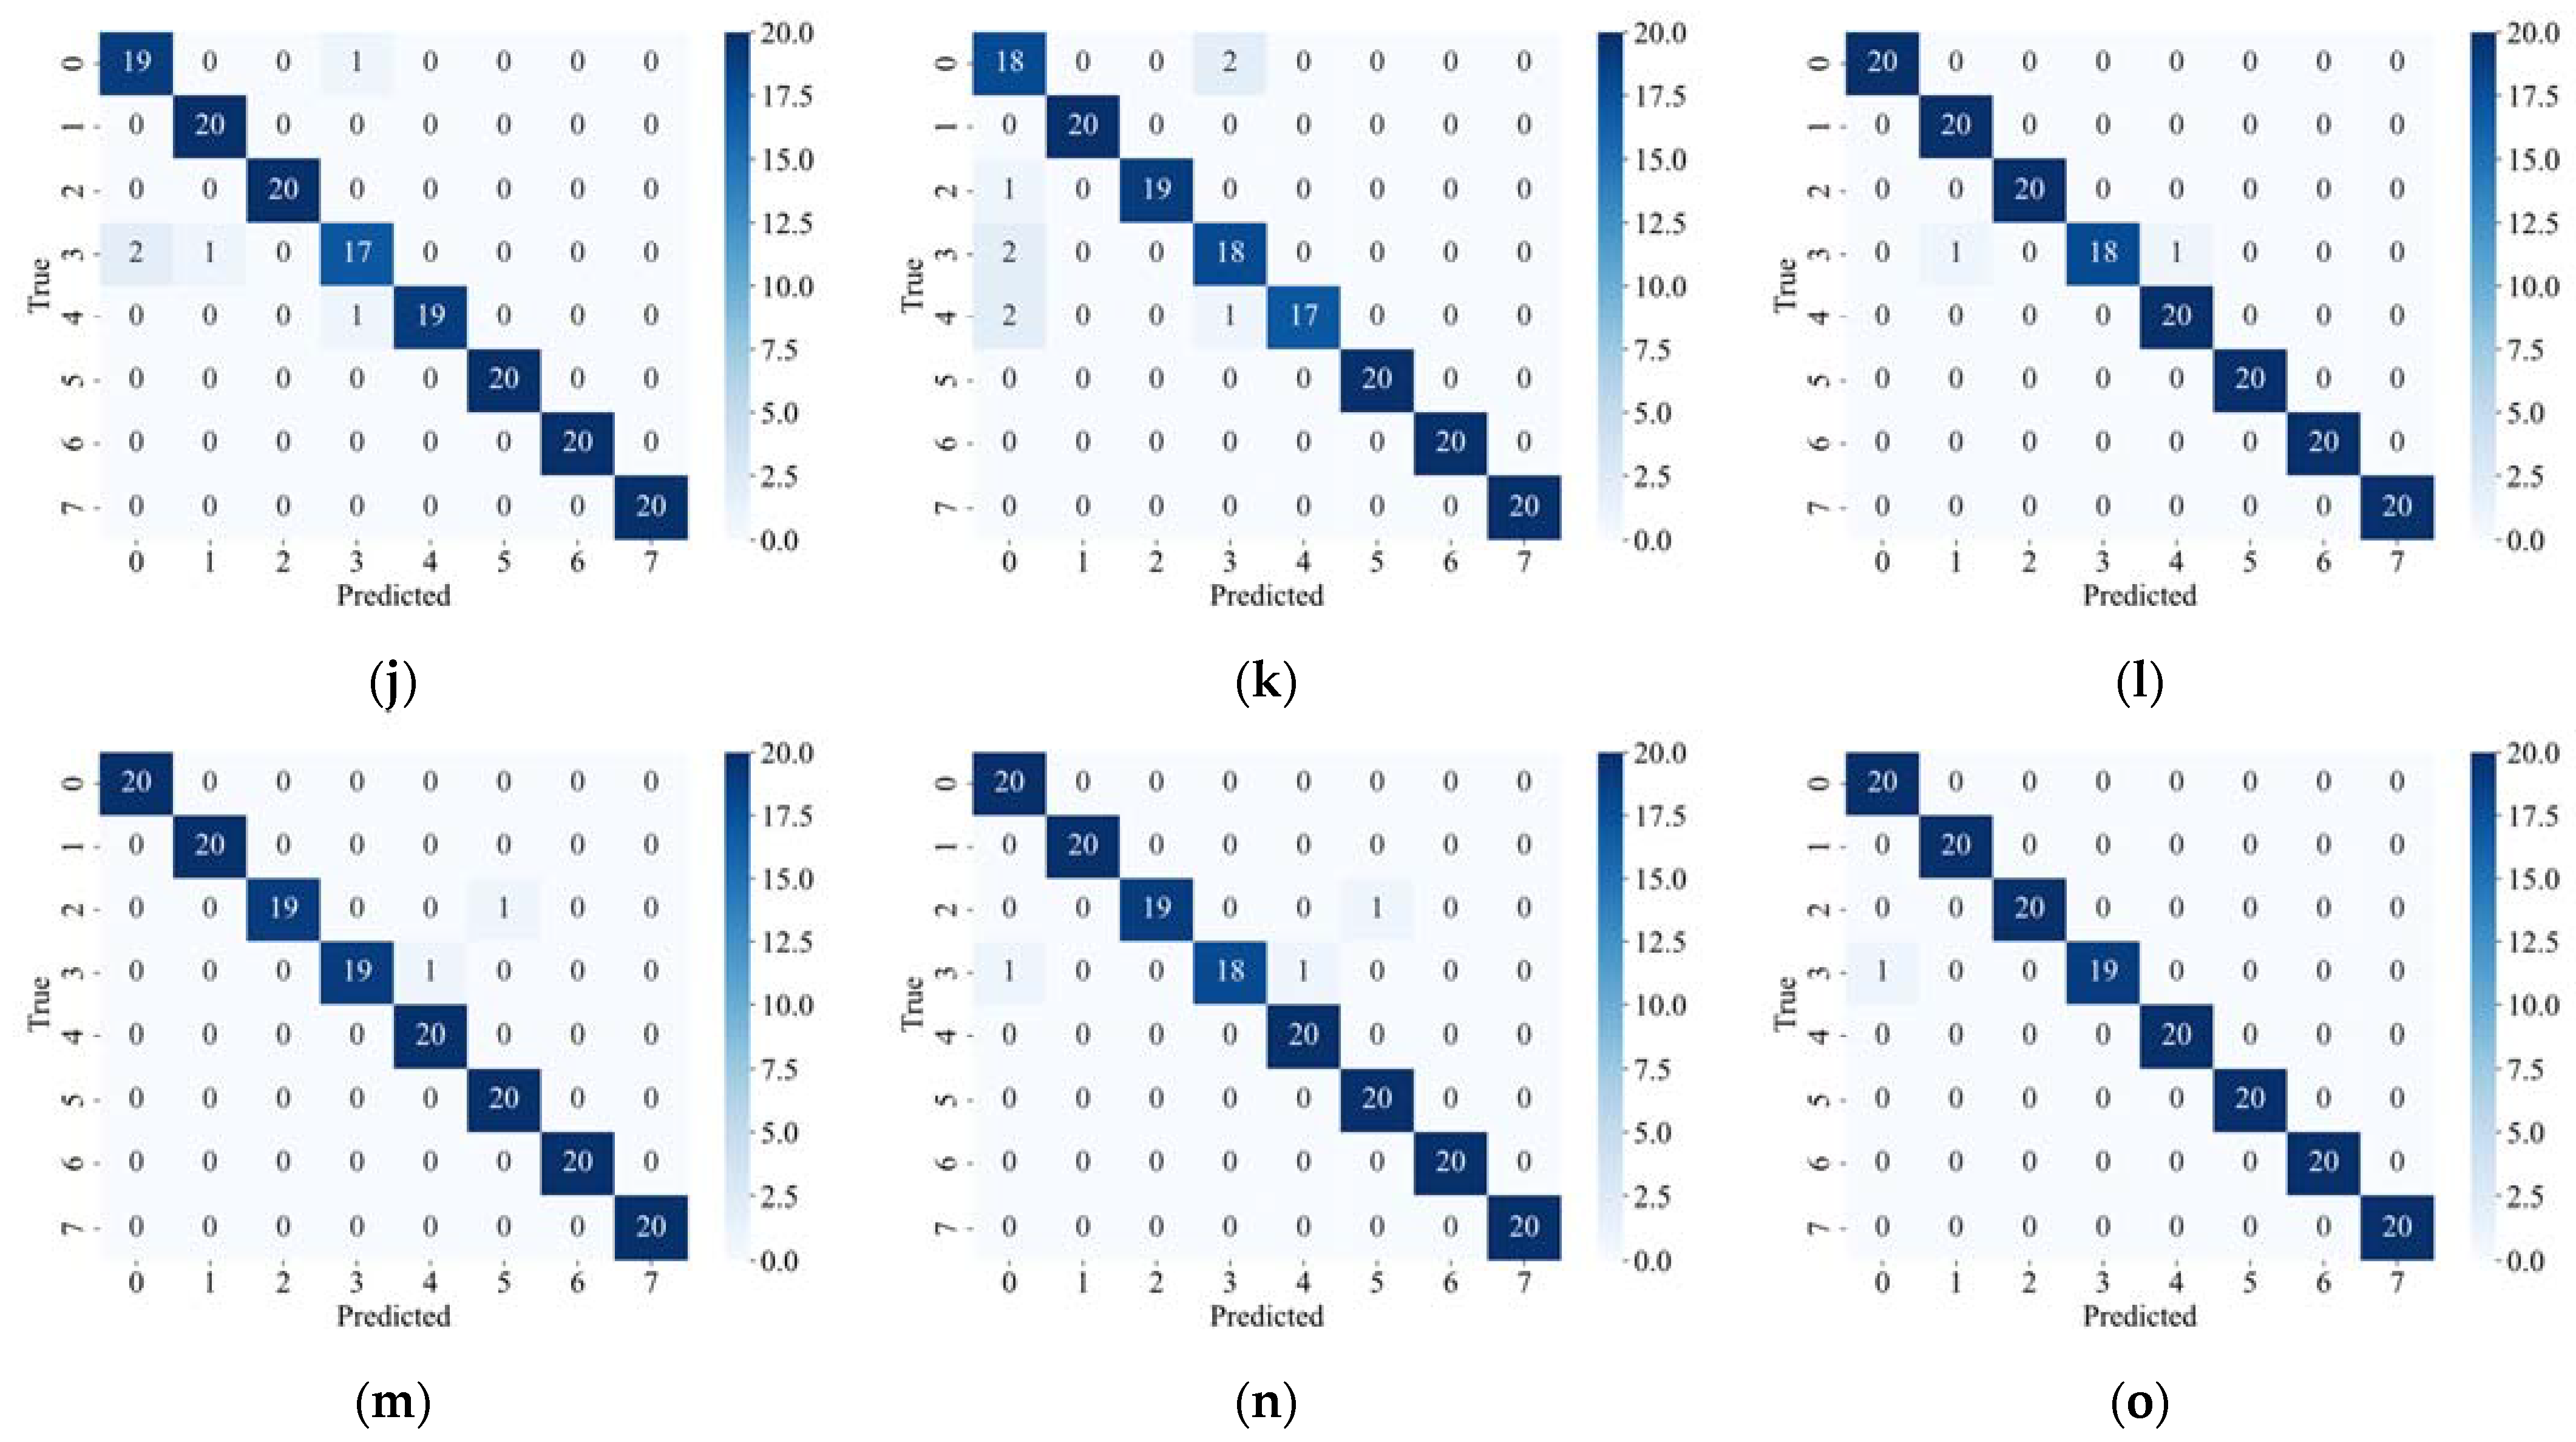
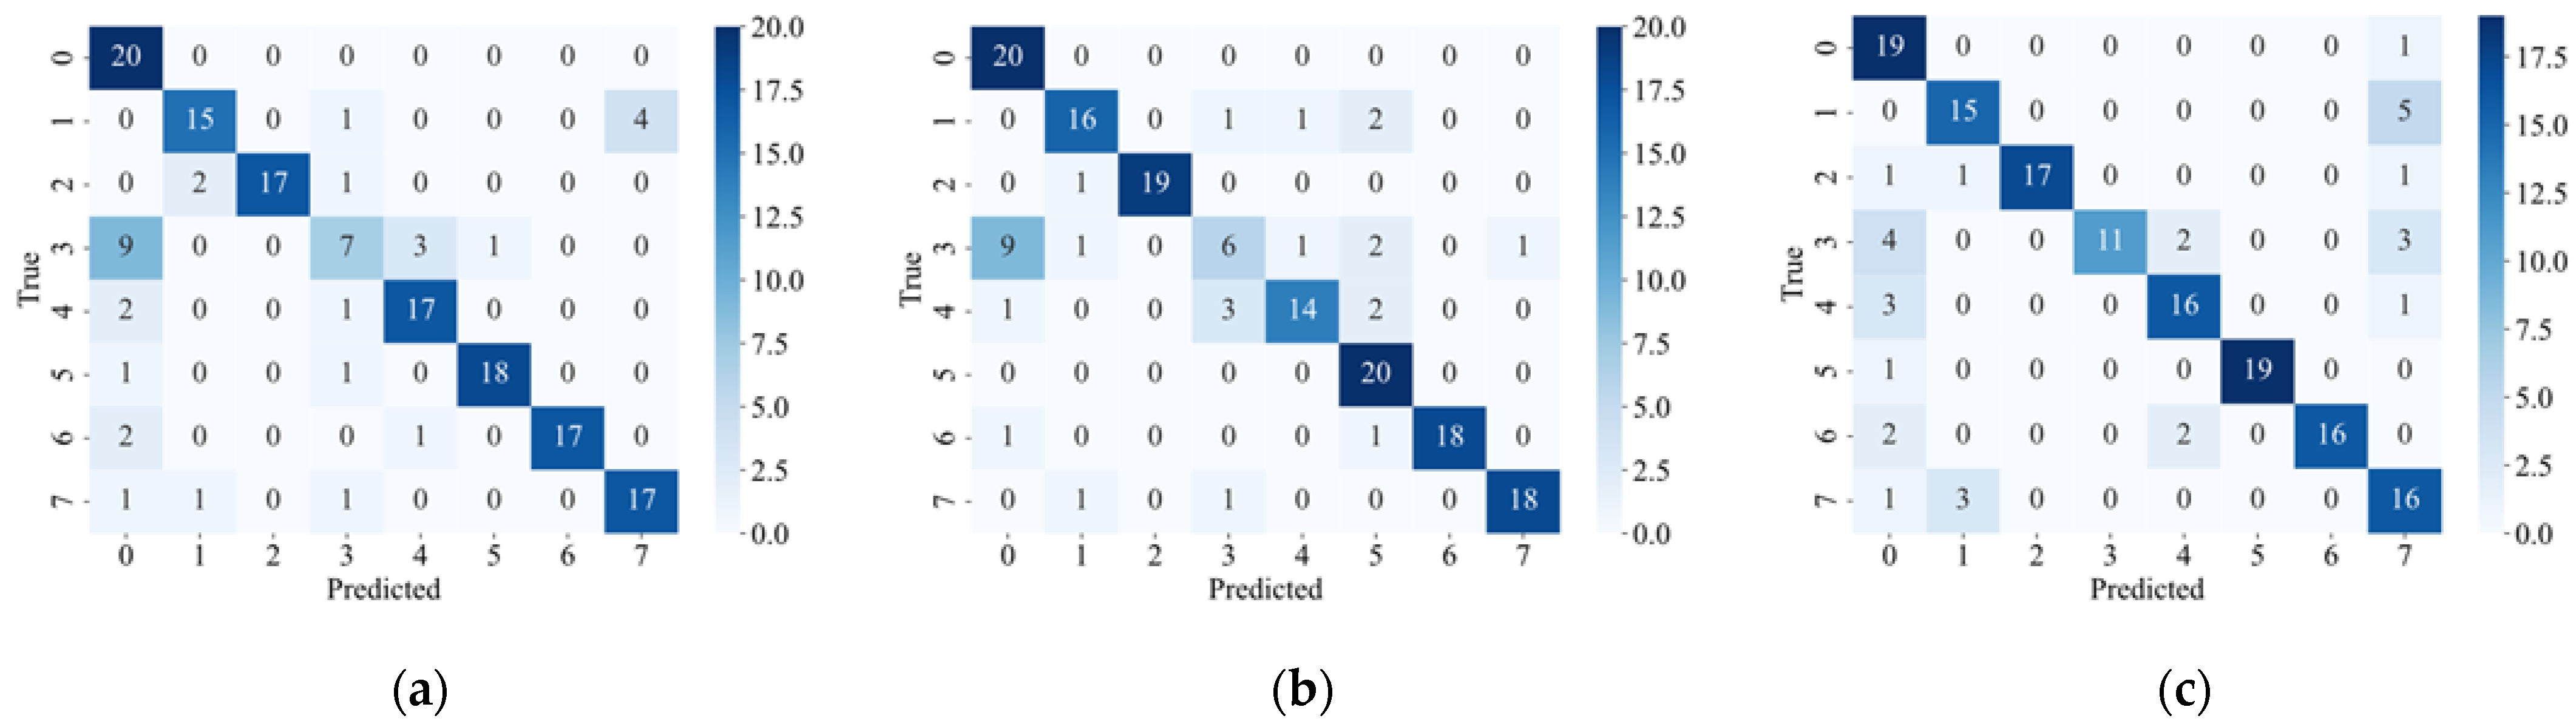
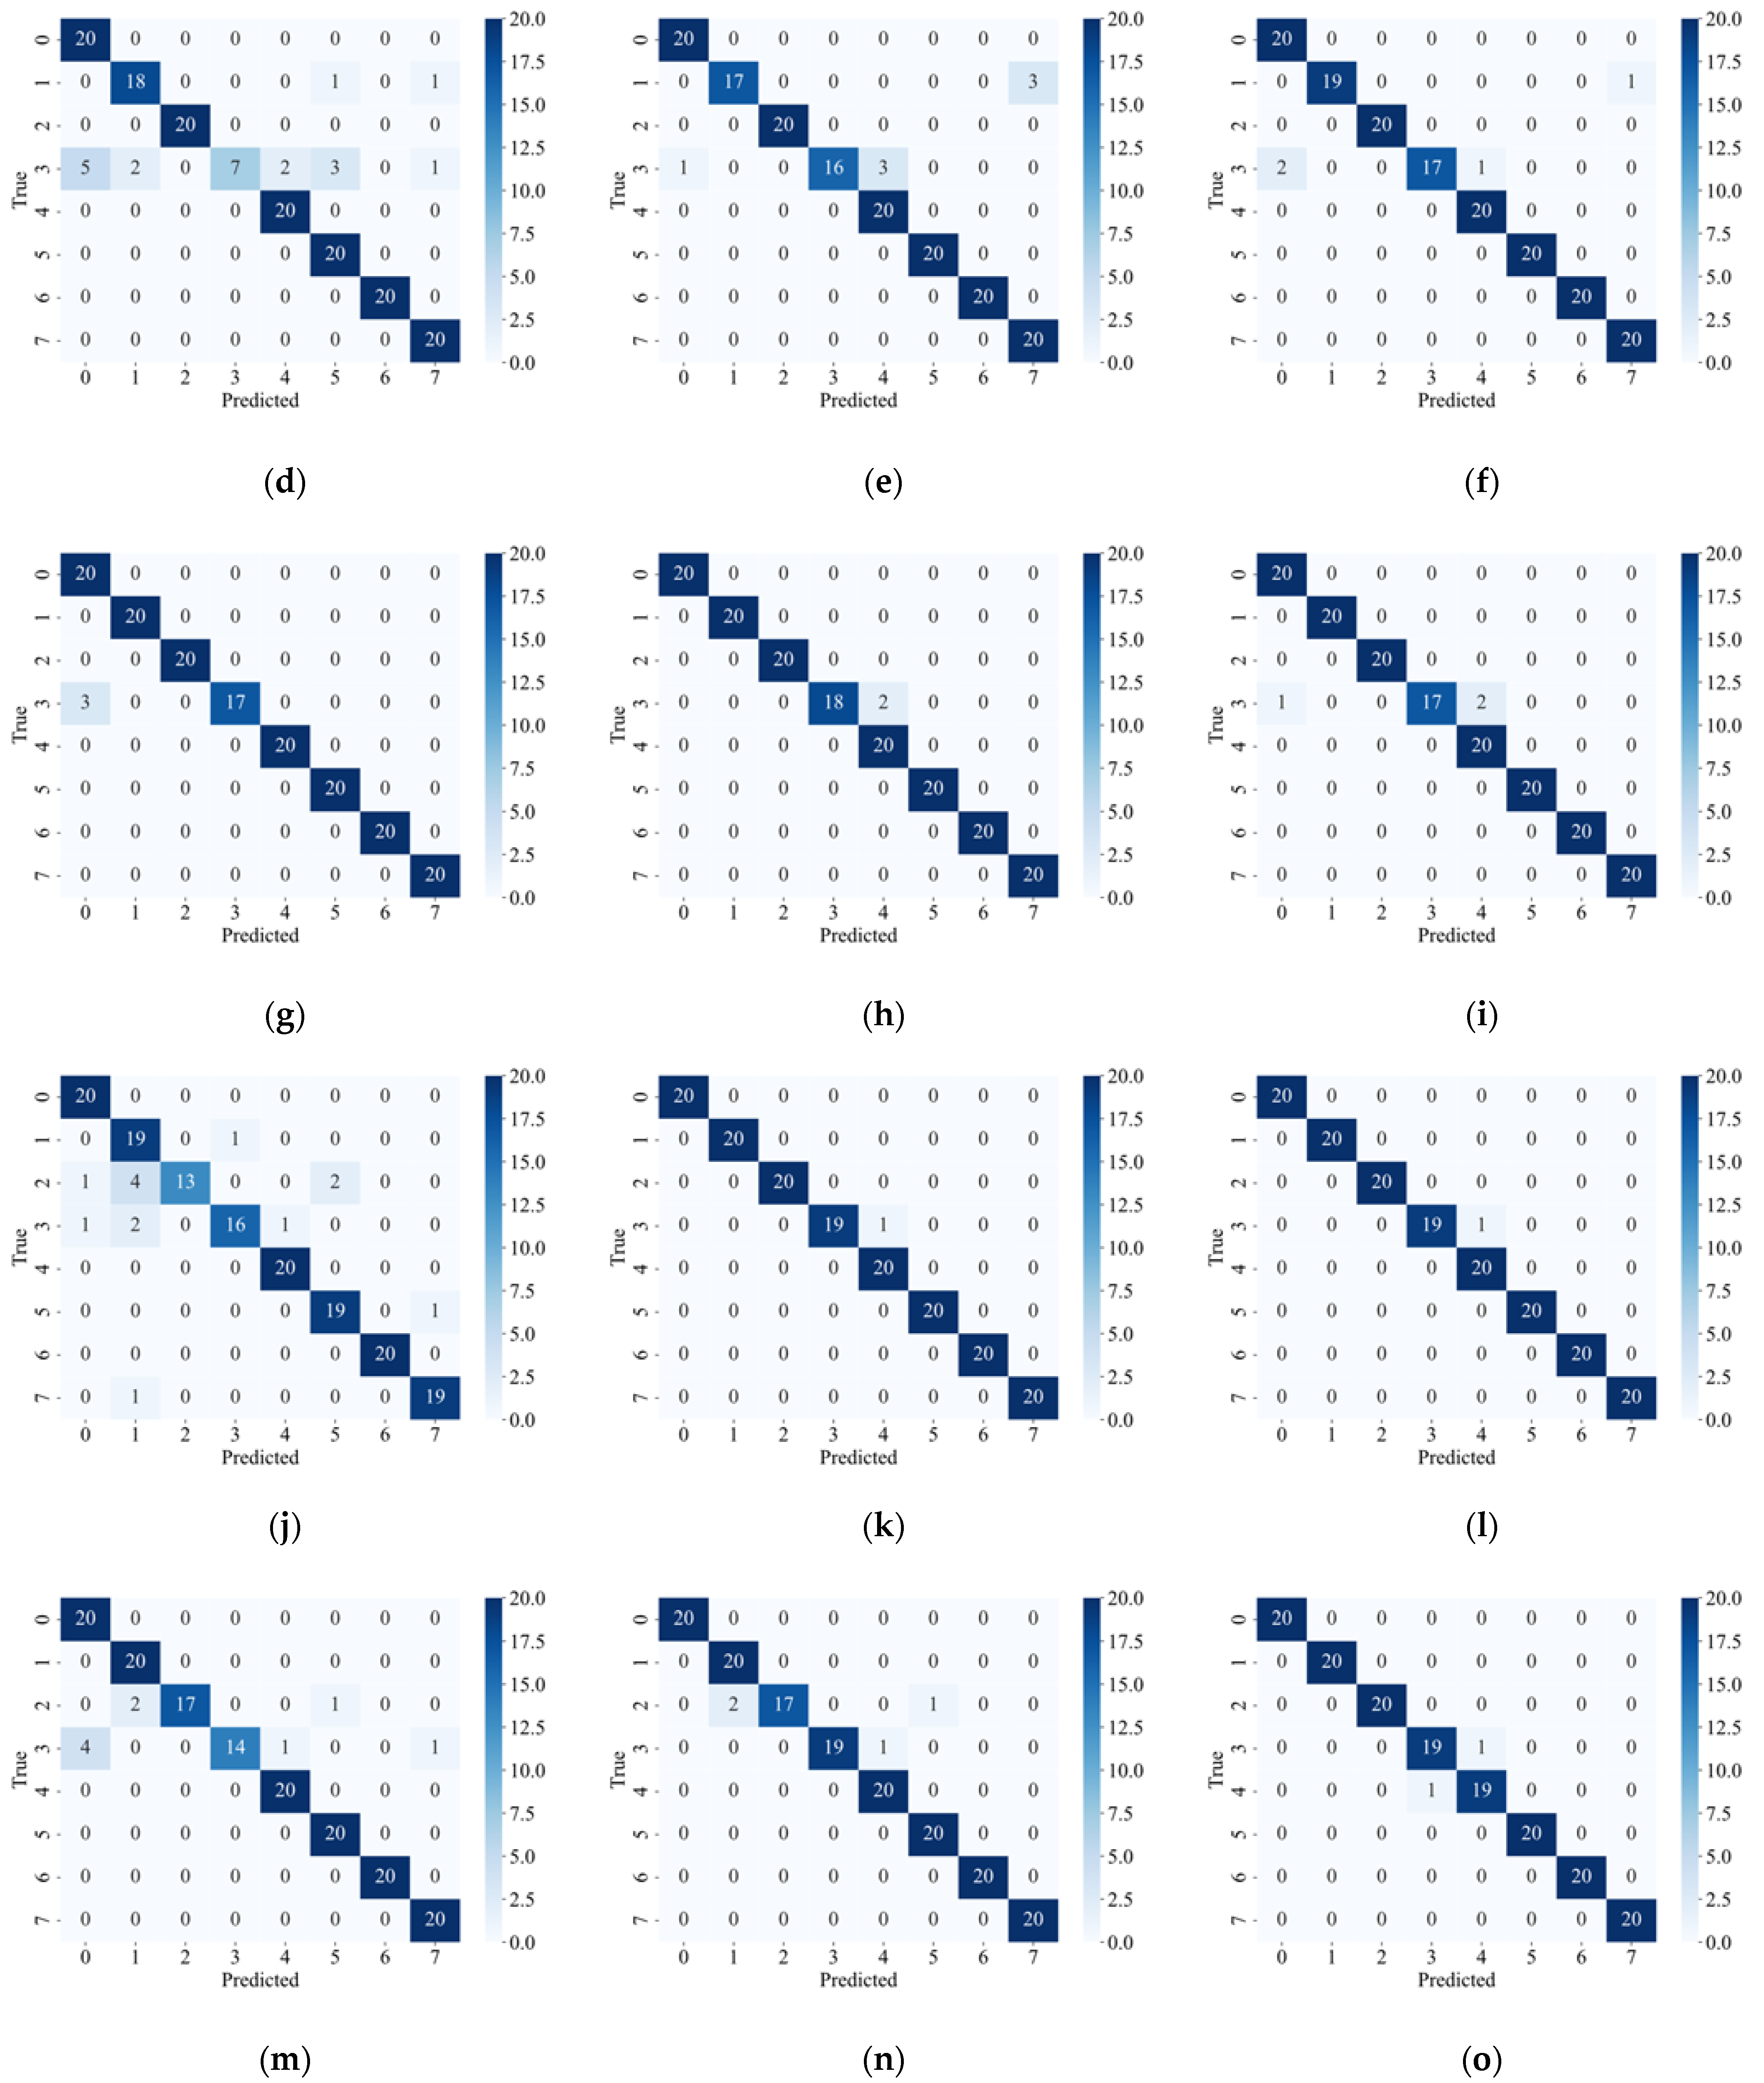
Figure 7 shows the confusion matrix of each model under different failure rates. 
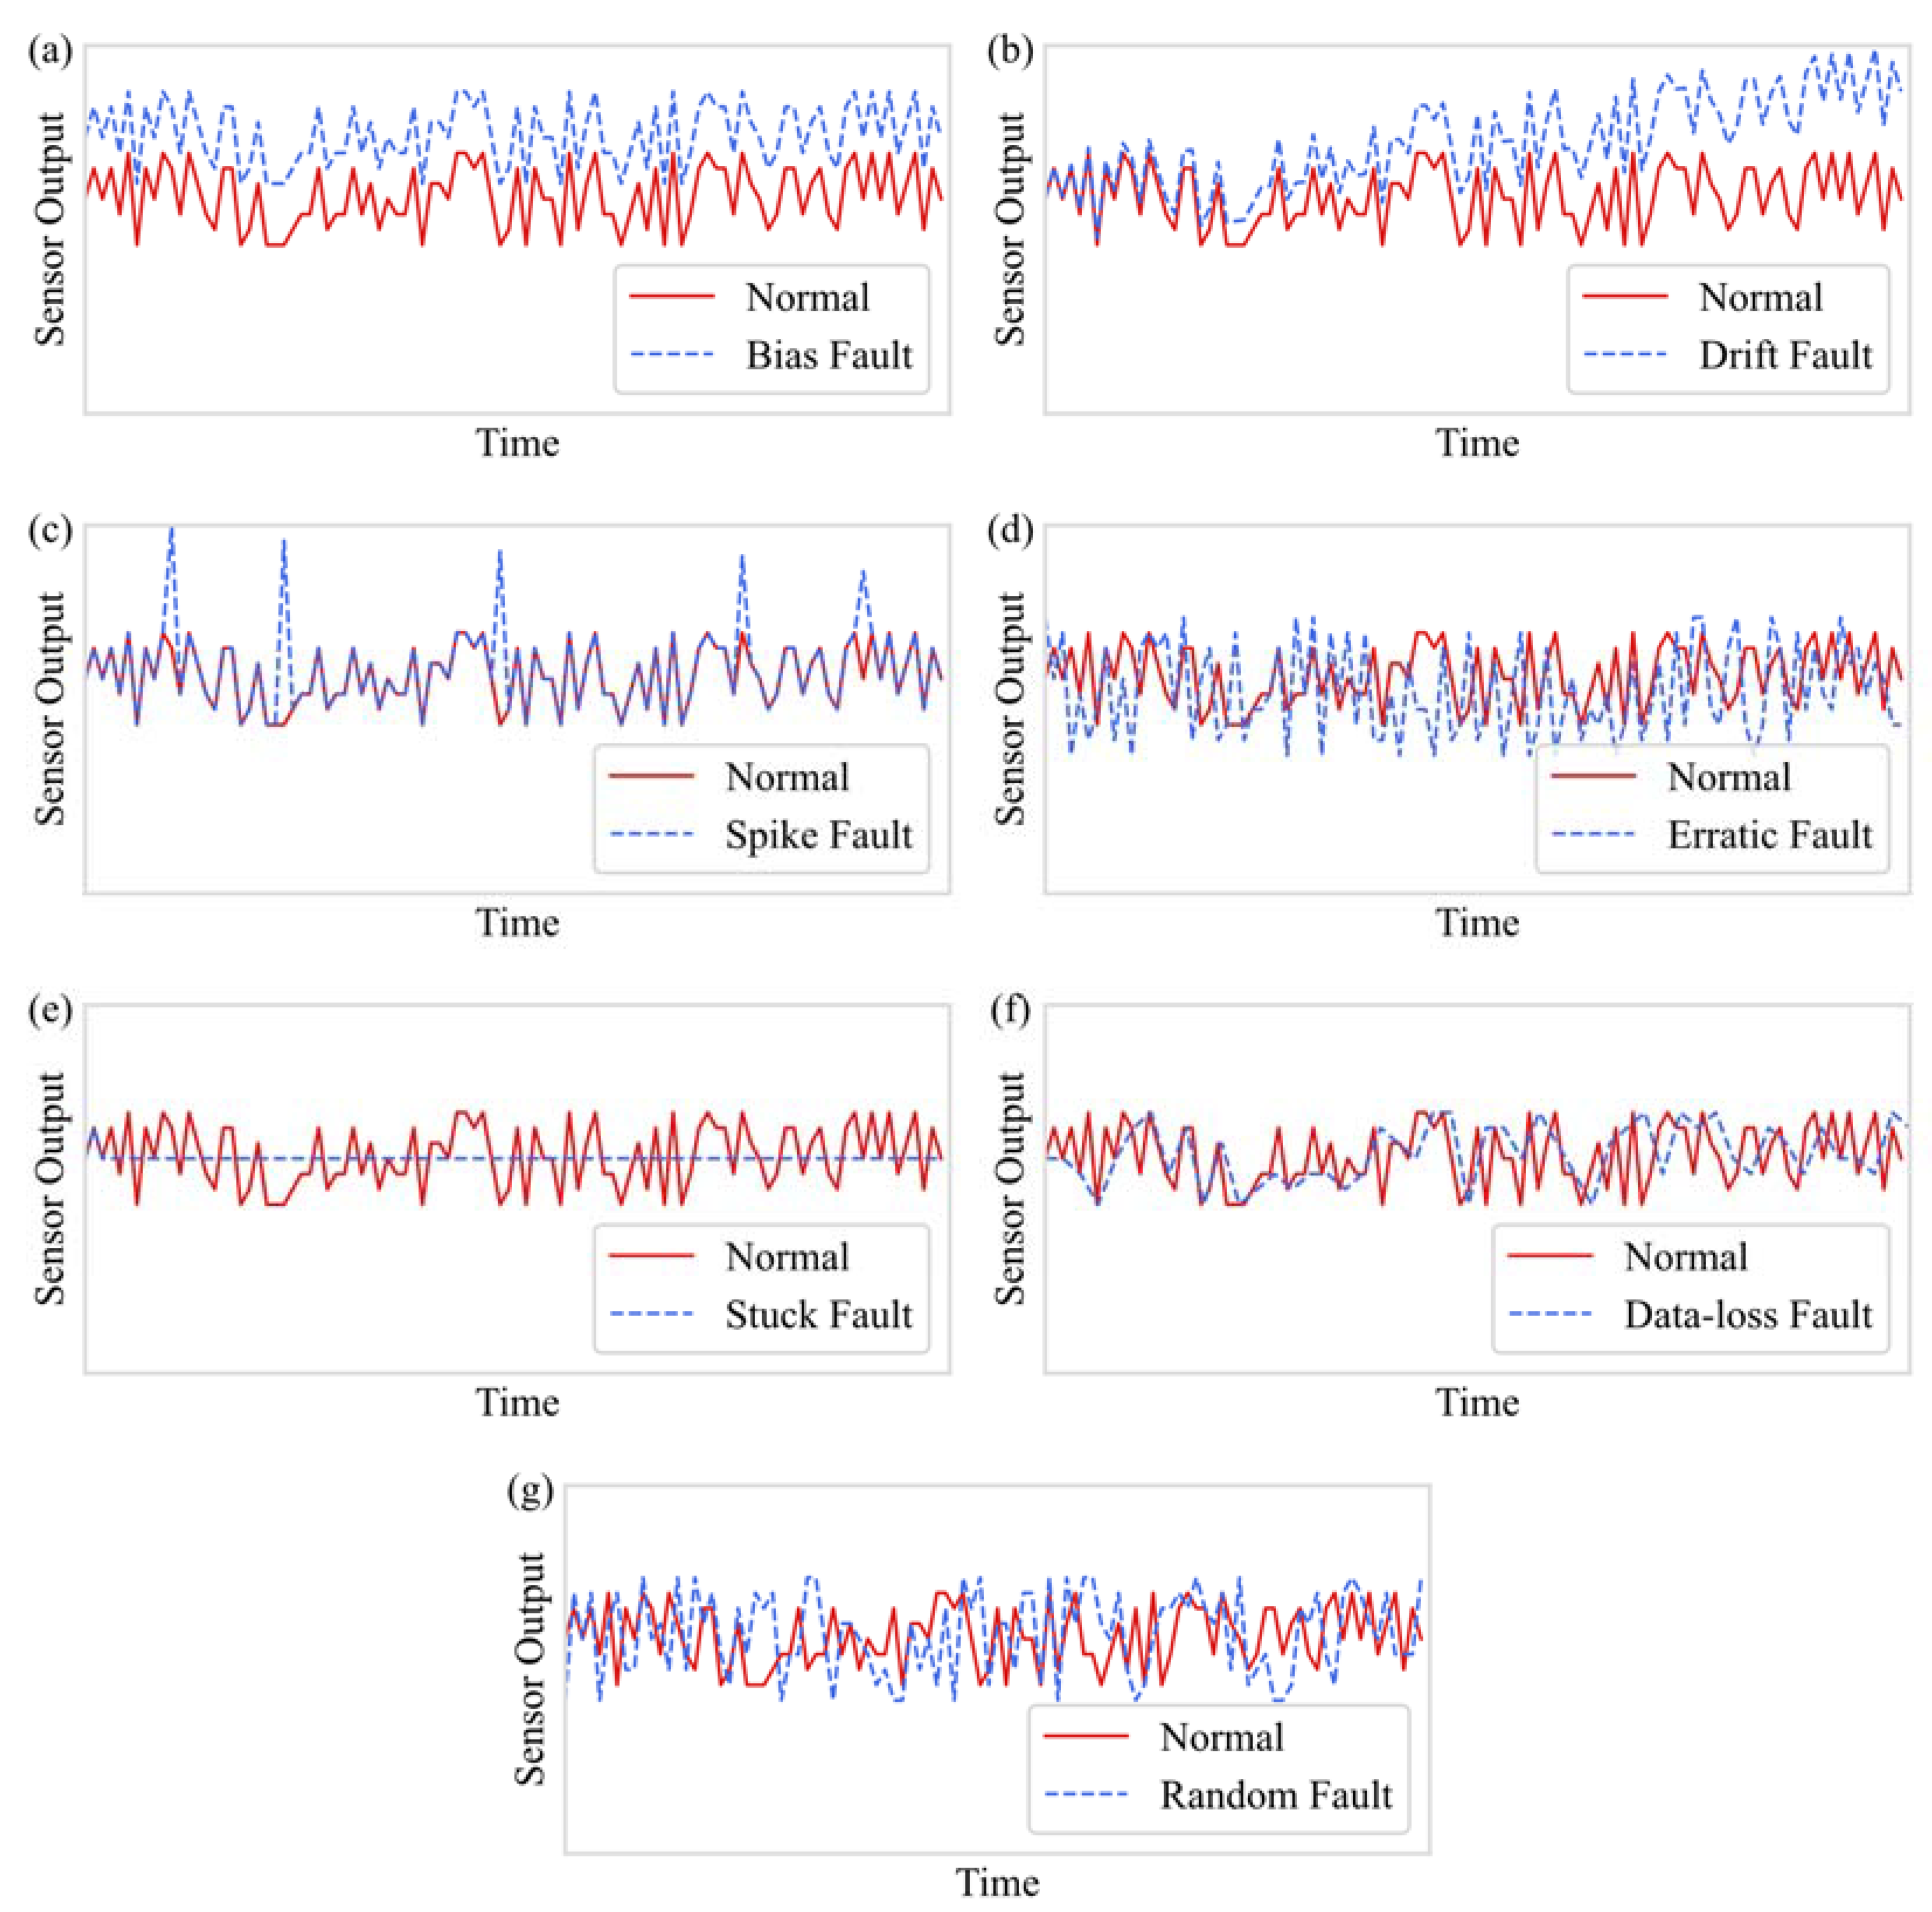
Figure 6a shows the classification accuracy of each fault type in data sets with fault rates of 0.2, 0.4, 0.6, 0.8, and 1 for the model trained using the XGBoost default loss function. It can be seen that the diagnostic accuracy of the model generally increases with the increase of the fault rate, except that the classification performance of the categories Erratic and Drift decreases when the fault rate is 0.6 and 1, respectively. When the fault rate of the model reaches 0.8, the recognition accuracy of all categories reaches more than 80%. When the fault rate reaches 1, the prediction accuracy of other categories of faults reaches 100%, except Drift faults.
Figure 6b shows the model trained with FL as a loss function and the classification accuracy of each fault type in data sets with fault rates of 0.2, 0.4, 0.6, 0.8, and 1, respectively. With the increase in the fault rate, the overall identification accuracy of the model is gradually improved. However, when the fault rate is 0.6, the performance of the model decreases obviously, and the identification accuracy of Spike, Erratic, Stuck, and Drift decreases somewhat, among which the identification accuracy of Spike declines most seriously. This makes the overall recognition of the model decline even less than the model’s recognition accuracy when the fault rate is 0.4, but when the fault rate reaches 0.8, the accuracy of various categories can still reach more than 80%, but the overall classification accuracy of the model is not high. In general, the overall performance of the model trained with FL as a loss function is not as good as that of the model trained with the default loss function, especially when the fault rate is below 0.6. The gap between the two is obvious, and when the fault rate reaches 0.8 and 1, the performance gap between the two is reduced.
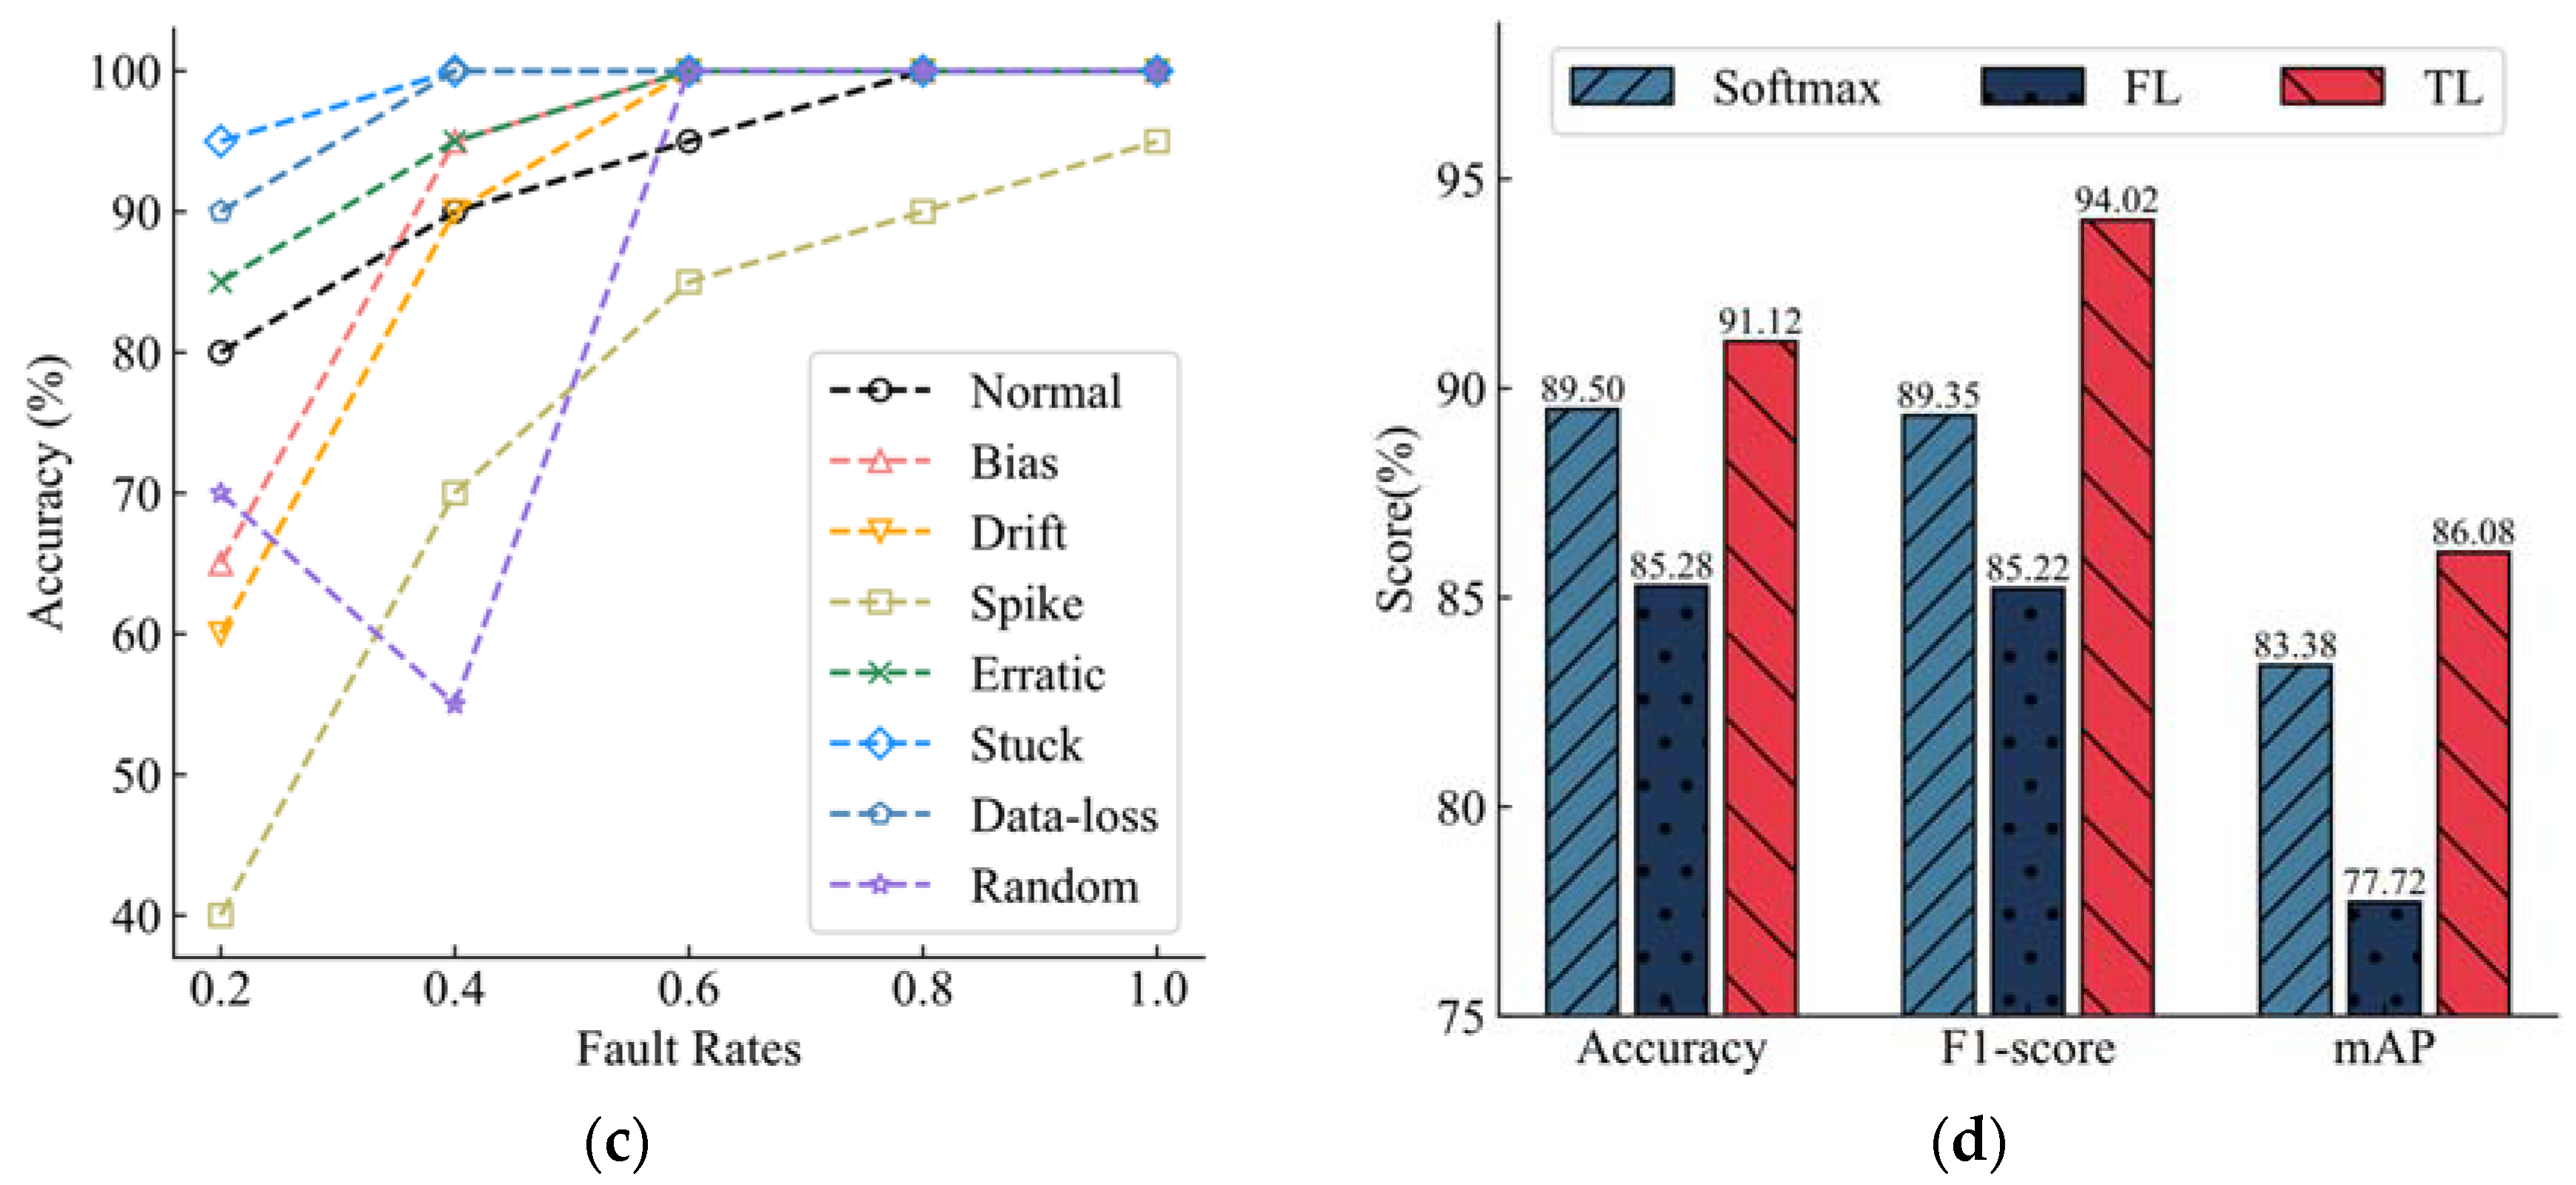
Figure 6c shows the classification accuracy of each fault type in data sets with fault rates of 0.2, 0.4, 0.6, 0.8, and 1 for the model trained with TL. With the increase in the fault rate, the overall recognition accuracy of the model still increases. When the fault rate is 0.4, the classification performance of the model Random decreases, which is also the main factor restricting the recognition accuracy of the model. However, when the fault rate reaches 0.6, the model shows good classification performance, and the accuracy rate of all categories reaches more than 80%. Except for Normal and Spike, the accuracy rate of other categories reaches 100%. When the fault rate reaches 1, in addition to the classification accuracy of Spike faults (but also up to 95%), the identification accuracy of other categories reaches 100%. It can be seen that TL makes the model have higher precision.
The classification of spike faults is a difficult task for XGBoost models, and in this regard, the models do not always do a good job of classifying spike faults, whether they are trained with default loss functions, FL training models, or TL training as loss functions. However, TL-trained models generally have the best performance in identifying spike faults. For the model trained using TL, when the fault rate is 0.4, the recognition accuracy of random faults has a huge decline, which is also the reason why the accuracy of the model trained using TL is not improved but decreased compared with the model trained using the default loss function at this fault rate. Data loss faults and stuck faults are relatively easy tasks for models, and models trained with TL and default loss functions can maintain an at least 90% recognition accuracy. In general, the TL-trained model can improve the accuracy of XGBoost. In addition to the recognition of random faults with a fault rate of 0.4, the model has been improved to varying degrees in other cases.
In addition to accuracy, this study also evaluated the performance of the models using Precision, Recall, F1-score, and mAP metrics. Table 3 and Table 4 present the Precision, Recall, F1-score, and mAP of the models trained with three different loss functions at fault rates of 0.2, 0.4, 0.6, 0.8, and 1, respectively. It can be observed that the model trained with TL outperforms the models trained with the default loss function and focal loss in terms of Precision, Recall, F1-score, and mAP, except for the case where the fault rate is 0.4. This indicates that the model trained with TL exhibits a superior performance.
By comparing trained models with the default loss functions and FL, it can be seen that the models trained with TL showed average improvements of 6.73% and 1.81% in classification accuracy, 6.80% and 1.86% in the F1-score, and 10.75% and 3.24% in mAP, respectively, across five different fault rates. The maximum improvements observed at these five fault rates were 16.41% and 5.4% in classification accuracy, 16.83% and 5.45% in the F1-score, and 28.78% and 9.87% in mAP, respectively.
The overall performance of the model is shown in Figure 6d. The average level of the three loss training models under different fault rates is compared. The TL training model has the best performance, and both Accuracy, the F1-score, and mAP have achieved the highest scores. The default loss function training model shows good improvement compared to the FL training model, which improved significantly. XGBoost is a mature algorithm, and using TL as a loss function can still make the model perform better. In order to achieve higher classification accuracy and a better performance of the model, it is recommended to use TL as a loss function to train the model.

4.2. Experiments Were Performed on the Public Dataset

4.2.1. Data Acquisition

The experiment was conducted using a publicly available gearbox dataset from Southeast University in China, which was collected from the Drivetrain Dynamics Simulator. Each file has eight channels of signal. In order to be consistent with the previous experiment, the data of channel three were selected for the experiment, that is, the vibration data of the planetary gearbox in the y direction and 350,000 consecutive data were selected, and the data were amplified to the same scale as the previous experiment, as shown in Figure 8. Similarly, seven common sensor faults were injected into the original signal in different proportions to obtain five fault rates and eight state data, including the normal state. Then, each group of data was divided into 70 samples to obtain a data set of 5 × 8 × 70 × 5000, in which 5 × 8 × 50 groups of data were used for training, and 5 × 8 × 20 groups of data were used for testing. The hyperparameters used in the training model are also consistent with the previous experiment.

4.2.2. Experimental Result

The accuracy of the model trained with the three loss functions under different fault rates is shown in Table 5. The model trained with the default loss function achieves the highest accuracy when the fault rate is 0.6 and 0.8. The model trained with FL achieved the highest accuracy when the fault rate was 0.2. The TL-trained model achieved the highest recognition accuracy at fault rates of 0.4, 0.6, and 0.8. In general, the model trained using TL had the best effect, achieving the highest recognition accuracy in the three fault rates and achieving the second highest accuracy in the absence of the highest accuracy.
To further illustrate, Figure 9a–c respectively shows the classification accuracy of the model trained with three loss functions at different fault rates. In order to better demonstrate the superiority of the proposed method, Figure 10 shows the confusion matrix of each model under different failure rates. Figure 9a shows the classification accuracy of the model trained using the default loss function for each category at five fault rates. It can be seen that with the increase in the fault rate, the overall accuracy of the model will increase, except for the recognition accuracy of the Drift category which decreases when the fault rate is 1. When the fault rate reaches 0.4, the recognition accuracy of the model for each category reaches more than 80%, and the recognition accuracy of other categories reaches 100%, except for Bias and Spike.
Figure 9b shows the recognition accuracy of each category for a model trained using FL as a loss function under five fault rates. When the fault rate of the model is 0.8, the recognition accuracy decreases significantly, which is mainly reflected in the decline of the recognition accuracy of the Drift, Spike, Bias, Erratic, and Random categories. The model performs best when the fault rate is 0.6. The recognition accuracy of the Spike category is 80%, and the recognition accuracy of other categories reaches 100%.
Figure 9c shows the recognition accuracy of each category for the model trained using TL as a loss function under five fault rates. With the increase in the fault rate, the overall recognition accuracy of the model increases, except that when the fault rate is 1, where the recognition accuracy of the Erratic category decreases. After the fault rate reached 0.4, the model had a good performance, and the overall recognition accuracy rate came to more than 85%. It can be seen that using TL to train the model can make the model perform well.
The recognition of Spike classes remains the most difficult task for XGBoost models of all classes, and the three loss-function-trained models always perform the worst on the recognition of Spike classes. The FL-trained model performed very erratically at a fault rate of 0.8, with a decline in the recognition accuracy for many categories, and performed relatively poorly except at a fault rate of 0.2. Models trained using the default loss function and TL performed relatively well, with a good recognition accuracy for each category at various fault rates.
Table 6 and Table 7 show the Precision, Recall, F1-score, and mAP of the three loss-function-trained models under five fault rates. Among the 20 comparisons, the TL-trained model achieved the highest score of 14, the default loss function and FL-trained model achieved the highest scores of 4 and 2, respectively. So, in general, training a model using TL as a loss function results in a better performance.
The overall performance of the model is shown in Figure 9d. The average level of the three loss training models under different fault rates is compared. Among them, the TL training model still has the best performance, with the highest scores in the Accuracy, F1-score, and mAP. The model trained with FL had the worst performance, and compared with the model trained with the default loss function, the effect decreased rather than increased, and the decline was serious.
Experiments were conducted on the bearing (self-measured) dataset and the gear (public) dataset to demonstrate that the proposed method performs better when processing different types of vibration data. The results indicate that the model trained using TL has better performance when dealing with two common vibration data.

5. Conclusions

Using TL as the loss function and inputting data into XGBoost for training, this paper proposed a VSFD method, targeting the common types of faults in vibration sensors. In the process of model training, it is important to prevent the loss of the model from being overwhelmed by a large number of basic negative classes, so TL is designed as a loss function to train the model. By scaling the CE, the loss of difficult samples is increased so that the model prioritizes challenging samples, resulting in an improved classification performance. The method was applied to the published gearbox vibration data set and the fault diagnosis experiment of a bearing vibration sensor on a low-speed and heavy-load test stand and compared with the default loss function and FL. According to the findings, whether testing with the public dataset or using an experimental dataset, the accuracy of the model trained with TL is outstanding, and it is better than the model using default loss and FL training in the evaluation index of the F1-score and mAP model.
First of all, this paper proposed a VSFD method based on XGBoost to identify seven common faults of vibration sensors. This method shows high accuracy, with an average accuracy of more than 90% under different fault rates. Secondly, as simple negative classes occupy most of the iterative process of the model in the training process of samples with unbalanced categories, this paper designs a new loss function TL to train the model. This will help the model focus more on difficult samples and have a higher classification accuracy and performance. Finally, the methodology has been utilized in conducting the fault diagnosis experiment of the bearing vibration sensor on a low-speed and heavy-load test stand. The results of the experiment indicate that when compared to the model trained using FL and the default loss function, the model trained using TL, the classification accuracy is improved by 16.41% and 5.4%, the F1-score is improved by 16.83% and 5.45%, and mAP is improved by 28.78% and 9.87%.

Author Contributions

Conceptualization, C.F.; Methodology, C.F.; Software, C.F.; Validation, Y.S.; Investigation, C.L.; Data curation, G.C. and S.L.; Writing—original draft, C.F.; Project administration, Y.P. All authors have read and agreed to the published version of the manuscript.

Funding

This work was funded by the National Natural Science Foundation of China (Grant Nos. 52375092 and 52275107), the Hunan Provincial Science and Technology Innovation Talent Project (Grant No. 2022RC1135), and the Hunan Provincial Natural Science Foundation of China (Grant No. 2021JJ30260).

Data Availability Statement

Data are available on request from corresponding authors.

Conflicts of Interest

The authors declare that they have no known competing financial interests or personal relationships that could have appeared to influence the work reported in this paper.

References

  1. Cartocci, N.; Napolitano, M.R.; Costante, G.; Valigi, P.; Fravolini, M.L. Aircraft robust data-driven multiple sensor fault diagnosis based on optimality criteria. Mech. Syst. Signal Process. 2022, 170, 108668. [Google Scholar] [CrossRef]
  2. Wang, W.; Geng, Y.; Sun, J.; Xu, H.; Sheng, L. Sensor fault detection and minimum detectable fault analysis for dynamic point-the-bit rotary steerable system. ISA Trans. 2022, 127, 108–119. [Google Scholar] [CrossRef]
  3. Barberree, D.A. Dynamically self-validating contact temperature sensors. In AIP Conference Proceedings; American Institute of Physics: College Park, MD, USA, 2003; Volume 684. [Google Scholar]
  4. Wang, S.W.; Chen, Y.M. Sensor validation and reconstruction for building central chilling systems based on principal component analysis. Energy Convers. Manag. 2004, 45, 673–695. [Google Scholar] [CrossRef]
  5. Willsky, A.; Jones, H. A generalized likelihood ratio approach to the detection and estimation of jumps in linear systems. IEEE Trans. Autom. Control 1976, 21, 108–112. [Google Scholar] [CrossRef]
  6. Ferdowsi, H.; Cai, J.; Jagannathan, S. Actuator and sensor fault detection and failure prediction for systems with multi-dimensional nonlinear partial differential equations. Int. J. Control Autom. 2022, 20, 789–802. [Google Scholar] [CrossRef]
  7. Ng, K.H.; Yik, F.W.H.; Lee, P.; Lee, K.K.Y.; Chan, D.C.H. Bayesian method for HVAC plant sensor fault detection and diagnosis. Energy Build. 2020, 228, 110476. [Google Scholar] [CrossRef]
  8. Yu, Q.; Dai, L.; Xiong, R.; Chen, Z.; Zhang, X.; Shen, W. Current sensor fault diagnosis method based on an improved equivalent circuit battery model. Appl. Energy 2022, 310, 118588. [Google Scholar] [CrossRef]
  9. Jana, D.; Patil, J.; Herkal, S.; Nagarajaiah, S.; Duenas-Osorio, L. CNN and Convolutional Autoencoder (CAE) based real-time sensor fault detection, localization, and correction. Mech. Syst. Signal Process. 2022, 169, 108723. [Google Scholar]
  10. Sun, R.; Shi, L.; Yang, X.; Wang, Y.; Zhao, Q. A coupling diagnosis method of sensors faults in gas turbine control system. Energy 2020, 205, 117999. [Google Scholar] [CrossRef]
  11. Gao, L.; Li, D.; Yao, L.; Gao, Y. Sensor drift fault diagnosis for chiller system using deep recurrent canonical correlation analysis and k-nearest neighbor classifier. ISA Trans. 2022, 122, 232–246. [Google Scholar] [CrossRef]
  12. Ai, S.; Song, J.; Cai, G. A real-time fault diagnosis method for hypersonic air vehicle with sensor fault based on the auto temporal convolutional network. Aerosp. Sci. Technol. 2021, 119, 107220. [Google Scholar]
  13. Xiao, L.; Zhang, L.; Yan, Z.; Li, Y.; Su, X.; Song, W. Diagnosis and distinguishment of open-switch and current sensor faults in PMSM drives using improved regularized extreme learning machine. Mech. Syst. Signal Process. 2022, 171, 108866. [Google Scholar]
  14. Niu, G.; Xiong, L.; Qin, X.; Pecht, M. Fault detection isolation and diagnosis of multi-axle speed sensors for high-speed trains. Mech. Syst. Signal Process. 2019, 131, 183–198. [Google Scholar]
  15. Elnour, M.; Meskin, N.; Al-Naemi, M. Sensor data validation and fault diagnosis using Auto-Associative Neural Network for HVAC systems. J. Build. Eng. 2020, 27, 100935. [Google Scholar]
  16. Thiyagarajan, K.; Kodagoda, S.; Ranasinghe, R.; Vitanage, D.; Iori, G. Robust sensor suite combined with predictive analytics enabled anomaly detection model for smart monitoring of concrete sewer pipe surface moisture conditions. IEEE Sens. J. 2020, 20, 8232–8243. [Google Scholar]
  17. Thiyagarajan, K.; Kodagoda, S.; Ulapane, N.; Prasad, M. A temporal forecasting driven approach using facebook’s prophet method for anomaly detection in sewer air temperature sensor system. In Proceedings of the 2020 15th IEEE Conference on Industrial Electronics and Applications (ICIEA), Kristiansand, Norway, 9–13 November 2020; pp. 25–30. [Google Scholar]
  18. Chen, T.; Guestrin, C. Xgboost: A scalable tree boosting system. In Proceedings of the 22nd Acm Sigkdd International Conference on Knowledge Discovery and data Mining, San Francisco, CA, USA, 13–17 August 2016; pp. 785–794. [Google Scholar]
  19. Song, K.; Yan, F.; Ding, T.; Gao, L.; Lu, S. A steel property optimization model based on the XGBoost algorithm and improved PSO. Comput. Mater. Sci. 2020, 174, 109472. [Google Scholar]
  20. Jiang, Y.; Tong, G.; Yin, H.; Xiong, N. A pedestrian detection method based on genetic algorithm for optimize XGBoost training parameters. IEEE Access 2019, 7, 118310–118321. [Google Scholar]
  21. Osman, A.I.A.; Ahmed, A.N.; Chow, M.F.; Huang, Y.F.; El-Shafie, A. Extreme gradient boosting (Xgboost) model to predict the groundwater levels in Selangor Malaysia. Ain Shams Eng. J. 2021, 12, 1545–1556. [Google Scholar] [CrossRef]
  22. Qiu, Y.; Zhou, J.; Khandelwal, M.; Yang, H.; Yang, P.; Li, C. Performance evaluation of hybrid WOA-XGBoost, GWO-XGBoost and BO-XGBoost models to predict blast-induced ground vibration. Eng. Comput. 2021, 38, 4145–4162. [Google Scholar]
  23. Lin, T.Y.; Goyal, P.; Girshick, R.; He, K.; Dollár, P. Focal Loss for Dense Object Detection. In Proceedings of the IEEE International Conference on Computer Vision (ICCV), Venice, Italy, 22–29 October 2017; pp. 2999–3007. [Google Scholar]
  24. Wang, C.; Deng, C.; Wang, S. Imbalance-XGBoost: Leveraging weighted and focal losses for binary label-imbalanced classification with XGBoost. Pattern Recogn. Lett. 2020, 136, 190–197. [Google Scholar]
  25. Cui, Y.; Jia, M.; Lin, T.Y.; Song, Y.; Belongie, S. Class-balanced loss based on effective number of samples. In Proceedings of the IEEE/CVF Conference on Computer Vision and Pattern Recognition, Long Beach, CA, USA, 15–20 June 2019; pp. 9268–9277. [Google Scholar]
  26. Huang, C.; Li, Y.; Loy, C.C.; Tang, X. Learning deep representation for imbalanced classification. In Proceedings of the IEEE Conference on Computer Vision and Pattern Recognition, Las Vegas, NV, USA, 27–30 June 2016; pp. 5375–5384. [Google Scholar]
  27. Ridnik, T.; Ben-Baruch, E.; Zamir, N.; Noy, A.; Friedman, I.; Protter, M.; Zelnik-Manor, L. Asymmetric loss for multi-label classification. In Proceedings of the IEEE/CVF International Conference on Computer Vision, Montreal, BC, Canada, 11–17 October 2021; pp. 82–91. [Google Scholar]
  28. Saeed, U.; Jan, S.U.; Lee, Y.D.; Koo, I. Fault diagnosis based on extremely randomized trees in wireless sensor networks. Reliab. Eng. Syst. Saf. 2021, 205, 107284. [Google Scholar]
Figure 1. Sample plots of faulty and normal signals, (a) sample plots of bias fault, (b) sample plots of drift fault, (c) sample plots of spike fault, (d) sample plots of erratic fault, (e) sample plots of stuck fault, (f) sample plots of data-loss fault, and (g) sample plots of random fault.
Electronics 12 04442 g001
Figure 2. Triage loss at different values of γ .
Electronics 12 04442 g002
Figure 3. Proposed system model for vibration diagnosis.
Electronics 12 04442 g003
Figure 4. Low-speed and heavy-load test stand.
Electronics 12 04442 g004
Figure 5. Original signal.
Electronics 12 04442 g005
Figure 6. (a) The accuracy of the model trained with the default loss function for varying fault rates across various categories; (b) The accuracy of the model trained with FL for varying fault rates across various categories; (c) The accuracy of the model trained with TL for varying fault rates across various categories; (d) Overall performance of three loss-training models.
Electronics 12 04442 g006aElectronics 12 04442 g006b
Figure 7. The confusion matrix of models trained with three loss functions under five different failure rates. (ac) Corresponding to the confusion matrix of models trained with default loss function, FL, and TL at a fault rate of 0.2, respectively. (df) Corresponding to the confusion matrix of models trained with default loss function, FL, and TL at a fault rate of 0.4, respectively. (gi) Corresponding to the confusion matrix of models trained with default loss function, FL, and TL at a fault rate of 0.6, respectively. (jl) Corresponding to the confusion matrix of models trained with default loss function, FL, and TL at a fault rate of 0.8, respectively. (mo) Corresponding to the confusion matrix of models trained with default loss function, FL, and TL at a fault rate of 1, respectively.
Electronics 12 04442 g007aElectronics 12 04442 g007b
Figure 8. Vibration data of the planetary gearbox in the Y direction.
Electronics 12 04442 g008
Figure 9. (a) The accuracy of the model trained with the default loss function for varying fault rates across various categories; (b) The accuracy of the model trained with FL for varying fault rates across various categories; (c) The accuracy of the model trained with TL for varying fault rates across various categories; (d) Overall performance of three loss-training models.
Electronics 12 04442 g009
Figure 10. The confusion matrix of models trained with three loss functions under five different failure rates. (ac) Corresponding to the confusion matrix of models trained with default loss function, FL, and TL at a fault rate of 0.2, respectively. (df) Corresponding to the confusion matrix of models trained with default loss function, FL, and TL at a fault rate of 0.4, respectively. (g–i) Corresponding to the confusion matrix of models trained with default loss function, FL, and TL at a fault rate of 0.6, respectively. (jl) Corresponding to the confusion matrix of models trained with default loss function, FL, and TL at a fault rate of 0.8, respectively. (mo) Corresponding to the confusion matrix of models trained with default loss function, FL, and TL at a fault rate of 1, respectively.
Electronics 12 04442 g010aElectronics 12 04442 g010b
Table 1. The parameters for training the models with three different loss functions.
Loss FunctionParameters
Triage Loss α = 0.1 , γ = 1 , e t a = 0.1 , m a x _ d e p t h = 4 , n u m _ b o o t _ r o u n d = 800
Softmax e t a = 0.1 , m a x _ d e p t h = 4 , n u m _ b o o t _ r o u n d = 800
Focal Loss α t = 0.25 , γ = 2 , e t a = 0.1 , m a x _ d e p t h = 4 , n u m _ b o o t _ r o u n d = 800
Table 2. Accuracy of models trained with different loss functions under different fault rates.
Loss FunctionFault Rates
0.20.40.60.81
Softmax69.3759092.596.87598.75
Focal Loss63.2786.2583.759598.125
Triage Loss73.12586.87597.598.7599.375
Table 3. Precision and Recall of classifiers at different fault rates.
Loss FunctionFault Rates
0.20.40.60.81
PrecisionRecallPrecisionRecallPrecisionRecallPrecisionRecallPrecisionRecall
Softmax0.69380.72750.90.910.9250.92630.96880.96750.98750.9875
Focal loss0.63750.65750.86250.86250.83750.84130.950.9550.98130.9813
Triage Loss0.73130.77750.86880.8850.9750.97380.98750.98750.99380.9938
Table 4. F1-score and mAP of classifiers at different fault rates.
Loss FunctionFault Rates
0.20.40.60.81
F1-ScoremAPF1-ScoremAPF1-ScoremAPF1-ScoremAPF1-ScoremAP
Softmax0.68650.54610.90070.83220.92420.86920.96860.94420.98750.9772
Focal loss0.63620.49330.85850.76990.83420.74160.95110.91570.98110.9657
Triage Loss0.72960.59740.86580.78560.97460.9550.98730.97720.99370.9886
Table 5. Accuracy of models trained with different loss functions under different fault rates.
Loss FunctionFault Rates
0.20.40.60.81
Softmax0.80.956250.98750.993750.975
Focal Loss0.818750.906250.981250.91250.94375
Triage Loss0.806250.9750.981250.993750.9875
Table 6. Precision and Recall of classifiers at different fault rates.
Loss FunctionFault Rates
0.20.40.60.81
PrecisionRecallPrecisionRecallPrecisionRecallPrecisionRecallPrecisionRecall
Softmax0.80.81880.95630.96130.98750.98880.99380.99380.9750.9763
Focal loss0.81880.82630.90630.91880.98130.98380.91250.92250.94380.9488
Triage Loss0.80630.84880.9750.97630.98130.98250.99380.99380.98750.9875
Table 7. F1-score and mAP of classifiers at different fault rates.
Loss FunctionFault Rates
0.20.40.60.81
F1-ScoremAPF1-ScoremAPF1-ScoremAPF1-ScoremAPF1-ScoremAP
Softmax0.79670.69120.95550.92320.98750.97770.99370.98860.97460.9549
Focal loss0.80820.7150.89020.83820.98110.96730.91050.8510.94130.9007
Triage Loss0.81090.7040.97460.95490.98090.96630.99370.98860.98750.9772
Disclaimer/Publisher’s Note: The statements, opinions and data contained in all publications are solely those of the individual author(s) and contributor(s) and not of MDPI and/or the editor(s). MDPI and/or the editor(s) disclaim responsibility for any injury to people or property resulting from any ideas, methods, instructions or products referred to in the content.

