1. Introduction
Virtual reality (VR) is a technological framework that relies on 3D models presented to users via digital displays with the goal of simulating physical 3D environments, whether real or imagined. The field of VR has had a long history, marked by periods of excitement and disappointment in a way very similar to the progress of artificial intelligence. Possible reasons for this are varied and their relative significance is not universally agreed upon; however, it has recently been suggested that a combination of lack of sufficient performance of headsets and limited variety of applications are the most significant barrier to widespread adoption of VR today [
1].
Nevertheless, the VR market has seen significant growth in the recent decade, and is projected to become a 70 Bn USD industry by 2024 [
2]. Gradually, a growing number of players are recognizing the practical utility of VR in addition to its entertainment value. Indeed, although the pioneers of VR immediately recognized the technology as a foundation for a new infocommunications platform [
3], the technology has for a long time been considered as primarily being suited to gaming and entertainment, and in the professional domains to simulation and training. In a more practical sense, only recently has VR become poised to enter the vertical markets of basic and higher education [
4,
5,
6], healthcare [
7,
8,
9,
10], engineering and many other professional industries [
11,
12,
13,
14,
15].
From an academic perspective, study after study has now shown the practical utility of VR. Interestingly, many researchers have adopted a less technology-centered approach, in an attempt to distill the essence of VR as a 3D environment that is not necessarily presented to users on a head-mounted display, but may equally be displayed in more classical, desktop or mobile environments. In particular, as noted by Robertson et al. [
16], immersion, when defined as a state of absorption or deep involvement, does not really require a display that blocks the user’s whole field of view, and can be triggered with suitable cues even in the case of a desktop environment. In Csapo et.al., it has been suggested that—by virtue of its using 3D representations and spatial relationships to convey semantic meaning—even desktop 3D environments can provide highly effective cues that promote a more active kind of memory formation at multiple conceptual levels [
17].
In more application-specific works, researchers have shown specifically that desktop 3D environments can be highly effective in a variety of education and training scenarios [
18,
19,
20,
21,
22,
23]. Still, the question of whether immersive and non-immersive 3D applications can be used to the same benefit is a topic of debate and seems to depend on several (perhaps even some as yet unknown) factors. Granted, the relative availability and lower cost of desktop environments is a key factor in favor of such systems. In addition, how well user capabilities and perceptions can match expectations seems to be a factor that can tip the scale towards desktop VR solutions, in a way reminiscent of the uncanny valley effect in robotics. For example, Srivastava et al. have shown that the relative lack of sensory conflicts in desktop environments as opposed to locomotion-restricted HMDs (i.e., when the user is physically in a stationary position while interacting with the HMD), as well as the lack of idiothetic (e.g., vestibular, proprioceptive) cues in both cases can lead to better user performance in desktop 3D environments in specific tasks [
24]. On the other hand, immersive HMD based VR environments have been shown to be more effective than their desktop-based counterparts in some cases—for example, when there is no locomotion, but only changes in orientation of viewpoint involved [
25].
Based on the above, a better understanding of the constraints under which desktop 3D environments can bring about the most significant benefits is still an area worthy of research. In this research, we are interested in particular in the benefits of using Desktop 3D environments as opposed to more classical, 2D web-based interfaces, in terms of improved effectiveness and less cognitive load. Our goal is to investigate this issue in the context of a learning task, and to see whether changes in effectiveness as well as cognitive load experienced can be correlated with new kinds of high-level interaction patterns that may emerge in 3D. To this end, following a brief overview of recent developments in understanding the difference between 2D and Desktop 3D environments in terms of cognitive capabilities, we describe the results of an experiment in which we compared a 2D web-based versus a desktop 3D learning scenario in terms of performance, self-reported cognitive load, pupil dilation measurements and presence of unique interaction patterns in 3D that are unavailable to users on 2D interfaces.
The remainder of the paper is structured as follows. In
Section 2, we provide a brief survey of recent research works focusing on capability improvements associated with the use of desktop 3D versus 2D interfaces across a variety of tasks. In
Section 3, we describe our experiment and results obtained in terms of pupil dilation measures and analysis of interaction patterns. Finally, a short discussion of these results, along with caveats, limitations of the study, and proposed future work is provided in
Section 4.
2. Capability Improvements in Desktop 3D Environments versus 2D
Visualization, simulation, and 3D graphical rendering are in some sense related (and interrelated) communication tools that can be employed to provide a deeper understanding of some subject matter. At a conceptual level, the precise benefits of using these tools can be hard to appreciate; nevertheless, with time they often empirically become clear. For example, in an industrial application, it may be the case that useful feedback information and alerts could still be provided to the relevant stakeholders, even without a digital twin; yet, the ability to navigate a manufacturing environment based on spatial relationships true to its real physical layout, and the ability to localize information, including alerts within such a topologically valid representation can make a big difference in terms of lowering cognitive load and increasing the speed of decision making. As highlighted by Power et al., access to realistic simulations can reasonably be expected to have a beneficial impact on decision makers’ perception and understanding, whereas more simplified simulations, being as they are simplifications of a complex situation, can introduce biases [
26].
In a convincing example of the benefits of visualization and simulation, Pfeil et al. describe several applications in a car part manufacturing company (Visteon) that rely on a model/simulation based decision-support system (DSS) with the aim of increasing productivity [
27]. In one instance, a simulator-based training scenario was developed, for productivity training purposes, in which employees could modify parameters associated with the number of production days, preventive maintenance staffing/schedules; and then simulate the resulting machine uptime, cycle time and scrap rate based on those parameters. In a second instance, the actual parameters of the production line, along with productivity metrics were measured for longer periods of time, and proposed updates were simulated using the previously developed simulator. By incrementally modifying (improving) the model within the simulator, to better match real-life data, and by performing what-if simulations, the company was able to achieve a 30% increase in productivity.
The surprising conclusion of studies such as the one carried out at Visteon is that even though the levers through which modifications can be effected in a system (such as production and maintenance schedules) are seemingly not very complex, and even though the visualization aspects of the simulation were not particularly realistic, the end result of optimization can still be non-obvious and can provide significant improvements.
More recently, in part based on earlier successes such as the one at Visteon, researchers have turned towards the use of 3D virtual environments, as opposed to 2D simulations with spatial aspects. Several authors have highlighted that virtual worlds have a unique potential to foster creativity in a way that the traditional Web cannot [
28,
29,
30].
O Riordan et al. observe that in a 3D environment such as Second Life, the ability to explore locations of interest while communicating with others and also having access to the Web by switching to a different browser tab all serve to speed up the process of obtaining information and facilitate the making of connections between otherwise distant sources of experience [
29]. In a similar vein, Alahuhta et al. reach the conclusion that the combined effects of avatars, changes in users’ frame of reference, feeling of co-presence, immersion, facilitated communication, and the availability of tools for collaboration in 3D environments leads to a significant improvement in creativity [
30].
Aside from fostering creativity, as virtual reality has moved closer to commercial viability, various other aspects of the technology have also come under closer investigation—including business potential, entertainment value, deep tech/engineering issues as well as (most importantly for our current topic) the influence of VR on cognitive capabilities. In this regard, the key question is what humans can accomplish through the use of spatial technologies as opposed to without them. Can they achieve the same goals faster? How do differences in individual cognitive capabilities translate to differences in performance gains achieved by users? What subjective mental states do users experience while using VR, and what psychological models are best suitable for explaining their behaviors, both individual and social? These are just some of the questions that are of interest.
Hence, it is worth considering the benefits that even desktop 3D environments, as compared to traditional 2D interfaces, can bring to the forefront from various aspects. In what follows, we summarize recent results that are relevant from the perspective of cognitive burden, memorization/recall, digital guidance (i.e., understanding workflows), and content management.
2.1. Reducing Cognitive Burden through Virtual Reality
In an experiment conducted by Lampert et al. [
23], a group of test subjects were tasked with carrying out a specific workflow in the shortest possible time on different platforms. In order to control for differences in test subjects’ background knowledge, a simple task was chosen, in which the goal was to count the number of dogs versus cats on a large set of images, pdfs and videos. In total, 379 test subjects were involved in the experiment, and had to carry out the task in 3 different scenarios: when the files containing the images were shared as e-mail attachments, when the files were shared via an e-learning platform called Moodle, and when the files were shared within a 3D VR space. The conclusion of the study was that users were able to complete the task at least 50% faster in the VR space than on the two competing platforms. One additional result in the paper by Lampert et al. was that they also proposed a qualitative framework (based on numeric degrees) with which to characterize the complexity of workflows. One can conceptualize a workflow as a control flow graph similar to the way algorithms are formally described, and the characteristics of different kinds of loops within the graph can be associated with the complexity of the workflow [
23].
In a follow-up study, Horváth and Sudár proposed a quantitative framework for better understanding the complexity of different user operations, which also helped explain the results obtained by Lampert and colleagues from a different angle [
31]. Among others, they proposed to distinguish between elementary operations (or machine operations) and complex operations. Elementary operations can be thought of as a single interaction, such as hitting a key, or clicking once or twice on an icon, directed at a specific functionality. Complex operations, in contrast, are a sequence of at most 3 elementary operations, such as copying and pasting text, or dragging and dropping an item from one folder to another. By analyzing the workflow that formed the basis of the experiment in the paper by Lampert and colleagues, Horváth and Sudár showed that the task carried out in 3D inherently required significantly less operations, both in terms of elementary and complex operations. This provides theoretically more grounded evidence that the content organization afforded by virtual spaces is qualitatively different from—and superior to—more traditional ways of organizing content.
In another follow-up study, Horváth systematically compared the effectiveness of the use of a well-known project management software, Trello, on Windows versus the MaxWhere 3D environment [
32]. For this analysis, Horváth used the same Elementary versus Complex operations metrics devised in the previous study. The results showed that in 3D, users had to carry out 72% less elementary user operations, and spent 80% less time on overview-related tasks, that is, tasks related to context switching between views and tabs. In the paper, Horváth also introduced the concept of monitoring density, which is a metric that characterizes the number of information elements that can be seen and comprehended at the same time. Here, information element refers to any digital unit that needs to be considered and understood separately in the context of a workflow. Using quantitative arguments, Horváth showed that this metric can be hugely increased in 3D, given that a large number of different frames, graphs, charts, forms and other units can be displayed simultaneously in a 3D space.
2.2. Supporting Improved Recall through Virtual Reality
In a separate set of experiments, Berki showed how 3D can be more effective than 2D in forming strong memories [
33,
34]. In a first experiment, Berki showed that the same content displayed as a separate entity in 3D can be more memorable than the same content embedded in displays that primarily show some other content [
33]. In this experiment, Berki placed the same advertisement on a separate billboard in one case, and on four different banners integrated inside articles displayed on four display panels in the other. Users were asked to read the articles carefully, and the result was that the 3D navigation inside the space induced a more active recollection of the features of the advertisement when it was featured as a separate entity.
In a second study, Berki performed an experiment where test subjects were asked to carry out mental arithmetic tasks, either in a 3D space or in a classical 2D web browser [
34]. In both cases, users’ performance metrics were presented to the users, either in a separate display in 3D, or on a separate tab in the browser. Further, the test subjects had to enter the results of their calculations on a third panel. This encouraged navigation both in 3D and among the browser tabs. At the end of the experiment, subjects were asked to gauge their performance and to indicate the foundation upon which they based their estimate. The finding was that even among those subjects who indicated the real-time performance metric display as the basis for their estimation, subjects who carried out the task in 3D gave estimates that were closer to reality. This suggests, in a way similar to the previous experiment, that navigation in 3D triggers stronger contextual awareness and more effective recall, at least in the short term. This study also brings to mind a similar observation made by Horváth, in an experiment where students had to fill out a questionnaire based on learning materials in a 3D space [
35]. In the study, students who were made to turn 180 degrees inside the 3D space to access the learning materials associated this interaction with more effort, and therefore tried to find the answer to multiple questions at once, committing them to short-term memory instead of turning back and forth.
To be clear, recall in 3D spaces can depend on many factors, as highlighted in a recent study by Krokos et al. [
25]. In the study, the authors refer to several earlier works, which point to the benefits of using computer-generated 3D spaces as opposed to list-like presentations together with mental models in memory recall tasks (e.g., [
36,
37]), as well as to the conclusion that in general, increased immersion (measured in terms of visual field and field of regard) leads to better recall performance [
38]. In the same study, Krokos et al. report on a further experiment, in which they compare users’ ability to recall a list of images of human faces, together with their locations in 3D, in a desktop 3D versus an immersive HMD based environment. The results of the experiment show that users of the immersive environment were able to achieve significantly higher performance on the recall tasks, although the recall accuracy of the desktop case was still nominally quite high. Additionally, the authors remark that the experiment involved only rotations—and no translations—of camera view, and also used pre-defined spaces (without users having the opportunity to configure them on their own), both of which are factors that could further influence recall accuracy. This, along with the aforementioned studies, suggests that although the benefits of 3D environments in terms of recall performance are real, a lot can depend not only on the medium of communication used, but also on a variety of other particulars in the way in which a given application is designed.
2.3. Improved Digital Guidance in Virtual Reality
When it comes to spatial navigation, Sudár et al. investigated whether or not it was possible to identify certain ‘hotspots’ in different 3D spaces—that is, locations and orientations in terms of viewpoint that were favored by users [
39]. By recording navigation data as test subjects were carrying out a specific task, they found that indeed, a select few poses were much more popular than others—and that mostly, this depended on the arrangement of 2D displays within the spaces. Based on this, they proposed a Markov Chain Monte Carlo based method to generate partitions of display panels, based on which guided tours—i.e., sequences of useful viewpoints in the 3D space—could be generated automatically [
40].
2.4. Content Management Improvements in Virtual Reality
Despite the advantages of 3D spaces, Setti et al. have argued that a key obstacle in terms of integrating 2D content into 3D spaces is that users cannot change the existing 2D layouts (comfortably or at all), thus their thinking is forced into the constraints of the currently existing layouts, leading to reduced effectiveness and ease of use [
41]. However, it is also clear that no single layout is suitable for all tasks. This is related to the suggestion from Krokos et al. that the ability to reconfigure spaces could have an impact on user performance [
25].
Needless to say, editing and reconfiguation in 3D is far from a trivial task. According to Setti et al., it is generally not a trivial question how the camera (the viewpoint of the user into the space) should interact with the operations used to transform the displays [
41]. If a display is being moved towards a wall or some other object, and the camera is in a stationary location, it will become difficult to determine when the display has reached a particular distance from the wall/object, and during rotation of the display, to determine whether the angle between the display panel and the wall/object is as desired. However, if the camera viewpoint is modified automatically in parallel with the display panel manipulations, users will be unable to re-position themselves with respect to the objects and display panels of interest as freely as if the camera viewpoint is independent of the manipulations. This is a key dilemma, which is referred to as the “
camera-object independence dilemma”.
To resolve this and other challenges, Setti et al. proposed a set of operations—aiming at both comprehensiveness and minimality—that primarily involve either the duplication of existing displays, or the snapping of new displays onto existing surfaces, followed by fine-tuning operations such as translation of displays on their own plane, or modification of size and aspect ratio. Test subjects were able to use these operations to re-create existing layouts in empty versions of the same spaces at a high accuracy in less than 45 s per display.
Based on this editing methodology, Setti et al. proposed a general design paradigm referred to as “
doing when seeing” [
42]. This means that an operation is best carried out in the context of, and in relation to, already existing elements inside the virtual space. For example, if there is a wall, or an existing 2D display, then a new 2D display can be created by snapping it to the wall, or by duplicating the existing display. Doing when seeing also entails that in general, no other operation is necessary (other than some local, fine-tuning operations relevant to the object itself, and independent of its relationship to other objects).
The “
doing when seeing” paradigm can also be applied to 3D objects or higher-level configurations such as existing content groups/layouts. By attributing metadata and content to layouts, it is possible to create a ‘
3D file system’, which extends the ‘doing when seeing’ paradigm to the duplication of existing projects [
42]. This idea can be further extended to the problem of searching for content or projects, in that search terms that are entered and subsequent interactions can be linked together, thereby bootstrapping a search functionality that looks and feels like a semantic search functionality but really just links together search entries with behaviors close in time [
43].
Based on such capabilities, 3D environments can provide a flexible interface for organizing multiple content types in a spatial arrangement, based on semantic relations (spatial proximity) and relations of relative importance (spatial size).
3. Investigating Descriptive Markers of Cognitive Capablities in Desktop VR
In order to better understand differences in user behaviors in 2D and desktop 3D environments, we developed an experiment in which test subjects were asked to study a set of materials on specific topics within the field of astronomy, and to then fill out a set of questionnaires based on the content, in either 2D or 3D.
3.1. Experimental Design
In the 2D case, we used a classical Google Sites page (
https://sites.google.com/view/2deyetracking-egyoldalas/f%C5%91oldal, accessed on 29 November 2022), loaded into a Chrome Browser, which included all of the learning materials serially embedded into it, interleaved with the questionnaires (also in the form of embedded Google Forms within the Google Sites page). Here, the documents pertaining to each of the four topics and the associated questionnaire were embedded strictly in order; hence, users could study 3 documents—PDF files, images or YouTube videos—and then fill out the associated questionnaire for each of the topics, before proceeding to the next topic.
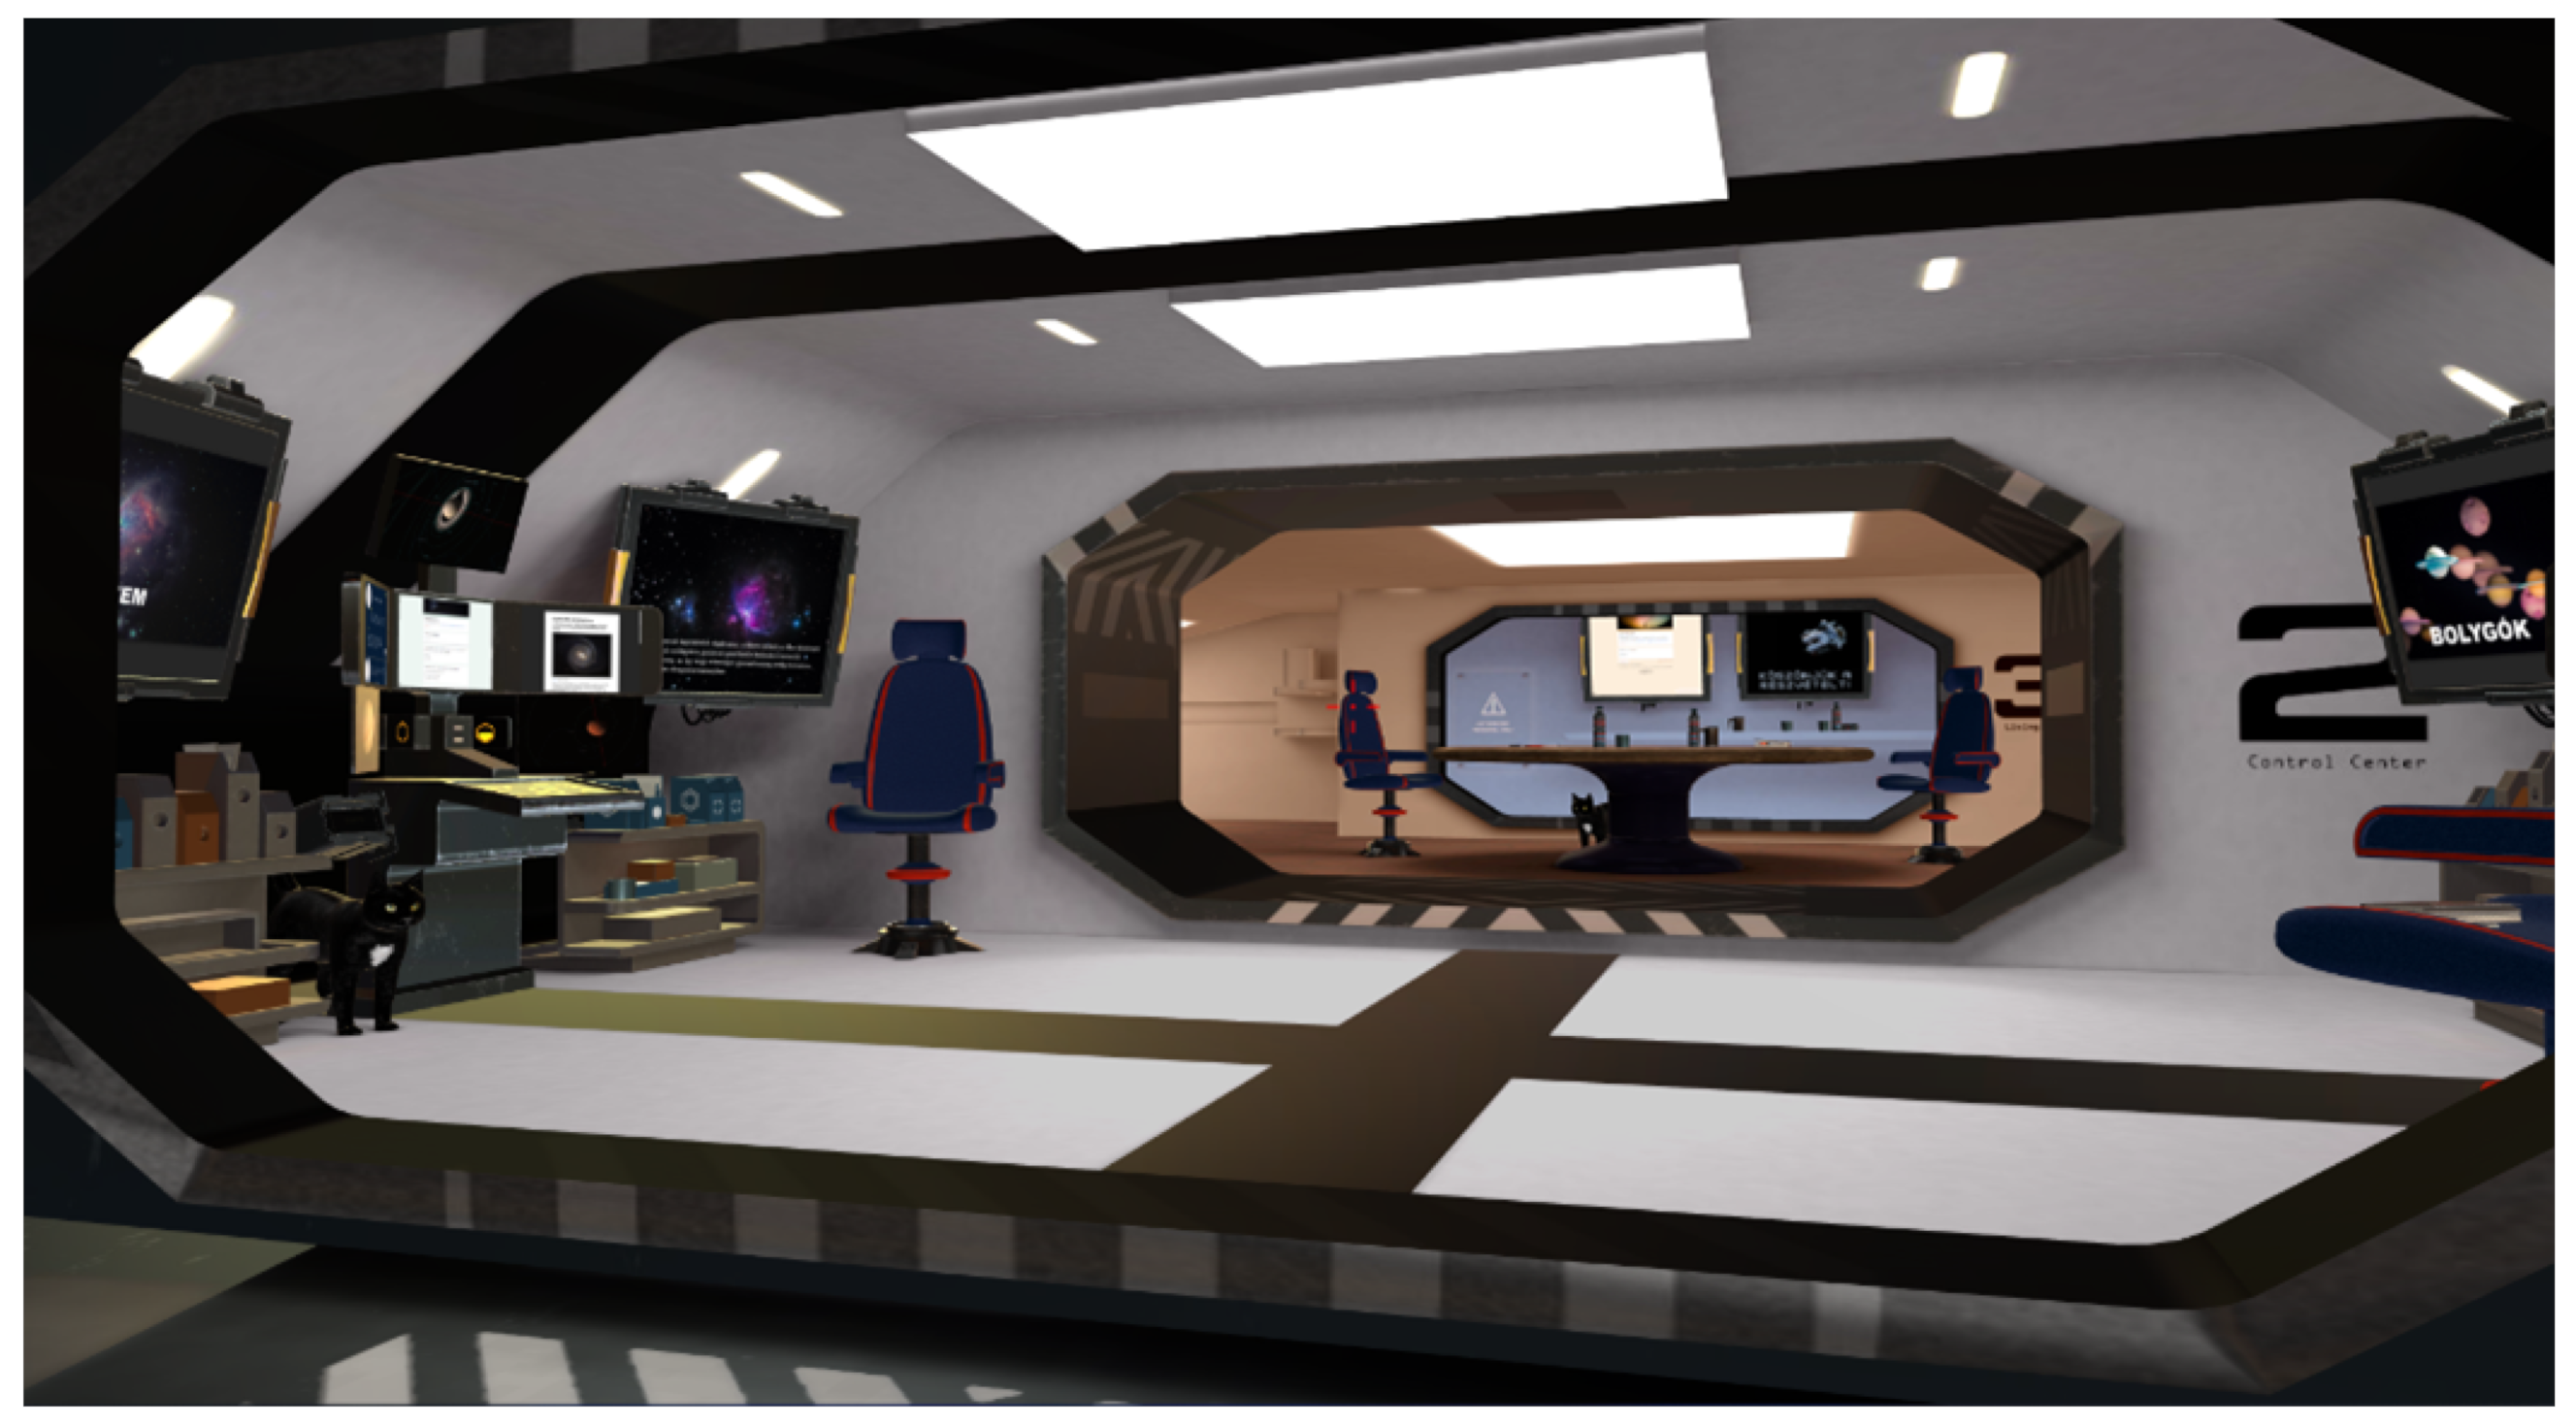
In the 3D case, we used the MaxWhere VR platform, which has the ability to embed URLs into so-called display panels and to render those in specific locations, orientations and sizes within the 3D space (see
Figure 1 and
Figure 2) (
https://www.maxwhere.com, accessed on 29 November 2022). It is important to note that the exact same documents and questionnaires which appeared embedded into the Google Sites page in the 2D case were presented to users in the 3D case, with no additional content in either case. The only difference was that the content appeared serially, from top to bottom in the 2D case, whereas it was presented in a spatial layout in the 3D case (
Figure 3).
As the tasks were being carried out and following the submission of the questionnaires, we recorded the following statistics:
Objective performance metrics (i.e., number of correct answers, time spent answering questions) on the questionnaires;
Subjective assessment from test subjects regarding the difficulty of each of the questionnaires;
Pupil dilation measurements using eye-tracking technology;
Interaction analytics consisting of tagged videos, with markers for specific patterns exhibited by users in 3D, as follows:
- -
viewing content on a group of display panels simultaneously from some distance (holistic overview mode);
- -
zooming in to a specific content/display panel to the exclusion of others (zoom-in mode);
- -
exclusively focusing on a questionnaire (questionnaire focus);
- -
alternating focus between a questionnaire and display panels showing content relevant to the questions it includes (alternating mode);
- -
navigating in 3D space (3D navigation mode)
The goal was to see whether certain behavioral patterns that can be expected to arise in real-life settings could also be observed in appropriately designed virtual environments. For example, the hypothesis was that the need for a holistic overview among different content elements, in much the same way as someone would lay out a set of books, documents and notes on a physical desk, can be more readily accommodated in a 3D environment, but much less so in 2D. If such behaviors in the 3D environment arise during the experiment and are accompanied by better performance and/or reduced cognitive load, they can be seen as interaction patterns, or descriptive markers of higher effectiveness and/or reduced cognitive load.
3.2. Key Hypotheses
Prior to conducting our experiment, we formulated the following key hypotheses:
Questionnaires would generally be filled out faster and with more correct answers in 3D compared to 2D;
Subjective assessments, by the test subjects, of difficulty of questionnaires would correlate with pupil dilation and correctness of answers;
Subjective assessments of lower cognitive load, along with lower pupil dilation would characterize the 3D case as opposed to the 2D case
In the 3D case, those users who employed the holistic overview mode to a larger extent than others would perform better at less cognitive load
3.3. Materials and Methods
For this experiment, we used a set of articles, presentations and videos on the four topics of the “
Universe”, “
Planets”, “
Satellites” and “
Space Research”, as described earlier in
Section 3.1.
In the 2D case, the above materials were presented to users as a sequence of embedded content on a Google Sites page. Interleaved between the content pertaining to the different topics, users found the questionnaires (also embedded in the form of a Google Forms page) that they were asked to fill out based on the content. Both the content and the questionnaires were written in Hungarian, which was the native tongue of all test subjects. The questionnaires consisted of true-or-false questions, multiple choice questions and questions requiring short answers of one or two words. Two examples are:
True or false?—Black holes can be observed based on the gravitational effects they have on surrounding gases, dust and stars;
What are the rings of Saturn made of (select all that apply)?—ice, rocks, space debris, gases, asteroids, and/or moons.
In the Desktop 3D case, a MaxWhere VR space titled “
Measurement on the Spaceship” was used to lay out the above described materials along with the questionnaires (
Figure 1). Inside the space, 25 display panels were placed in six well-separated blocks (including an informed consent form, the four topics, and a post-test questionnaire). Here, instead of viewing each of the materials in sequence, subjects had to navigate from one block to the next; and within each block, they had to either position themselves (i.e., the camera view) in a pose from which all materials and the questionnaire at hand were simultaneously visible (holistic overview mode), or zoom in to each of the display panels separately to study the material and/or answer the questions (zoom-in mode).
It is important to note that in both the 2D and 3D cases, the same study materials, and the same questionnaires were used. The only difference was that in the 3D case, the Google Forms pages and the study materials were laid out on display panels in six different spatial locations for each of the four topics; whereas in the 2D case, they appeared in a single browser window (
Figure 3).
3.4. Subjects and Preliminaries
A total of 14 test subjects participated in the virtual 3D space measurement, but video data were corrupted for one person. The results from a further four subjects had to be discarded due to there being breaks in pupil dilation measurements midway during the experiment. The remaining nine subjects (three women, six men) were aged between 17–55 years, with a mean age of 32.5 years (SD: 14.15).
A total of seven test subjects (four women, three men) participated in the 2D measurement, and were aged between 25–33 years, with a mean age of 27.83 (SD: 2.93).
The mean age for all participants was 30.84 (11.39) years. All participants were neurotypical Hungarian native speakers who participated in the experiment on a voluntary basis. Informed consent was obtained from all participants prior to the experiment, which was carried out based on and in accordance with the institutional endorsement of the authors’ affiliation. All of the data collected during the experiment was anonymized and used exclusively as input to the statistical analyses detailed in later parts of this paper.
3.5. Procedure
At the start of the session, test subjects carrying out the required task in 3D indicated whether they were familiar with the MaxWhere software and, if so, approximately how much time they had spent using the software. Participants who were not familiar with the software spent approximately 30 min learning about it and acquiring basic user skills. Basic knowledge includes confident navigation in the software, activating and deactivating the display panels and interacting with the content that is displayed on them. Mastery of confident use of the software was assessed by the test administrators.
At the start of the main part of the experiment, the participants took their seats in a calm, quiet room in front of a table on which a laptop capable of running the software and the eye-tracker were placed. The room was dimly lit with no direct, but only ambient light sources, to ensure suitable conditions for the eye tracker device. The initial step was the calibration of the eye-tracker, during which the task was to follow a point appearing on the screen. In both the 2D and 3D cases, the calibration had to be carried out until the test person successfully completed it, thus the eye-tracker was able to monitor and analyze the gaze on the entire screen.
After the calibration was completed successfully, the participants either opened the virtual space containing the tasks (3D case) or opened the 2D web page with all the study materials, interleaved with the embedded Google Forms questionnaires in a web browser (2D case). The test administrator explained the task to be carried out: participants had to study all of the materials (either in each block of the 3D space, or on the 2D web page), and fill out the questionnaires alongside the materials. The order in which the questionnaires were filled out, with the selection of the first and the last questionnaire, was left up to the participants. The prior knowledge of the participants about astronomy was not captured before the study.
Participants sat relatively still during the measurement and tried to limit head movements so that the eye-tracking device could record the data as accurately as possible. The whole experiment (including spoken instructions, learning materials and questionnaires) was conducted in Hungarian.
In a final questionnaire following the experiment, the subjects were asked for demographic data, questions about their digital leisure habits, and questions about subjective assessments about and sense of immersion in the virtual space (in the 3D case). Subjects were also asked to rate the difficulty of the blocks of topics. For those who completed the tests on the two-dimensional interface, the final questionnaire did not include questions on 3D space.
3.6. Results
In this section, we provide an analysis on the recorded data from various angles.
3.6.1. Correctness of Answers
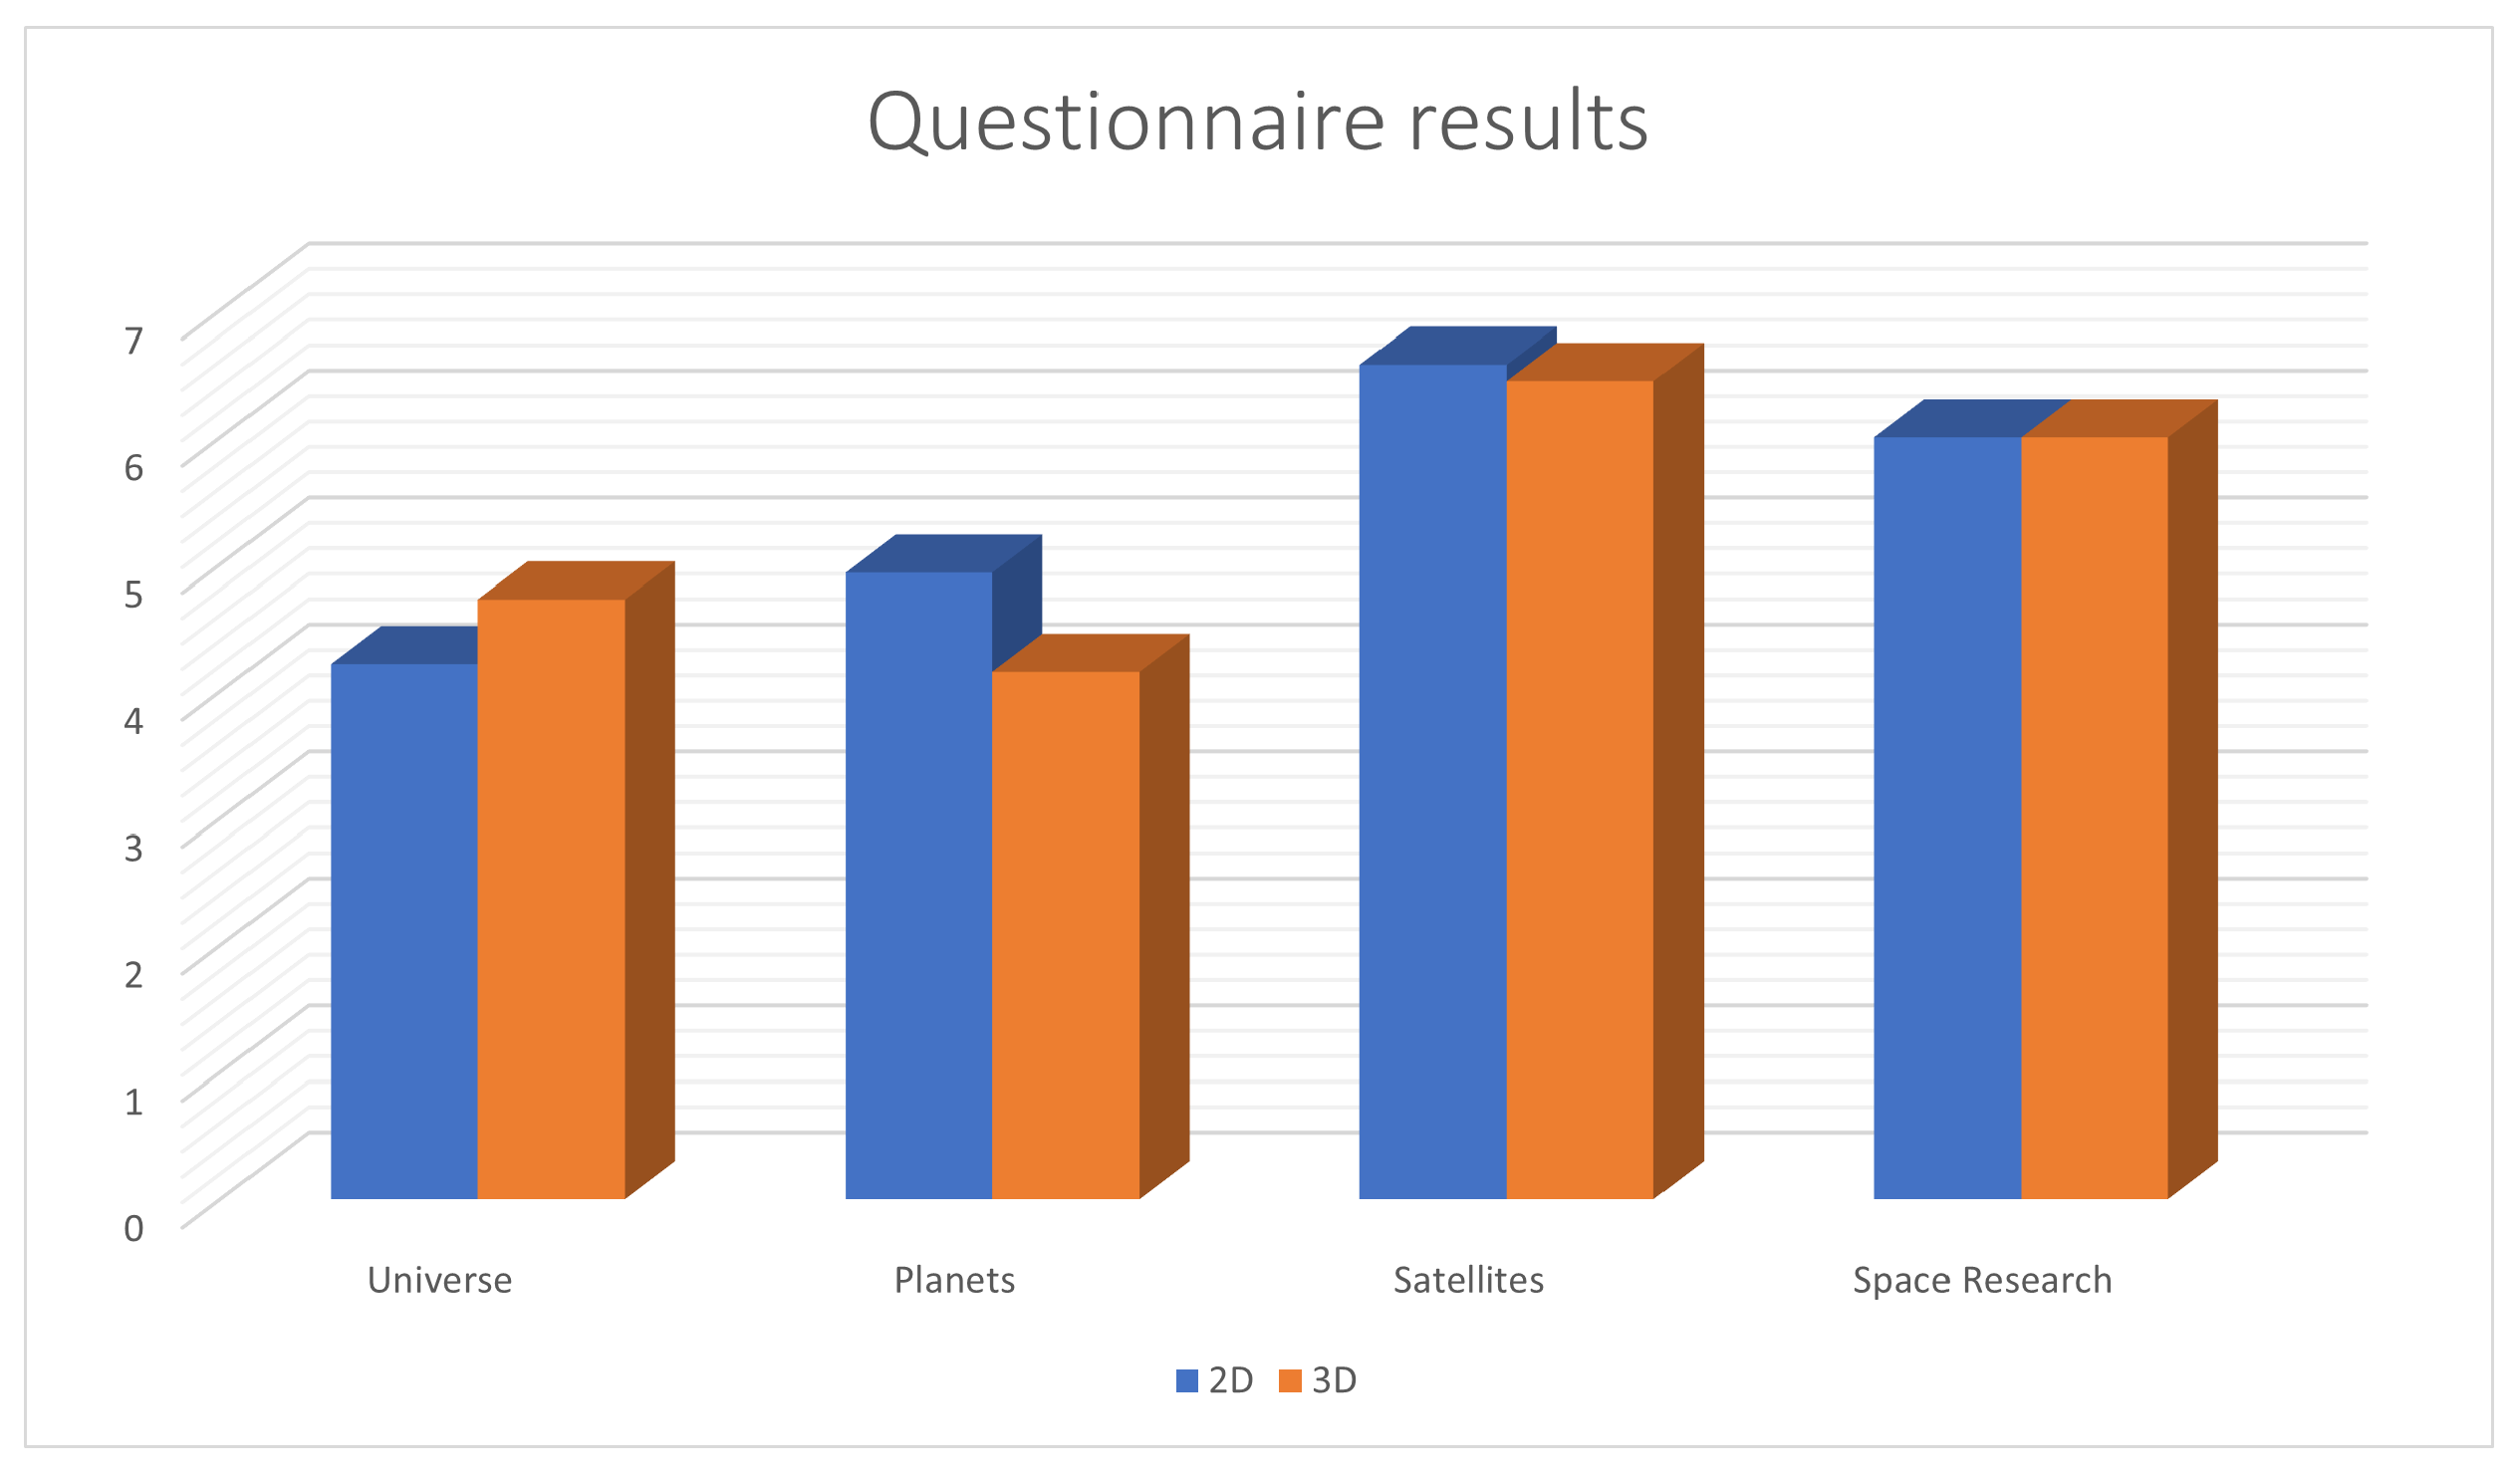
Average number of points obtained on each of the questionnaires in the 2D and 3D case are shown on
Figure 4. Further descriptive statistics can be found on
Figure 5.
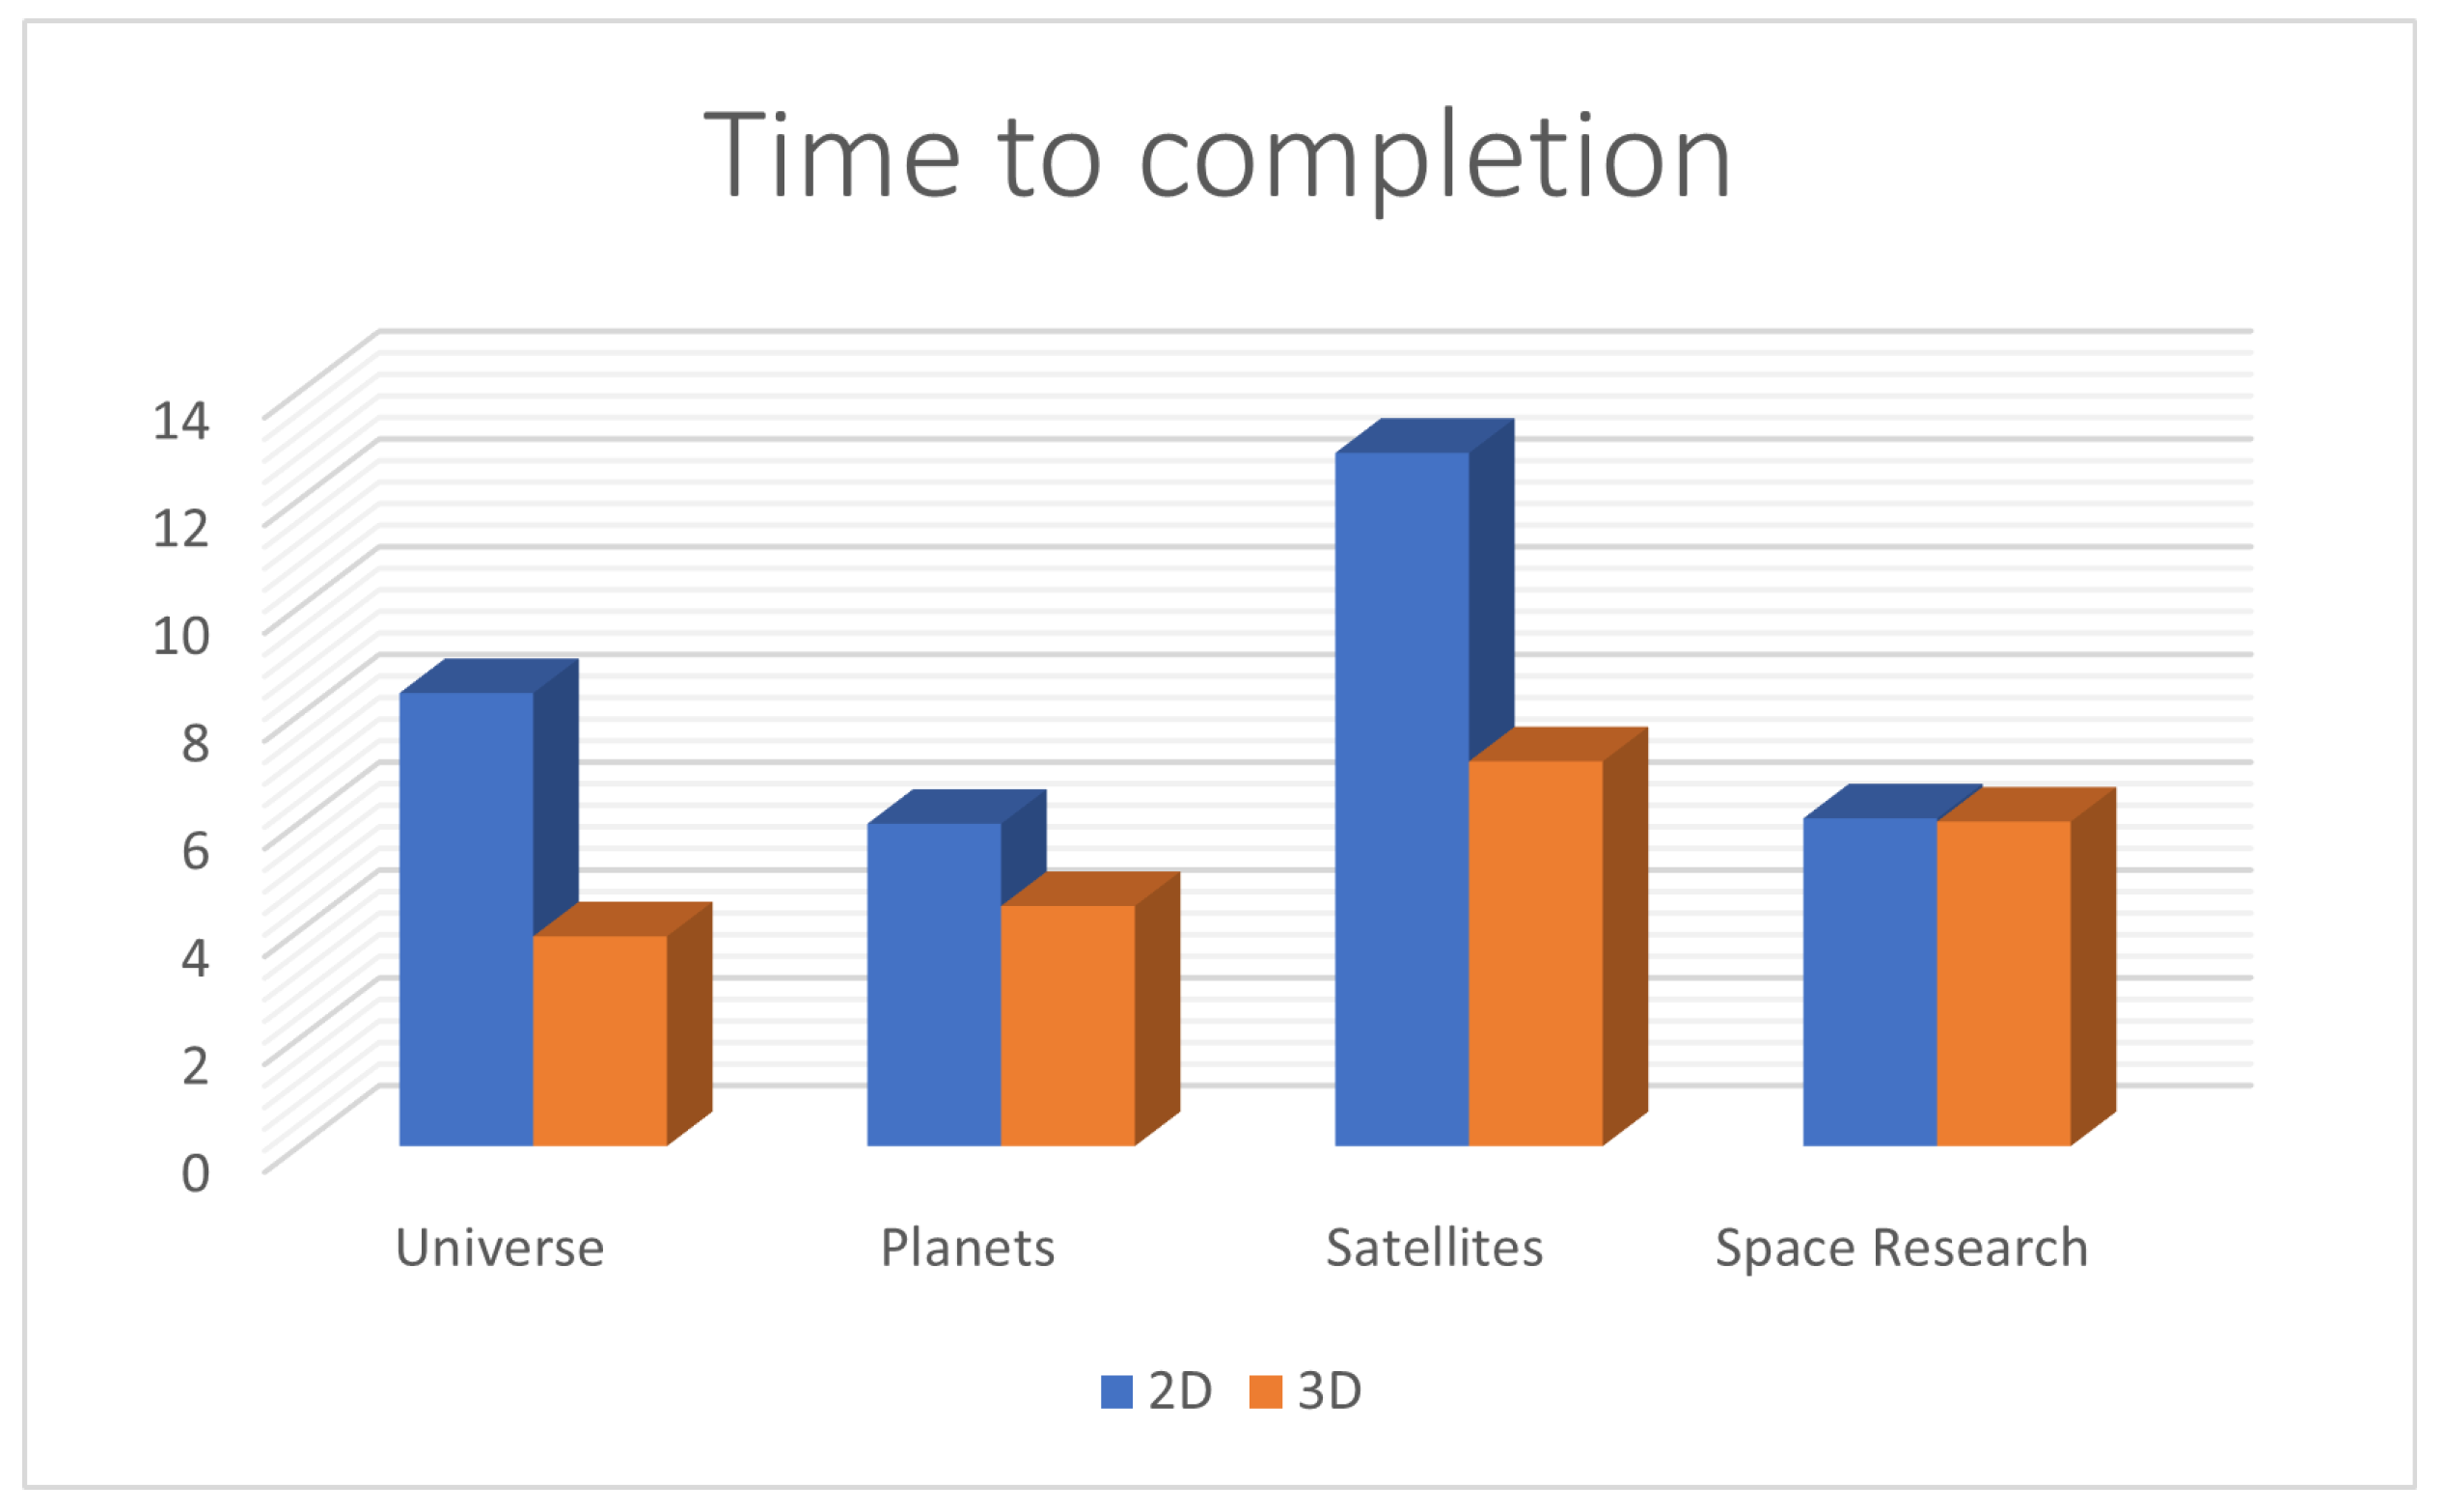
Average amount of time taken to complete each of the questionnaires in the 2D and 3D case is shown on
Figure 6. Further descriptive statistics can be found on
Figure 7.
We performed an independent samples t-test to compare the data for the 2D and 3D case with respect to each of the thematic blocks. Prior to each test, a Levene Test for Equality of Variances was also performed (based on which we ascertained that the variances were the same in each case). Differences were found to be insignificant for all but one pair of measurements: the difference in time taken to complete the questionnaire on the topic of Satellites. Here, subjects performing the task in 3D finished significantly faster (t(14) = 3.38, p < 0.05).
3.6.2. Subjective Evaluation of the Subject-Specific Blocks
At the end of each of the four blocks directly related to the topic of the survey (astronomy), the subjects were asked to indicate, on a Likert scale of 1 to 7, how difficult they felt the block was. The results are shown on
Figure 8 and
Figure 9.
Those who completed the blocks in the virtual space in three dimensions found the blocks on Satellites and the Universe the most difficult, scoring a mean of 4.25 out of a maximum of 7 points (SD: 1.6). These were followed by the block on Planets with an average of 3.75 points (SD: 1.42) and the easiest block was Space Research with 3.33 points (SD: 2.01).
Respondents who completed the task on the 2-dimensional website found the Satellites block to be the most difficult with a mean of 3.66 (SD: 1.63), followed by the Planets block with 3.5 (SD: 1.22), then the Space Research block with 3.16 (1.94) and the Universe block the easiest with mean score of 3 (SD: 1.095).
3.6.3. Fixation Data and Pupil Dilation
Based on the 3D data, the mean gaze fixation count was 2797.72 (SD: 1785.46) and the mean gaze fixation duration was 299.88 (SD: 30.8) milliseconds.
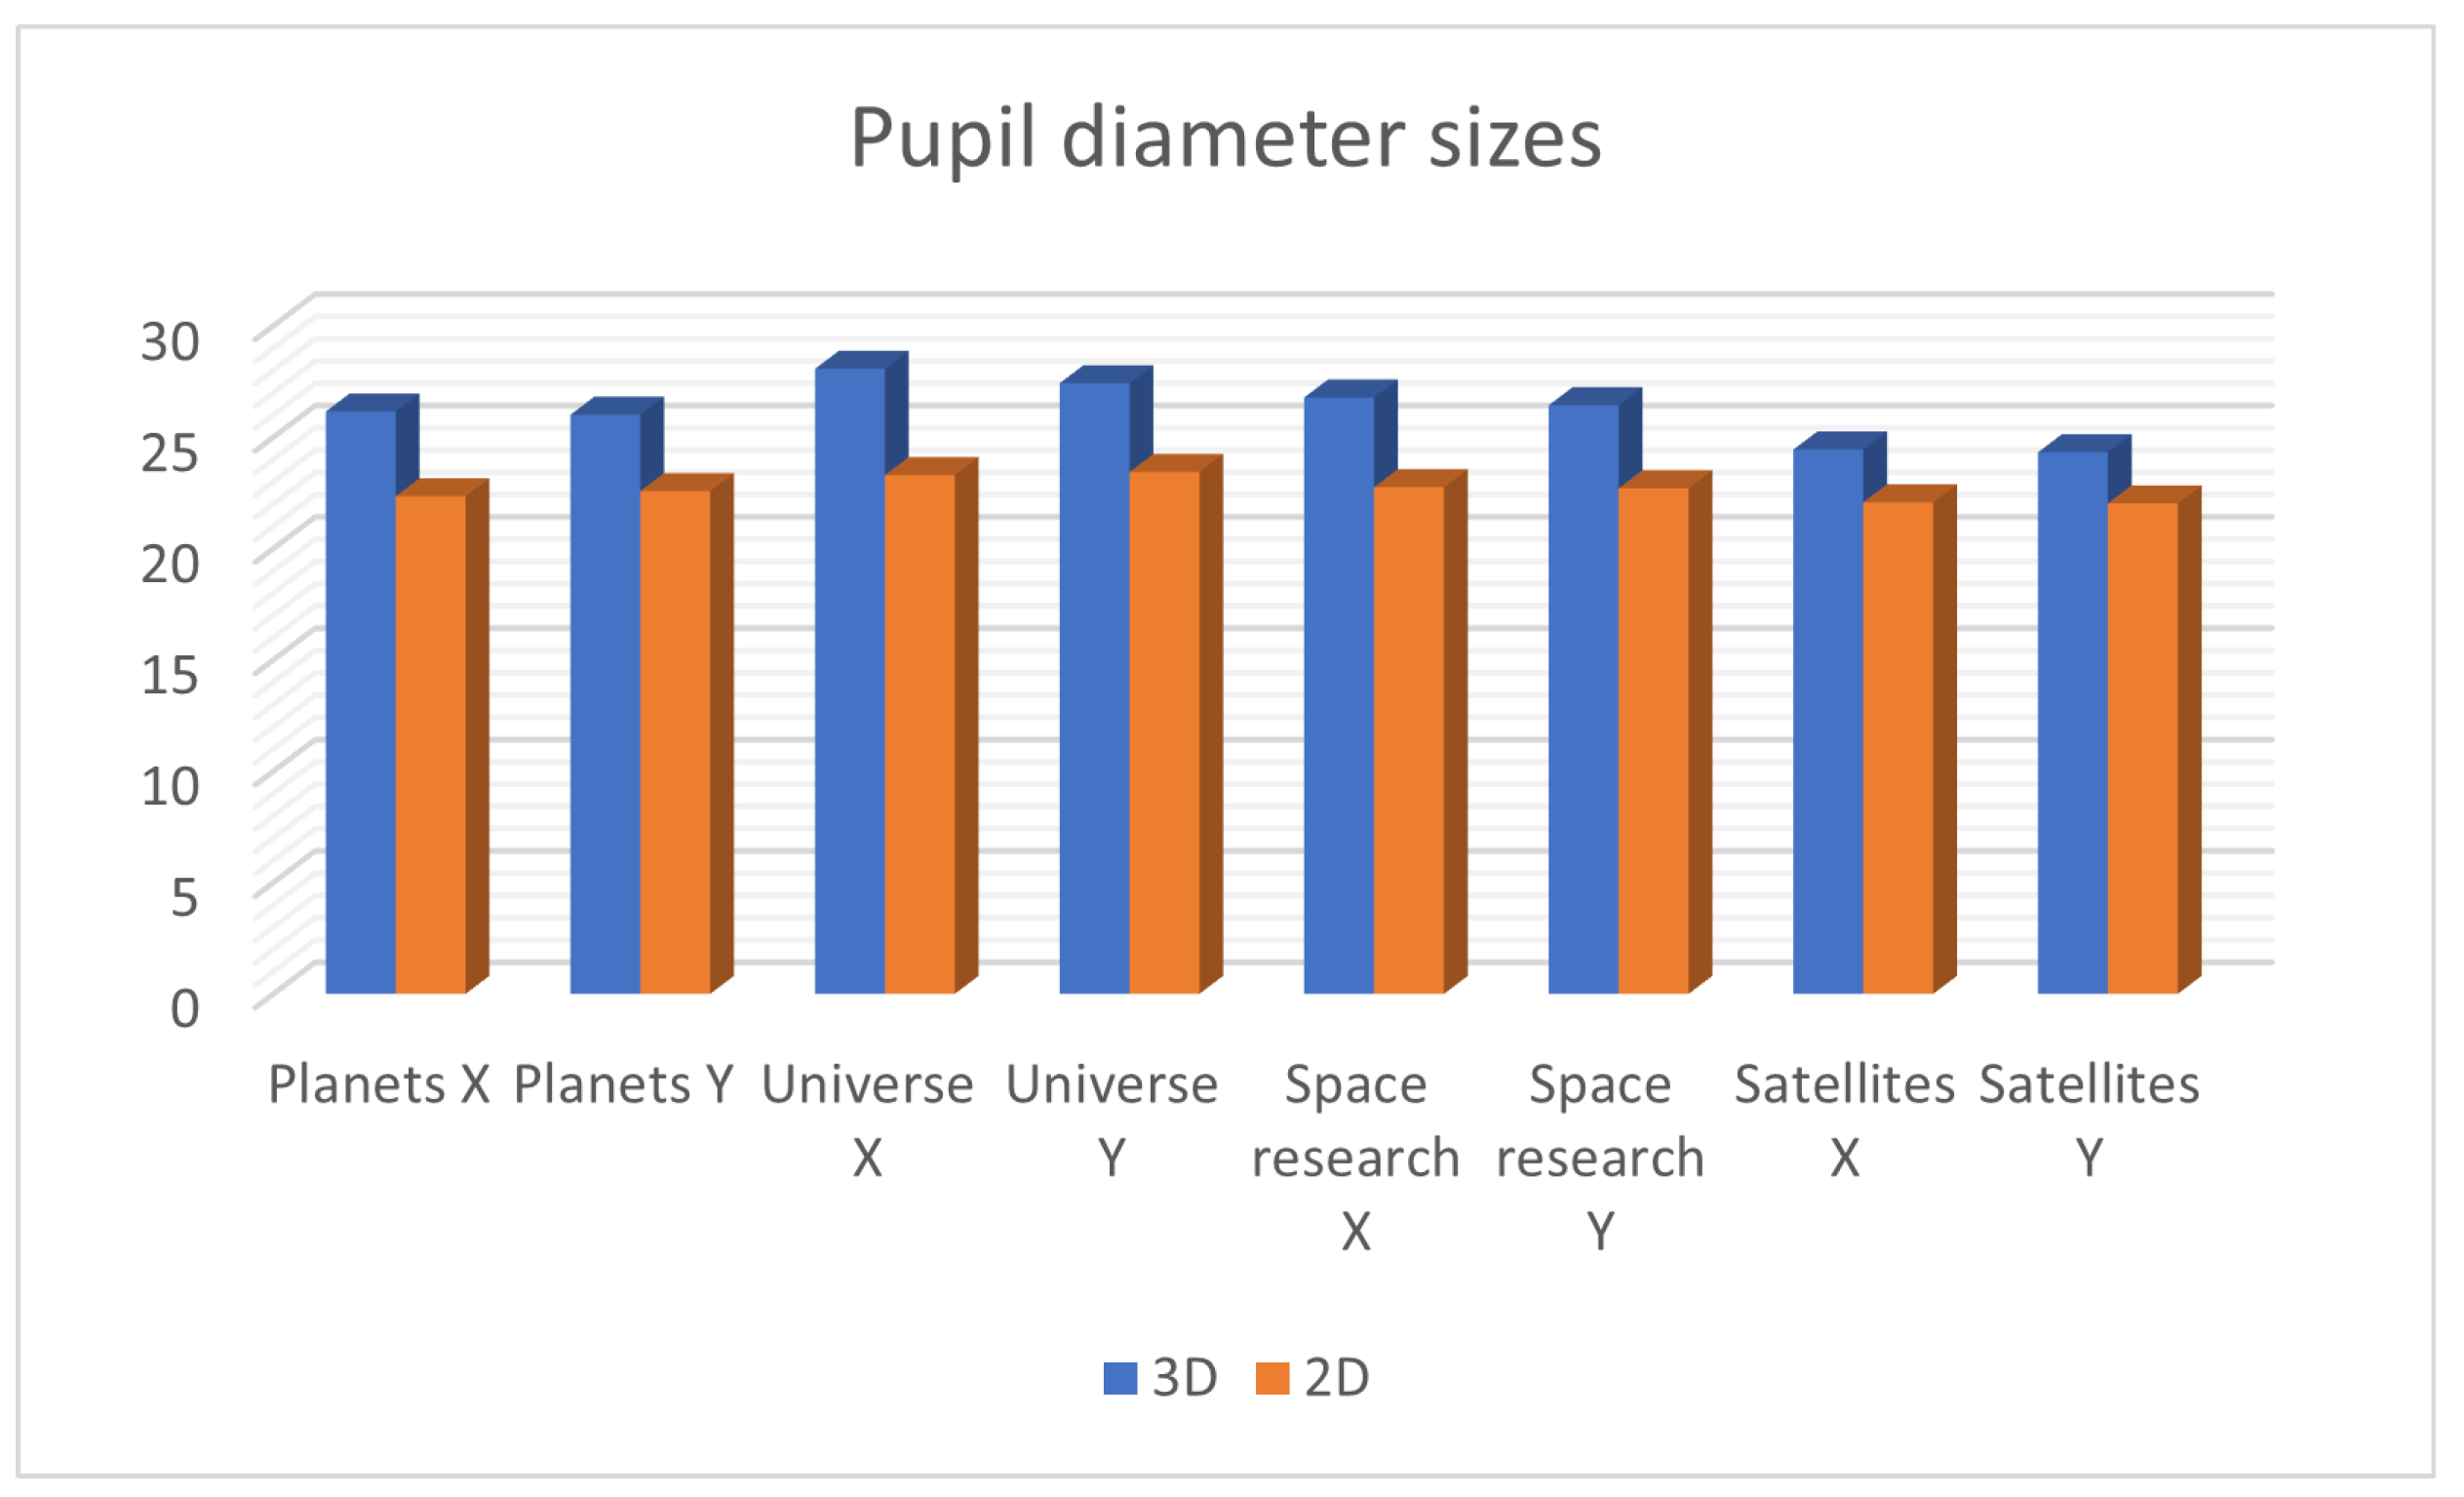
Average pupil dilation measurements per thematic block in the horizontal (X) and vertical (Y) dimension can be seen on
Figure 10.
The independent sample t-test did not show a significant difference between the sizes of pupil diameters between the 2D and 3D groups. Further, the pupil diameter measurements were not correlated with the difficulty assessments made by the test subjects.
3.6.4. High-Level Interaction Patterns
Finally, we investigated whether the relatively high speed at which users were able to answer questions on the topic of Satellites was correlated with any particular interaction pattern in 3D.
In this case, there was no correlation between completion times (on average) and the relative frequency at which users employed the “holistic overview mode”—the mode in which multiple display panels are viewed simultaneously from a stationary position at a distance. On the other hand, the “alternating mode”, which is in some sense complementary to the holistic overview mode (i.e., when users focus primarily on a single display panel at any given time, but switch between display panels at a relatively high frequency) was observed to be the highest (on average) in the case of the Satellites questionnaire.
4. Discussion
The results showed that the correctness of answers provided by subjects in the 2D and 3D case was very similar, with no statistically significant differences. At the same time, within the topic of Satellites, subjects completed the questionnaire significantly faster in 3D than in 2D (while there was no significant difference in completion times within the other topics). These results failed to confirm, in a general sense, our hypothesis that subjects would perform better in 3D than in 2D (save for the completion time in the case of the Satellites topic)—although they certainly did not perform worse. Note, however, that more test subjects from a demographically more homogeneous group (especially in terms of age and technological savviness) would be required to see whether these results hold more broadly, or if results in 3D could be improved. In addition, the fact that the 3D environment included a high volume of visual clutter leads us to the conclusion that reducing this clutter—perhaps by using a more minimalistic 3D space with less need for navigation (other than rotation of view)—could lead to higher yields in performance in the 3D case. We conjecture that visual clutter may have had a role to play in the results in particular based on the observation that in several cases, test subjects tried to interact even with 3D graphical elements in the 3D space that had nothing to do with the subject matter or the task at hand.
Regarding subjective evaluations of difficulty and pupil diameter measurements, it was observed that there was no correlation between the two. This is a surprising result. Leaving aside the possiblity that the tasks were actually more difficult when the subjects perceived them to be easier, this counter-intuitive finding may be due to one of at least two different factors. First, it may be the case that subjects answered this question in a way that reflects their assessment of the subject matter, but not the environment in which they filled out the questionnaires. Second, it may be the case that a larger pupil diameter in the 3D case simply reflects the fact that the test subjects experienced more excitement, which has little to do with the difficulty of the task. To control for the latter effect, it may be useful to carry out the experiment in the future on test subjects who are already highly knowledgeable about the VR platform in use, to rule out effects introduced by excitement due to sense of novelty. We note that pupil diameter measurements were only assessed when the test subjects in the 3D case were already situated at the thematic block of interest; hence, possible difficulty of navigating between thematic blocks could not have had an impact on these results.
Most interestingly, our brief analysis on correlation (or lack thereof) between high-level interaction patterns and performance, while inconclusive, sheds some light on how the patterns forming the basis of analysis could be refined in the future. Contrary to our expectations, the holistic overview mode—while used by some subjects, e.g., up to 16% of the time, on average, in the questionnaire on the topic of Space (also referred to as “Universe”)—did not contribute to improved results in any meaningful way. Still, it was observed that although in the Satellites case, subjects often alternated between different display panels at a rapid rate, such alternation was often not accompanied by a change in the 3D position of the camera (rather, only in orientation). This suggests that it would be worth differentiating between alternating cases where subjects actually zoom in to the new display panel of interest (which we may refer to as a ‘non-stationary alternating mode’), and alternating cases where subjects still remain stationary but rotate their gaze to a different display panel, as if sitting on a rotating chair (which we may refer to as a ‘stationary alternating mode’).
Based on the obtained results, we conclude that at least in the case of one thematic block, the experiment corroborated earlier results e.g., by Lampert et al. [
23], Berki [
33,
34], Horváth et al. [
31] and Legge [
36], although in a context less oriented toward either memorization on one end of the spectrum, or workflow-based tasks with no memorization required on the other end of the spectrum. At the same time, the effect size of the results was in most cases smaller than expected, which may be due to the extensive decorations in this particular 3D space acting as visual clutter and perhaps slowing down response times. This may have also influenced the lack of correlation between pupil dilation measurements and subjective sense of difficulty reported by the test subjects, in that the dilation measurements could have captured excitement, whereas subjective reports may have focused more on the difficulty of the questionnaires.
Besides these caveats, limitations of the research include the small number of participants from diverse (and asymmetric) age groups. Further, existing knowledge of the test subjects on the field of astronomy was not assessed prior to the experiments; however, based on the videos, we were able to observe that none of the participants proceeded to fill in the questionnaires prior to studying the learning materials. This suggests that participants did not primarily rely on prior knowledge; however, in future follow-up studies, controlling for this factor may also be worthwhile. Based on the above, further research is necessary to determine whether a larger number of users from a more homogeneous age group and with a known level of background knowledge can perform better in a 3D space with less visual clutter. A possible follow-up study would also ideally use a 3D space that requires less locomotion (but instead, mainly camera rotation), to see whether the high-level 3D interaction patterns identified in this study would have a more accentuated role to play.
5. Conclusions
In this research, our main focus was on the benefits of using Desktop 3D environments as opposed to more classical, 2D web-based interfaces, in terms of improved effectiveness and reduced cognitive load. We investigated this issue in the context of a learning task, to see whether changes in effectiveness as well as cognitive load experienced could be correlated with new kinds of high-level interaction patterns that may emerge in 3D, but do not apply to 2D environments. Based on the results, completion time in the 3D case was significantly less than in the 2D case in one out of four thematic blocks, whereas no significant differences were observed in other cases (neither in terms of accuracy, nor in terms of completion times). For the most part, significant correlations between pre-defined interaction patterns and completion times/accuracy were also not found, although it was observed that the relative frequency of one particular interaction pattern—rapid alternation between viewpoints targeting individual display panels while changing only camera orientation (but not position)—was highest in the thematic block where completion times were significantly lower in 3D than in 2D. Based on these results, we conclude that the research questions formulated in the paper would be worthy of further investigation in slightly modified experimental settings, with less visual clutter in the 3D environment, and with more test subjects representing a more balanced age group.


