Article

Clarifying Optimum Setting Temperatures for In-Flight Personal Air Conditioning System Considering Individual Thermal Sensitivity Characteristics

Graduate School of Engineering and Science, Shibaura Institute of Technology, Tokyo 135-8548, Japan
*
Author to whom correspondence should be addressed.
Electronics 2023, 12(2), 371; https://doi.org/10.3390/electronics12020371
Submission received: 5 December 2022 / Revised: 2 January 2023 / Accepted: 6 January 2023 / Published: 11 January 2023
(This article belongs to the Collection Predictive and Learning Control in Engineering Applications)

Abstract

:
The number of people who use airplanes has increased year by year. However, most passengers have a feeling of discomfort during a long-distance flight. One of the factors is the lack of temperature control in the cabin. If air conditioning control can be adjusted to each passenger’s thermal sensation, the whole comfort in the cabin would be improved. Therefore, a personal air conditioning control method is required for airplanes. In order to implement personal air conditioning adapted to individual thermal sensation, this study proposes a seat-type air conditioning system that adjusts the temperature to each part of the body and aims to clarify the appropriate temperature setting in consideration of individual thermal sensation. As a result, the appropriate degree of temperature setting change was clarified based on the thermal sensation index. It was found that changing the temperature setting by 2.5 °C per scale of the thermal sensation improved the passenger’s comfort. Furthermore, people who tend to feel cold were found to be more sensitive to temperature changes. It is concluded that personalized air conditioning is possible based on individual thermal sensitivity characteristics. For prospects, it is desirable to study a system that automatically predicts the thermal sensation taking into account individual thermal sensitivity characteristics.

1. Introduction

It is a fact that the demand in the aviation industry has continued increasing, with more and more people using airplanes, leading to an increase in the number of flights in operation. Thus, people have started to use airplanes as transportation conveniently. On the other hand, many passengers might encounter a variety of discomforts in the confined space of the cabin environment [1]. Various factors are attributed to this, such as air quality, noise, and other factors in the in-flight environment [2]. On the flip side, it is considered that improving the cabin environment can reduce discomfort during the flight. To consider an in-flight environment that has structural limitations such as the location of seating, there is one solution: considering an appropriate temperature environment. This is because the current air conditioning system in airplanes maintains a constant temperature regardless of the season [3,4]. Meanwhile, people who tend to feel cold or heat have to adjust their body temperature by themselves such as by using a blanket. As for personal air conditioning in the cabin, small fans are installed over the heads of passengers, but they can only adjust the blowing level and have no heating function [5]. This means that the cabin environment can easily become uncomfortable for people who tend to feel cold. To solve this issue, it is desirable to have air conditioning that can automatically detect a passenger’s thermal sensation and adjust temperature to a comfortable level for passengers [6,7]. Thus, it is expected to prevent the suppression of blood flow caused by cooling and delay the occurrence of swelling [8]. In short, it is beneficial to install air conditioning that adapts to the individual sensations on the airplane [9].
In a previous study [10], a seat-type air conditioning system providing different temperatures to different parts of the body was introduced. It was also proven which part of the body was affected by each air conditioning system by dividing the air conditioning into six sections. However, the individual’s thermal sensation was not taken into account. In addition, the experimental results were all based solely on simulation. To this end, in this study, initially, the human characteristics of hot-sensitivity and cold-sensitivity are investigated, determining suitable air conditioning temperature settings for particular passengers. Then, the air conditioning system that was introduced previously in [10], is practically implemented to clarify the optimum temperature setting considering thermal sensitivity of particular passengers. The experimental results demonstrate that using the proposed system, optimal temperature setting can be achieved, providing thermal comfortability to people who are either cold-sensitive or hot-sensitive. This study is expected to be adopted in practical environments, such as on the trains or automobiles [11,12].
This paper is organized as follows: Section 2 presents related research, especially the authors’ previous study, and Section 3 describes the proposed method with hypotheses based on the previous study [10]. Section 4 evaluates the proposed method through experiment and shows the results. Section 5 discusses the results in more depth and describes the effectiveness of the proposed method. Section 6 presents the conclusions of this study and future prospects.

2. Related Works

The limited space in an airplane makes it easy to generate various stresses. According to [13], the airplane cabin is a comfortable environment by evaluating the Predicted Mean Vote (PMV). However, it is difficult to adapt PMV to limited space [14,15]. Meanwhile, the authors in [1,2] indicated that the passengers’ comfort level varies depending on their age, health, and other factors, resulting in potential discomfort of passengers in an airplane. Thus, discomfort on board can be eliminated by an air conditioning system which considers individual passengers’ body characteristics and health status.
Current air conditioning in airplanes is a convection system, which flows from top to bottom and maintains a constant temperature at all seasons [16,17]. In addition, small nozzles are installed above passengers’ heads as personal air conditioning. However, the nozzles cannot control the temperature; they can only adjust the air volume. This kind of nozzle is believed to have low effectiveness in winter [5,18,19]. In other words, the current air conditioning in airplanes is inadequate for adjusting to individual passengers, and there is room for improvement. There are recent efforts to provide personal air-conditioning systems on the flights [20,21,22]. It focuses on body partial air conditioning, such as for legs and elbows. Furthermore, the thermal sensation differs from each part of the body, thus it must be taken into account for air conditioning control [23]. In other words, partial air conditioning is not sufficient to control the entire body. Hence, the objective of this study is to focus on providing suitable temperatures, positively affecting all body parts. In fact, it is believed that a seat-type air conditioner can effectively provide airflow directly to the human body [24,25,26,27]. Thus, in the previous study [10], a seat-type air conditioning system was introduced. It consists of six air conditioning outlets per seat to provide the appropriate temperature for each body part (as shown in Figure 1 and Figure 2). A previous study conducted validation experiments using computational fluid dynamics (CFD) simulations to investigate appropriate temperature settings using the proposed air conditioning. For this, an ideal temperature distribution around the human body was defined based on references [28]. Table 1 shows the optimum operative temperature around the human body defined as the ideal temperature distribution [28]. Then, the temperature settings of each air conditioning outlet were investigated to achieve the ideal temperature distribution around the human body. As a result, the optimum temperature settings of the air conditioning were found as shown in Table 2. It also clarified which part of the body is affected by which air conditioning outlets. However, individual characteristics were not taken into account, and the experimental results were obtained from simulation solely. One of the key things deduced from previous study is that it is also possible to classify the thermal sensations based on thermal sensitivity characteristics, although it is difficult to classify the thermal sensations based on age and gender [29,30].

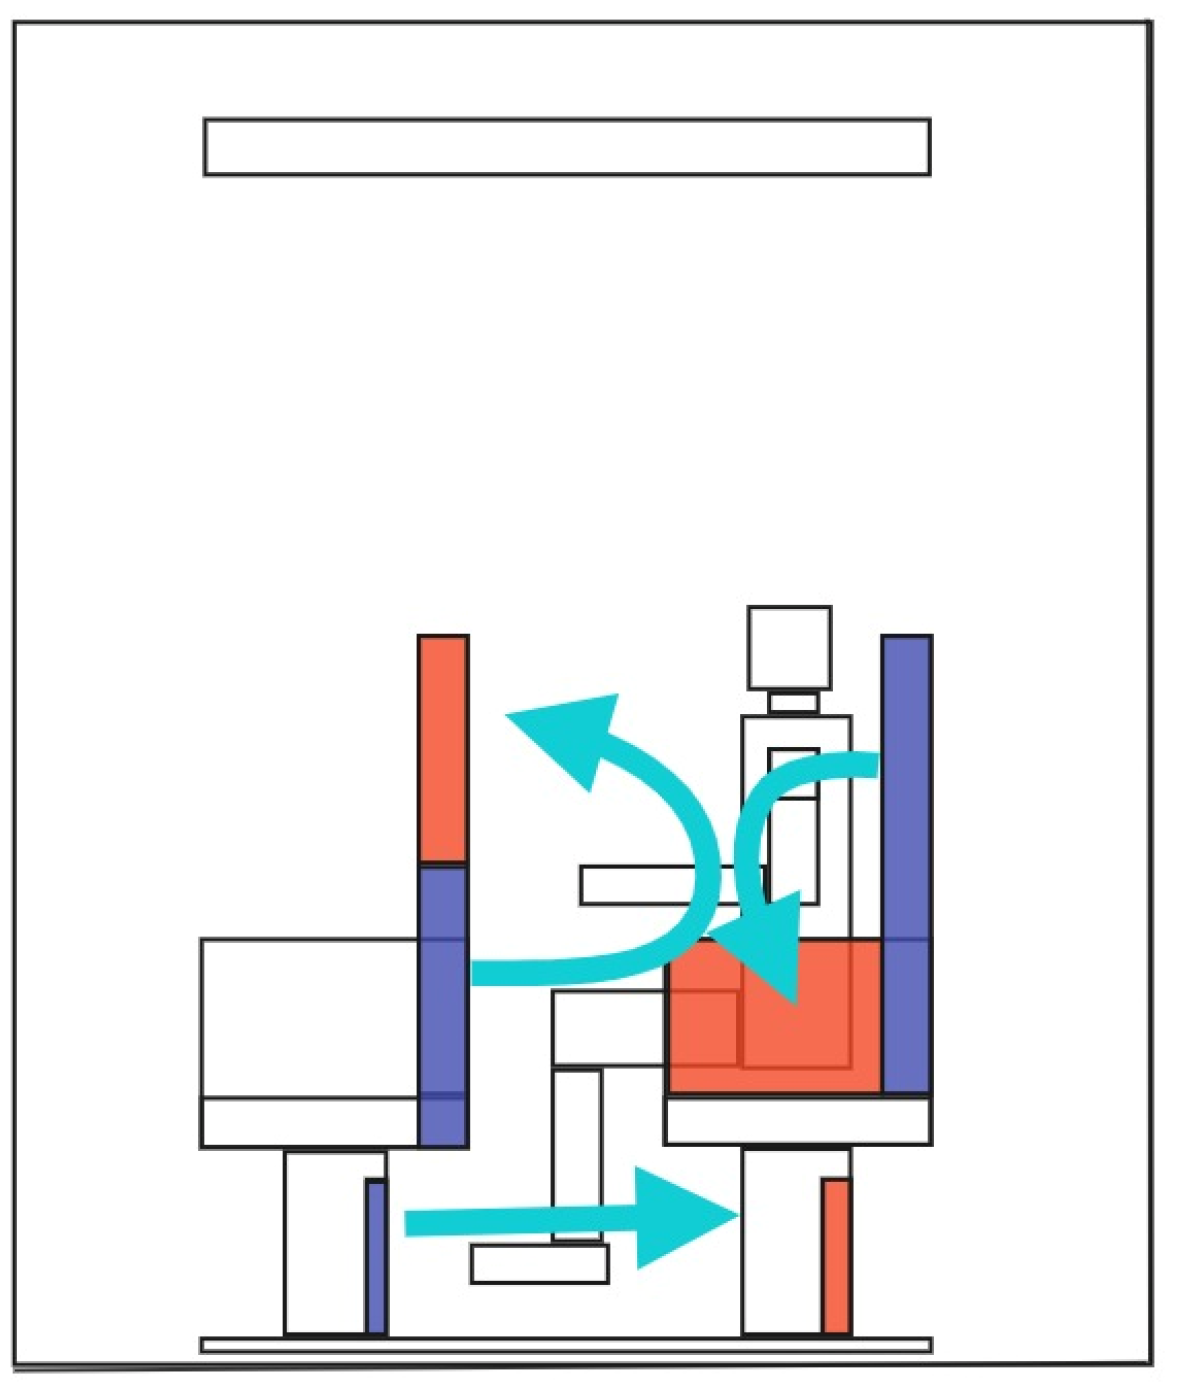
3. Proposed Temperature Control System

To achieve the research objective, the procedure of this study is introduced and illustrated in Figure 3.
Accordingly, as the first step, a preliminary survey of physical characteristics is conducted. The purpose of this step is to categorize thermal sensitivity of subjects participating in the experiments. The next step is experiment, which is divided into two stages: the first stage is to reproduce the results of the previous study [10], based on practical experiment, instead of simulation. In other words, the first stage experiment can be considered as the baseline. The second stage is to obtain the results of the method which considers subjects’ thermal sensation. Then, the obtained thermal comfort and thermal sensation of the subjects in the first and second stage experiments are used for comparison and analysis. Thus, comfortable setting temperatures and air conditioning controls will be clarified for different thermal sensitivity classes obtained from the first step.
One of the important tasks here is to decide comfortable setting temperatures. In other words, the temperature setting should be changed appropriately. In fact, thermal comfort is higher when the thermal sensation is neutral [31,32], as shown in Figure 4. Therefore, our goal here is to change the temperature to the level such that all parts of the body achieve neutral sensation.
In order to achieve the neutral sensation, the degree of temperature setting change is determined based on the work in [33]. Accordingly, a linear relationship temperature and thermal sensation was derived. Note that, to represent thermal sensation, the six scales index, which was defined by ASHRAE (American Society of Heating, Refrigerating, and Air-Conditioning Engineers) (as shown in Table 3) [34], was used in [33], along with the thermal sensation index referred by the subjective evaluation. Table 4 shows linear approximation functions for four different patterns of temperature increase, obtained from [33]. Importantly, the authors provided Table 5 showing how much increase of temperature is needed for a one-scale changes in the thermal sensation.
Based on results from Table 5 in [33], in this study, the degree of temperature change was decided as approximately 2.5 °C for a one-scale change of thermal sensation. This will be applied when the system varies the temperature to reach a comfortable setting, i.e., neural sensation for all parts of subjects’ bodies.

4. Evaluation

In this section, the experiments are conducted to subjectively examine the thermal comfort and thermal sensation obtained from previous study method and from the method which considers thermal sensitivity. Thus, the optimum temperature setting can be derived.

4.1. Evaluation Methodology

4.1.1. Experimental Procedure

Figure 5 shows the overview of an experimental procedure. The total duration of the experiment was 80 min. Before beginning the experiment, the subjects were asked to sit in a waiting room for 30 min. This is because a resting period of 30 min is necessary to eliminate thermal effects in previous environments [35,36]. In this experiment, the temperature in the waiting room was set at 25 °C because the ambient temperature was set at 25 °C as in [10]. The subjects were asked to stay put in the waiting room for 30 min, where the temperature of the room was 25 °C. Note that the temperature of the waiting room was 25 °C. After spending time in the waiting room, the subject entered the experimental room to start the experiment. The experiment was divided into two stages, as mentioned in the Section 3. The duration of each experiment was set for 20 min because more than 15 min were needed to adapt to the temperature change [37]. The transition duration of step 1 and step 2 was 10 min. During this period, the subject stayed in the waiting room.

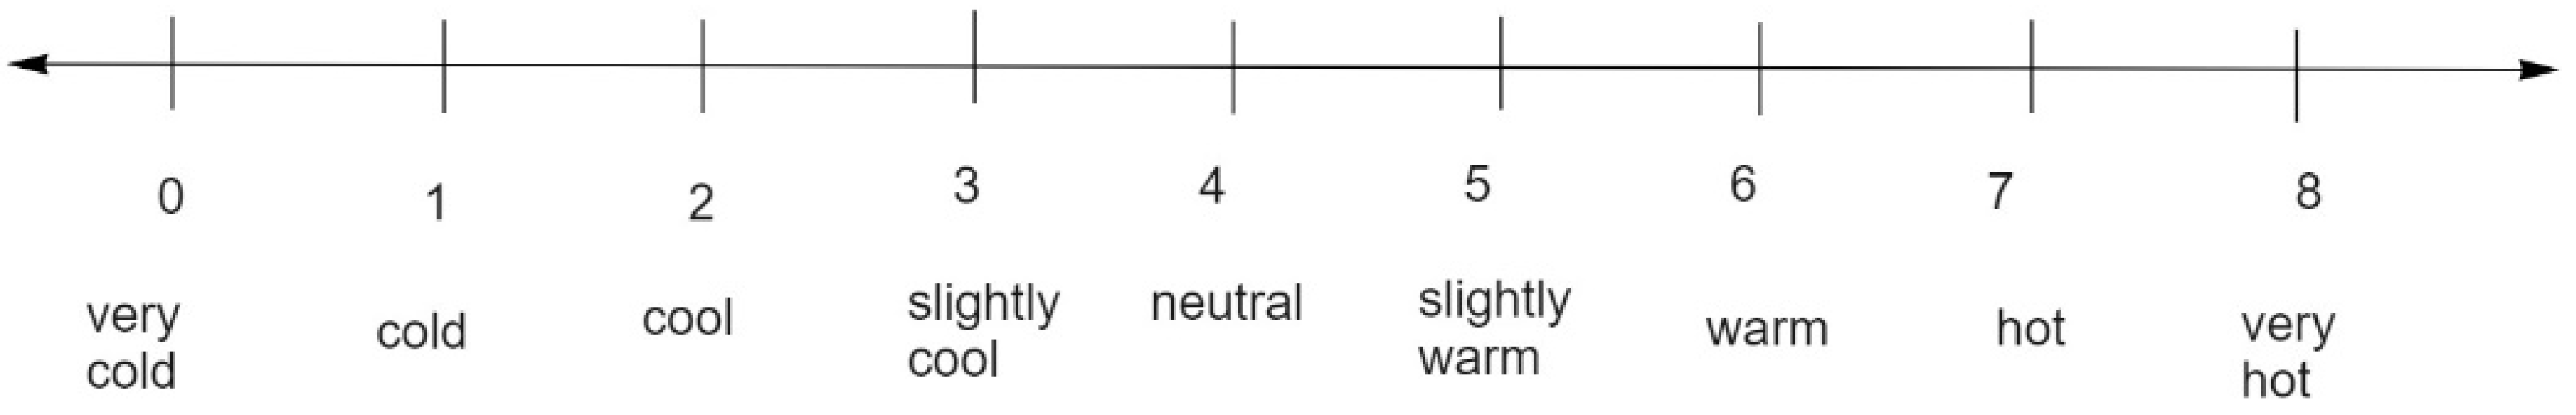
4.1.2. Questionnaire

This experiment was evaluated by subjective evaluation. In this study, the thermal sensation and the thermal comfort indexes are based on ASHRAE and ISO, which are widely used in thermal comfort evaluations, were used [34,38,39]. The questionnaires for the subjective evaluation used in this experiment are shown in Figure 6 and Figure 7. The thermal comfort is on a 6-point scale, while the thermal sensation is on a 9-point scale. Although ASHRAE recommends a 6-point scale for thermal sensation, a 9-point scale was used in this experiment to observe the subject’s thermal sensation in more detail.
Thermal sensation and thermal comfort questions to the subject were asked twice (Q1, Q2) at 15-minute intervals in the waiting room and four times (Q3, Q4, Q5, Q6) at 10-minute intervals during the experiment. The intervals referred to the related research [35,36]. Since there were a total of nine parts of the body focused on in the previous study [10], the subjects were asked to respond to the thermal sensation and the thermal comfort sensations in the nine parts of the body. Thus, there are a total of 18 questions in one questionnaire. Before the experiment, subjects were given another questionnaire to confirm their body constitution, such as thermal sensitivity characteristics. There, they were asked to fill in their weight, height, sleep time on the previous day, and health condition in order to examine not only their thermal sensitivity characteristics but also the subject’s physical characteristics.

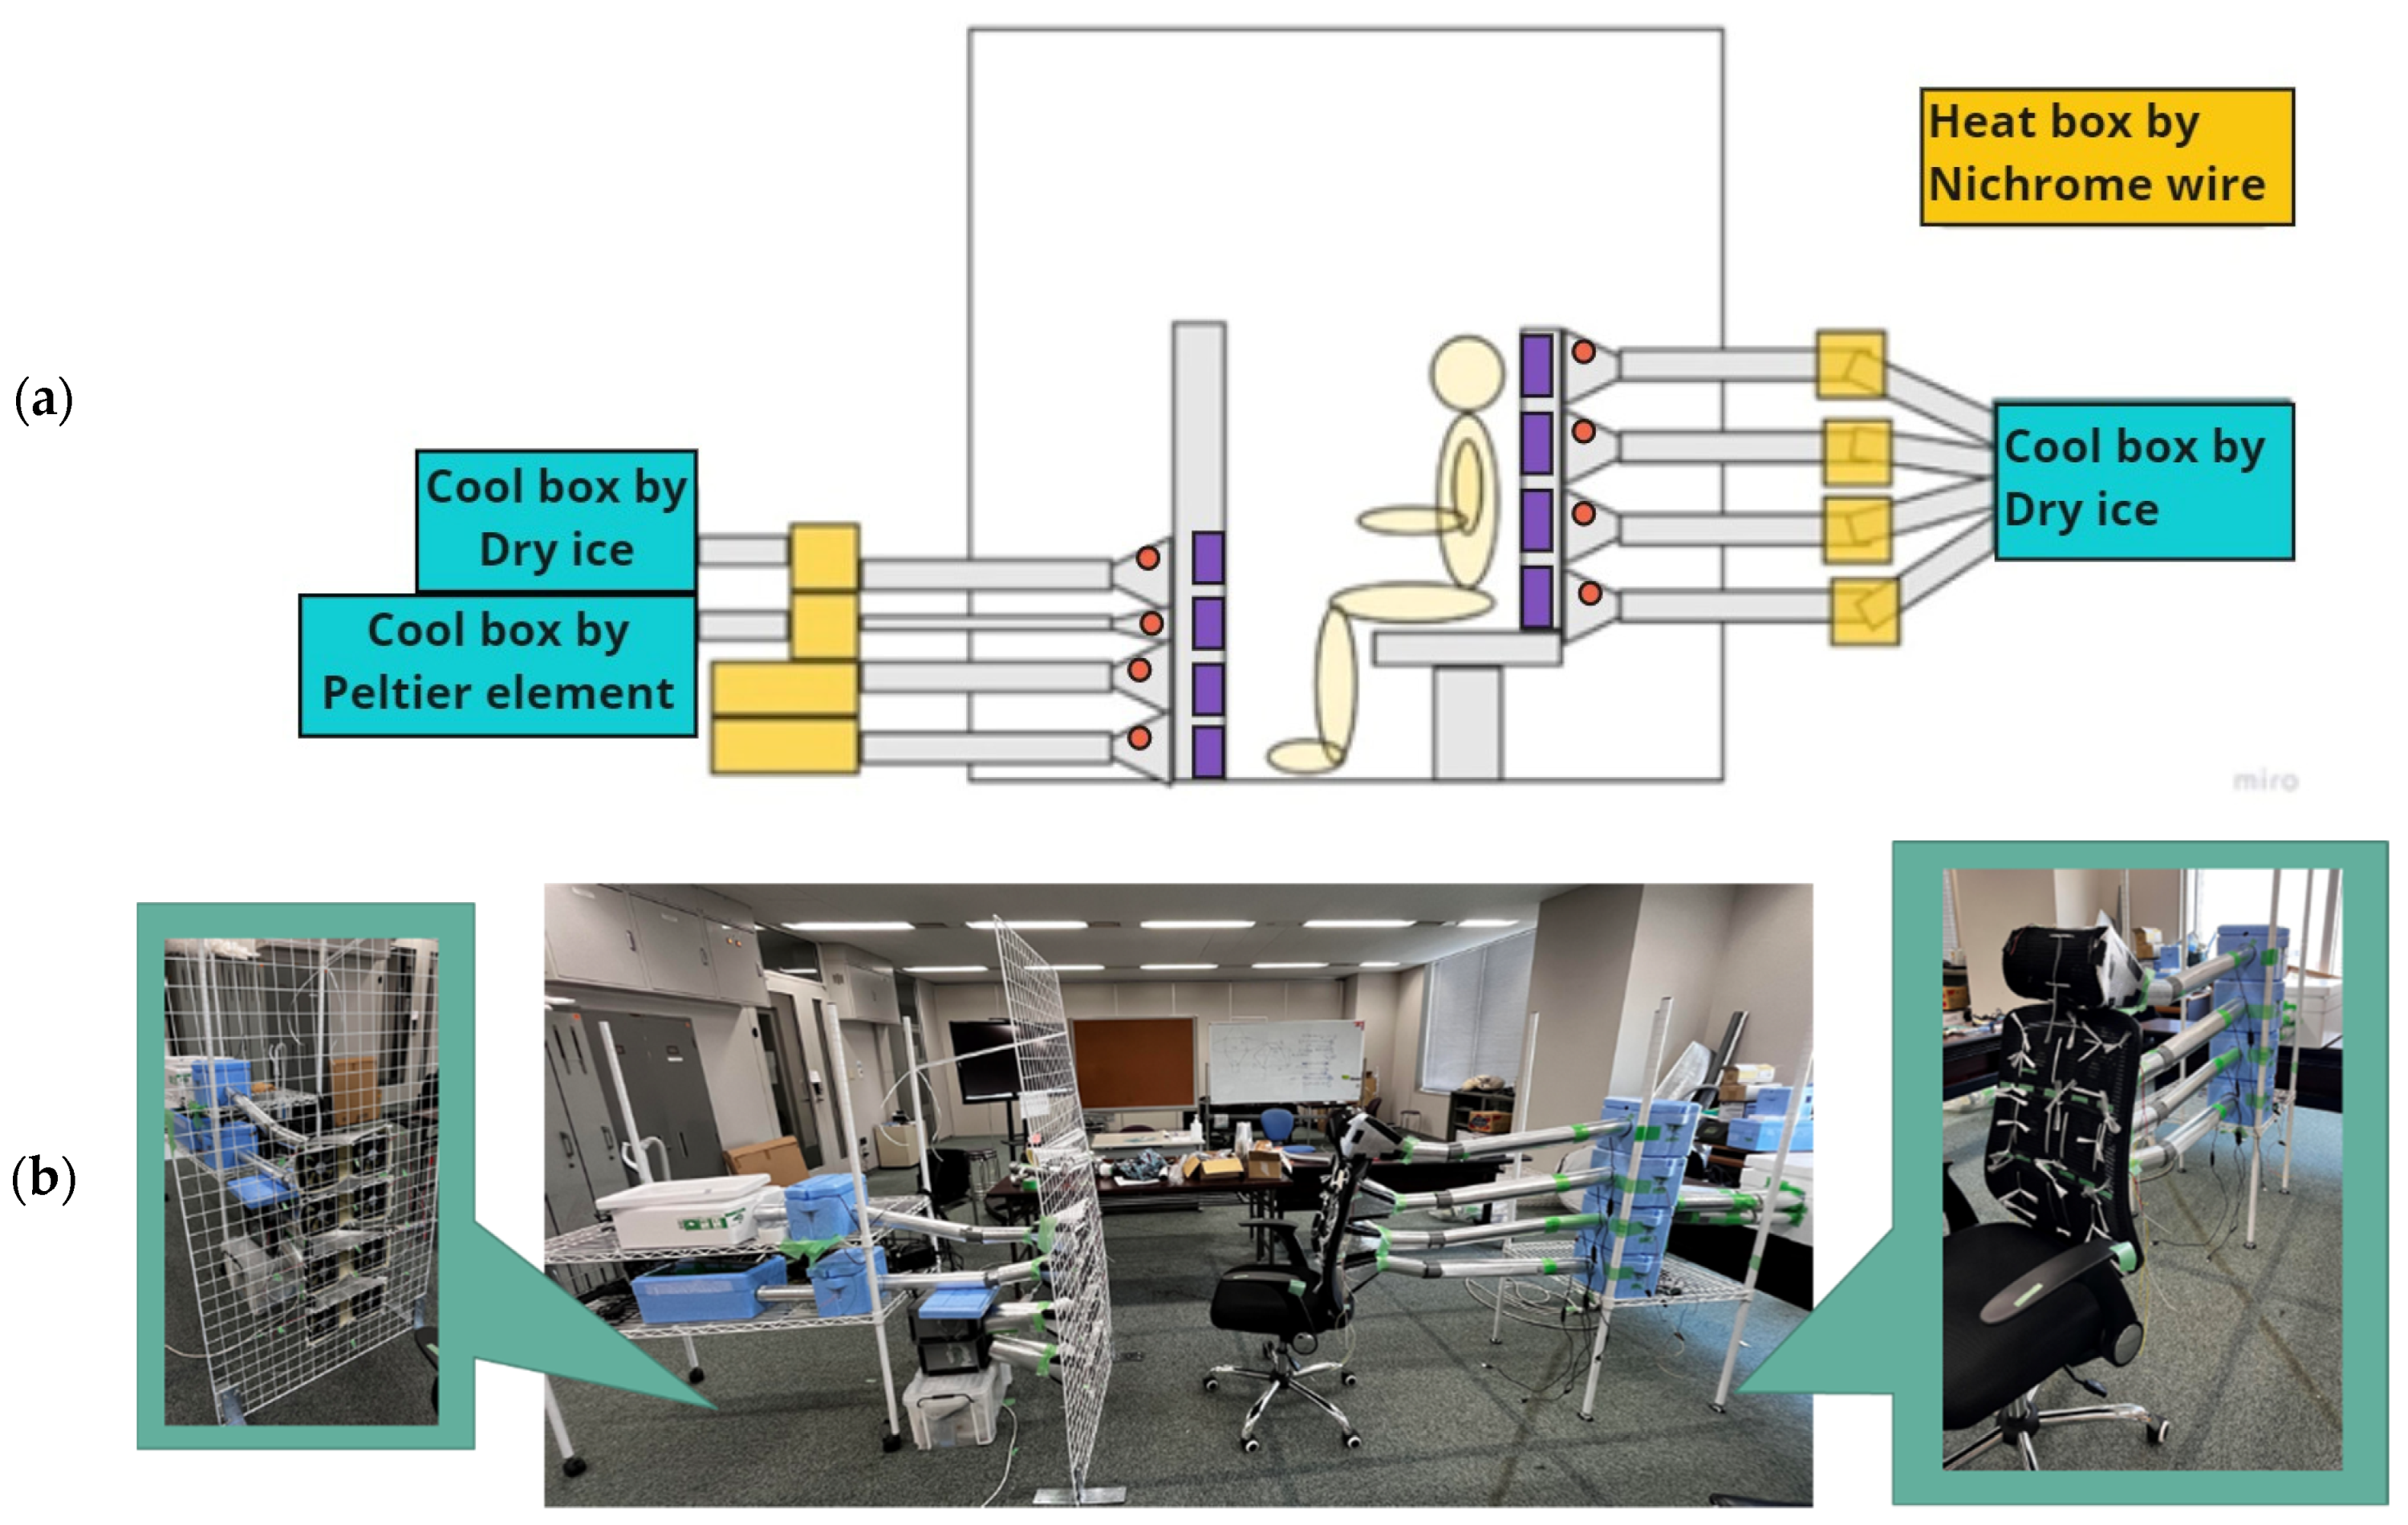
4.1.3. Experimental Environment
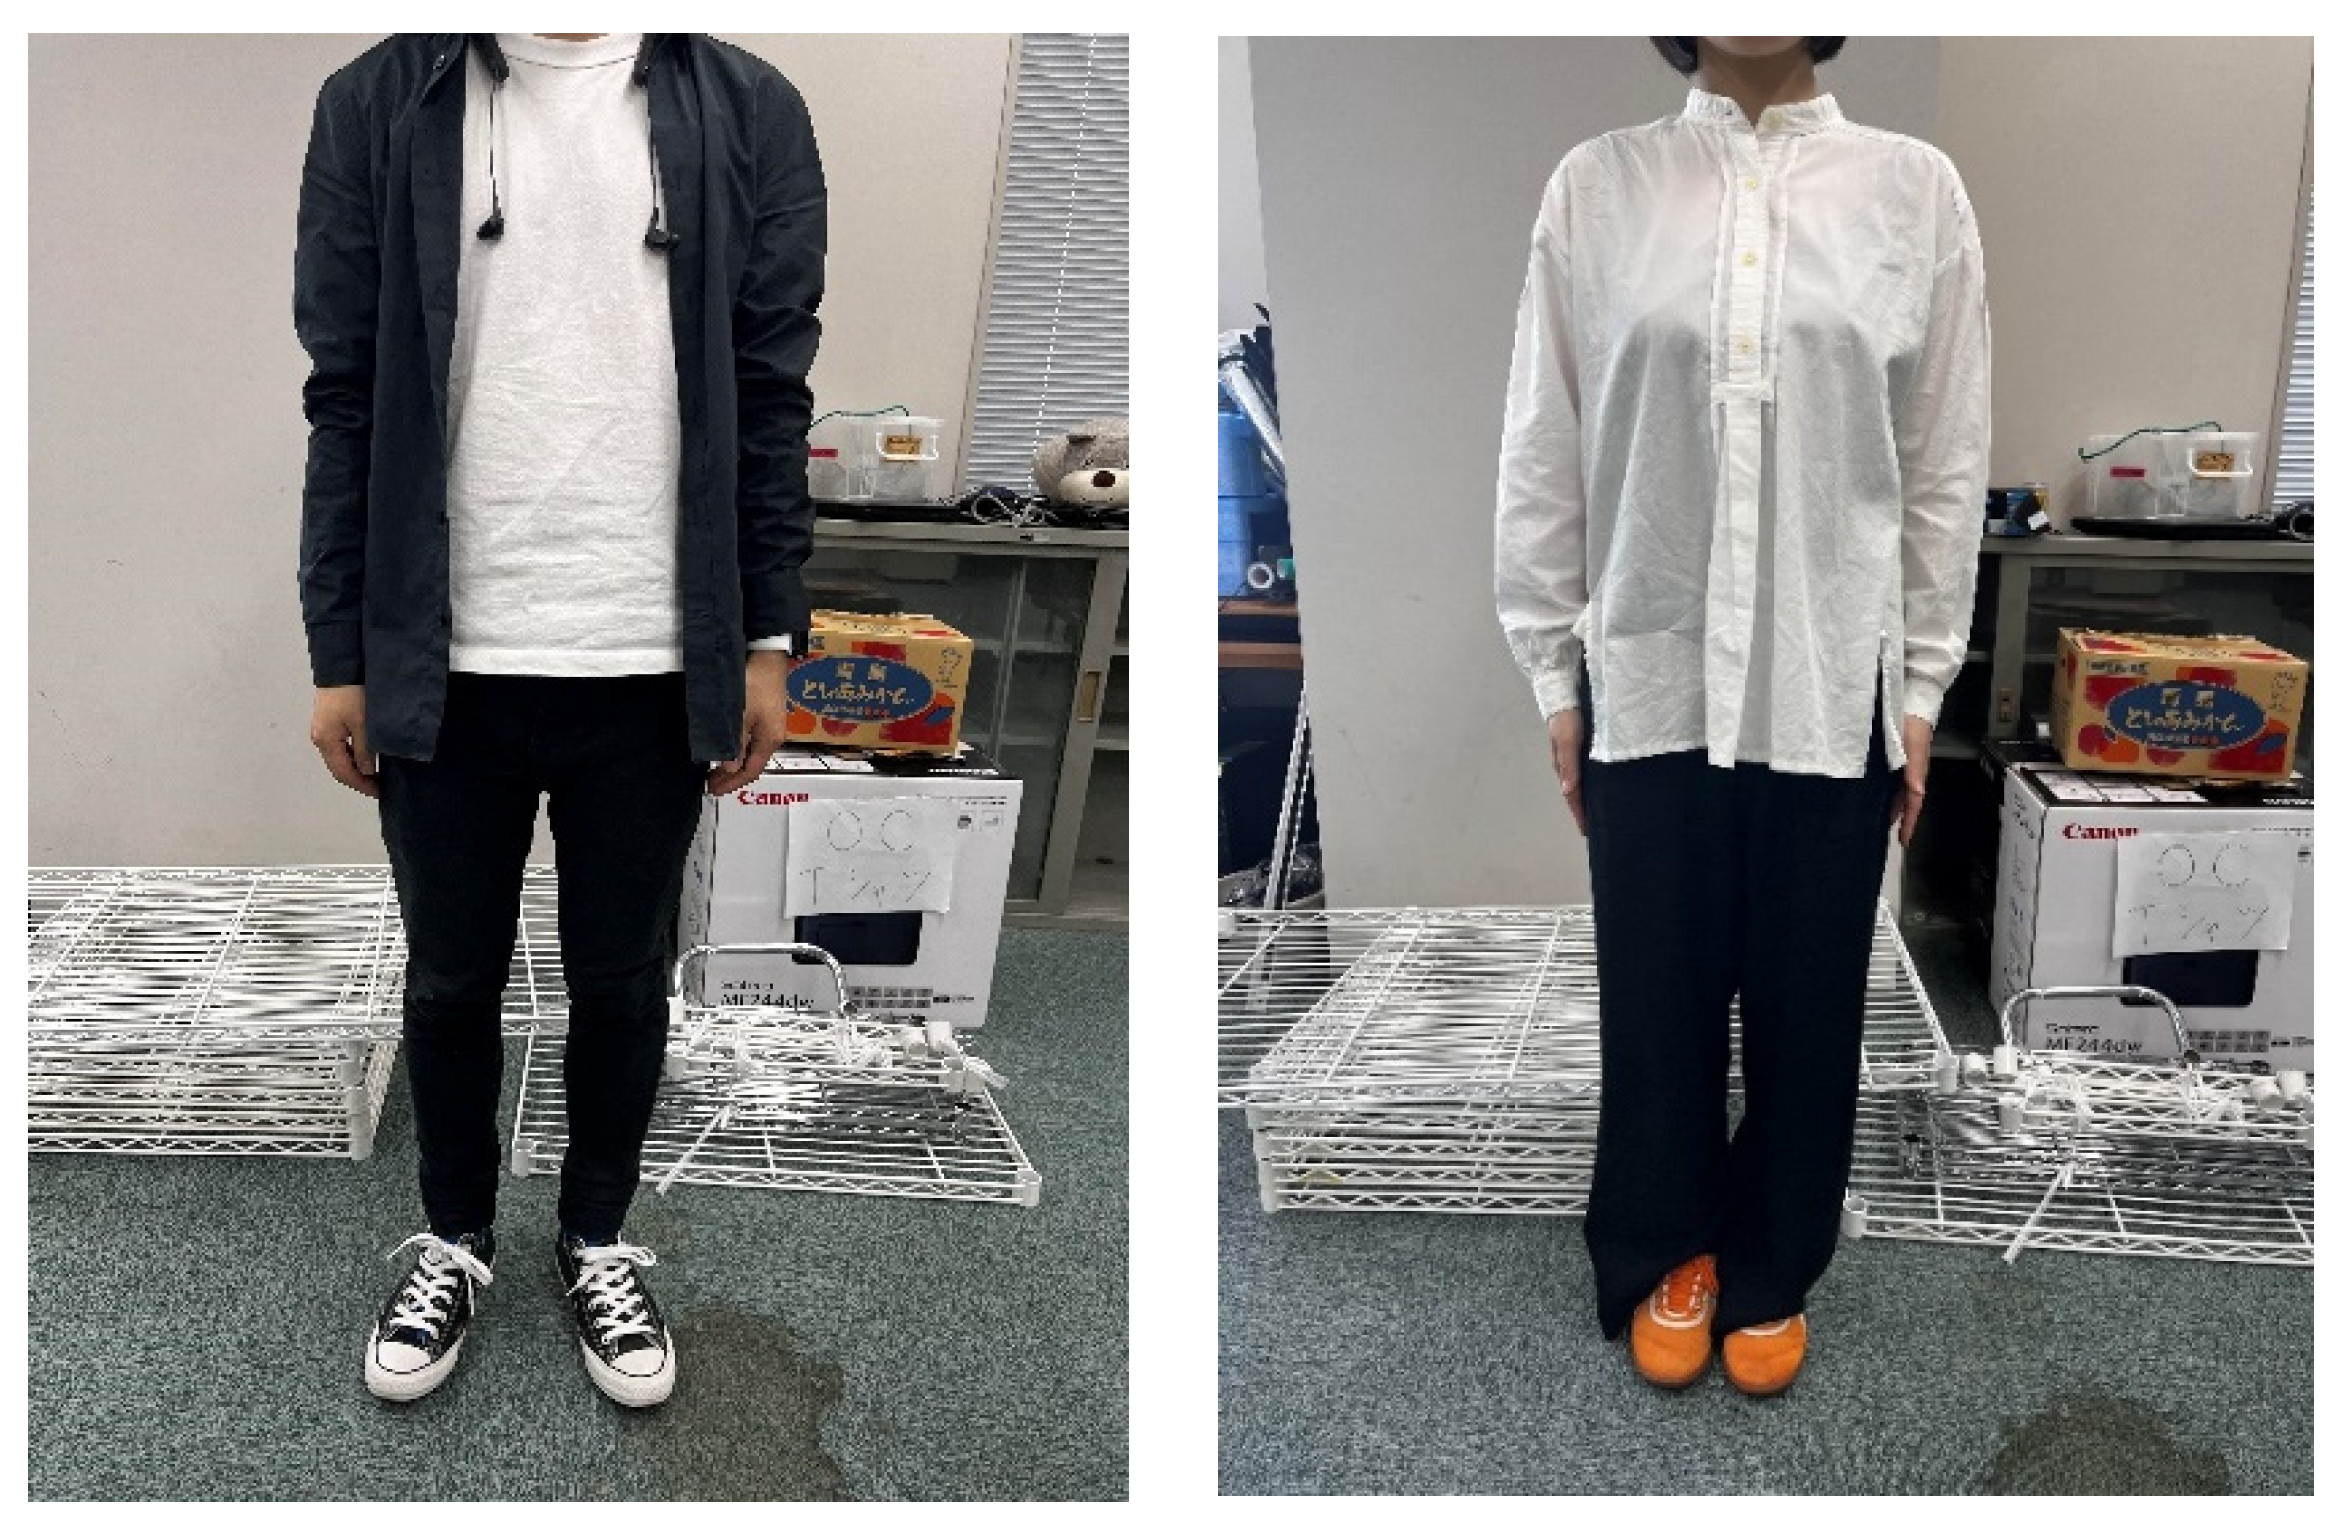
To produce experimental results based on the previous study, which was done in simulation, the experimental environment was set up in a way that was as similar to the simulation model as possible. According to the previous study [10], a total of eight temperature-controlled air conditioning outlets were installed at the target seat and in front of the seat. In this study, air conditioning was prepared by the authors themselves. The air conditioning was divided into cooling and heating systems in order to control the temperature at each of the eight outlets. It was created based on Figure 8a as the experimental environment.
Nichrome wires were used to make heat air for the heating system, while dry ice and Peltier elements were used to make cool air for the cooling system. The temperature to be applied to the feet was assumed to be higher than 25 °C, which was the ambient temperature of the experimental environment. Thus, the temperature was controlled only by the heating system. In other areas, a cooling system created cold air, which was then raised to the appropriate temperature by the heating system containing nichrome wires, and finally, the air was blown out. The created system is shown in Figure 8b. The illustration callouts of Figure 8b are photos seen from the air outlets. Styrofoam boxes with high insulation properties were used for the heating and cooling systems. In addition, the duct was also made of Styrofoam to prevent heat loss. Each box was equipped with a small fan at the discharge point. Only the outlet that directly blows air to the human body was equipped with a 12-centimeter square fan as shown in purple in Figure 8a. To control the setting temperature, a temperature sensor was installed near the outlet as indicated in red in Figure 8a. Using the temperature sensor, the setting temperature was controlled by switching on/off the current flowing to the nichrome wires of each heating system. In the cooling system, dry ice was used for air conditioning to create lower temperatures because the results of the previous study showed that lower temperature settings were required especially for the head part and the upper body [10]. On the other hand, a cooling system with Peltier elements was used for the air conditioning of the thigh parts where the temperature setting was not so low. A Peltier element is called a thermoelectric element that produces a cooling effect when a voltage is applied. The fan at the air outlets that directs airflow to the human body was set at an air velocity of 0.2 m/s. This is because the air conditioning wind speed in the previous study was set at 0.2 m/s [10]. The human body does not feel uncomfortable with this wind speed [40].
Figure 9 shows a photograph of the actual experimental environment. In order to make the experimental environment close to the model in the simulation, a tent was used to avoid the influence of outside convection. Only one side of the tent was made of a mesh material. Although the simulation model was a completely private room, the mesh material tent was used in this experiment to avoid compromising the comfort of the subject due to carbon dioxide since dry ice was used in this experiment.
Regarding humidity, the experiment was conducted from the end of May to mid-June, which is one of the most comfortable seasons in Tokyo, Japan. Therefore, it can be assumed that the humidity and the room temperature were ideal for the experiment.

4.1.4. Subjects

This experiment was conducted with a total of 20 subjects; 10 female and 10 male. Table 6 and Table 7 show the average weight, height, and health condition of all subjects collected in the preliminary questionnaire.
As seen from Table 7, eight subjects in this experiment tended to feel hot, five subjects tended to feel cold, and seven subjects had a normal sensation. By obtaining statistics on these three types of people, the air conditioning control method according to thermal sensitivity characteristics was investigated in this study.
Regarding the clothes thermal insulation of the subjects, according to the reference [41,42], the appropriate clothing insulation at a 25 °C environment is 0.5 clo value. Therefore, the subjects conducted the experiment wearing clothes with the clo value of 0.5. The subjects wore a long-sleeved shirt and pants as in Figure 10 [43].

4.2. Result

4.2.1. Thermal Sensation

Figure 11 shows the result of the thermal sensation evaluation obtained from 20 subjects. The horizontal axis represents the time at which the questionnaires were conducted, and the vertical axis represents the average value of the thermal sensation index according to Figure 6. Q1 and Q2 are the timings for the questionnaires in the waiting room, and Q3 and Q4 are the timings for the questionnaires when the temperature settings of the previous study were applied [10]. Q5 and Q6 are the timing for the questionnaires after changing the temperature setting. On the thermal sensation scale, closer to 8 means a “hot” sensation, and closer to 0 means a “cold” sensation. The middle 4 is the “neutral” sensation. As indicated in the proposed method, this study assumes that the comfort level improves when the thermal sensation becomes more neutral. Therefore, the expected result is closer to 4 during Q6. Figure 11 indicates that the average thermal sensations in the waiting room (Q1 and Q2) are close to neutral, while the average thermal sensations, when the temperature settings of the previous study were applied [10], were generally cold. However, when the temperature setting was changed, which is suitable for each subject (at Q5 and Q6), the thermal sensation became relatively neutral.

4.2.2. Thermal Comfort

Figure 12 shows the result of the thermal comfort evaluation obtained from 20 subjects. The horizontal axis represents the time at which the questionnaires were conducted, and the vertical axis represents the average value of the thermal comfort index shown in Figure 6. The timing from Q1 to Q2 was the same as the ones in Figure 10. On the scale of the thermal comfort, closer to 5 means “comfortable”, and closer to 0 means “uncomfortable”. A rise in the comfort level is expected during Q5 and Q6 since the proposed method was applied there. From Figure 12, it can be seen that for some body parts, the average value of the thermal comfort level became lower at the temperature settings in the previous study (Q3 and Q4) compared to the timings in the waiting room (Q1 and Q2) [10]. However, it can be observed that the average value of the thermal comfort level increased by changing the temperature setting (Q5 and Q6), relatively achieving neutral level.

4.2.3. Classification of Thermal Sensitivity Characteristics (Tendency to Feel Cold or Hot)

Next, the thermal sensation and the thermal comfort are compared separately for the hot-sensitive and cold-sensitive people. Figure 13 shows this comparison.
Regarding the thermal sensation, the hot-sensitive group shows little fluctuation overall, while the cold-sensitive group shows a large fluctuation. This is because the temperature setting in the previous study was relatively low, hence, cold-sensitive people felt cold easily [10]. That is why the graph for the cold-sensitive group shows a large fluctuation. However, the results of both the hot-sensitive and cold-sensitive groups show that the last question (Q6) has a near-neutral sensation. Regarding the thermal comfort, the hot-sensitive group shows little fluctuation, while the cold-sensitive group shows a large fluctuation, similar to the thermal sensation. Both groups show that the last question increased the thermal comfort level. Moreover, the comfort level of the hot-sensitive group properly increased in the right direction.
To discuss whether the change of temperature setting in the proposed method was appropriate or not, the degrees of changing thermal sensation and thermal comfort accordingly must be investigated numerically.
First, for thermal sensation, it is significant to verify if the hypothesis of varying the temperature setting by 2.5 °C is proportional to varying one scale of the thermal sensation was correct or not. To this end, the difference between the thermal sensation level and the neutral sensation level before and after (i.e., at Q4 and Q5) changing the temperature setting was examined. Specifically, the thermal sensation level minus the neutral sensation level (i.e., level = 4) was checked. The subjects were divided into three groups based on their thermal sensitivity characteristics: the hot-sensitive group, cold-sensitive group, and neutral group. Table 8, Table 9 and Table 10 show the value at Q4 and Q5 for each part of the body for each group. Note that the green-colored cells indicate that the value is more than 1, and the grey-colored cells indicate that the sensation difference felt by the subject during Q5 is greater than in Q4.
As seen from Table 8, Table 9 and Table 10, overall, the difference between the thermal sensation level and the neutral sensation level at Q5 was smaller than that at Q4. This indicates that changing the temperature setting according to the subject’s thermal sensation worked effectively. In addition, at Q4, such a difference for the cold-sensitive group is larger than the hot-sensitive and neutral groups. This is because the temperature setting in the previous study was rather cold for cold-sensitive people [10]. On the other hand, the temperature setting in the previous study was appropriate for the hot-sensitive and neutral people since there was not much difference at Q4. It means that the setting temperature of the previous study is appropriate for the hot-sensitive and neutral people. Furthermore, looking at each part of the body at both Q4 and Q5, the differences between the thermal sensation level and the neutral sensation level in the shoulder and back are remarkably large compared to other parts. This is because the seat-type air conditioning system directly exposed the airflow to those parts, and thus, the thermal sensations were probably enhanced more than the temperature setting. Moreover, the differences between the thermal sensation level and the neutral sensation level in the arm, thigh, and leg at Q5 are not decreasing comparing to those at Q4. This is because reason the proposed air conditioning in this study did not distribute the airflow to those parts well.
Second, for the thermal comfort, it is also significant to investigate how much the thermal comfort level finally increased by changing the temperature setting. To this end, the difference in the thermal comfort level before and after (i.e., at Q4 and Q6) changing the temperature setting was examined. Specifically, the thermal comfort level at Q6 minus the one at Q4 was checked. Table 11, Table 12 and Table 13 show the value for each part of the body for the hot-sensitive group, cold-sensitive group, and neutral group (denoted as Q6-Q4). Note that the colored cells indicate that the difference in the thermal comfort level is more than 1.
As seen from Table 11, Table 12 and Table 13, for the cold-sensitive group, the thermal comfort level was improved by changing the temperature setting in most of the parts of the body. As mentioned before, it means that the setting temperature of the previous study makes cold-sensitive people feel cold. Looking at each part of the body, Table 12 shows that the thermal comfort level in the forearm and foot improved compared to other parts of the body. This is because cold-sensitive people tend to feel more comfortable by changing the temperature setting (increasing the temperature) due to the high sensitivity in the extremity areas to cold [44]. From Table 12, it can be concluded that the strategy of changing the temperature setting in the proposed method works effectively for cold-sensitive people.

5. Discussion

This section discusses whether the evaluation results were reliable by performing a T-test, and whether the comfort was improved when the thermal sensation approached the neutral sensation.
For the thermal sensation, as shown in the result, according to Figure 11, the thermal sensation finally approached the neutral sensation when the temperature setting in the proposed method was applied. By performing a T-test, it is possible to clarify whether the difference between the thermal sensation and the neutral sensation decreased due to the proposed method, by comparing the result with the temperature setting of the proposed method (Q6) to the result with the one of the previous study (Q4). Since the neutral sensation is the target sensation, the differences between the thermal sensation results at Q6 and Q4 and neutral sensation are compared by t-test. At the same time, all the difference values were converted to the absolute values. Table 14 shows p-value for the thermal sensation derived by the one-sided t-test. As with thermal comfort, p-values less than 2.5% are shown in yellow.
According to Table 14, there are significant differences in forearm, back, hip, and foot. The extremities, such as forearm and foot, are considered to be sensitive to thermal sensation according to [45,46]. Thus, those parts have significant differences. On the other hand, back and hip are the parts directly exposed to the airflow from the proposed air-conditioning system; thus, those parts are also sensitive to thermal sensation, resulting in having significant differences. As for the parts which do not have significant differences, the thermal sensation already approached the neutral sensation when the temperature settings of the previous study were applied (Q4). As mentioned in the evaluation result section, the setting temperature of the previous study is appropriate for the hot-sensitive and neutral people. That is why these parts do not have the significant differences. This means that the proposed method is more effective for the parts of the body (forearm, back, hip, and foot) that could not be improved effectively in the previous study.
For thermal comfort, its level increased after changing the temperature setting in the proposed method looking at the result shown in Figure 12. Then, a t-test was performed to clarify whether the thermal comfort in the proposed method (Q6) increased significantly compared to the one when the temperature settings of the previous study were applied (Q4). The data used for the t-test were taken from all the 20 subjects. A one-sided test was performed with a significant level of 0.5%. Table 14 shows p-value derived from the one-sided t-test for thermal comfort. For the one-sided test, p-value less than 2.5% indicates a significant difference. In Table 15, p-values less than 2.5% are shown in yellow.
Table 15 shows that all the body parts except head have significant differences. Regarding head, it is less sensitive to temperature unless it is very hot [23], resulting in no significant difference. Therefore, it can be concluded that the thermal comfort increased due to changing the temperature setting in the proposed method.
In this study, it is hypothesized that thermal comfort improves when the thermal sensation approaches the neutral sensation. Table 16 shows the correlation coefficient between the abovementioned two values, i.e., the difference between the thermal sensation level and the neutral sensation level, and the thermal comfort level, from Q1 to Q6 for each part of the body. If the correlation is negative, it means that the thermal comfort level is larger when the thermal sensation level is close to the neutral sensation. In Table 16, the green cells indicate the negative correlations, and the red values indicate particularly strong negative correlations of 0.7 or more.
From the result, it is evident that most parts of the body are negatively correlated, and the tendency is especially stronger for the cold-sensitive group. This is because cold-sensitive people are more sensitive to ambient temperatures. In other words, cold-sensitive people are more likely to improve their comfort level. Furthermore, shoulders and back have a very high negative correlation of more than 0.9. The reason for this is that the shoulders and backs are the places where the wind from the air conditioning system directly flows and the air volume is even higher. The head, arm, and thigh have a positive correlation. This is because the proposed seat-type air conditioning system could not provide airflow there properly due to the location of the outlet designed in this study. In other words, if the airflow with equal volume can be distributed to each part of the body, the thermal comfort level in all body parts can be improved.

6. Conclusions

In this study, in order to improve the thermal comfort of individuals, a new seat-type air conditioning system was proposed, and the appropriate temperature setting was examined for hot-sensitive, cold-sensitive, and neutral people who have different characteristics of thermal sensation. As a result, it was found that the temperature setting in the previous study was appropriate for hot-sensitive people, but inappropriate and even uncomfortable for cold-sensitive people [14]. On the other hand, the proposed method of changing the temperature setting by 2.5 °C for one scale of the thermal sensation level improved the thermal comfort particularly high for cold-sensitive people. This is because cold-sensitive people are more sensitive to ambient temperature. Furthermore, for the above three types of bodily tendencies, the thermal comfort level was improved by changing the temperature setting as confirmed in t-tests. It can be concluded that the thermal sensation of all body parts approached comfort by changing the temperature setting in the proposed seat-type air conditioning based on the thermal sensations. However, the air conditioning proposed in this study differs considerably with respect to the amount of airflow delivered to different parts of the body, and the degree of influence of the thermal sensation differed. It was found that the proposed air conditioning system needs to be improved to distribute airflow of equal volume to all parts of the body. Furthermore, in this study, the thermal sensation was obtained from the subjective evaluation. However, as a prospect, it is desirable to propose a system that automatically predicts the thermal sensation so that passengers do not have to bother with it. In addition, further research on this study should include a mechanism for predicting the thermal sensations considering the thermal sensitivity characteristics. At that time, the appropriate degree of change in temperature setting, as identified in this study, can be adapted.

Author Contributions

Conceptualization, Y.M.; methodology, Y.M.; validation, Y.M.; software, Y.M.; writing—original draft preparation, Y.M.; writing—review and editing, M.K., P.X.T. and E.K.; visualization, Y.M.; supervision, E.K.; project administration, E.K. All authors have read and agreed to the published version of the manuscript.

Funding

This research received no external funding.

Data Availability Statement

Not applicable.

Conflicts of Interest

The authors declare no conflict of interest. The funders had no role in the design of the study; in the collection, analyses, or interpretation of data; in the writing of the manuscript; or in the decision to publish the results.

References

  1. Koh, C.H. Commercial air travel for passengers with cardiovascular disease: Stressors of flight and aeromedical impact. Curr. Probl. Cardiol. 2021, 46, 100746. [Google Scholar] [CrossRef] [PubMed]
  2. Hinninghofen, H.; Enck, P. Passenger well-being in airplanes. Auton. Neurosci. 2006, 129, 80–85. [Google Scholar] [CrossRef] [PubMed]
  3. Liping, P.; Jie, Z.; Xiaoru, W.; Jun, F.; Shuxin, L. Field study of neutrality cabin temperature for Chinese passenger in economy class of civil aircraft. J. Therm. Biol. 2018, 78, 312–319. [Google Scholar] [CrossRef] [PubMed]
  4. da Silva, M.G.; Broday, E.E.; Ruivo, C.R. Indoor Climate Quality Assessment in civil aircraft cabins: A field study. Therm. Sci. Eng. Prog. 2022, 37, 101581. [Google Scholar] [CrossRef]
  5. Fang, Z.; Liu, H.; Li, B.; Du, X.; Baldwin, A. Investigation of the effects of temperature for supplied air from a personal nozzle system on thermal comfort of air travelers. Build. Environ. 2017, 126, 82–97. [Google Scholar] [CrossRef]
  6. Ali, A.M.; Shukor, S.A.; Rahim, N.A.; Razlan, Z.M.; Jamal, Z.A.Z.; Kohlhof, K. IoT-based smart air conditioning control for thermal comfort. In Proceedings of the IEEE International Conference on Automatic Control and Intelligent Systems (I2CACIS), Selangor, Malaysia, 29–29 June 2019; pp. 289–294. [Google Scholar] [CrossRef]
  7. Tanaka, K.; Wada, K.; Kikuchi, T.; Kawakami, H.; Tanaka, K.; Takai, H. Study on air-conditioning control system considering individual thermal sensation. Sustainable Built Environment Conference 2019 Tokyo (SBE19Tokyo) Built Environment in an era of climate change, The University of Tokyo Japan, 6–7 August 2019. IOP Conf. Ser. Earth Environ. Sci. 2019, 294, 012066. [Google Scholar] [CrossRef]
  8. Yato, Y.; Tada, K.; Oguri, H. Analysis of blood volume in lower leg for improving leg swelling: Lowering and inhibition of lower leg stasis by a heat stimulus. IEICE Tech. Rep. 2009, 108, 153–158. [Google Scholar]
  9. Wang, Z.; de Dear, R.; Luo, M.; Lin, B.; He, Y.; Ghahramani, A.; Zhu, Y. Individual difference in thermal comfort: A literature review. Build. Environ. 2018, 138, 181–193. [Google Scholar] [CrossRef]
  10. Matsumoto, Y.; Kanamaru, M.; Tan, P.X.; Kamioka, E. Clarifying Optimum Setting Temperatures and Airflow Positions for Personal Air Conditioning System on Flight. Baghdad Sci. J. 2021, 18, 1431–1440. [Google Scholar] [CrossRef]
  11. Chirila, A.I.; Deaconu, I.D.; Stanculescu, M.; Navrapescu, V. On electrical heating system of vehicles seats. Bul. Inst. Politeh. Iaşi, Secţ. 2018, 64, 68. [Google Scholar]
  12. Oi, H.; Tabata, K.; Naka, Y.; Takeda, A.; Tochihara, Y. Effects of heated seats in vehicles on thermal comfort during the initial warm-up period. Appl. Ergon. 2012, 43, 360–367. [Google Scholar] [CrossRef]
  13. Pierce, W.; Janczewski, J.N.; Roethlisberger, B.; Janczewski, M.G. Air quality on commercial aircraft. ASHRAE J. 1999, 41, 26–34. [Google Scholar]
  14. Liu, J.; Foged, I.W.; Moeslund, T.B. Automatic estimation of clothing insulation rate and metabolic rate for dynamic thermal comfort assessment. Pattern. Anal. Appl. 2022, 25, 619–634. [Google Scholar] [CrossRef]
  15. Alam, M.S.; Muthiah, A.; Salve, U.R. Appraisal of thermal comfort in non-air-conditioned and air-conditioned railway pantry car kitchens. Int. J. Integr. Eng. 2020, 12, 318–327. Available online: https://publisher.uthm.edu.my/ojs/index.php/ijie/article/view/5071 (accessed on 20 December 2022). [CrossRef]
  16. Zhao, Y.; Liu, Z.; Li, X.; Zhao, M.; Liu, Y. A modified turbulence model for simulating airflow aircraft cabin environment with mixed convection. Build. Simul. 2020, 13, 665–675. [Google Scholar] [CrossRef] [Green Version]
  17. Spengler, J.D.; Wilson, D.G. Air quality in aircraft. Proc. Inst. Mech. Eng. E J. Process Mech. Eng. 2003, 217, 323–335. [Google Scholar] [CrossRef]
  18. Fang, Z.; Liu, H.; Li, B.; Cheng, Y. Thermal comfort and skin temperature responses to the supplied air from personal air nozzles in aircraft cabins. Indoor. Built. Environ. 2018, 27, 831–845. [Google Scholar] [CrossRef]
  19. Wu, Y.; Liu, H.; Li, B.; Cheng, Y.; Tan, D.; Fang, Z. Thermal comfort criteria for personal air supply in aircraft cabins in winter. Build. Environ. 2017, 125, 373–382. [Google Scholar] [CrossRef]
  20. You, R.; Zhang, Y.; Zhao, X.; Lin, C.H.; Wei, D.; Liu, J.; Chen, Q. An innovative personalized displacement ventilation system for airliner cabins. Build. Environ. 2018, 137, 41–50. [Google Scholar] [CrossRef]
  21. Mboreha, C.A.; Jianhong, S.; Yan, W.; Zhi, S.; Yantai, Z. Investigation of thermal comfort on innovative personalized ventilation systems for aircraft cabins: A numerical study with computational fluid dynamics. Therm. Sci. Eng. Prog. 2021, 26, 101081. [Google Scholar] [CrossRef]
  22. Sun, J.; Chanfiou, A.M.; Wang, Y.; Sun, Z. A Review on Effects of Personalized Ventilation Systems on Air Quality and Thermal Comfort in Aircraft Cabin Mini-Environments. Trans. Nanjing Univ. Aeronaut. Astronaut. 2022, 39, 121–142. [Google Scholar] [CrossRef]
  23. Zhang, H.; Arens, E.; Huizenga, C.; Han, T. Thermal sensation and comfort models for non-uniform and transient environments: Part I: Local sensation of individual body parts. Build. Environ. 2010, 45, 380–388. [Google Scholar] [CrossRef]
  24. Rawal, R.; Schweiker, M.; Kazanci, O.B.; Vardhan, V.; Jin, Q.; Duanmu, L. Personal comfort systems: A review on comfort, energy, and economics. Energy Build. 2020, 214, 109858. [Google Scholar] [CrossRef]
  25. Jadhav, O.A.; Chaitanya, S.V. Performance Analysis of Cool Air Ventilated Seat Cover. Int. J. Sci. Technol. Eng. 2018, 5, 112–117. [Google Scholar]
  26. Lee, M.; Shin, Y.; Lee, H.; Cho, H. Investigation of bio-signal changes of occupants resting in buildings using local cooling and heating seats. Energy Build. 2021, 245, 111092. [Google Scholar] [CrossRef]
  27. Fojtlín, M.; Psikuta, A.; Fišer, J.; Pokorný, J.; Toma, R.; Annaheim, S.; Jicha, M.; Rossi, R.M. Thermal model of an unconditioned, heated and ventilated seat to predict human thermo-physiological response and local thermal sensation. Build. Environ. 2020, 169, 106571. [Google Scholar] [CrossRef]
  28. Hori, Y.; Ito, N.; Sunaga, N.; Mori, K. Evaluation of thermal comfort in a non-uniform thermal environment. J. Archit. Plann. Environ. Eng. AIJ 1997, 501, 37–44. [Google Scholar] [CrossRef]
  29. Yamasaki, K.; Nojiri, K.; Sato, Y.; Ishibashi, K.; Higuchi, S.; Maeda, T. Effects of Sex, Season and Susceptibility to the Heat and the Cold on Themoregulatory Responses in Japanese Adults. Jpn. Soc. Physiol. Anthropol. 2006, 11, 21–28. [Google Scholar] [CrossRef]
  30. Yamasaki, K.; Nojiri, K.; Sato, Y.; Yokoi, M.; Ishibashi, K.; Higuchi, S.; Maeda, T. Comparative Study of Susceptibility to the Heat and the Cold on Themoregulatory Responses in Japanese Female Adults. Jpn. Soc. Physiol. Anthropol. 2006, 11, 13–20. [Google Scholar] [CrossRef]
  31. Zhang, H.; Arens, E.; Huizenga, C.; Han, T. Thermal sensation and comfort models for non-uniform and transient environments, part II: Local comfort of individual body parts. Build. Environ. 2010, 45, 389–398. [Google Scholar] [CrossRef] [Green Version]
  32. Zhang, Y.; Zhao, R. Relationship between thermal sensation and comfort in non-uniform and dynamic environments. Build. Environ. 2009, 44, 1386–1391. [Google Scholar] [CrossRef]
  33. Wu, Q.; Liu, J.; Zhang, L.; Zhang, J.; Jiang, L. Study on thermal sensation and thermal comfort in environment with moderate temperature ramps. Build. Environ. 2020, 171, 106640. [Google Scholar] [CrossRef]
  34. Thermal Environmental Conditions for Human Occupancy. Available online: https://www.ashrae.org/file%20library/technical%20resources/standards%20and%20guidelines/standards%20addenda/55_2017_d_20200731.pdf (accessed on 1 December 2022).
  35. Wang, D.; Chen, G.; Song, C.; Liu, Y.; He, W.; Zeng, T.; Liu, J. Experimental study on coupling effect of indoor air temperature and radiant temperature on human thermal comfort in non-uniform thermal environment. Build. Environ. 2019, 165, 106387. [Google Scholar] [CrossRef]
  36. Song, C.; Duan, G.; Wang, D.; Liu, Y.; Du, H.; Chen, G. Study on the influence of air velocity on human thermal comfort under non-uniform thermal environment. Build. Environ. 2021, 196, 107808. [Google Scholar] [CrossRef]
  37. Okumura, M. Psychological and Physiological Reaction in Thermal Environment Change. A Case of Heat Shock through a Pathway in Winter. Graduation Thesis, College of Science and Engineering, Ritsumeikan University, Shiga, Japan, 2008. [Google Scholar]
  38. Zhang, H. Human Thermal Sensation and Comfort in Transient and Non-Uniform Thermal Environments; University of California: Berkeley, CA, USA, 2003. [Google Scholar]
  39. INTERNATIONAL STANDARD ISO 10551—SIS. Available online: https://www.sis.se/api/document/preview/80012745/ (accessed on 1 December 2022).
  40. Griefahn, B.; Konemund, C.; Gehiring, U. The significance of air velocity and turbulence intensity for responses to horizontal drafts on a constant air temperature of 23 °C. Int. J. Ind. Ergon. 2000, 26, 639–649. [Google Scholar] [CrossRef]
  41. Havenith, G.; Fiala, D.; Błazejczyk, K.; Richards, M.; Bröde, P.; Holmér, I.; Jendritzky, G. The UTCI-clothing model. Int. J. Biometeorol. 2012, 56, 461–470. [Google Scholar] [CrossRef] [Green Version]
  42. Rijal, H.B.; Humphreys, M.A.; Nicol, J.F. Adaptive model and the adaptive mechanisms for thermal comfort in Japanese dwellings. Energy Build. 2019, 202, 109371. [Google Scholar] [CrossRef]
  43. Thermal Environmental Conditions for Human Occupancy. Available online: http://ierga.com/hr/wp-content/uploads/sites/2/2017/10/ASHRAE-55-2013.pdf (accessed on 1 January 2023).
  44. Yamazaki, F.; Fujita, M.; Watanabe, Y. The Thermal Sensation and Cutaneous Vasomotor Response to Local Thermal Load in Winter and Summer Seasons in Young Women with a Cold Constitution; Yamaguchi Prefectural University: Yamaguchi, Japan, 2018; Volume 11, pp. 1–9. [Google Scholar]
  45. Arens, E.; Zhang, H.; Huizenga, C. Partial-and whole-body thermal sensation and comfort—Part I: Uniform environmental conditions. J. Therm. Biol. 2006, 31, 53–59. [Google Scholar] [CrossRef] [Green Version]
  46. Wang, D.; Zhang, H.; Arens, E.; Huizenga, C. Observations of upper-extremity skin temperature and corresponding overall-body thermal sensations and comfort. Build. Environ. 2007, 42, 3933–3943. [Google Scholar] [CrossRef]
Figure 1. Predicted airflow with inlets (red-colored) and outlets (blue-colored).
Electronics 12 00371 g001
Figure 2. Inlets (red-colored) and outlets (blue-colored) for personal air-conditioning system; outlets are positioned in six different areas.
Electronics 12 00371 g002
Figure 3. Flowchart of verification experiment.
Electronics 12 00371 g003
Figure 4. Relation between thermal comfort and thermal sensation.
Electronics 12 00371 g004
Figure 5. Experimental procedure.
Electronics 12 00371 g005
Figure 6. Thermal sensation evaluation index.
Electronics 12 00371 g006
Figure 7. Thermal comfort evaluation index.
Electronics 12 00371 g007
Figure 8. (a) Proposed air conditioning system and its experimental environment; (b) practical system used in verification experiment.
Electronics 12 00371 g008
Figure 9. Verification experiment environment.
Electronics 12 00371 g009
Figure 10. Subject’s clothes.
Electronics 12 00371 g010
Figure 11. Average thermal sensation for each part of the body.
Electronics 12 00371 g011
Figure 12. Average thermal comfort for each part of the body.
Electronics 12 00371 g012
Figure 13. Comparison of thermal sensation and thermal comfort, and tendency to feel hot and cold.
Electronics 12 00371 g013
Table 1. Ideal temperature distribution for each body part.
Body PartsHeadArmForearmBackChestHipThighLegFoot
Optimum operative temperature (°C)22.323.723.323.622.923.325.326.326.6
Table 2. Optimum setting temperature for personal air-conditioning system and body parts affected by each air conditioning. (F: front seat depicted as yellow-colored cells, S: target seat depicted as bule-colored cells).
No. of Air-Conditioning123456
Location of the outletFSFSFSFSFSFS
Setting temperature- 14>- 15161616>16221729- 29-
Affected part- Head- Upper backArmChestForearmMiddle backThighHipLeg- Foot-
Table 3. Thermal sensation evaluation index.
DefinitionNumerical Value
Cold−3
Cool−2
Slightly cool−1
Neutral0
Slightly warm1
Warm2
Hot3
Table 4. Approximate curve equations.
No.EquationR2p
1TSV = 0.443t − 11.4490.979<0.005
2TSV = 0.376t − 9.5690.986<0.005
3TSV = 0.378t − 10.1370.935<0.005
4TSV = 0.432t − 11.2000.964<0.005
t is ambiant temperature.
Table 5. Required temperature change to vary thermal sensation index by one scale (Table 3).
No.The Required Temperature Change to Change the Hot/Cold Index by One Scale (°C)
12.257
22.660
32.646
42.315
Mean2.469
Table 6. Mean value of subjects.
Body ConditionsMean Value
Height162.15 cm
Weight52.11 kg
Health conditionnormal–slightly good
Duration of sleep on the previous day6.4 h
Table 7. The thermal sensitivity characteristics.
Thermal Sensitivity CharacteristicsNumber of People
Hot-sensitive8 people
Cold-sensitive5 people
Neither7 people
Table 8. Difference between thermal sensation level and neutral sensation level at Q4 and Q5 for the hot-sensitive people.
Sensation
Difference
HeadArmForearmShoulderBackChestHipThighLegFoot
Q40.90.10.01.01.10.10.50.40.00.1
Q50.50.40.00.81.10.10.30.10.10.3
Table 9. Difference between thermal sensation level and neutral sensation level at Q4 and Q5 for the cold-sensitive group.
Sensation
Difference
HeadArmForearmShoulderBackChestHipThighLegFoot
Q41.41.411.41.80.81.200.20.6
Q50.200.40.60.40.20.20.20.20.4
Table 10. Difference between thermal sensation level and neutral sensation level at Q4 and Q5 for the neutral group.
Sensation
Difference
HeadArmForearmShoulderBackChestHipThighLegFoot
Q40.70.30.40.91.91.30.60.10.10.6
Q50.40.40.10.90.90.90.00.30.30.0
Table 11. Difference between thermal comfort levels at Q4 and Q6 for the hot-sensitive group.
Comfort DifferenceHeadArmForearmShoulderBackChestHipThighLegFoot
Q6-Q40.50.50.31.40.80.00.80.60.80.8
Table 12. Difference between thermal comfort level at Q4 and Q6 for the cold-sensitive group.
Comfort DifferenceHeadArmForearmShoulderBackChestHipThighLegFoot
Q6-Q41.01.01.20.80.60.41.20.80.81.0
Table 13. Difference between thermal comfort level at Q4 and Q6 for the neutral group.
Comfort DifferenceHeadArmForearmShoulderBackChestHipThighLegFoot
Q6-Q40.00.40.40.31.00.90.40.40.30.5
Table 14. p-value of the thermal sensation.
Head ArmForearmShoulderBackChestHipThighLegsFoot
0.03460.11480.00610.19240.00290.14830.00010.03620.14830.0188
Table 15. p-value of the thermal comfort.
Head ArmForearmShoulderBackChestHipThighLegsFoot
0.03520.00510.00870.00290.00290.02320.00270.00340.00510.0004
Table 16. Correlation between the difference of the thermal sensation level and the neutral sensation and the thermal comfort sensation for the hot-sensitive, cold-sensitive, and neutral people.
HeadArmForearmShoulderBackChestHipThighLegsFoot
Hot0.3318390.115748−0.52699−0.63573−0.52638−0.89995−0.27864−0.8929−0.13841−0.72733
Cold−0.7308−0.70365−0.63267−0.93381−0.92637−0.75996−0.526540.766685-−0.26463
None0.135250.529813−0.07379−0.61859−0.92532−0.79878−0.960110.7745970.820652−0.77865
Disclaimer/Publisher’s Note: The statements, opinions and data contained in all publications are solely those of the individual author(s) and contributor(s) and not of MDPI and/or the editor(s). MDPI and/or the editor(s) disclaim responsibility for any injury to people or property resulting from any ideas, methods, instructions or products referred to in the content.

