
Modified Aquila Optimizer with Stacked Deep Learning-Based Sentiment Analysis of COVID-19 Tweets

 , ,
, ,
Abstract
:1. Introduction
2. Related Works
3. The Proposed Model
3.1. Data Pre-Processing and Word Embedding
3.2. Tweet Data Classification Using ASBiLSTM Model
3.3. Hyperparameter Tuning Using MAO Algorithm
- Step 1: Vertical Dive Attack
- Step 2: Modified Full Search with a Short Glide Attack
- Step 3: Modified Search Around Prey and Attack
- Step 4: Walk and Grab Attack (S)
4. Results and Discussion
4.1. Result Analysis
4.2. Discussion
5. Conclusions
Author Contributions
Funding
Data Availability Statement
Conflicts of Interest
References
- Anuradha, K.; Parvathy, M. Multi-label Emotion Classification of COVID-19 Tweets with Deep Learning and Topic Modelling. Comput. Syst. Sci. Eng. 2023, 46, 3005–3021. [Google Scholar] [CrossRef]
- Deva Priya, M.; Saranya, M.; Sharaha, N.; Tamizharasi, S. Classification of COVID-19 tweets using deep learning classifiers. In Proceedings of International Conference on Recent Trends in Computing: ICRTC 2021; Springer: Singapore, 2022; pp. 213–225. [Google Scholar]
- Bangyal, W.H.; Qasim, R.; Rehman, N.U.; Ahmad, Z.; Dar, H.; Rukhsar, L.; Aman, Z.; Ahmad, J. Detection of fake news text classification on COVID-19 using deep learning approaches. Comput. Math. Methods Med. 2021, 2021, 1–14. [Google Scholar] [CrossRef] [PubMed]
- Ainapure, B.S.; Pise, R.N.; Reddy, P.; Appasani, B.; Srinivasulu, A.; Khan, M.S.; Bizon, N. Sentiment Analysis of COVID-19 Tweets Using Deep Learning and Lexicon-Based Approaches. Sustainability 2023, 15, 2573. [Google Scholar] [CrossRef]
- Fattoh, I.E.; Kamal Alsheref, F.; Ead, W.M.; Youssef, A.M. Semantic sentiment classification for COVID-19 tweets using universal sentence encoder. Comput. Intell. Neurosci. 2022, 2022, 6354543. [Google Scholar] [CrossRef]
- Oumaima, S.; Soulaimane, K.; Omar, B. Artificial Intelligence in Predicting the Spread of Coronavirus to Ensure Healthy Living for All Age Groups. In Emerging Trends in ICT for Sustainable Development: The Proceedings of NICE2020 International Conference; Springer International Publishing: Cham, Switzerland, 2021; pp. 11–18. [Google Scholar]
- Wang, T.; Deng, X.N. User characteristics, social media use, and fatigue during the coronavirus pandemic: A stressor–strain–outcome framework. Comput. Hum. Behav. Rep. 2022, 7, 100218. [Google Scholar] [CrossRef]
- Sak, S.; Yavuzyiğit, B.B. Striving for wellbeing digitally in the city amidst the pandemic: Solidarity through Twitter in Ankara. Habitat Int. 2023, 137, 102846. [Google Scholar] [CrossRef]
- Stitini, O.; Twil, A.; Kaloun, S.; Bencharef, O. How can we analyse emotions on twitter during an epidemic situation? A features engineering approach to evaluate people’s emotions during the COVID-19 pandemic. J. Tianjin Univ. Sci. Technol. 2021, 54. [Google Scholar] [CrossRef]
- Sitaula, C.; Basnet, A.; Mainali, A.; Shahi, T.B. Deep learning-based methods for sentiment analysis on Nepali COVID-19-related tweets. Comput. Intell. Neurosci. 2021, 2021, 2158184. [Google Scholar] [CrossRef]
- Klein, A.Z.; Kunatharaju, S.; O’Connor, K.; Gonzalez-Hernandez, G. Automatically Identifying Self-Reports of COVID-19 Diagnosis on Twitter: An Annotated Data Set, Deep Neural Network Classifiers, and a Large-Scale Cohort. J. Med. Internet Res. 2023, 25, e46484. [Google Scholar] [CrossRef]
- Shahi, T.B.; Sitaula, C.; Paudel, N. A hybrid feature extraction method for Nepali COVID-19-related tweets classification. Comput. Intell. Neurosci. 2022, 2022, 5681574. [Google Scholar] [CrossRef]
- Joloudari, J.H.; Hussain, S.; Nematollahi, M.A.; Bagheri, R.; Fazl, F.; Alizadehsani, R.; Lashgari, R.; Talukder, A. BERT-deep CNN: State of the art for sentiment analysis of COVID-19 tweets. Soc. Netw. Anal. Min. 2023, 13, 99. [Google Scholar] [CrossRef]
- Hussain, S.; Ayoub, M.; Yu, Y.; Wahid, J.A.; Khan, A.; Moller, D.P.; Weiyan, H. Ensemble Deep Learning Framework for Situational Aspects-Based Annotation and Classification of International Student’s Tweets during COVID-19. Comput. Mater. Contin. 2023, 75, 5355–5377. [Google Scholar] [CrossRef]
- Qorib, M.; Oladunni, T.; Denis, M.; Ososanya, E.; Cotae, P. COVID-19 Vaccine Hesitancy: A Global Public Health and Risk Modelling Framework Using an Environmental Deep Neural Network, Sentiment Classification with Text Mining and Emotional Reactions from COVID-19 Vaccination Tweets. Int. J. Environ. Res. Public Health 2023, 20, 5803. [Google Scholar] [CrossRef] [PubMed]
- Umer, M.; Sadiq, S.; Nappi, M.; Sana, M.U.; Ashraf, I. ETCNN: Extra Tree and Convolutional Neural Network-based Ensemble Model for COVID-19 Tweets Sentiment Classification. Pattern Recognit. Lett. 2022, 164, 224–231. [Google Scholar] [CrossRef] [PubMed]
- Sunagar, P.; Kanavalli, A.; Poornima, V.; Hemanth, V.M.; Sreeram, K.; Shivakumar, K.S. Classification of COVID-19 tweets using deep learning techniques. In Inventive Systems and Control: Proceedings of ICISC 2021; Springer: Singapore, 2021; pp. 123–136. [Google Scholar]
- Arbane, M.; Benlamri, R.; Brik, Y.; Alahmar, A.D. Social media-based COVID-19 sentiment classification model using Bi-LSTM. Expert Syst. Appl. 2023, 212, 118710. [Google Scholar] [CrossRef] [PubMed]
- Tatineni, P.; Babu, B.S.; Kanuri, B.; Rao, G.R.K.; Chitturi, P.; Naresh, C. March. Post COVID-19 Twitter user’s Emotions Classification using Deep Learning Techniques in India. In Proceedings of the 2021 International Conference on Artificial Intelligence and Smart Systems (ICAIS), Coimbatore, India, 25–27 March 2021; pp. 338–343. [Google Scholar]
- Vaddadi, V.R.; Das, S.; Anupama, V. 2022, April. Exploration of COVID 19 Tweets Data for the Prediction of Negative Ontologies through Deep Learning Techniques. In Proceedings of the 2022 IEEE International Conference on Distributed Computing and Electrical Circuits and Electronics (ICDCECE), Ballari, India, 23–24 April 2022; pp. 1–6. [Google Scholar]
- Chakraborty, A.K.; Das, S.; Kolya, A.K. Sentiment analysis of COVID-19 tweets using evolutionary classification-based LSTM model. In Proceedings of Research and Applications in Artificial Intelligence: RAAI 2020; Springer: Singapore, 2021; pp. 75–86. [Google Scholar]
- Said, H.; Tawfik, B.S.; Makhlouf, M.A. A Deep Learning Approach for Sentiment Classification of COVID-19 Vaccination Tweets. Int. J. Adv. Comput. Sci. Appl. 2023, 14, 530–538. [Google Scholar] [CrossRef]
- Raheja, S.; Asthana, A. Sentiment Analysis of Tweets During the COVID-19 Pandemic Using Multinomial Logistic Regression. Int. J. Softw. Innov. (IJSI) 2023, 11, 1–16. [Google Scholar] [CrossRef]
- Mohammed, S.S.; Menaouer, B.; Zohra, A.F.F.; Nada, M. Sentiment analysis of COVID-19 tweets using adaptive neuro-fuzzy inference system models. Int. J. Softw. Sci. Comput. Intell. (IJSSCI) 2022, 14, 1–20. [Google Scholar] [CrossRef]
- Jain, R.; Bawa, S.; Sharma, S. Sentiment analysis of COVID-19 tweets by machine learning and deep learning classifiers. In Advances in Data and Information Sciences: Proceedings of ICDIS 2021; Springer: Singapore, 2022; pp. 329–339. [Google Scholar]
- Kaur, H.; Ahsaan, S.U.; Alankar, B.; Chang, V. A proposed sentiment analysis deep learning algorithm for analyzing COVID-19 tweets. Inf. Syst. Front. 2021, 23, 1417–1429. [Google Scholar] [CrossRef]
- Ma, Z.; Mei, G. A hybrid attention-based deep learning approach for wind power prediction. Appl. Energy 2022, 323, 119608. [Google Scholar] [CrossRef]
- Mumenin, K.M.; Biswas, P.; Khan, M.A.M.; Alammary, A.S.; Nahid, A.A. A Modified Aquila-Based Optimized XGBoost Framework for Detecting Probable Seizure Status in Neonates. Sensors 2023, 23, 7037. [Google Scholar] [CrossRef] [PubMed]
- Available online: https://www.kaggle.com/competitions/sentimentanalysisof-covid-19-related-tweets/data?select=validation.csv (accessed on 12 March 2023).
- Vaiyapuri, T.; Jagannathan, S.K.; Ahmed, M.A.; Ramya, K.C.; Joshi, G.P.; Lee, S.; Lee, G. Sustainable Artificial Intelligence-Based Twitter Sentiment Analysis on COVID-19 Pandemic. Sustainability 2023, 15, 6404. [Google Scholar] [CrossRef]
- Singh, C.; Imam, T.; Wibowo, S.; Grandhi, S. A deep learning approach for sentiment analysis of COVID-19 reviews. Appl. Sci. 2022, 12, 3709. [Google Scholar] [CrossRef]


| Class | No. of Instances |
|---|---|
| Optimistic | 250 |
| Thankful | 250 |
| Empathetic | 250 |
| Pessimistic | 250 |
| Anxious | 250 |
| Sad | 250 |
| Annoyed | 250 |
| Denial | 250 |
| Surprise | 250 |
| Official report | 250 |
| Joking | 250 |
| Total Number of Instances | 2750 |
| Class | Jaccard Index | ||||
|---|---|---|---|---|---|
| TR set (70%) | |||||
| Optimistic | 99.17 | 96.51 | 94.32 | 95.40 | 91.21 |
| Thankful | 98.60 | 92.47 | 92.97 | 92.72 | 86.43 |
| Empathetic | 99.32 | 94.32 | 98.22 | 96.23 | 92.74 |
| Pessimistic | 99.22 | 97.11 | 94.38 | 95.73 | 91.80 |
| Anxious | 99.12 | 92.67 | 98.33 | 95.42 | 91.24 |
| Sad | 99.22 | 94.67 | 96.39 | 95.52 | 91.43 |
| Annoyed | 99.69 | 100.00 | 96.84 | 98.40 | 96.84 |
| Denial | 98.96 | 92.35 | 96.57 | 94.41 | 89.42 |
| Surprise | 99.43 | 100.00 | 93.45 | 96.62 | 93.45 |
| Official report | 99.12 | 92.44 | 97.55 | 94.93 | 90.34 |
| Joking | 99.22 | 99.38 | 92.00 | 95.55 | 91.48 |
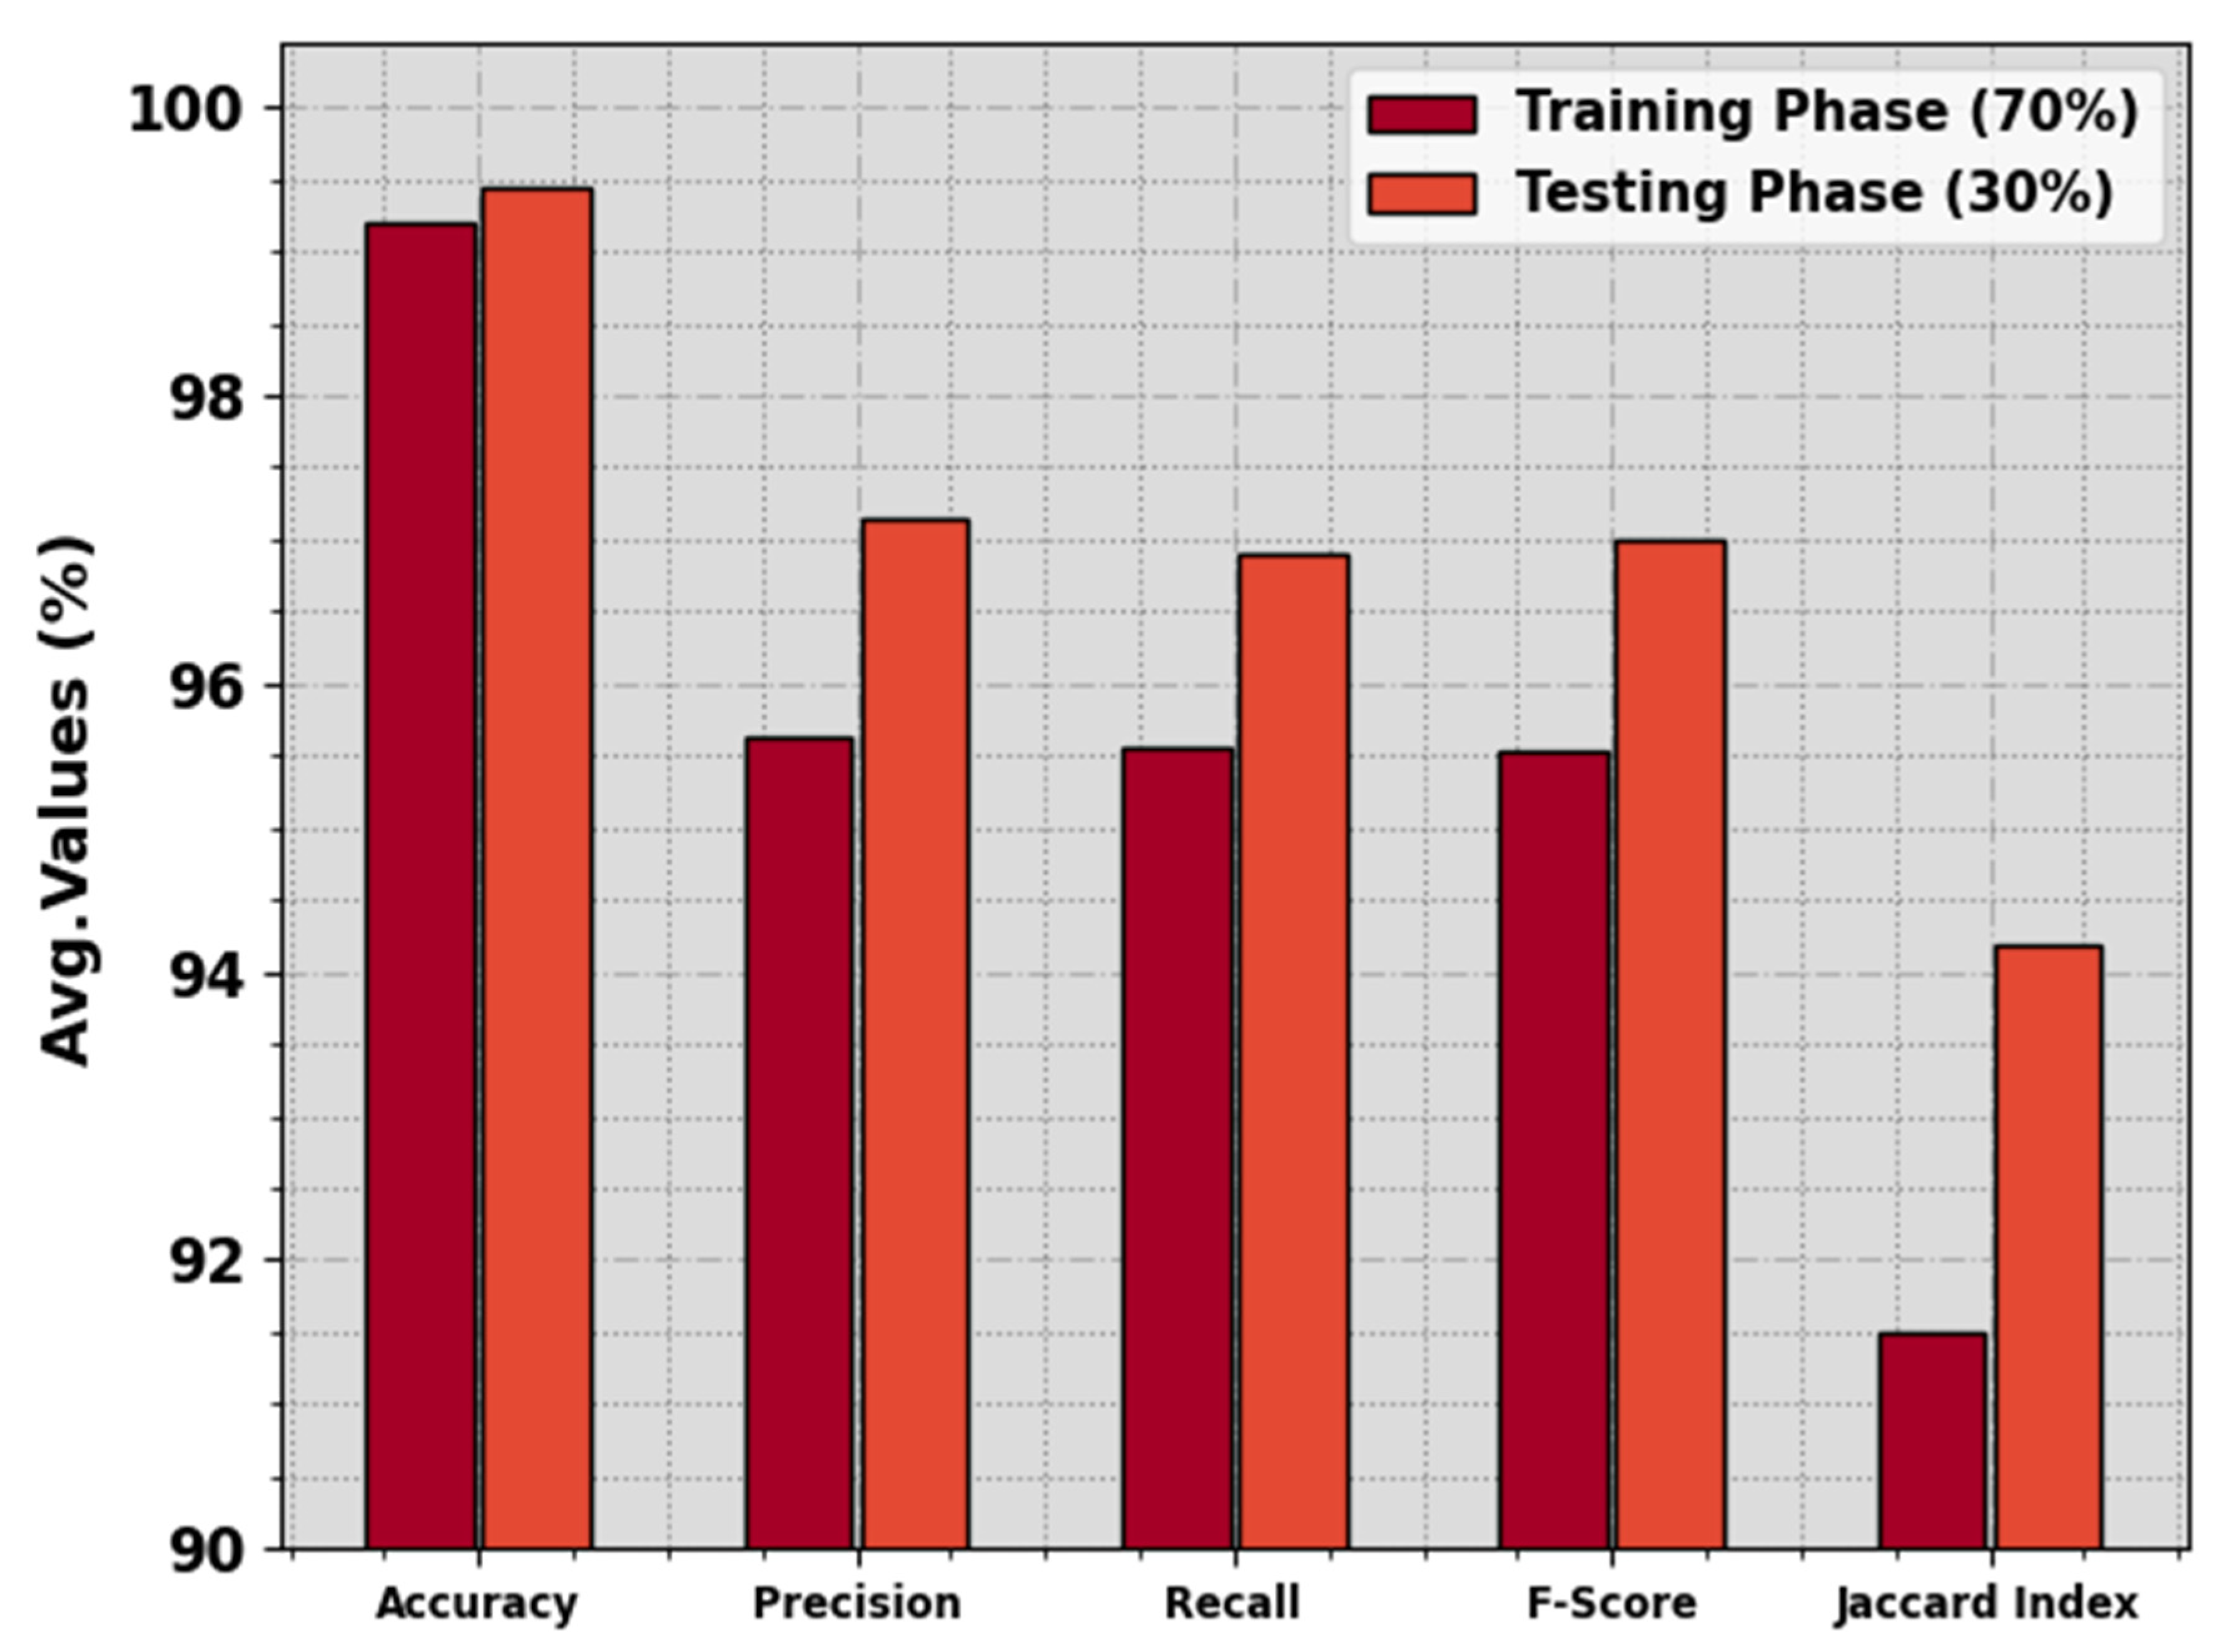
| Average | 99.19 | 95.63 | 95.55 | 95.54 | 91.49 |
| TS set (30%) | |||||
| Optimistic | 99.52 | 97.30 | 97.30 | 97.30 | 94.74 |
| Thankful | 99.39 | 98.39 | 93.85 | 96.06 | 92.42 |
| Empathetic | 99.03 | 92.94 | 97.53 | 95.18 | 90.80 |
| Pessimistic | 99.27 | 98.53 | 93.06 | 95.71 | 91.78 |
| Anxious | 99.76 | 100.00 | 97.14 | 98.55 | 97.14 |
| Sad | 99.39 | 96.47 | 97.62 | 97.04 | 94.25 |
| Annoyed | 99.64 | 96.72 | 98.33 | 97.52 | 95.16 |
| Denial | 99.39 | 96.05 | 97.33 | 96.69 | 93.59 |
| Surprise | 99.76 | 98.78 | 98.78 | 98.78 | 97.59 |
| Official report | 99.15 | 93.48 | 98.85 | 96.09 | 92.47 |
| Joking | 99.64 | 100.00 | 96.00 | 97.96 | 96.00 |
| Average | 99.45 | 97.15 | 96.89 | 96.99 | 94.18 |
| Methods | ||||
|---|---|---|---|---|
| RF | 91.20 | 92.48 | 91.26 | 91.49 |
| XGboost | 91.40 | 91.69 | 91.82 | 91.20 |
| SVM | 90.95 | 90.39 | 90.32 | 90.25 |
| Ensemble | 93.19 | 94.32 | 93.15 | 93.96 |
| DT | 90.82 | 90.82 | 90.92 | 90.46 |
| SFODLDSAC | 98.50 | 96.15 | 95.13 | 95.15 |
| MPONLP-TSA | 99.10 | 96.74 | 95.88 | 95.90 |
| MAOSDL-TC | 99.45 | 97.15 | 96.89 | 96.99 |
Disclaimer/Publisher’s Note: The statements, opinions and data contained in all publications are solely those of the individual author(s) and contributor(s) and not of MDPI and/or the editor(s). MDPI and/or the editor(s) disclaim responsibility for any injury to people or property resulting from any ideas, methods, instructions or products referred to in the content. |
© 2023 by the authors. Licensee MDPI, Basel, Switzerland. This article is an open access article distributed under the terms and conditions of the Creative Commons Attribution (CC BY) license (https://creativecommons.org/licenses/by/4.0/).
Share and Cite
Almasoud, A.S.; Alshahrani, H.J.; Hassan, A.Q.A.; Almalki, N.S.; Motwakel, A. Modified Aquila Optimizer with Stacked Deep Learning-Based Sentiment Analysis of COVID-19 Tweets. Electronics 2023, 12, 4125. https://doi.org/10.3390/electronics12194125
Almasoud AS, Alshahrani HJ, Hassan AQA, Almalki NS, Motwakel A. Modified Aquila Optimizer with Stacked Deep Learning-Based Sentiment Analysis of COVID-19 Tweets. Electronics. 2023; 12(19):4125. https://doi.org/10.3390/electronics12194125
Chicago/Turabian StyleAlmasoud, Ahmed S., Hala J. Alshahrani, Abdulkhaleq Q. A. Hassan, Nabil Sharaf Almalki, and Abdelwahed Motwakel. 2023. "Modified Aquila Optimizer with Stacked Deep Learning-Based Sentiment Analysis of COVID-19 Tweets" Electronics 12, no. 19: 4125. https://doi.org/10.3390/electronics12194125