Article

Design and Implementation of an Internet-of-Things-Enabled Smart Meter and Smart Plug for Home-Energy-Management System

by
Imed Ben Dhaou
1,2,3
1
Department of Computer Science, Hekma School of Engineering, Computing, and Design, Dar Al-Hekma University, Jeddah 22246-4872, Saudi Arabia
2
Department of Computing, University of Turku, FI-20014 Turku, Finland
3
Department of Technology, Higher Institute of Computer Sciences and Mathematics, University of Monastir, Monastir 5000, Tunisia
Electronics 2023, 12(19), 4041; https://doi.org/10.3390/electronics12194041
Submission received: 2 August 2023 / Revised: 14 September 2023 / Accepted: 20 September 2023 / Published: 26 September 2023
(This article belongs to the Special Issue Internet of Things for Smart Grid)

Abstract

:
The demand response program is an important feature of the smart grid. It attempts to reduce peak demand, improve the smart grid efficiency, and ensure system reliability. Implementing demand-response programs in residential and commercial buildings requires the use of smart meters and smart plugs. In this paper, we propose an architecture for a home-energy-management system based on the fog-computing paradigm, an Internet-of-Things-enabled smart plug, and a smart meter. The smart plug measures in real-time the root mean square (RMS) value of the current, frequency, power factor, active power, and reactive power. These readings are subsequently transmitted to the smart meter through the Zigbee network. Tiny machine learning algorithms are used at the smart meter to identify appliances automatically. The smart meter and smart plug were prototyped by using Raspberry Pi and Arduino, respectively. The smart plug’s accuracy was quantified by comparing it to laboratory measurements. To assess the speed and precision of the small machine learning algorithm, a publicly accessible dataset was utilized. The obtained results indicate that the accuracy of both the smart meter and the smart plug exceeds 97% and 99%, respectively. The execution of the trained decision tree and support vector machine algorithms was verified on the Raspberry Pi 3 Model B Rev 1.2, operating at a clock speed of 600 MHz. The measured latency for the decision tree classifier’s inference was 1.59 microseconds. In a practical situation, the time-of-use-based demand-response program can reduce the power cost by about 30%.

1. Introduction

Growing concerns about global warming, along with the need to satisfy rising electrical demand, have resulted in difficulties that exceed the capacity of the aging grid. The smart grid is a new type of utility infrastructure that employs distributed and intelligent renewable energy generation and allows for two-way communication between the utility and the consumer.
According to the 2007 Act on Energy Independence and Security, a smart grid should include the ten criteria listed as follows: (1) The widespread use of ICT (information and communication technologies) to improve performance, dependability, and trustworthiness. (2) The optimization of grid activities and resources in real time. (3) The effective integration of renewable energy resources. (4) Support for an advanced demand response. (5) The integration of smart technology for grid-operation control and monitoring. (6) Intelligent appliance consolidation. (7) The incorporation of cutting-edge energy storage and peak reduction technology. (8) Provide timely information and control alternatives to customers. (9) The development of communication and interoperability standards for appliances and devices. (10) Overcoming barriers and impediments to the adoption of smart grid technologies, methods, and services [1].
To achieve sustainability and energy efficiency, a synergistic interaction between a smart grid and smart house should take place via innovative Information and Communication Technology (ICT) architecture. The authors of [2] devised an ICT architecture that focuses on end-user feedback, the automated decentralized control of energy generation and demand, and grid stability. Its impact includes increased energy efficiency, the accommodation of distributed generation, reduced centralized peak generation, lower transport losses, improved network asset utilization, deferred grid reinforcements, and enhanced supply security.
Demand-response programs are components of demand-side management programs incorporated into smart grids that encourage consumers to shift their energy consumption to off-peak hours in order to reduce peak demand [3,4]. When the electricity grid is stressed, the demand response (DR) is considered the most cost-effective and reliable technique to flatten the demand curve [5]. Demand-response programs reduce electricity costs for consumers, improve grid reliability and stability, reduce carbon emissions due to more efficient energy use, increase the use of renewable energy, and have the potential for new revenue streams for consumers through participation in demand-response programs. Figure 1 lists typical demand-response programs [6].
Load shedding is a very effective method for balancing electricity demand and supply. It can be implemented in two ways: automatically and manually. The former is simple, as the smart meter determines which appliances to turn off depending on the user’s habits and the energy price obtained from the utility company. In the latter case, the user manually shuts off the appliance according to the current energy tariff [7]. In [8], the authors evaluated important household appliances on the US market (washing machines, electric clothes dryers, air conditioners, electric water heaters, electric ovens, dishwashers, and refrigerators) to estimate the impact of different appliances on DR programs. The authors observed that electric clothes dryers have the largest impact on the DR, followed by electric water heaters and air conditioning systems.
Researchers have paid little attention to the development of an ecosystem to support the DR. Most published work uses cloud computing to manually control load [9,10,11,12]. However, cloud computing has issues with latency, privacy, efficiency, power consumption, and security while processing sensitive data. To address these shortcomings, fog computing has been promoted in the context of smart metering infrastructure and smart homes [13,14].
Appliance identification is crucial in the design of a home-energy-management system and the implementation of the DR. Two important load-monitoring strategies have been elaborated. The first technique, intrusive load monitoring (ILM), fits each electric appliance with a low-cost electricity meter. The second one, nonintrusive load monitoring (NILM), uses a single smart meter to measure aggregated power and then recognizes each device by using a disaggregation algorithm. Pattern matching, source separation, and deep learning are the three main strategies used by NILM [15,16]. Several published reports showed the strength of NILM based on deep learning (DL) [17]. To train and infer the DL models, low-sampling rates, often less than 100 Hz, are used. During the training phase, the characteristics of a set of appliances are collected by using a low-cost meter. The active/reactive power, root mean square (RMS), frequency, and power factor are among the features.
Several technologies are required for the implementation of a real-time HEMS: (1) A low cost and accurate smart plug to measure the appliance attributes. (2) A low-latency, secure Internet of Things (IoT) communication protocol designed for indoor communication between smart plugs and smart meters. (3) A smart meter that can run tiny machine learning algorithms for NILM while also controlling the functioning of household appliances.
For reporting energy use and reading electricity pricing, the smart meter should use low latency and a secure communication protocol. Furthermore, it should be tamper proof to prevent energy theft and other security risks. Advanced data analytics may be created with smart meters, and these analytics can help utilities implement smart applications to lower operating costs and improve the grid efficiency. Smart meter analytics can be used for phase identification, meter-transformer mapping, load modeling and consumer segmentation, load forecasting, rooftop solar identification, nontechnical loss detection, outage management, fault detection, low/high voltage area detection, and theft detection [18]. Each application requires a different level of granularity and data measurement. For example, ref. [19] elaborates on a load forecasting program that uses active power, meteorological data, and electricity pricing.
In this work, a fog-computing system for the realization of the DR program in the context of residential energy management is developed. The HEMS integrates smart plugs and smart meters enabled by the IoT. This research work extends [20,21]. The following is a list of the contributions of this paper.
  • Propose an efficient technique for the computation of the RMS values of the voltage and current.
  • Devise a lightweight algorithm to calculate the frequency of the AC voltage at each plug.
  • Elaborate a fog-enabled architecture to implement the DR program.
  • Implement a machine learning algorithm to classify home appliances by using tiny machine learning algorithms.
The remainder of the paper is organized as follows: Section 2 summarizes related work and contests our work against state-of-the-art work. The architecture of the energy-management system and the integration using fog computing are outlined in Section 3. Section 4 describes the architecture of the smart plug. Section 5 reports the results of the implementation. Finally, Section 6 concludes the work.

2. Related Works

The proposed home-energy-management system (HEMS) is pictured in Figure 2. The smart plug scattered all over the residential areas scans, monitors, and controls home appliances. The measured electrical parameters are collected by smart plugs and transmitted through the Zigbee network, which consists of Zigbee coordinators and Zigbee routers. The smart plug acts as a Zigbee end node. The coordinator is used to connect the Zigbee routers. The latter is used to route data from the end node towards the smart meter. The measured electrical parameters are used by the smart meter to identify appliances by using the ML algorithm and to control the operation of the appliance based on the current electricity tariff. Below is a comprehensive description of the role of each device in the proposed HEMS.
  • Smart plug: Measures the frequency, RMS values of the current and voltage, power (active and apparent), average current, power factor, and admittance. Additionally, it controls the operation of the appliance.
  • Zigbee coordinator: initiates, controls, and organizes the Zigbee network.
  • Zigbee router: improves the reliability and coverage of the Zigbee network.
  • Smart meter: identifies the appliances, implements the demand-response programs, detects irregularities or faults in the distribution network, etc.
In conventional grids, load control and demand-side load management programs have been implemented to either reduce the cost (economic benefit) or increase the reliability of the system (stability issues) [22]. The transition towards a smart grid has diversified demand-side management programs [4]. Appliances are of three categories: fixed, elastic, and shiftable [23].
The implementation of the demand-response program makes use of advanced metering infrastructure (AMI). AMI, which is shown in Figure 3, consists of smart plugs that are connected to a smart meter through a Home Area Network (HAN). Smart meters in a given geographic region are connected to utility servers by data concentrators by using a neighboring area network (NAN) [9]. The data concentrator is an embedded system that is composed of a power management unit, a communication unit, power line communication, and a control unit. Several communication technologies are available for the realization of the NAN. As pointed out in several studies, the following communication technologies support the data traffic and latency requirements of the AMI: fiber optic, broadband cellular communication (4G, 5G, and the future 6G) power line communication, radio frequency (RF) mesh network, and LoRa-IoT (Long-Range IoT) [1,9,24,25].
The authors of [9] developed an Android-based smart plug system that uses Arduino. The plug was intended as a data logger that tracks the appliance’s power usage. The noninvasive sensor on the smart plug measures the current while communicating with the server over a wired Ethernet. The power consumption is shown in real time through an Android-based GUI.
Some utilities rely on Geographical Information Systems (GIS) to manage their distribution networks (real-time monitoring, maintenance, asset management, and outage response). However, the GIS data quality is poor, which might affect the operation of the distribution network. To improve the precision of the GIS records, the authors of [26] devised an algorithm that detects neighboring meters through the analysis of voltage-profile correlations.
An electric appliance can also be identified via the smart plug. Intrusive load monitoring is the term used to describe this technique. The goal of [10]’s research is to identify home appliances by using the Gaussian Mixture Model (GMM) and K-Nearest Neighbors classifiers (k-NN). The researchers made use of a cheap commercial smart plug (the Plugwise system). Real power, reactive power, the phase angle between current and voltage ( ϕ ), and the root mean square (RMS) value of the current are crucial capabilities of the Plugwise system. The system’s communication protocol of choice is Zigbee.
Scheduling an algorithm for optimizing energy usage in smart homes with controllable electrical appliances, renewable energy sources, dispatchable energy generators, and energy storage systems has been solved considering both a linear a nonlinear pricing model. The authors of [27] considered the nonlinear pricing model to be more accurate and formulated the scheduling as a mixed-integer quadratic programming problem.
The work discussed in [11] focused on designing a smart plug for load shedding. Voltage and frequency are both measured by the nPlug. The readings are utilized to pinpoint the peak needs and schedule the operation of the appliance in order to lower the peak.
The design of an IoT-enabled smart plug for a smart home-energy-management system was presented by the authors of [28]. The plug has the ability to measure voltage and current. The ACS712 sensor is used to measure the first. A voltage divider is used to measure the latter. The mobile application and the plug can now communicate by using a Zigbee-based protocol. The logged data were sent to the server by using a Zigbee gateway with Raspberry Pi support.
The research outlined in [20] focused on designing a low-cost, Internet of Things (IoT)-enabled smart plug for the implementation of the demand-response scheme. The Allegro ACS712 module for AC current sensing, the XBee module for communication between the smart meter, and Arduino were used to build the plug.
The advanced metering infrastructure (AMI) integrates customers’ smart meters, communication protocol, and metering-data-management system. Given that the smart meter is not regulated, this created an interoperability issue, particularly at the data and communication-protocol levels. To address these issues, the authors of [21] devised an IoT-enabled smart meter utilizing middleware. In the context of the iGrid project, a proof-of-concept system was built and tested by utilizing the Raspberry Pi and KAA IoT platform. Figure 4 depicts KAA’s architecture [29].
IoT middlewares can help solve interoperability problems by seamlessly linking IoT devices with back-end systems [30]. IoT middleware should offer resource discovery, resource management, data management, event management, and code management, as stated in [31]. Furthermore, IoT middleware should be dependable, scalable, available, secure, and simple to deploy. A comparison of existing open-source IoT middleware is presented in [32], revealing that KAA outperforms competitors in terms of scalability, performance, and security. Defect detection, secure OTA (over-the-air) updates, and smart home-energy management are among the capabilities available in KAA.
The authors of [12] designed an IoT-based Smart Compact Energy Meter by using an ARM processor and real-time operating system. The smart meter logs data to Blynk, a cloud IoT platform for controlling and managing IoT devices and data.
The goal of the work reported in [33] was to design an IEC-62053-2-compliant smart meter that can measure power (active and reactive), energy (active and reactive), the total harmonic distortion, and the RMS values of the current and voltage. A voltage sensor (ZMPT101B), a current sensor based on the hall effect (TLI4970), an SoC microcontroller (ESP32), and an ADC converter (MCP3008) were used to prototype the meter. The displacement power factor (DPF) and the fundamental frequency were calculated by using the FFT algorithm via the smart meter.
The deployment of smart meters comes with arduous challenges such as the cost, scalability, reconfigurability, over-the-air updates, network intricacies, etc. To address those issues, the authors of [34] devised a software and hardware solution for a three-phase smart meter (3SMA) that efficiently gathers network data, facilitates communication between network entities, and provides tailored functionalities for network users. A 3SMA has three units: a data-acquisition block that collects both the current and voltage, a self-configuration and algorithm unit, and a communication block.

3. Fog-Computing-Based Appliance-Identification System

This section focuses on the description of appliance identification by using machine learning techniques and its implementation on tiny devices in the context of a fog-computing paradigm commonly known as edge artificial intelligence (edge AI).
Automatic appliance recognition plays a pivotal role in the HEMS as well as in the monitoring of human activities. Various algorithms have been developed for appliance recognition. Nonintrusive load monitoring (NILM) is a subclass of appliance recognition that aims at identifying the status of some appliances by using aggregated data. NILM is deployed at the smart-meter level and has been proposed to address the complexity associated with installing smart plugs at every power outlet and to reduce the power consumption of the smart plug. Machine learning algorithms (supervised and unsupervised) have been developed for NILM [35].
Existing commercial products use manual manners for appliance identification and control. For example, in the system of [36], the appliance and location of the appliance are manually entered by the user. The switching of the device can be triggered either manually or when the power consumption exceeds a predefined threshold value.
The algorithm used to identify the appliances is implemented at the smart-meter level. The smart meter pairs with each smart plug. Once an appliance is plugged in the smart plug, it measures the following quantities: active, reactive, apparent powers, and the power factor. Those values along with the location L i of the ith plug are wirelessly transferred to the smart meter, which uses the provided measurements to identify the appliance connected with the plug. These steps for the algorithm are described in Algorithm  1. The measurements and the classification algorithms are explained in the subsequent sections.
The appliance is identified at the smart-meter level by using the following machine learning approach. The active, reactive, apparent powers ( P , Q , S ), and power factor ( cos ( θ ) ) of an appliance are measured when it is plugged into a smart socket. These electrical parameters, as well as the location L i of the ith plug, are wirelessly transmitted to the smart meter. Algorithm 1 explains the steps used for appliance identification. The next sections go through the measurements and classification algorithms.
Algorithm 1 Appliances identification
1:
procedure ApplianceIdentification( N A , κ )
2:
    for  j 1 , N A  do
3:
        Get P , Q , S , cos ( θ ) , L i
4:
        Get the class c i using machine learning algorithm κ
5:
        Update the list of appliances
6:
    end for
7:
end procedure

3.1. Appliance’s Signature

There are numerous characteristics that set each electric appliance apart and can be used to identify them. The classification of appliances is accomplished by determining the boundaries of each class. For real-time implementation, the computational complexity should fit into existing microcontrollers. The features that contributed to determining the appliance’s signature are described in Table 1. These values are obtained from the smart plug and used by the smart meter, which acts as a fog node, to recognize the appliance.

3.2. Classification Algorithms

The foundation of conventional machine learning techniques is a four-step procedure. The raw data are processed after the initial stage of feature extraction. The last two steps are training and testing. The requirement for feature engineering, which transforms the raw data into a reliable representation of the data, has restricted the widespread application of artificial intelligence. Feature engineering is frequently time consuming and very domain-specific. Machine learning can be divided into four classes: supervised learning, unsupervised learning, reinforcement learning, and semisupervised learning.
Deep learning, a significant development in artificial intelligence based on artificial neural networks (ANNs), is inspired by the human brain. It has been devised to eliminate the feature-extraction step. Deep learning has largely become practical thanks to developments in silicon and massively parallel technology (like GPU), high-speed internet, the collection of big volumes of data, and other factors [37].
Machine learning algorithms are used for appliance classification. The widely used classifiers are the support vector machine (SVM), random forest tree, logistic regression, K-Nearest Neighbors, and naive Bayes classifier [38]. Among the existing classification algorithms, random forest tree (RF) has superior features, which makes it a suitable candidate for real-time appliance identification. RF is an ensemble method based solely on the divide-and-conquer technique where a number of random trees are used to make a classification by using the majority vote principle [39,40]. Given n training samples, the output of the mth tree is computed by using Equation (1):
L n ( x ; Θ k ; T n ) = k T n ( Θ k ) τ k Y k Π n ( x ; Θ k ; T n ) ,
where T n ( Θ k ) is the selected data points, τ k Y k is a binary value equal to one when X i is in a cell ( C n ) containing x, P i n ( x ; Θ k ; T n ) is the number of data points in C n , and Θ 1 , , K are independent random variables.
The pseudocode for training the RF tree is summarized in Algorithm 2. The algorithm takes as input the training data (X), the number of features ( ζ ), and the number of classifiers (N).
Algorithm 2 Random Forest Tree
1:
procedure RFTraining( X , ζ , N )
2:
    for  j 1 , N  do
3:
        Get T j from X
4:
        Generate an unpruned tree using
5:
        for a chosen node do
6:
           Randomly select m = ζ feature from T j
7:
           Determine the most suitable split features and cutpoints using T j .
8:
           Use the resulting split features and cutpoints to propagate the data down.
9:
           Repeat steps 6-8 until the desired level of accuracy is met.
10:
        end for
11:
    end for
12:
    return trained classifiers
13:
end procedure
To validate those features, we used a public database to plot the signatures of typical home appliances: refrigerators, televisions, microwave ovens, and kettles. Figure 5 shows the signature of a refrigerator. As the RMS value of the voltage is constant, the waveform of the admittance is therefore the scaled version of the current waveform.

3.3. TinyML

Machine learning algorithms are typically performed on powerful servers in a cloud-centric architecture [41]. Privacy, security, latency, and power consumption were among the problems that cloud servers faced when processing data. Fog computing has been suggested as a cloud-computing alternative to overcome those drawbacks. The fundamental concept is to process data close to edge devices. In the context of the fog-computing paradigm, the need to run machine learning algorithms on edge devices gave rise to TinyML.
As reported in [42,43,44,45], TinyML is a subclass of machine learning algorithms that is designed to work on tiny devices. There are a number of platforms and tools that are currently available for the development of TinyML. TensorFlow Lite is a subset of the TensorFlow library optimized to operate on microcontrollers and edge devices. It was released by Google in 2019 [46]. The framework for using TinyML is split into four parts: In the first phase, the algorithm is selected or developed by using cloud computing. In the second phase, the trained model is converted to a format suitable for the tiny device. In the third phase, the model is deployed on the edge or IoT device. In the fourth phase, the inference is evaluated. It is crucial to note at this moment that only a select number of TinyML libraries, like scikit-learn, support training on tiny devices [45].

4. Smart Plug Technology

The identification of appliances is based on measurements of essential electrical parameters. In this section, software and hardware technologies that are used to measure the RMS values of current and voltage, the power factor, the real power, admittance, reactive power, and grid frequency are elaborated.
The smart plug architecture from [20] is examined in this section, along with updates to the algorithms that include reducing computation errors for the RMS values and developing a time-domain technique to ascertain the frequency of the AC voltage for each appliance.
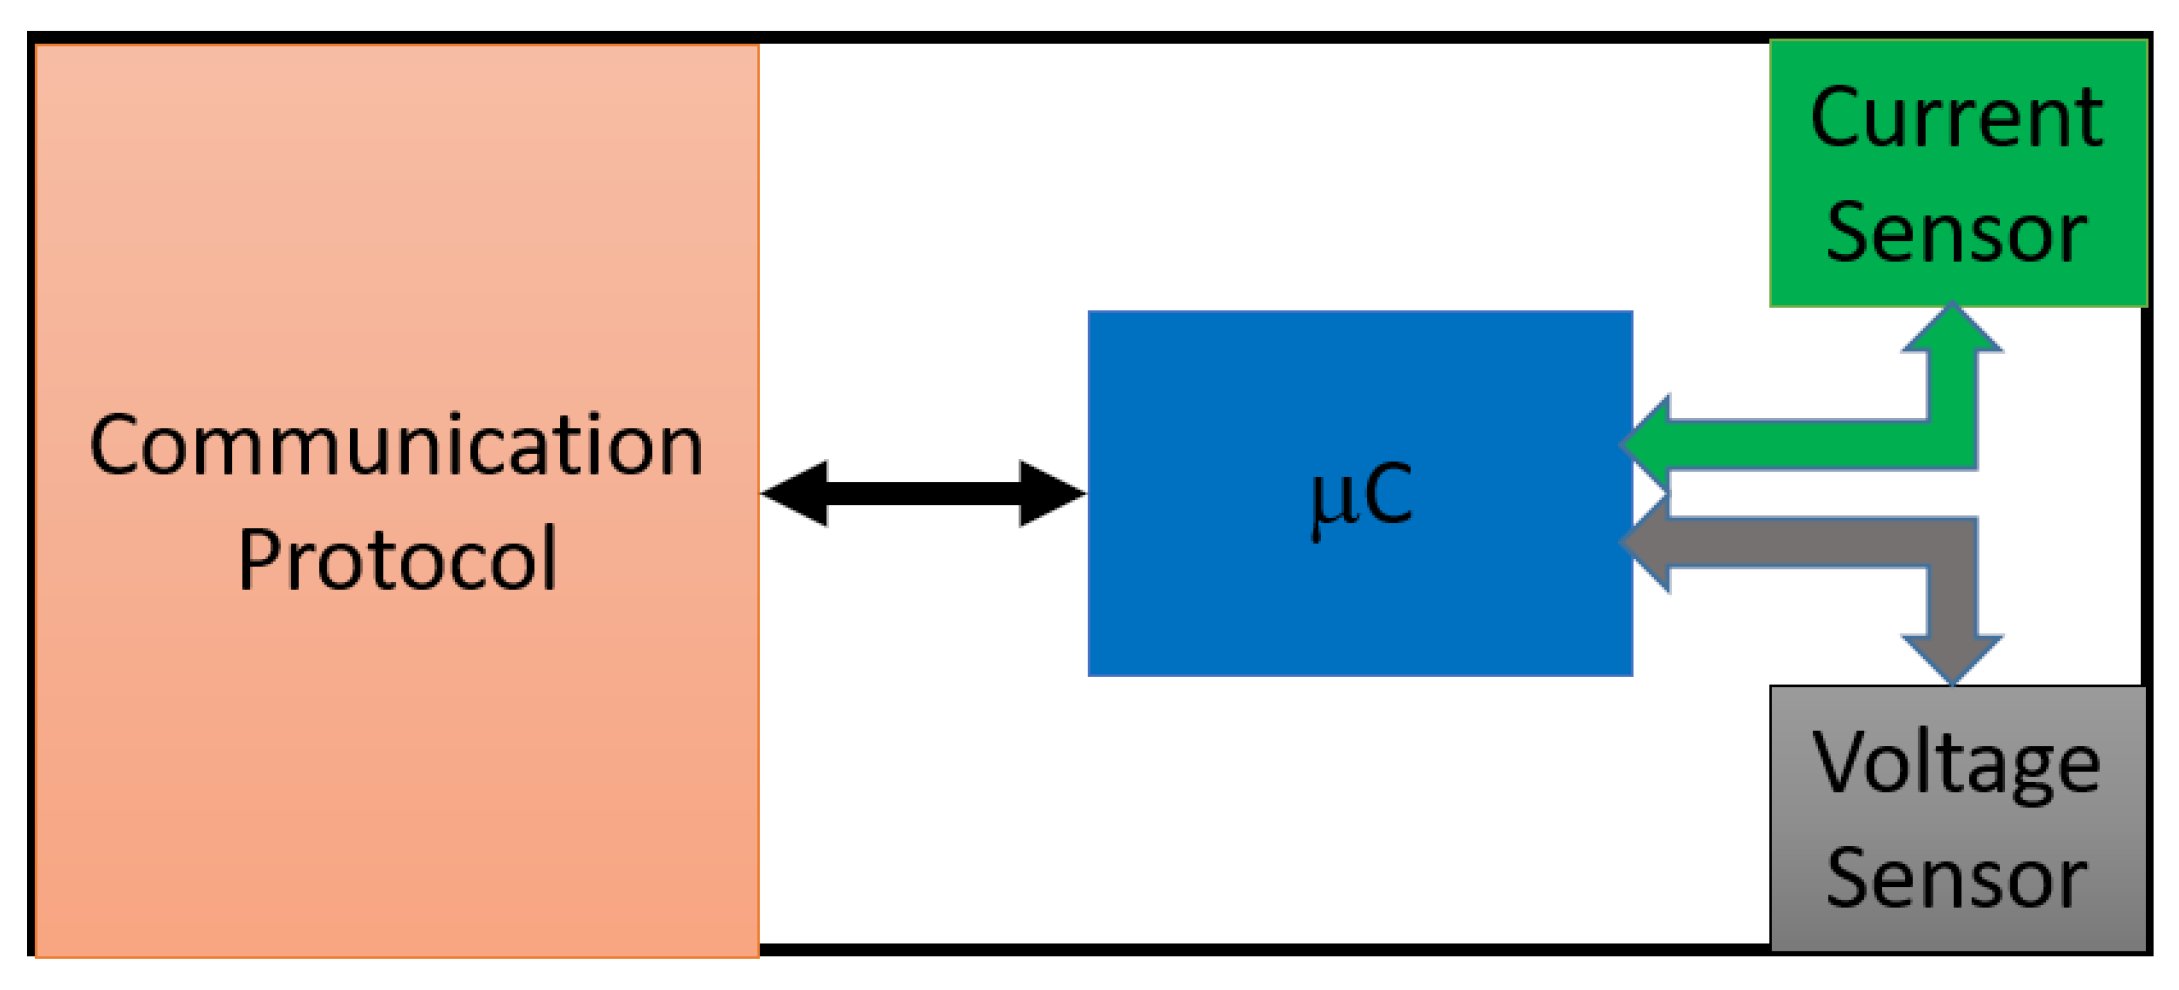
The schematic diagram of the smart plug is shown in Figure 6. The components of the diagram include a communication unit for sharing data and control signals with the smart meter, a microcontroller for managing and controlling the AC appliance, sensors for measuring the current and voltage, and a relay for turning the appliance on and off.
Several difficulties arose during the development of a smart meter by using an embedded system. The communication between the smart plug and the smart meter is the most evident, as the quality instantly diminishes in the presence of an obstacle. Furthermore, in large residential areas or industrial settings, the latency of communication between the smart plug and smart meter may increase. Likewise, the voltage and current sensors must be precisely calibrated.

4.1. Measuring Electrical Quantities

In residential settings, there are two different types of electric loads: linear and nonlinear. The present smart plug model is focused on linear loads (such as heaters, fans, air conditioners, and refrigerators). The formulas for the voltage and current in the AC domain are provided by Equations (2) and (3) [47]:
v ( t ) = V m cos ( ω t ) ,
where V m is the highest voltage amplitude possible and ω is the voltage’s angular frequency (fixed by the utility company):
i ( t ) = I m cos ( ω t + θ ) ,
where I m is the maximum current amplitude and θ is the phase difference between the voltage and current.
Discretization methods can be used to obtain the instantaneous current and voltage levels, allowing one to apply numerical methods to determine the RMS values. The RMS value of a signal x ( t ) over a period T is calculated in the analog domain by using Equation (4).
X R M S = 0 T x ( t ) 2 d t T .
Given the sample size, N, and the samples x [ k ] , Equation (5) is commonly used to compute the RMS value in the discrete domain:
X R M S = k = 1 N x [ k ] 2 N ,
where x [ k ] is the sample size.
The integration can also be evaluated by using numerical techniques. The most famous numerical integration rules are Newton–Cotes, Trapezoidal, and Simpson [48]. Trapezoidal is the most effective technique for numerical integration. The pseudocode to compute the integration a b f ( t ) d t is detailed in Algorithm 3. The algorithm takes three inputs: the limit of the integrals ( a , b ) , the number of samples (N), and the discrete value of the function f i = f ( t ) | t = i × b a N .
Algorithm 3 Numerical Integration using Trapezoidal method
1:
procedure Trapezoidal( a , b , N , f )
2:
     Δ x b a N
3:
     Y = f 0
4:
    for  i 1 , N 1  do
5:
         Y Y + 2 × f i
6:
    end for
7:
     Y Y × Δ x
8:
    return Y
9:
end procedure
To validate the approach used to approximate the RMS value, we used an AC voltage v ( t ) = c o s ( 100 π t ) . The RMS value of the voltage is V R M S = 1 / 2 V. Table 2 provides a summary of the comparison between the Trapezoidal technique and Equation (5). The table demonstrates that, for sampling frequencies higher than the Nyquist frequency, the Trapezoidal technique performs better than Equation (5).
The discrete domain instantaneous quantities of power are calculated by using the discrete values of the current, i [ n ] , and voltage, v [ n ] , and are computed by using Equation (6):
p [ n ] = i [ n ] v [ n ] ,
When the current and voltage are sinusoidal, Equations (7) and (8) are used to calculate the real and reactive powers, respectively.
P = V R M S I R M S cos ( θ )
Q = V R M S I R M S sin ( θ )
Numerical integration methods can be used to calculate the average power consumption. In this work, both Equation (9) and the Trapezoidal methods are used:
P = k = 1 N p [ k ] N ,
where N is the number of samples.
Once the average power has been calculated, the power factor ( cos ( θ ) ) can be calculated by using Equation (10):
cos ( θ ) = P V R M S I R M S .

4.2. Frequency Measurement

The AC frequency measurement is vital to determine the power quality and the imbalance between demand and response [49]. Typically, the frequency is measured in various locations of the house. In case the measured frequency deviates by ± 0.3 Hz of the nominal frequency, the heavy load must be disconnected and the user has to be alerted. To this end, we devise a frequency-estimation algorithm in the time domain. The pseudocode for the algorithm is shown in Algorithm 4.
Algorithm 4 Frequency estimation algorithm
1:
procedure FreqEstimation( v , t )
2:
     c o u n t 0
3:
     N = l e n g t h ( v )
4:
    for  j 2 , N  do
5:
        if  v ( j ) × v ( j 1 ) 0  then
6:
            T 0 ( c o u n t ) t ( j 1 )
7:
            c o u n t c o u n t + 1
8:
        end if
9:
     end for
10:
     T
11:
    for  j 2 , l e n g t h ( T 0 )  do
12:
         T min ( T , 2 × ( T 0 ( j ) T 0 ( j 1 ) )
13:
    end for
14:
    return  1 / T
15:
end procedure
The algorithm works as follows: Given the analog signal v ( t ) , first, the signal is sampled with a sampling period T s (as depicted in Figure 7). The algorithm proceeds by computing the time when the voltage crosses the time axis. This condition is checked by using the sign of the product v ( j ) × v ( j 1 ) . Half of the period ( T 2 ) is computed as the time difference between the instant of times when the voltage crosses the time axis ( ( T 0 ( j ) T 0 ( j 1 ) ). To filter the noise, the minimum value is computed across all estimated T 2 .

4.3. Complexity Analyses

The RAM computational model is used to perform computational complexity evaluations of the algorithms implemented at the smart plug. The embedded device must hold 2 N current and voltage values. These values are utilized to generate N power values. The RMS values have a computational cost of N multiplications and ( N 1 ) additions. If the time spent by the adder is ignored, the computational complexity of computing VRMS and IRMS by using the Trapezoidal formula is N multiplications. The complexity of the frequency estimation technique in the worst-case scenario is N 2 multiplications and N 2 additions. The computational complexity of the technique used to estimate the different electrical properties of an AC appliance is summarized in Table 3.

5. Experimental Results

After detailing the hardware and software components of the smart plug and smart meter, the goal of this section is to use measurement results to determine the accuracy of the described methods.

5.1. Measurement of Electrical Parameters

The frequency estimation algorithm was implemented on the Arduino-UNO. The accuracy of the algorithm was compared to the FFT-based algorithm. To test the algorithm for estimating the grid frequency, we characterized a laptop by using accurate laboratory equipment and our prototyped smart plug. Figure 8 depicts the measured voltage for a laptop device. The FFT of the first 240 voltage samples is illustrated in Figure 9. The curve shows the first peak at 62.5 Hz. The estimated frequency using Algorithm 4 is also 62.5 Hz, which shows that the algorithm is as accurate as the FFT-based algorithm. However, the complexity of the algorithm is far less than the complexity of the FFT-based algorithm.
Due to the limited resources, we carried out a limited number of measurements in the lab to study the current consumption of fans, vacuum cleaners, boilers, blenders, and laptops.
For information and communication technologies (ICTs), in particular computers, the impact of the software load has not been investigated. To determine if the laptop is fixed, elastic, or shiftable equipment, we measured its instantaneous current consumption using three settings: with WiFi switched off, WiFi switched on, and running a YouTube video. The measurements are shown in Figure 10. The RMS value of the current is summarized in Table 4. Those results show that the software has a minor impact on the measurements as a large portion of the laptop power is consumed by the graphics. Typically, the screen consumes 43% of the total power [50]. From the presented results, computers can be classified as either shiftable or fixed equipment.
The measured current for some appliances is summarized in Table 5.

5.2. Classification

To validate the classification algorithm, a publicly available dataset was used [51]. Over 15K measurements of the RMS current, active and reactive powers, and power factor are included in the dataset. The following appliances are characterized: kettle, refrigerator, fan, hair dryer, and induction stove. To test the accuracy of the classification algorithm, first, we compared their performance by using a laptop with the features listed in Table 6. After validation, the model is deployed on an embedded system. The chosen platform is Raspberry Pi with features summarized in Table 7.
According to the results in Table 8, the decision tree, SVM, and random forest tree accurately identified all the appliances. Decision trees are simpler and more interpretable, but they are susceptible to overfitting. Random forests are more complicated, give better generalization, and are well suited for dealing with large datasets with multiple attributes. They are, however, less interpretable and require greater computational resources for training [52]. To choose the TinyML, the SVM and decision tree were exported to the Raspberry Pi. On the RPI, we used the scikit-learn 1.3 package. The SVM was trained on a laptop. The trained model is then saved as a pickle module and exported to the RPI. Python was used to run the inference program on the RPI. The model for the decision tree was trained offline on the RPI and stored as a pickle module. Table 9 summarizes the performance of the two algorithms.
The reported results show that the performance of the decision tree as well as its size and latency is better than the SVM. However, the only issue with the decision tree is that the training needs to be conducted on the embedded device (on-device training).
The RPI uses a 64-bit Quad-core RISC processor architecture (ARM V7 architecture). The processor has single-precision floating-point units, which can represent data in the range ± 1.175494 × 10 38 to ± 3.402824 × 10 38 . This accuracy allows us to run the inference of machine learning algorithms without jeopardizing their accuracy. To further reduce the power consumption of the RPI, the clock frequency can be scaled down and take advantage of the multicore architecture. In this case, the frequency is reduced from 1.2 GHz to 600 MHz.
The comparison between this work and the recently published system is reported in Table 10. Only one cited work measures the frequency by using the FFT algorithm. However, our approach is better suited for tiny devices as it is based on a time-domain algorithm and has a complexity of Θ ( N ) , whereas the FFT algorithm has a complexity of Θ ( N log ( N ) ) .

5.3. Practical Example

To quantify the importance of the devised approach for the realization of a demand response based on time-of-use (TOU) pricing, we consider the following scenario taken from the US market: The utility company, Peco, in the US offers consumers the option to enroll in the TOU program. The electricity is priced by time bands: the peak time is from 2 p.m. to 6 p.m. during weekdays; the off-peak time is from 6 a.m. to 2 p.m, from 6 p.m. to 12 a.m on weekdays, and from 6 a.m to 12 a.m. on weekends and holidays; and the super off-peak time is during the rest of the day. The prices are shown in Figure 11.
A consumer enrolled in the TOU program has the following major appliances: an electric shower, kettle, grill, iron, air conditioner (AC), washing machine, electric dryer, electric vehicle, refrigerator, and induction cooker. The working hours and the power rating of each appliance are summarized in Table 11. Two scheduling scenarios were considered. The first is based on the user’s needs without considering the TOU. The second scenario is based on the TOU. Those cases are summarized in Table 12 and Table 13. The energy bill for the first case is approximately 9.22 USD/day, whereas for the second case, the estimated bill is 6.43 USD, which leads to over 30.26% in savings.

5.4. Discussion

The use of data collection including a wide variety of appliances is required for appliance identification by using a deep learning algorithm. Additionally, weather may have an impact on appliance operation, which is not considered in the current work. The advantage of the presented work is that the utility company can further improve the DR programs targeting specific consumers. In addition, appliance identification when coupled with user behavior can be used to provide better health services, particularly for the elderly [53,54].

6. Conclusions

The deployment of ICT technology in the grid, which enabled a bidirectional interaction between the utility and the prosumer, has aided the resurgence of advanced techniques in the power system. A demand-response (DR) program is being planned in order to match supplies with demands. One potential technology for the implementation of smart grids is the Internet of Things (IoT). When IoT-enabled smart meters and smart plugs are combined with fog computing and artificial intelligence, the DR program can be realized. This article developed hardware and software solutions for demand-response programs based on the fog-computing paradigm. The smart plug measures the frequency of the alternating current voltage; the RMS current and voltage values; the power factor; and the active, admittance, and reactive power. The measurements taken by the smart plug are used to identify appliances autonomously at the smart meter by using machine learning algorithms. Several classification techniques aimed at tiny devices were evaluated. The results of the studies demonstrate that the decision tree algorithm has the highest accuracy and the lowest latency. The current HEMS is very effective when the dataset used to train the model covers all possible appliances found in a typical residential area. Furthermore, the energy management algorithm does not permit controlling the HVAC system to reduce energy usage while maintaining user comfort. Intruders may also use smart meters to manipulate dynamic pricing, resulting in an ineffective home-energy-management system. Those topics will be the subject of follow-up work.

Funding

This research/project was funded by the Vice Presidency for Graduate Studies, Business, and Scientific Research (GBR) at Dar Al-Hekma University, Jeddah, under grant no. (RFC/22-23/001). The author, therefore, acknowledges with thanks the GBR for the technical and financial support.

Data Availability Statement

The data and codes presented in this study are openly available in https://github.com/imedbendhaou/Iot-smart-plug (accessed on 1 August 2023).

Conflicts of Interest

The authors declare no conflict of interest.

List of Parameters

PActive/real power in watts
SApparent power in VA
QReactive power in VAR
N A Classes of appliances
L i Location of the appliance (kitchen, living room, etc.)
cos ( θ ) Power factor
κ Classification algorithm
I R M S RMS value of the current
c o s ( θ ) Power factor
PReal power
QReactive power
I R M S V R M S Admittance
XTraining data
ζ Number of features
X R M S RMS value of the variable X
L n Output of the mth tree
T n ( Θ k ) The selected data points
τ k Y k A binary value
P i n ( x ; Θ k ; T n ) The number of data points in the nth class
Θ 1 , , K Independent random variables

References

  1. Ben Dhaou, I.; Kondoro, A.; Kelati, A.; Rwegasira, D.S.; Naiman, S.; Mvungi, N.H.; Tenhunen, H. Communication and Security Technologies for Smart Grid. Int. J. Embed. Real-Time Commun. Syst. 2017, 8, 40–65. [Google Scholar] [CrossRef]
  2. Kok, K.; Karnouskos, S.; Nestle, D.; Dimeas, A.; Weidlich, A.; Warmer, C.; Strauss, P.; Buchholz, B.; Drenkard, S.; Hatziargyriou, N.; et al. Smart houses for a smart grid. In Proceedings of the CIRED 2009—20th International Conference and Exhibition on Electricity Distribution—Part 1, Prague, Czech Republic, 8–11 June 2009; pp. 1–4. [Google Scholar]
  3. Palensky, P.; Dietrich, D. Demand Side Management: Demand Response, Intelligent Energy Systems, and Smart Loads. IEEE Trans. Ind. Inform. 2011, 7, 381–388. [Google Scholar] [CrossRef]
  4. Jabir, H.J.; Teh, J.; Ishak, D.; Abunima, H. Impacts of Demand-Side Management on Electrical Power Systems: A Review. Energies 2018, 11, 1050. [Google Scholar] [CrossRef]
  5. Vardakas, J.S.; Zorba, N.; Verikoukis, C.V. A Survey on Demand Response Programs in Smart Grids: Pricing Methods and Optimization Algorithms. IEEE Commun. Surv. Tutor. 2015, 17, 152–178. [Google Scholar] [CrossRef]
  6. Ibrahim, C.; Mougharbel, I.; Kanaan, H.Y.; Daher, N.A.; Georges, S.; Saad, M. A review on the deployment of demand response programs with multiple aspects coexistence over smart grid platform. Renew. Sustain. Energy Rev. 2022, 162, 112446. [Google Scholar] [CrossRef]
  7. Vidal, A.R.S.; Jacobs, L.A.A.; Batista, L.S. An evolutionary approach for the demand side management optimization in smart grid. In Proceedings of the 2014 IEEE Symposium on Computational Intelligence Applications in Smart Grid (CIASG), Orlando, FL, USA, 9–12 December 2014; pp. 1–7. [Google Scholar] [CrossRef]
  8. Pipattanasomporn, M.; Kuzlu, M.; Rahman, S.; Teklu, Y. Load Profiles of Selected Major Household Appliances and Their Demand Response Opportunities. IEEE Trans. Smart Grid 2014, 5, 742–750. [Google Scholar] [CrossRef]
  9. Shajahan, A.H.; Anand, A. Data acquisition and control using Arduino-Android platform: Smart plug. In Proceedings of the 2013 International Conference on Energy Efficient Technologies for Sustainability, Nagercoil, India, 10–12 April 2013; pp. 241–244. [Google Scholar] [CrossRef]
  10. Ridi, A.; Gisler, C.; Hennebert, J. Automatic identification of electrical appliances using smart plugs. In Proceedings of the 2013 8th International Workshop on Systems, Signal Processing and Their Applications (WoSSPA), Algiers, Algeria, 12–15 May 2013; pp. 301–305. [Google Scholar] [CrossRef]
  11. Ganu, T.; Seetharam, D.P.; Arya, V.; Hazra, J.; Sinha, D.; Kunnath, R.; De Silva, L.C.; Husain, S.A.; Kalyanaraman, S. nPlug: An Autonomous Peak Load Controller. IEEE J. Sel. Areas Commun. 2013, 31, 1205–1218. [Google Scholar] [CrossRef]
  12. Karthick, T.; Chandrasekaran, K. Design of IoT based smart compact energy meter for monitoring and controlling the usage of energy and power quality issues with demand side management for a commercial building. Sustain. Energy Grids Netw. 2021, 26, 100454. [Google Scholar] [CrossRef]
  13. Stojkoska, B.R.; Trivodaliev, K. Enabling internet of things for smart homes through fog computing. In Proceedings of the 2017 25th Telecommunication Forum (TELFOR), Belgrade, Serbia, 21–22 November 2017; pp. 1–4. [Google Scholar] [CrossRef]
  14. Ullah Kakakhel, S.R.; Kondoro, A.; Westerlund, T.; Ben Dhaou, I.; Plosila, J. Enhancing Smart Grids via Advanced Metering Infrastructure and Fog Computing Fusion. In Proceedings of the 2020 IEEE 6th World Forum on Internet of Things (WF-IoT), New Orleans, LA, USA, 2–16 June 2020; pp. 1–6. [Google Scholar] [CrossRef]
  15. Schirmer, P. Modelling of Electrical Appliance Signatures for Energy Disaggregation. Ph.D. Thesis, University of Hertfordshire, Hatfield, UK, 2021. [Google Scholar] [CrossRef]
  16. Ridi, A.; Gisler, C.; Hennebert, J. A Survey on Intrusive Load Monitoring for Appliance Recognition. In Proceedings of the 2014 22nd International Conference on Pattern Recognition, Stockholm, Sweden, 24–28 August 2014; pp. 3702–3707. [Google Scholar] [CrossRef]
  17. Angelis, G.F.; Timplalexis, C.; Krinidis, S.; Ioannidis, D.; Tzovaras, D. NILM applications: Literature review of learning approaches, recent developments and challenges. Energy Build. 2022, 261, 111951. [Google Scholar] [CrossRef]
  18. Zidi, S.; Mihoub, A.; Mian Qaisar, S.; Krichen, M.; Abu Al-Haija, Q. Theft detection dataset for benchmarking and machine learning based classification in a smart grid environment. J. King Saud Univ.-Comput. Inf. Sci. 2023, 35, 13–25. [Google Scholar] [CrossRef]
  19. Ashok, K.; Reno, M.J.; Blakely, L.; Divan, D. Systematic Study of Data Requirements and AMI Capabilities for Smart Meter Analytics. In Proceedings of the 2019 IEEE 7th International Conference on Smart Energy Grid Engineering (SEGE), Oshawa, ON, Canada, 12–14 August 2019; pp. 53–58. [Google Scholar] [CrossRef]
  20. Dhaou, I.B. Smart Plug Design for Demand Side Management Program. In Proceedings of the 2019 4th International Conference on Power Electronics and Their Applications (ICPEA), Elazig, Turkey, 25–27 September 2019; pp. 1–5. [Google Scholar] [CrossRef]
  21. Luambano, M.M.; Kondoro, A.; Dhaou, I.B.; Mvungi, N.; Tenhunen, H. IoT enabled Smart Meter Design for Demand Response Program. In Proceedings of the 2020 6th IEEE International Energy Conference (ENERGYCon), Gammarth, Tunisia, 28 September–1 October 2020; pp. 853–857. [Google Scholar] [CrossRef]
  22. Jazayeri, P.; Schellenberg, A.; Rosehart, W.; Doudna, J.; Widergren, S.; Lawrence, D.; Mickey, J.; Jones, S. A survey of load control programs for price and system stability. IEEE Trans. Power Syst. 2005, 20, 1504–1509. [Google Scholar] [CrossRef]
  23. Barbato, A.; Capone, A. Optimization Models and Methods for Demand-Side Management of Residential Users: A Survey. Energies 2014, 7, 5787–5824. [Google Scholar] [CrossRef]
  24. Gungor, V.C.; Sahin, D.; Kocak, T.; Ergut, S.; Buccella, C.; Cecati, C.; Hancke, G.P. A Survey on Smart Grid Potential Applications and Communication Requirements. IEEE Trans. Ind. Inform. 2013, 9, 28–42. [Google Scholar] [CrossRef]
  25. Gallardo, J.L.; Ahmed, M.A.; Jara, N. LoRa IoT-Based Architecture for Advanced Metering Infrastructure in Residential Smart Grid. IEEE Access 2021, 9, 124295–124312. [Google Scholar] [CrossRef]
  26. Luan, W.; Peng, J.; Maras, M.; Lo, J.; Harapnuk, B. Smart Meter Data Analytics for Distribution Network Connectivity Verification. IEEE Trans. Smart Grid 2015, 6, 1964–1971. [Google Scholar] [CrossRef]
  27. Carli, R.; Dotoli, M. Energy scheduling of a smart home under nonlinear pricing. In Proceedings of the 53rd IEEE Conference on Decision and Control, Los Angeles, CA, USA, 15–17 December 2014; pp. 5648–5653. [Google Scholar] [CrossRef]
  28. Musleh, A.S.; Debouza, M.; Farook, M. Design and implementation of smart plug: An Internet of Things (IoT) approach. In Proceedings of the 2017 International Conference on Electrical and Computing Technologies and Applications (ICECTA), Ras al Khaimah, United Arab Emirates, 21–23 November 2017; pp. 1–4. [Google Scholar] [CrossRef]
  29. KAA IoT Platform. Available online: https://www.kaaiot.com/ (accessed on 13 September 2023).
  30. Ngu, A.H.; Gutierrez, M.; Metsis, V.; Nepal, S.; Sheng, Q.Z. IoT Middleware: A Survey on Issues and Enabling Technologies. IEEE Internet Things J. 2017, 4, 1–20. [Google Scholar] [CrossRef]
  31. Razzaque, M.A.; Milojevic-Jevric, M.; Palade, A.; Clarke, S. Middleware for Internet of Things: A Survey. IEEE Internet Things J. 2016, 3, 70–95. [Google Scholar] [CrossRef]
  32. Scott, R.; Östberg, D. A Comparative Study of Open-Source IoT Middleware Platforms. Bachelor’s Thesis, Health Informatics, KTH Royal Institute of Technology, Stockholm, Sweden, 2018. [Google Scholar]
  33. Balwani, M.R.; Thirumala, K.; Mohan, V.; Bu, S.; Thomas, M.S. Development of a Smart Meter for Power Quality-Based Tariff Implementation in a Smart Grid. Energies 2021, 14, 6171. [Google Scholar] [CrossRef]
  34. Orlando, M.; Estebsari, A.; Pons, E.; Pau, M.; Quer, S.; Poncino, M.; Bottaccioli, L.; Patti, E. A Smart Meter Infrastructure for Smart Grid IoT Applications. IEEE Internet Things J. 2022, 9, 12529–12541. [Google Scholar] [CrossRef]
  35. Roberto, B.; Squartini, S. Machine Learning Approaches to Non-Intrusive Load Monitoring; Springer: Berlin/Heidelberg, Germany, 2019. [Google Scholar]
  36. Smart Plug Datasheet. Available online: https://www.dlink.com/en/consumer/smart-plugs (accessed on 11 September 2020).
  37. Shrestha, A.; Mahmood, A. Review of Deep Learning Algorithms and Architectures. IEEE Access 2019, 7, 53040–53065. [Google Scholar] [CrossRef]
  38. Zhang, C.; Liu, C.; Zhang, X.; Almpanidis, G. An up-to-date comparison of state-of-the-art classification algorithms. Expert Syst. Appl. 2017, 82, 128–150. [Google Scholar] [CrossRef]
  39. Biau, G.; Scornet, E. A Random Forest Guided Tour. TEST 2016, 25, 197–227. [Google Scholar] [CrossRef]
  40. Han, S.; Kim, H.; Lee, Y.S. Double random forest. Mach. Learn. 2020, 109, 1569–1586. [Google Scholar] [CrossRef]
  41. López García, Á.; De Lucas, J.M.; Antonacci, M.; Zu Castell, W.; David, M.; Hardt, M.; Lloret Iglesias, L.; Moltó, G.; Plociennik, M.; Tran, V.; et al. A Cloud-Based Framework for Machine Learning Workloads and Applications. IEEE Access 2020, 8, 18681–18692. [Google Scholar] [CrossRef]
  42. Dutta, D.L.; Bharali, S. TinyML Meets IoT: A Comprehensive Survey. Internet Things 2021, 16, 100461. [Google Scholar] [CrossRef]
  43. Ray, P.P. A review on TinyML: State-of-the-art and prospects. J. King Saud. Univ.-Comput. Inf. Sci. 2022, 34, 1595–1623. [Google Scholar] [CrossRef]
  44. TinyML Foundation. Available online: https://www.tinyml.org/ (accessed on 13 September 2023).
  45. Abadade, Y.; Temouden, A.; Bamoumen, H.; Benamar, N.; Chtouki, Y.; Hafid, A.S. A Comprehensive Survey on TinyML. IEEE Access 2023, 11, 96892–96922. [Google Scholar] [CrossRef]
  46. Tensforflow Lite: ML for Mobile and Edge Device. Available online: https://www.tensorflow.org/lite (accessed on 13 September 2023).
  47. Nilsson, J.N.; Reidel, S. Electric Circuits, 10th ed.; Pearson Education: Upper Saddle Rive, NJ, USA, 2015. [Google Scholar]
  48. Chapra, S.C. Applied Numerical Methods with MATLAB for Engineers and Scientists; McGraw-Hill Education: New York, NY, USA, 2018. [Google Scholar]
  49. Short, J.A.; Infield, D.G.; Freris, L.L. Stabilization of Grid Frequency Through Dynamic Demand Control. IEEE Trans. Power Syst. 2007, 22, 1284–1293. [Google Scholar] [CrossRef]
  50. Jones, M.E.; Wei, B.W.; Hung, D.L. Laptop Energy-saving opportunities based on user behaviors. Energy Effic. 2012, 6, 425–431. [Google Scholar] [CrossRef]
  51. Chen, C. Smart Meter Data. 2020. Available online: https://ieee-dataport.org/documents/smart-meter-data (accessed on 22 January 2023).
  52. James, G.; Witten, D.; Hastie, T.; Tibshirani, R.; Taylor, J. An Introduction to Statistical Learning; Springer Nature: Berlin/Heidelberg, Germany, 2023. [Google Scholar]
  53. Kelati, A.; Dhaou, I.B.; Kondoro, A.; Rwegasira, D.; Tenhunen, H. IoT based Appliances Identification Techniques with Fog Computing for e-Health. In Proceedings of the 2019 IST-Africa Week Conference (IST-Africa), Nairobi, Kenya, 8–10 May 2019; pp. 1–11. [Google Scholar] [CrossRef]
  54. Franco, P.; Martínez, J.M.; Kim, Y.C.; Ahmed, M.A. IoT Based Approach for Load Monitoring and Activity Recognition in Smart Homes. IEEE Access 2021, 9, 45325–45339. [Google Scholar] [CrossRef]
Figure 1. Typical demand-response programs.
Electronics 12 04041 g001
Figure 2. Automatic appliances identification system using fog-computing paradigm.
Electronics 12 04041 g002
Figure 3. Overview of AMI.
Electronics 12 04041 g003
Figure 4. KAA middleware for home-energy-management system.
Electronics 12 04041 g004
Figure 5. Signature of a refrigerator.
Electronics 12 04041 g005
Figure 6. Block diagram of the smart plug.
Electronics 12 04041 g006
Figure 7. Illustrative graph of the frequency-estimation algorithm.
Electronics 12 04041 g007
Figure 8. Measured instantaneous voltage when a laptop device is plugged.
Electronics 12 04041 g008
Figure 9. Measured voltage in the frequency domain.
Electronics 12 04041 g009
Figure 10. Measured current consumption of a laptop.
Electronics 12 04041 g010
Figure 11. Time-of-use price used by the company Peco.
Electronics 12 04041 g011
Table 1. Load signature.
FeatureExplanation
I R M S RMS value of the current
c o s ( θ ) Power factor
PReal power
QReactive power
I R M S V R M S Admittance
Table 2. Comparison between Trapezoidal method and Equation (5).
NTrapezoidalErrorEquation (5)Error
21.00141.56 %141.42 %
2.50.6931.91%0.7638%
40.7071.57 × 10 14 %0.7749.54%
200.7071≈00.7232.35 %
Table 3. Summary of the computational complexity.
MeasurementsNumber of MultiplicationsNumber of AdditionsMemory Size
V R M S NNN
I R M S NNN
f N 2 N 2 2N
Table 4. RMS values of the laptop’s current consumption.
MeasurementWiFi OffWiFi OnPlaying YouTube Videos
I R M S in mA151166166
Table 5. Measurement results of selected devices.
Device I RMS in A
Vacuum cleaner6.64
Fan0.1
Boiler4.57
Blender1.45
Table 6. Characteristics of the laptop used to compare classification algorithms.
ProcessorOperating SystemRAMMass StorageClock Frequency
Core I7 11th generationWindows 1112 GB477 GB SSD2.8 GHz
Table 7. Characteristics of the Raspberry Pi.
ProcessorOperating SystemRAMN. CoresMax Clock Freq.Min Clock Freq.
ARMv7Raspbian Version 111 MB41.2 GHz600 MHz
Table 8. Comparison of classification algorithms.
AlgorithmParametersAccuracy
SVMC = 0.01, linear kernel97%
KNNNeighboring = 897%
Gaussian naive BayesNo prior probabilities80%
Decision treeGini index,100%
best split with minimum samples of two
Lloyd’s K-means8 number of clusters, 10 centroid seeds,90%
300 iterations
Random forest classificationNumber of trees = 100, Gini index,100%
unlimited number of leaf nodes, max feature = ζ
Table 9. Inference results on RPI.
ClassifierSize of the Pickle ModuleInference TimeAccuracy
SVM298 KB23 ms97%
Decision tree47 Kb1.59 μ s100%
Table 10. Comparison between the proposed system and related works.
WorkMeasured ParametersReal-Time IdentificationCommunication ProtocolInteroperability
[9]I, P, SNoENC28J60 Ethernet moduleNo
[10] I , P , S , cos ( θ ) NoZigbeeNo
[12] I , P , S ,NoWiFiNo
cos ( θ ) , I R M S , V R M S
[33] I , P , S , cos ( θ ) , I R M S , V R M S , F , T H D NoWiFiNo
This work I , P , S , cos ( θ ) , I R M S , V R M S , F , AdmittanceYesZigbeeYes using KAA
Table 11. Major home appliances and their usage.
ApplianceRated Power (kW)Working h/min
Electric shower71 h
Kettle35 min
Iron315 min
Grill22 h
Washing machine42 h
Electric drier52 h
Refrigerator0.1524 h
AC1.214 h
EV7.287 h
Table 12. Scheduling with no DR.
ApplianceSuper Off-PeakOff-PeakPeak
Electric shower
Kettle
Iron
Grill
Washing machine
Electric drier
Refrigerator
AC
EV
Table 13. Scheduling with TOU-based DR.
ApplianceSuper Off-PeakOff-PeakPeak
Electric shower
Kettle
Iron
Grill
Washing machine
Electric drier
Refrigerator
AC
EV
Disclaimer/Publisher’s Note: The statements, opinions and data contained in all publications are solely those of the individual author(s) and contributor(s) and not of MDPI and/or the editor(s). MDPI and/or the editor(s) disclaim responsibility for any injury to people or property resulting from any ideas, methods, instructions or products referred to in the content.

