1. Introduction
For autonomous vehicles, the rapid perception of changes in the surrounding environment is essential. Substantial research on the perception of surrounding environmental changes through various sensors is ongoing, in particular research using LiDAR (light detection and ranging) sensors. LiDAR sensors use laser pulses to extract information about objects in the surrounding environment as three-dimensional (3D) point cloud data. Autonomous driving technology has been developed that uses these point cloud data to cope with potential obstacles or sudden situations [
1]. More broadly, autonomous driving technology using point cloud data helps autonomous vehicles create safe, optimized local routes in rapidly changing road traffic situations. While autonomous driving route creation technology using the Global Positioning System (GPS) is very useful, GPS signal is frequently interrupted or inaccurate in the real world. In such cases, an autonomous vehicle must generate its route using a 3D precision map created from point cloud data for their surroundings collected from LiDAR sensors [
2]. The currency of these point cloud data is a crucial factor in creating safe routes for autonomous vehicles.
Figure 1 illustrates an example of subsequent vehicles altering their paths through a point cloud map server that ensures point cloud data currency.
Figure 1 represents the following process: (1) When a preceding vehicle navigates based on the existing map and detects changes, (2) the server updates the point cloud map to incorporate these changes. (3) After distributing the updated map, (4) subsequent vehicles adjust their paths, enabling safe autonomous driving.
Therefore, a system is needed to manage the most up-to-date set of point cloud data. This system should not only store the latest point cloud data but also be able to fetch and read the most up-to-date data in real-time, enabling autonomous vehicles to use these data for route creation. Most of the existing research on this topic has used Hadoop as a platform to process point cloud data. However, Hadoop is characteristically incapable of modifying the loaded data, meaning that the data must instead be deleted and reloaded [
3]. This incapacity presents the disadvantage of incurring significant computational costs to maintain the point cloud data in their most up-to-date state.
In response to these issues, this paper proposes a distributed HTAP architecture using a spatial database. While conventional databases are specialized for transactions, allowing for fast reading and writing of data, their storage and search efficiencies decrease as the volume of data increases, making them unsuitable for data analysis or aggregation [
4]. However, the architecture proposed herein uses both columnar tables and row-based tables, facilitating real-time analysis and transactions. Row-based tables, recording data on the disk for each row, are specialized for reading and writing capabilities, while columnar tables, recording data on the disk for each column, are specialized for aggregation and columnar operations. Based on these characteristics, we construct an architecture that allows simultaneous analysis and transactions by implementing the following functions: (1) Point cloud data and GPS data collected from vehicles are transmitted to the system in real-time. (2) The system uses the vehicle’s GPS coordinates to determine if there is point cloud data collected from coordinates within 5 m of the vehicle’s coordinates. (3a) If no such data exist, the transmitted data are inserted and stored in the map table. (3b) If such data already exist, the dissimilarity between the existing data and the new data is computed. (4) If the dissimilarity value exceeds a certain threshold, the existing data values are updated to the transmitted data values.
The architecture proposed in this paper is HTAP (hybrid transactional/analytical processing) architecture that can simultaneously handle the OLTP (online transactional process) for point cloud data transmitted in real-time and the OLAP (online analytical process) for comparative analysis between the transmitted point cloud data and the point cloud data that generated the existing precision map. Considering the size of each set of point cloud data, performing real-time transaction processing and analysis processing on a single node is untenable. Therefore, this architecture was designed based on Citus, a distributed software extension of PostgreSQL version 15.2, and was constructed with three worker nodes and one master node.
Unlike existing systems, this system has the unique feature of using columnar storage for high-cost point cloud analysis queries, thus enabling compression and parallelization. Additionally, as the number of vehicles collecting data or the volume of collected data increases, the system can maintain real-time performance by linearly increasing the number of nodes through its data rebalancing function. In this paper, we construct this architecture and determine whether the point cloud data update function based on the point cloud data analysis results operates correctly. To evaluate the performance of the architecture, we measure the OLTP/OLAP query response time and data compression efficiency. Furthermore, we compare data compression rates between our architecture’s storage type and different storage types, and we evaluate changes in OLTP/OLAP query response times resulting from an increase in the number of nodes within our architecture’s configuration.
The main contributions of our study can be summarized as follows:
We constructed a HTAP (hybrid transactional/analytical processing) architecture that inserts, analyzes and updates point cloud data in real-time using distributed database technology.
The architecture has a feature that autonomously detects changes over time by determining the dissimilarity between sequential runs through the environment and maintaining and managing the latest state of point cloud data.
We evaluate whether this architecture is suitable for continuous operation by measuring OLTP/OLAP query response time and data compression efficiency.
The structure of the remainder of this paper is as follows:
Section 2 introduces related research and background knowledge.
Section 3 describes the architecture structure and the algorithm by which the architecture operates.
Section 4 explains the evaluations conducted and their results, and, finally,
Section 5 concludes with an analysis of the results from
Section 4.
3. Distributed HTAP Architecture for Point Clouds
In this section, we provide an explanation of the configuration of the suggested framework and the algorithm utilized for data processing. In
Section 3.1, we provide an overview of the overall structure of the system architecture developed for analyzing and updating the data collected from vehicles. In
Section 3.2, we describe the structure of the distributed database cluster built to handle the HTAP workload. In
Section 3.3, we detail the data flow, from collecting LiDAR data from vehicles to the final data update process. Lastly, in
Section 3.4, we explain the algorithm for comparing and analyzing point cloud data based on the dissimilarity between the existing dataset and the new dataset.
3.1. System Architecture
The proposed system aims to update the point cloud map in real-time using data collected from data collection vehicles. Accordingly, the system architecture of this study is divided into the Edge part, which collects LiDAR and GPS data, and the Cloud part, which is a data platform that analyzes and updates the data, as shown in
Figure 2.
3.1.1. Edge Part
For the Edge part, we established a sensor data collection environment using the ROS (Robot Operating System) middleware [
17], which provides a framework for networking robotic sensor components. Then, preprocessing was conducted on the collected data. The LiDAR topic, which represents the surrounding environment and was collected from the vehicle’s LiDAR sensor, was down-sampled using the voxel grid filter. Points that captured the shape of the observed vehicle were filtered out using masking to ensure that they were excluded from the data [
18]. The topic detailing the vehicle’s position and direction, gathered from the GPS sensor, was denoised using a Kalman filter. Subsequently, these ROS topics were transmitted to the broker cluster, a system responsible for managing and distributing messages, as Kafka topics through a Kafka–ROS Connector [
19], which facilitates seamless integration between the ROS and Kafka platforms.
3.1.2. Cloud Part
For the Cloud part, all systems were built using cloud computing services to enable proactive scaling. When a topic was delivered to the Kafka broker server, AWS (Amazon Web Services) Lambda [
20], a serverless function triggered based on that event, acted as a consumer to process the data and then inserted it into the distributed database cluster. The distributed database cluster consisted of a total of three nodes: one coordinator node and two worker nodes. A pipeline was set up so that the Lambda function stored the data in an S3 bucket, which is a scalable storage service offered by AWS, ensuring future access to the original point cloud data.
3.2. Distributed Database Cluster for HTAP Workloads
In this study, the distributed database cluster was constructed using the Citus distributed solution based on PostgreSQL. We chose Citus because it supports columnar tables within the given database, and its query optimizer offers distributed optimization for analytical queries. With these features, our system was designed to manage both row-based and columnar tables within a single database, enabling real-time analysis of large-scale data and immediate transaction processing. Additionally, we utilized the Point_Cloud and PostGIS extensions supported by the open-source PostgreSQL to handle point cloud data types and functions [
21]. For the role of a connector, which allows the bulk transfer of external point cloud data to PostgreSQL, we employed the C++-based Point Data Abstraction Library (PDAL) [
22].
Figure 3 shows the structure of the distributed database cluster capable of handling the HTAP workloads shown in
Figure 2. This HTAP architecture, namely the distributed database cluster, is composed of a coordinator node and three worker nodes. The coordinator node holds metadata related to the distributed tables on each worker node. When queries are executed on distributed tables, the coordinator node, through the Query Optimizer, forwards the queries to each node and aggregates the results. This approach enhances the response time of queries that involve extensive exploration or computation. Considering the size of the data used in this study, it was determined that a cluster of three nodes would be suitable for distributing the workload effectively. Therefore, three worker nodes were established with the same configuration.
HTAP architectures typically use row-based storage as the standard for data input, with columnar storage replicating the data to handle HTAP workloads. However, the architecture presented in this paper takes a different approach. This architecture batch-inserts data into the columnar table and then, after comparing with the existing data, updates the row-based table. The reason this approach is feasible is because we significantly reduced the duration of OLAP queries by parallelizing them and arranging columns with low cardinality. By placing columns with low cardinality, the system enhances the performance of high-cost aggregate queries. Detailed insights into the data flow and algorithms are provided in
Section 3.3 and
Section 3.4.
The point_cloud_analysis table, in which data are most frequently stored and aggregate and analysis queries are run regularly, was constructed as a distributed columnar table. The “point_cloud_analysis” table was designed with the “sector” column as the distribution key. This decision was made because the table mainly executes queries that involve aggregation and computations based on sectors. In contrast, the point_cloud_map table, which frequently undergoes upsert (update or insert) and read transaction operations, was built as a distributed row-based table. Considering that the table involves both deletion and insertion operations based on the “ref_id” column, the “ref_id” column was chosen as the distribution key. Additionally, since there are frequent searches based on the GPS column, a generalized search tree (GiST) index has been set on the GPS column. The GIST index, short for Generalized Search Tree index, is a data structure used in databases to efficiently manage spatial data and enable quick spatial queries, such as range searches and nearest neighbor searches [
23]. The gps_position_log, imu_pose_log, and point_cloud_analysis_hist tables were constructed as row-based tables on the coordinator node without distributing them. This decision was made not only because these tables are relatively small but also because large-scale operations frequently use the data within these tables as a reference. If these tables were to be distributed, there would be a risk of network overhead, so these tables are composed of a single table belonging to the coordinator node.
Figure 4 shows the entity relationship diagram for these tables. All tables possess a column named ref_id. The ref_id functions as an identifier allocated to data in accordance with the vehicle’s LiDAR data collection cycle, representing unique values for reported time, GPS coordinates, and heading angle. When a vehicle collects Point Cloud Data using LiDAR, the reported time, GPS coordinates, and heading angle of the vehicle are associated with a ref_id and written into the gps_position_log table. The corresponding IMU data at that moment is recorded in the imu_pose_log table, while the generated histogram is written into the point_cloud_analysis_hist table. As each of these three tables contains data rows that are uniquely associated with ref_id, they use ref_id as their primary key. Both the point_cloud_map and point_cloud_analysis tables share the same ref_id for all points captured at that moment. The point_cloud_map table consists of a point cloud data column, an updated_at column indicating when the data was last updated, and the GPS coordinates of the vehicle. Lastly, the point_cloud_analysis table is configured to categorize point cloud data based on the location of points using the sector column, enabling swift aggregation.
3.3. Data Flow in HTAP Architecture
The primary objective of the system constructed in this study is to analyze data collected from LiDAR, the inertial measurement unit (IMU), and GPS sensors in real-time through the HTAP architecture. Based on the analysis results, the system updates and maintains the point cloud dataset in its latest version. This subsection provides a detailed explanation of the data processing pipeline designed to achieve this goal.
Figure 5 shows the process of data handling within the system presented in this study. The detailed steps of this flow chart are described below.
Data from LiDAR, GPS, and IMU sensors, collected from each vehicle operating in the ROS environment, are generated at 1-s intervals. These data undergo preprocessing in the Edge part of the architecture and are then forwarded to Lambda. PCD data undergo down-sampling using the voxel grid filter, and points corresponding to the observing vehicle and ground points are removed via the mask filter. GPS data are refined for accuracy and noise reduction using IMU data and a Kalman filter. The preprocessed data are sent to the Kafka broker server, from which the serverless function Lambda, acting as a Kafka consumer, receives it. Subsequently, Lambda, which has access to the Citus cluster, sends a query related to data processing to the coordinator node.
Lambda inserts the GPS and IMU data into the gps_position_log and imu_pose_log tables, respectively, and retrieves a new ref_id. It then searches for previously inserted vehicle coordinates within 5 m of the new ref_id’s GPS data using the ST_DWithin function. If a significant quantity of data is found, Lambda retrieves the existing ref_id, GPS, and heading values of the physically closest and most recently inserted data.
If no such data are found, the point_cloud_map and point_cloud_analysis tables are immediately bulk-loaded with point cloud data.
If such data do exist, the differences are calculated between these data and the LLH coordinates and heading values from the GPS sensor. The data corresponding to the new ref_id in the gps_position_log table are then updated with the GPS and heading data corresponding to the existing ref_id.
Based on the GPS and heading differences calculated in step 4, Euler rotation and coordinate transformations are performed on the new point values. The angles formed by the points based on the heading are calculated to distinguish sectors. The transformed data are then bulk-loaded into the point_cloud_analysis table.
When bulk-loading point cloud data in step 5, a histogram of those point cloud data is generated. Distributions of points along the x-, y-, and z-axes are created and inserted into the point_cloud_analysis_hist table.
In the point_cloud_analysis table, the points corresponding to existing ref_id and new ref_id are aggregated by sector, and then the difference in average distance between each point and origin and the Euclidean distance between the two histograms is measured. This OLAP query is executed only for points within 30 m, and a standard threshold is set. If the dissimilarity exceeds this threshold, the comparator returns true. Otherwise, it returns false. This comparison algorithm is discussed in detail in
Section 3.4.
If the result of step 7 is true, the data corresponding to the existing ref_id in the point_cloud_map table are updated with the data for the new ref_id, and the updated_at column records the update time.
If the result of step 7 is false, the system determines that no changes have occurred. Therefore, within the gps_position_log table, data corresponding to the new ref_id are removed, while data within the point_cloud_map table are preserved without updating.
3.4. Algorithm for Comparing and Analyzing Point Clouds
This subsection explores the algorithm for comparing and analyzing point cloud data, as introduced in
Section 3.3.
Initially, new point cloud data captured within a 5-m radius of the existing ref_id’s position undergo Euler rotation and coordinate transformation. This step ensures that every point aligns with the coordinate system of the data corresponding to the existing ref_id. Subsequently, the transformed point cloud data points are allocated to sectors, based on the angle measured clockwise in plan view from the reference point (0, 0) as the origin and true north, in increments of 30 degrees. Given that our system conducts OLAP operations on points with significantly high cardinality, we introduced a sector column with a relatively low cardinality of 12. Using this column as a reference, the query optimizer parallelizes the OLAP query, thereby reducing the computation time.
Table 1 shows the query response time based on the presence or absence of the sector column for join operations. This query aggregates the number of points for both the existing ref_id and new ref_id. For each of the two distinct pairs of ref_ids presented, the response time reduction associated with the presence of the sector column was 4.836 s (for existing ref_id 1 and new ref_id 2) and 4.746 s (for existing ref_id 3 and new ref_id 4). This response time reduction corresponded to a decrease of approximately 65%.
The point cloud data loaded into the point_cloud_analysis table are aggregated with points from the existing ref_id from within the same sector and within 30 m of the origin. For each sector, the average distance of points to the origin is measured and then squared. Subsequently, three histograms are generated based on the distribution of points within the same sector for the x-, y-, and z-axes, and the differences between these histograms and the histograms representing the existing ref_id are calculated. In this system, the histogram divides each axis within a sector into 59 sections from −30 m to +30 m, summing up the number of points in each section, resulting in an array of total length 60.
Figure 6 depicts a top-view perspective of the vehicle, and the histogram shown in the illustration represents the distribution based solely on the x-values of points within the same sector, disregarding y and z values.
Figure 6 shows the points within sector 2 categorized into 1-m intervals along the
x-axis, representing the count of points within each interval using a one-dimensional array. The illustration provides an example for better understanding, using an array of length 6. However, in reality, a 60-length array ranging from −30 m to +30 m is employed for representation. This approach allows for the abstraction of complex 3D point distributions into simple arrays of three 1D histograms, reducing computation costs accordingly. Through this histogram, the clustering pattern of the points can be represented as an array, making meaningful comparisons feasible.
The metric for assessing the dissimilarity of point cloud data in this paper is expressed as shown in Equation (1). The dissimilarity between two ref_ids is quantified using the product of two quantities: (1) the square of the difference between the existing ref_id and the new_ref_id for the average distance of the point to the origin, and (2) the sum of the Euclidean distances for the x-, y-, and z-axes histograms between the existing ref_id and the new ref_id. We formulated a metric by multiplying the histogram, which represents the point distribution pattern with the difference in the average distance representing the distance to the points. This metric is designed to detect changes unless the distribution of points is similar and the average distance is consistent.
The pseudocode for the OLAP query code corresponding to the above algorithm is shown in Algorithm 1. Histogram construction was implemented using the width_bucket function, and it was managed as an array using the array_agg function.
| Algorithm 1: Pseudocode of online analytical process (OLAP) query for comparing point clouds |
WITH
new_data AS (
SELECT sector,
AVG(ST_Distance(point_cloud_data, ST_MakePoint(0, 0))) AS avg_distance
FROM point_cloud_analysis
WHERE ref_id = β
AND ST_Distance(point_cloud_data, ST_MakePoint(0, 0)) < 30
GROUP BY sector
),
existing_data AS (
SELECT sector,
AVG(ST_Distance(point_cloud_data, ST_MakePoint(0, 0))) AS avg_distance
FROM point_cloud_analysis
WHERE ref_id =α
AND ST_Distance(point_cloud_data, ST_MakePoint(0, 0)) < 30
GROUP BY sector
),
euclide_distance AS (
SELECT
EuclideDistance(new_histogram.x, existing_histogram.x) as euc_dist_x,
EuclideDistance(new_histogram.y, existing_histogram.y) as euc_dist_y,
EuclideDistance(new_histogram.z, existing_histogram.z) as euc_dist_z
FROM point_cloud_analysis_histogram AS new_histogram
JOIN point_cloud_analysis_histogram AS existing_histogram
ON new_histogram.ref_id = β
WHERE existing_histogram.ref_id = α
)
SELECT
CASE
WHEN EXISTS (
SELECT 1
FROM new_data
JOIN existing_data ON new_data.sector = existing_data.sector
CROSS JOIN euclide_distance
WHERE Power(new_avg_distance − existing_avg_distance) *
(euc_dist_x + euc_dist_y + euc_dist_z) > THRESHOLD
) THEN TRUE
ELSE FALSE
END AS change_detected |
The OLAP query code used consists of three CTEs (common table expressions). The CTEs that calculate the average distance of aggregated points by sector from the point_cloud_analysis table are named new_data and existing_data. Additionally, a CTE named euclid_distance is designated to retrieve the histogram corresponding to the two ref_ids from the point_cloud_analysis_hist table and calculate the Euclidean distance between the two histograms. Subsequently, using the received new_ref_id and existing_ref_id, the average distance difference by sector and the Euclidean distance are computed. These computed values are then used in the form of the previously described Equation (1) to calculate the dissimilarity. If the dissimilarity exceeds the threshold in any case, the data corresponding to the existing ref_id in the point_cloud_map table are updated with the new data.
4. Evaluation of HTAP Architecture
In this section, we conduct qualitative and quantitative evaluations of the proposed architecture. In
Section 4.1, we outline the scenarios for both qualitative and quantitative evaluations.
Section 4.2 presents the results of the qualitative evaluation obtained from our experiments, with a particular emphasis on assessing whether point_cloud_map table updating based on dissimilarity judgments proceeds as intended. In
Section 4.3, to quantitatively assess whether the data transmitted from the vehicle are processed without delay, we evaluate distributed processing capability, data compression rate, and total processing time. We also evaluate performance under the same scenario for the conventional relational database (RDB) cluster and compare them with our proposed system.
4.1. Evaluation Scenario
The primary objective of our system is an architecture that effectively detects changes in point cloud data in real-time and updates the point cloud map accordingly. To determine whether this feature operates correctly, we conducted an actual driving test with multiple replicate drives on a specific route depicted in
Figure 7. The experimental scenario for the qualitative evaluation was as follows.
After the first drive, extract the GPS data from the gps_position_log table and the point data from the point_cloud_map table into CSV (comma-sorted values) files.
After the second drive, extract the data into CSV files.
Identify any changes in the road environment between the first and second drives. Determine the times and GPS coordinates at which these changes were observed.
Convert each CSV file into a PCD file and merge it with the GPS coordinates to create a point cloud map based on the ENU (east, north, up) coordinate system.
Visualize using Python and check whether the point cloud map at the location where changes were observed in step 3 has been updated.
To determine whether the point_cloud_map table has been appropriately updated, use spatial queries to check the data around the location where changes were observed.
Through the above process, we conducted a qualitative evaluation. For a quantitative evaluation, driving data were recorded to an ROS bag file during 20 drives. Subsequently, to verify data compression performance, we compared the row-based and columnar tables in both their distributed and non-distributed forms. We compared query response times by varying the number of nodes in the system to demonstrate the distributed processing capability among the nodes in the proposed system. Additionally, we measured the total processing time from the moment the data were collected until they were finally updated or dismissed. This measurement approach involved periodically purging the analyzed data from the point_cloud_analysis table to reduce unnecessary overhead. In conclusion, to evaluate the effectiveness of the proposed architecture, we established a distributed cluster with a conventional relational database, as opposed to HTAP architecture, and conducted the same evaluation, comparing the results.
4.2. Qualitative Evaluation
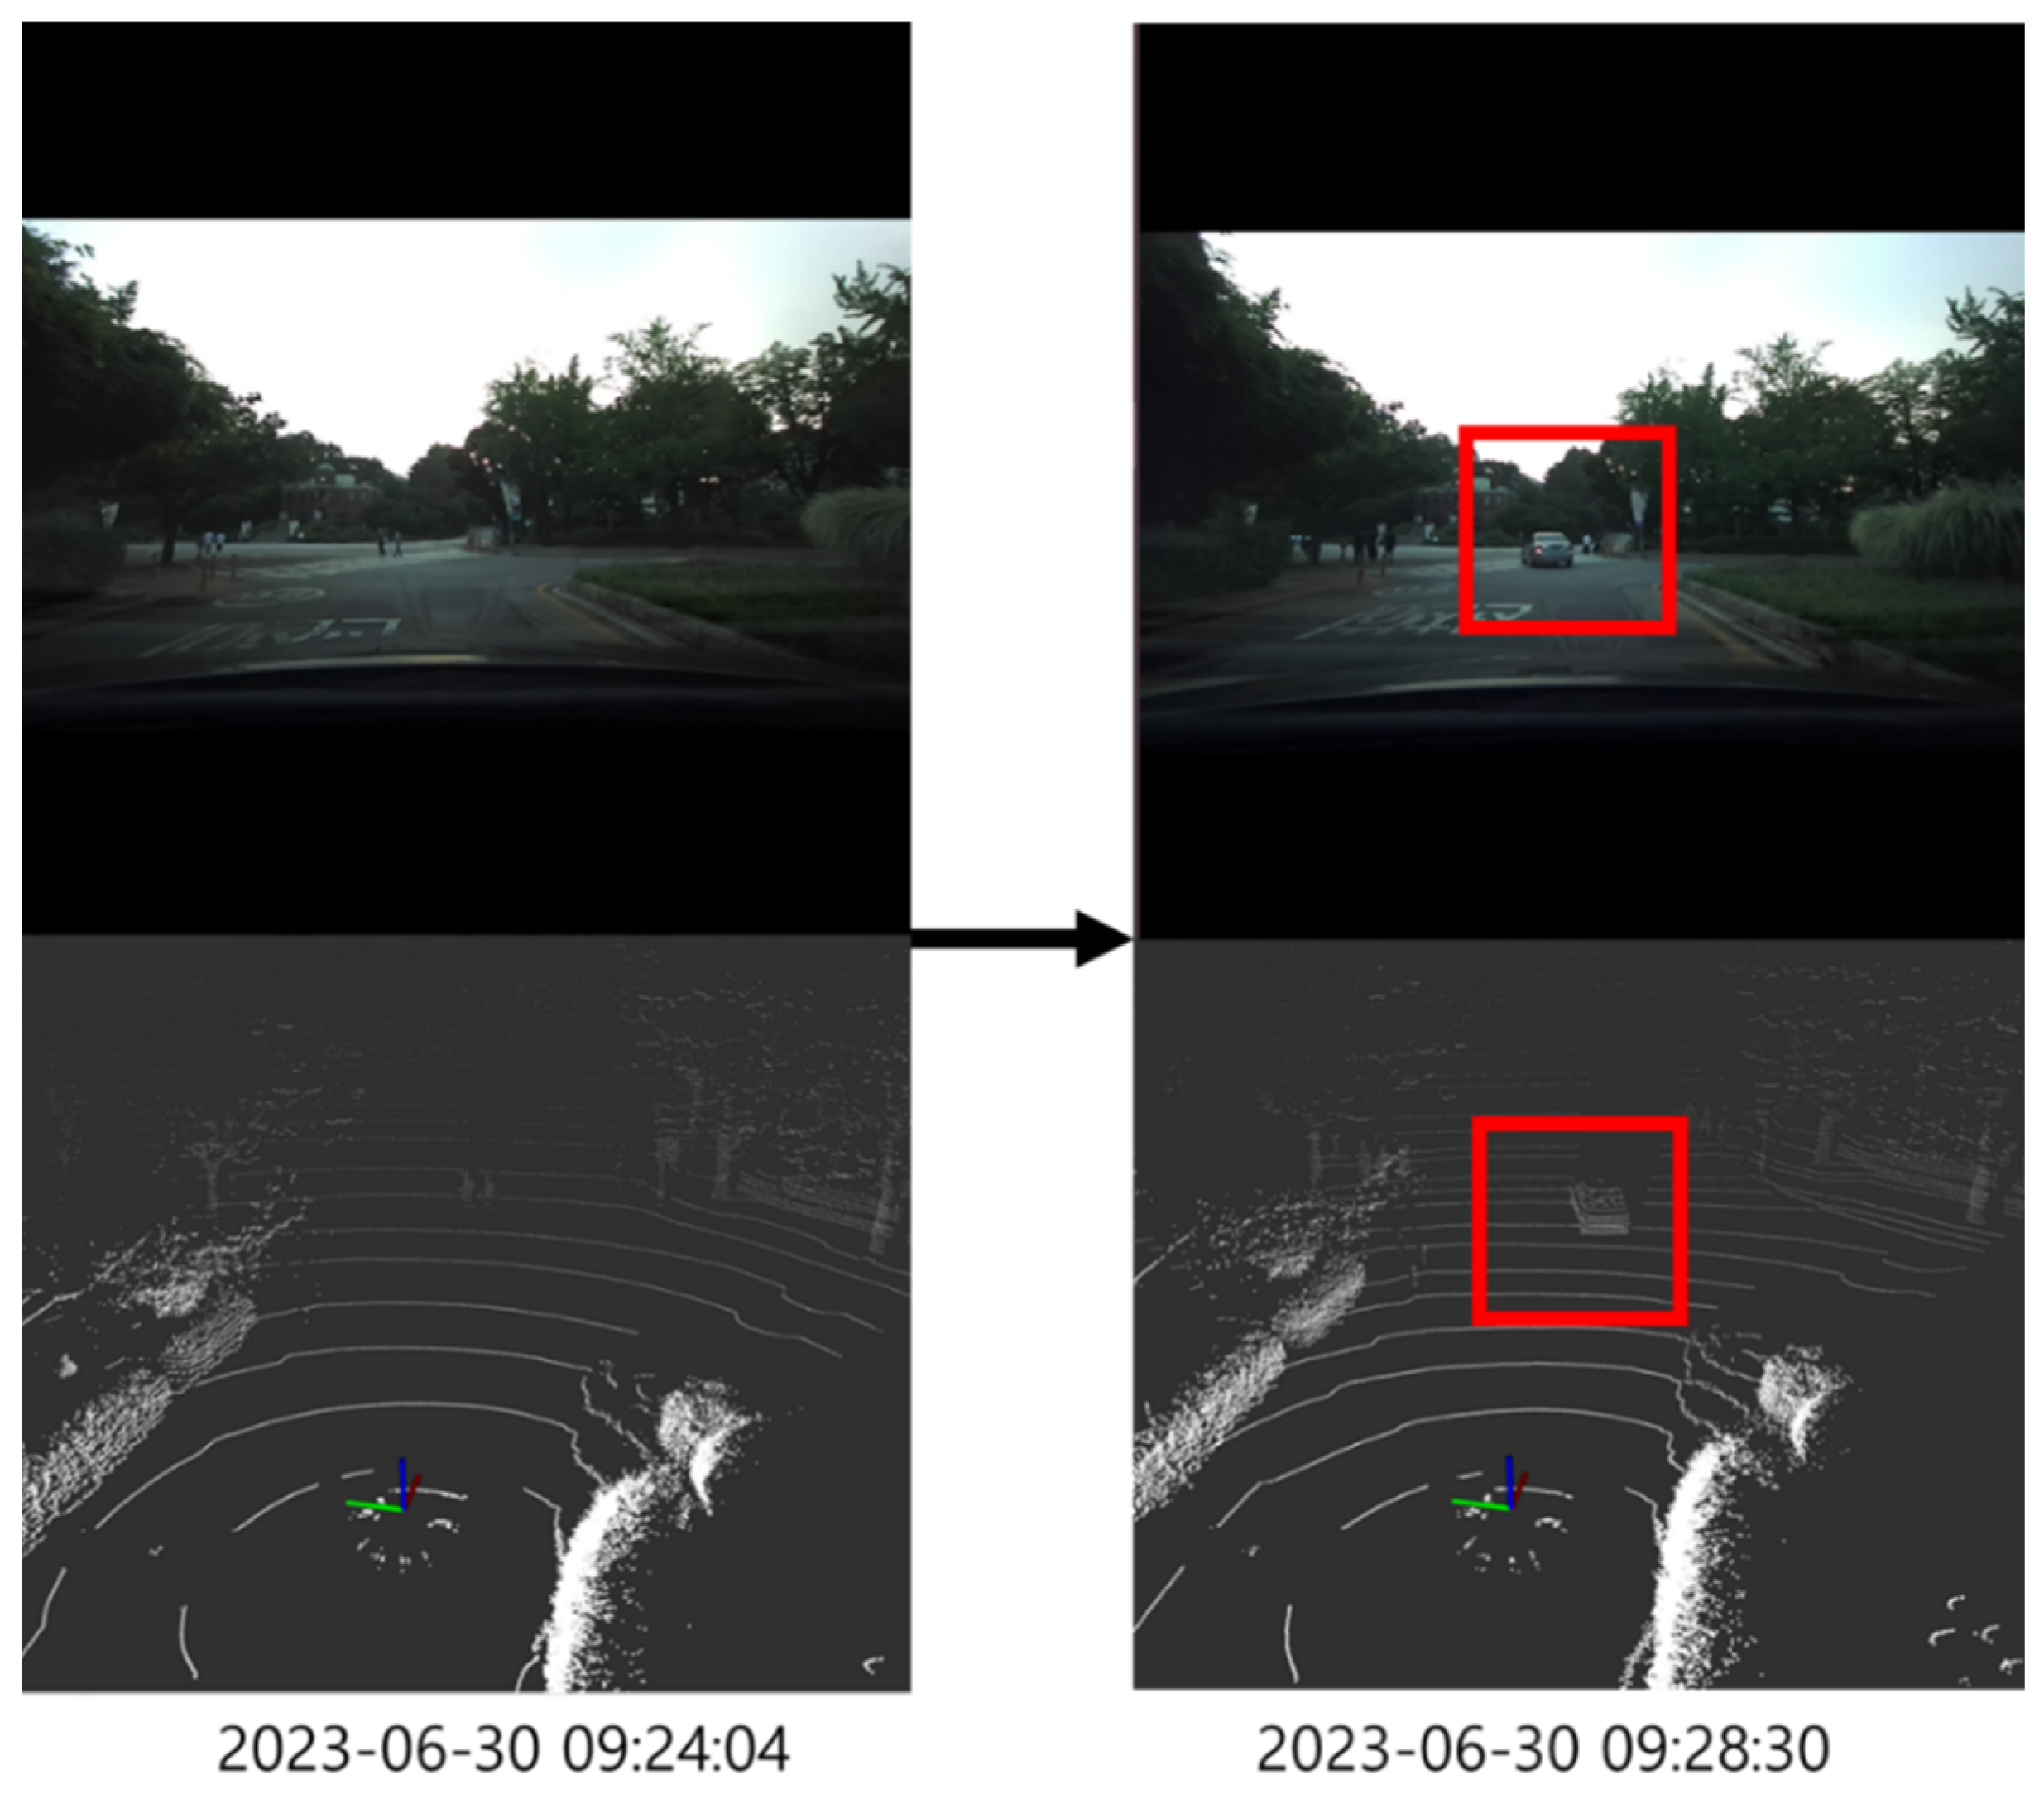
Examples of changes detected during implementation of the scenario laid out in
Section 4.1 are presented in
Figure 8, with the left-hand panels representing the first drive and the right-hand panels representing the second drive. The upper portion of
Figure 8 displays an image captured by a monologue camera, while the lower portion depicts an image captured by the LiDAR sensor. The data captured by the LiDAR sensor were visualized using the Ros Rviz software version melodic on the Ubuntu operating system. The operation of the architecture was verified by targeting the vehicle observed during the second drive (highlighted in a red box).
Figure 9 compares the maps created from the point_cloud_map table values after each drive. The map from the first drive (left panel), during which no vehicle was detected, autonomously updated itself after detecting changes in the point cloud data due to the vehicle observation during the second drive. The updated map (right) shows the changes observed during the second drive (highlighted in a red box).
In this study, we focus on ensuring the currency of the original point cloud data for map creation, rather than on the creation of point cloud maps.
Figure 9 visualizes the data from the point_cloud_map table, which was extracted into PCD files and merged without any additional processing, based on the ENU coordinate system, to verify if the data have been updated to their latest version. As seen in
Figure 9 (right), moving objects appear as afterimages, indicating that the original data have been appropriately updated.
The vehicle was first detected at a longitude of 127.076675° E and a latitude of 37.5425422° N. Therefore, we examined the data from the point_cloud_map table around this location.
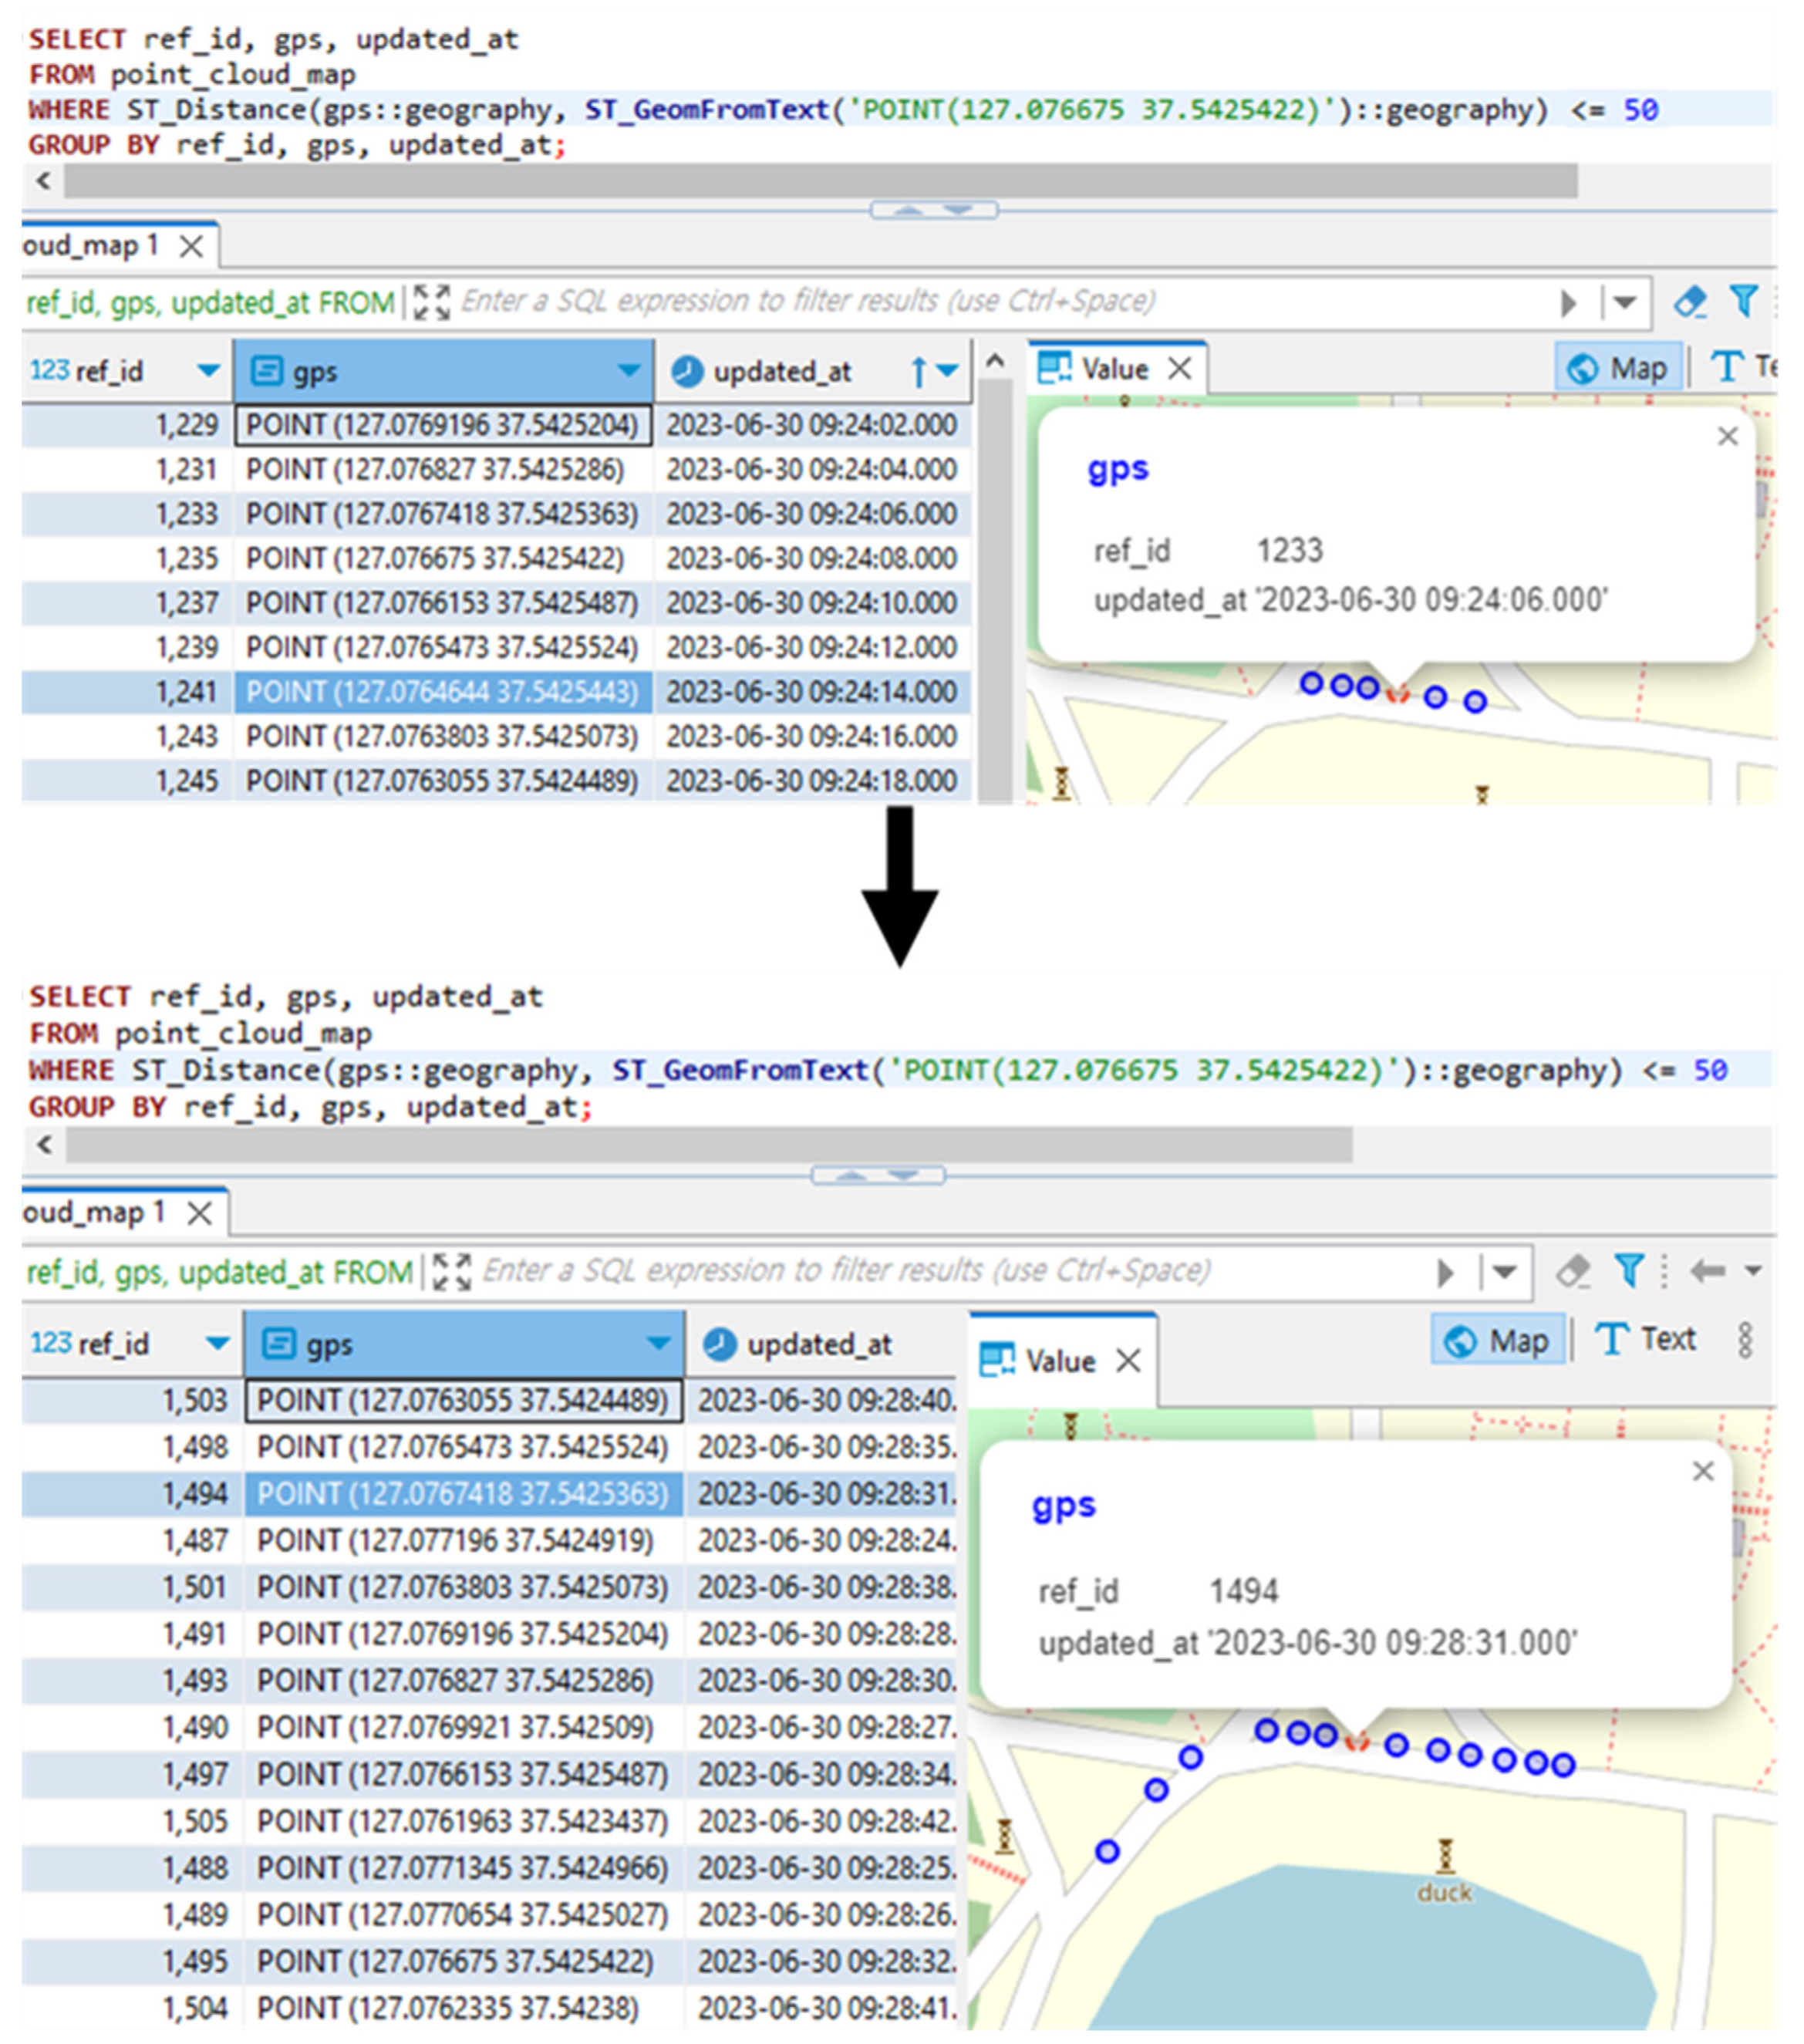
Figure 10 compares the results obtained from querying the point_cloud_map table spatially.
To verify whether the point cloud data at the location where the vehicle was detected has been updated, we used a spatial query to search for GPS values within 50 m of the location where the vehicle was detected in the point_cloud_map table. After the first drive, the query result showed that the GPS data were updated at “2023-06-30 09:24:06”. These GPS data were confirmed to have been updated after the second drive at “2023-06-30 09:28:31”, indicating that the architecture operated correctly.
4.3. Quantitative Evaluation
To evaluate the performance of the architecture, we assessed the compression rate by comparing our system’s storage type with other storage types in terms of how the rate of storage size increased as the data volume increased. Additionally, we evaluated the system’s response time for different types of queries as the data volume increased, and we evaluated its distributed processing capability as the number of nodes increased.
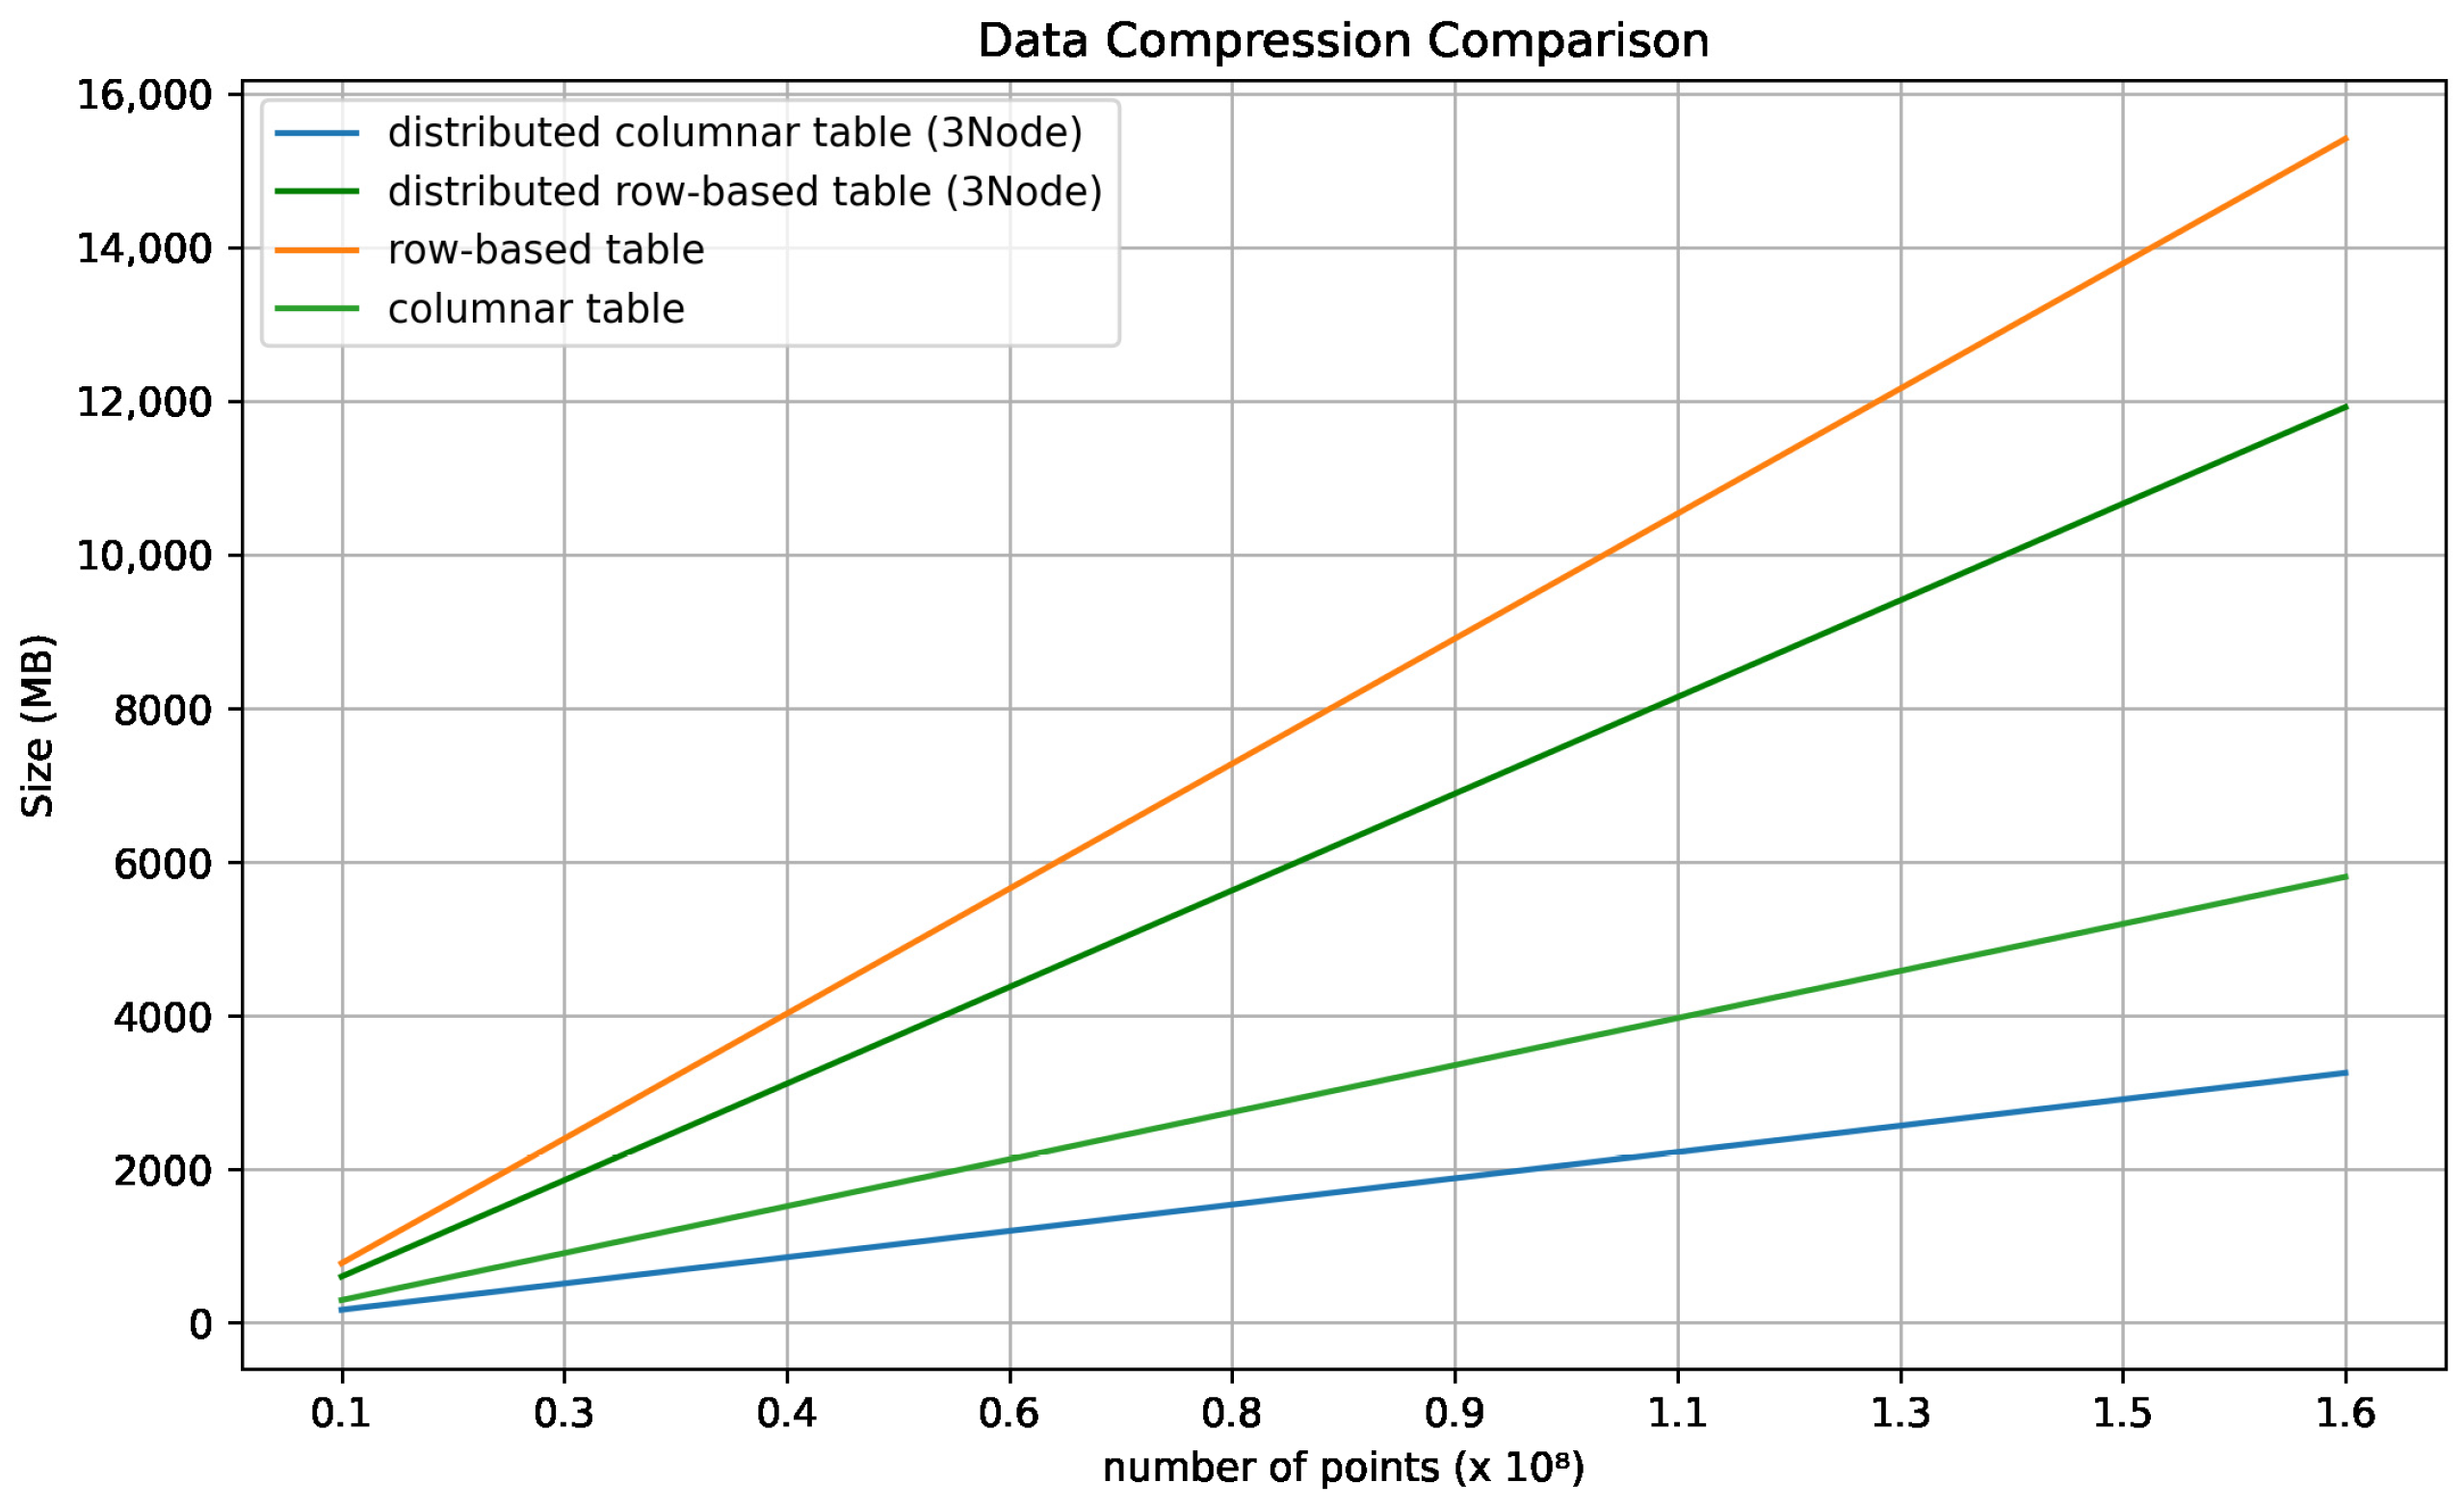
For the comparison of data compression rates, we conducted experiments with four different table types. The types of tables selected were a distributed columnar table, a distributed row-based table, a row-based table, and a columnar table. After each drive, the size of the table was measured.
Figure 11 represents the measured data as a graph.
The total number of points to be handled in 20 runs was approximately 160,000,000, and the distributed columnar table was the most compressed, with a size of 3254 MB, which is 21% of the size compared to the row-based table. In our architecture, the point_cloud_map table is continuously updated, thus restricting the overall data increase. However, the point_cloud_analysis table continues to accumulate for additional analysis. Therefore, we designed the point_cloud_analysis table as a distributed columnar table. Indeed, the point_cloud_analysis table was compressed to about 40% compared to the PCD files stored in S3.
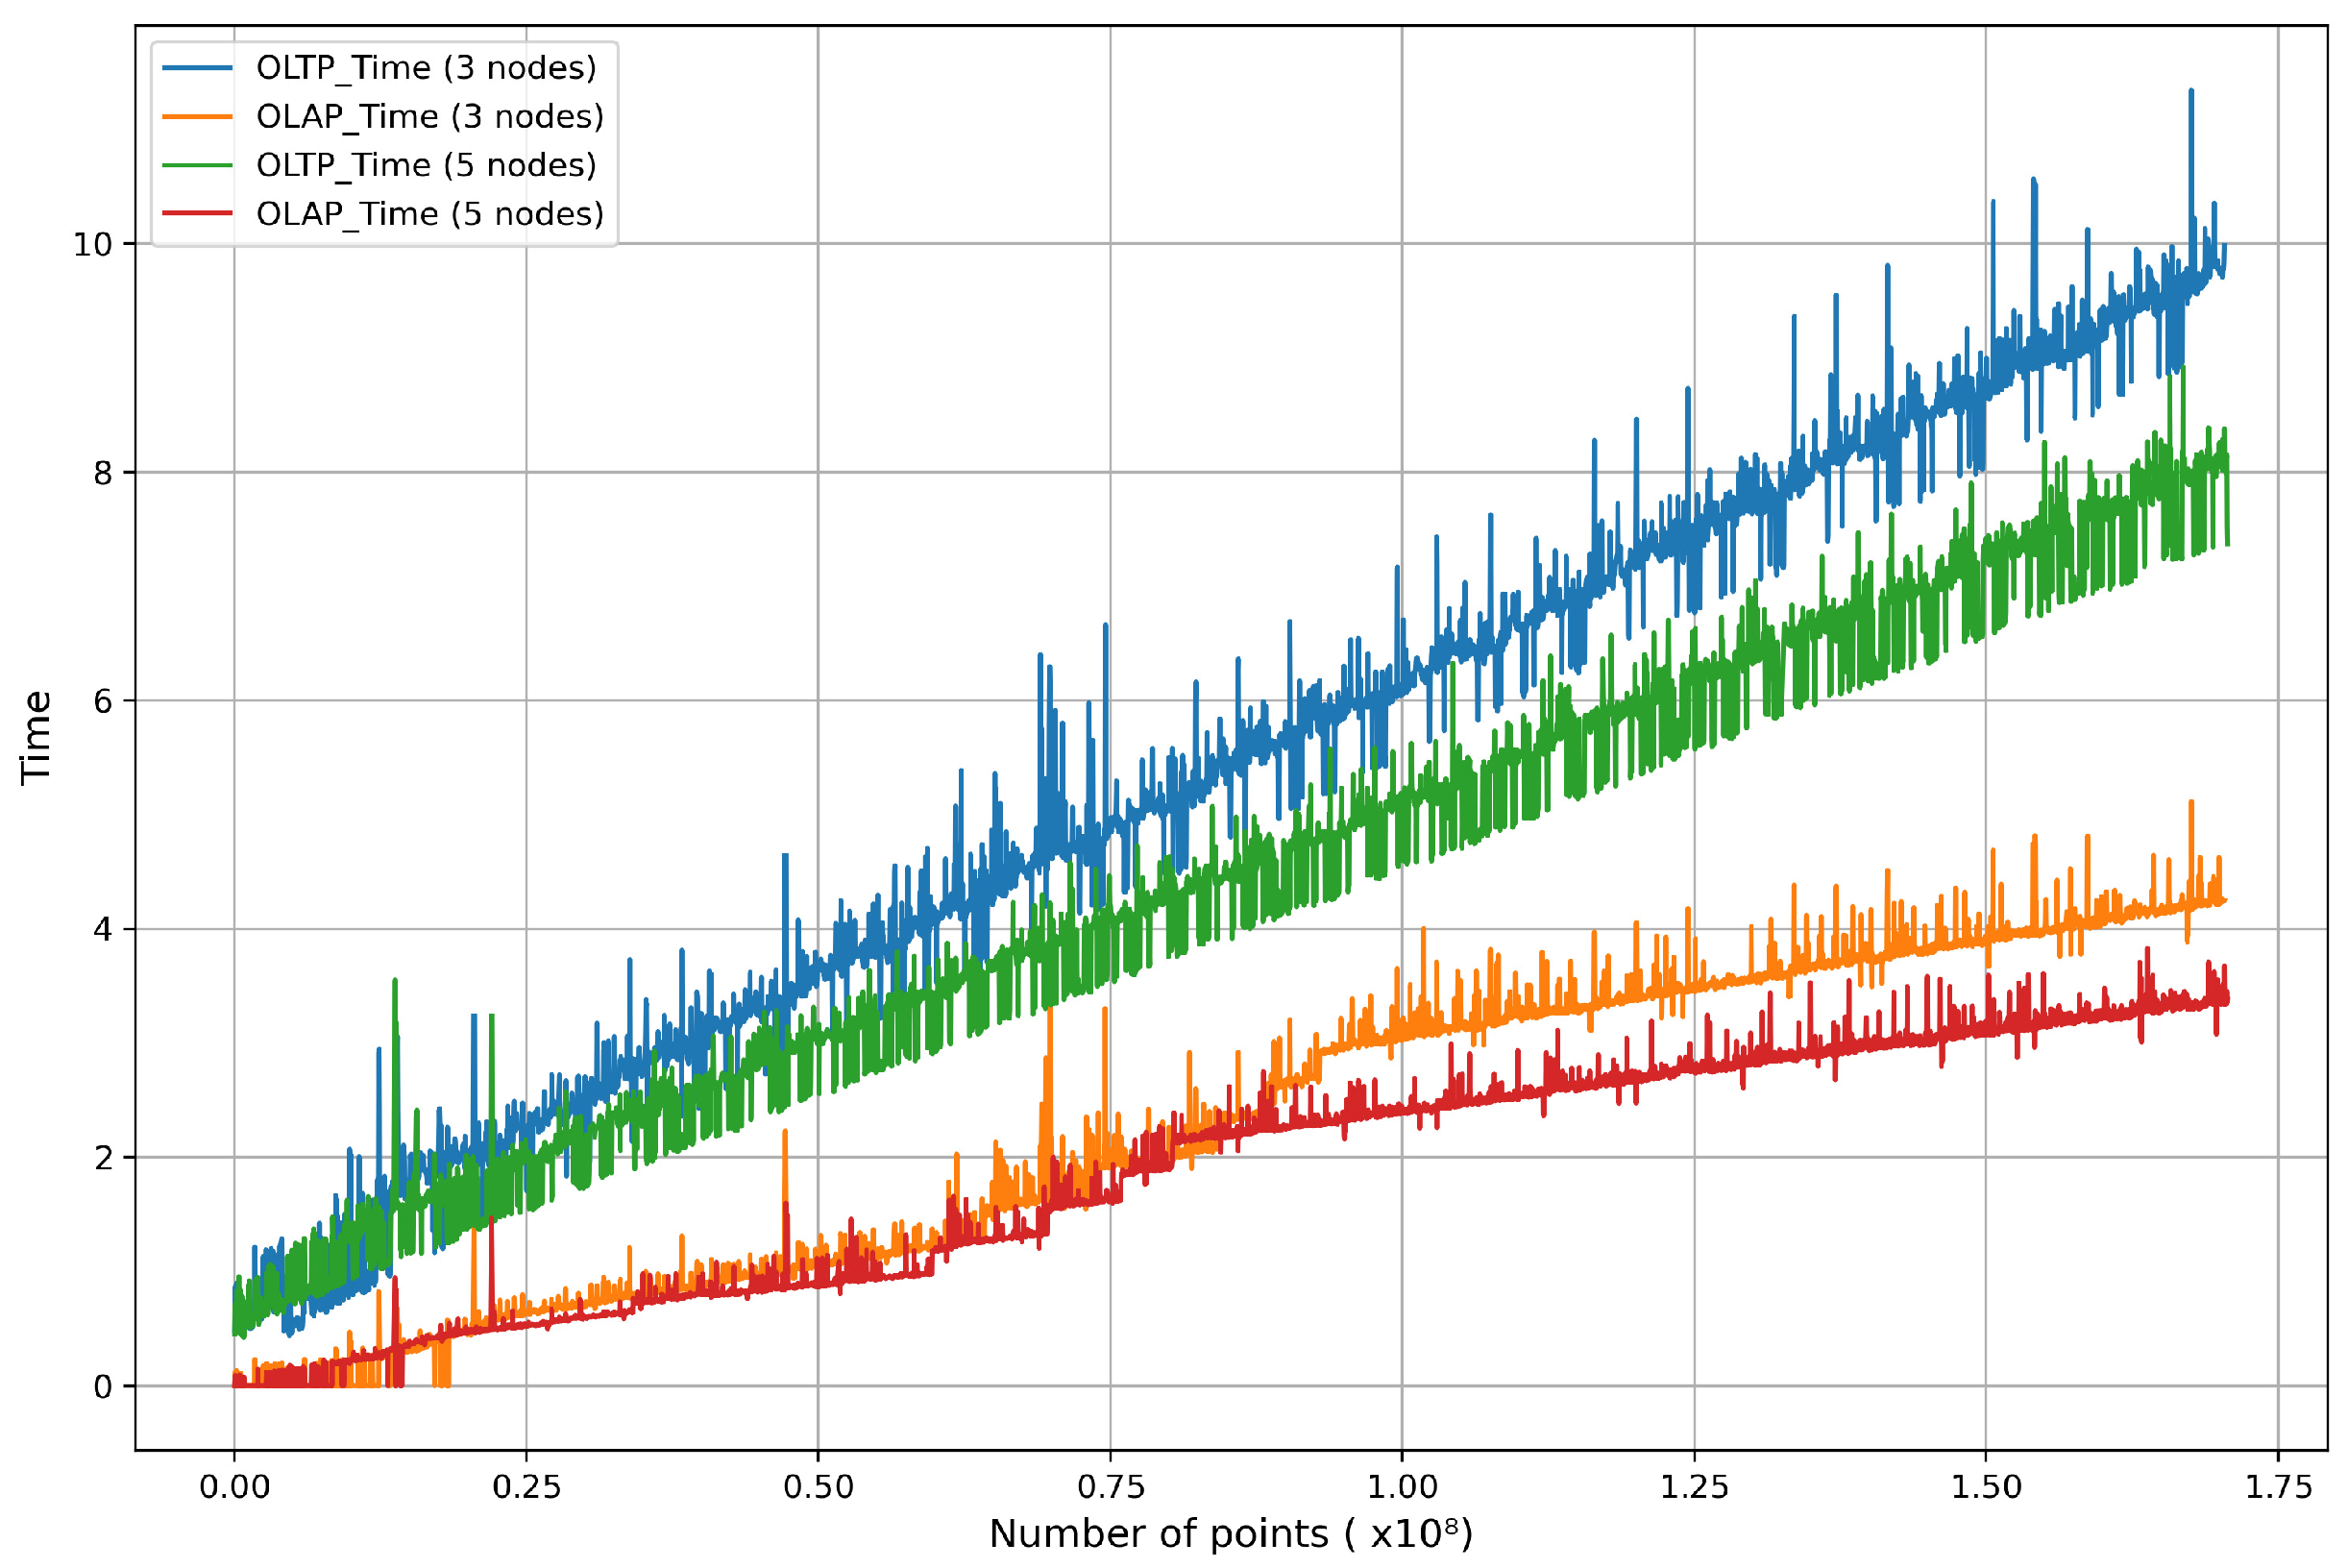
Figure 12 presents a graph showing the changes in query response time as the total size of the stored data increased over the course of 20 drives while continuously operating the architecture. To evaluate the HTAP workload processing performance and distributed processing performance of the architecture, we differentiated the response times for OLTP and OLAP queries. We then conducted the same experiment after increasing the number of nodes in the architecture from 3 to 5.
Figure 12 displays consistent linear growth rather than a rapid spike. This behavior suggests that the architecture was running stably and handling the load predictably. When the architecture’s node count was increased to five, the query response time growth rate was about 20% lower than with three nodes. This result indicates that the coordinator node was effectively managing distributed parallelization for both OLTP and OLAP queries. These findings show that the distributed processing feature of the architecture introduced in this study was functioning reliably.
However,
Figure 12 makes it clear that as the total size of the stored data increased, the system performance worsened. In the initial stages with a smaller stored data volume, the OLTP query response time was 0.86 s, and the OLAP query response time was about 0.11 s, resulting in a total response time of 0.97 s. However, as the stored data volume grew to around 160,000,000 entries, the OLTP query response time increased to 9.60 s, and the OLAP query response time reached approximately 4.28 s, summing up to 13.88 s in total. To achieve the system objective of updating point clouds in real-time, it is necessary to purge previously analyzed data. Therefore, we adopted a method of periodically purging already analyzed data from the point_cloud_analysis table to reduce unnecessary overhead. An evaluation conducted using this approach is shown in
Figure 13.
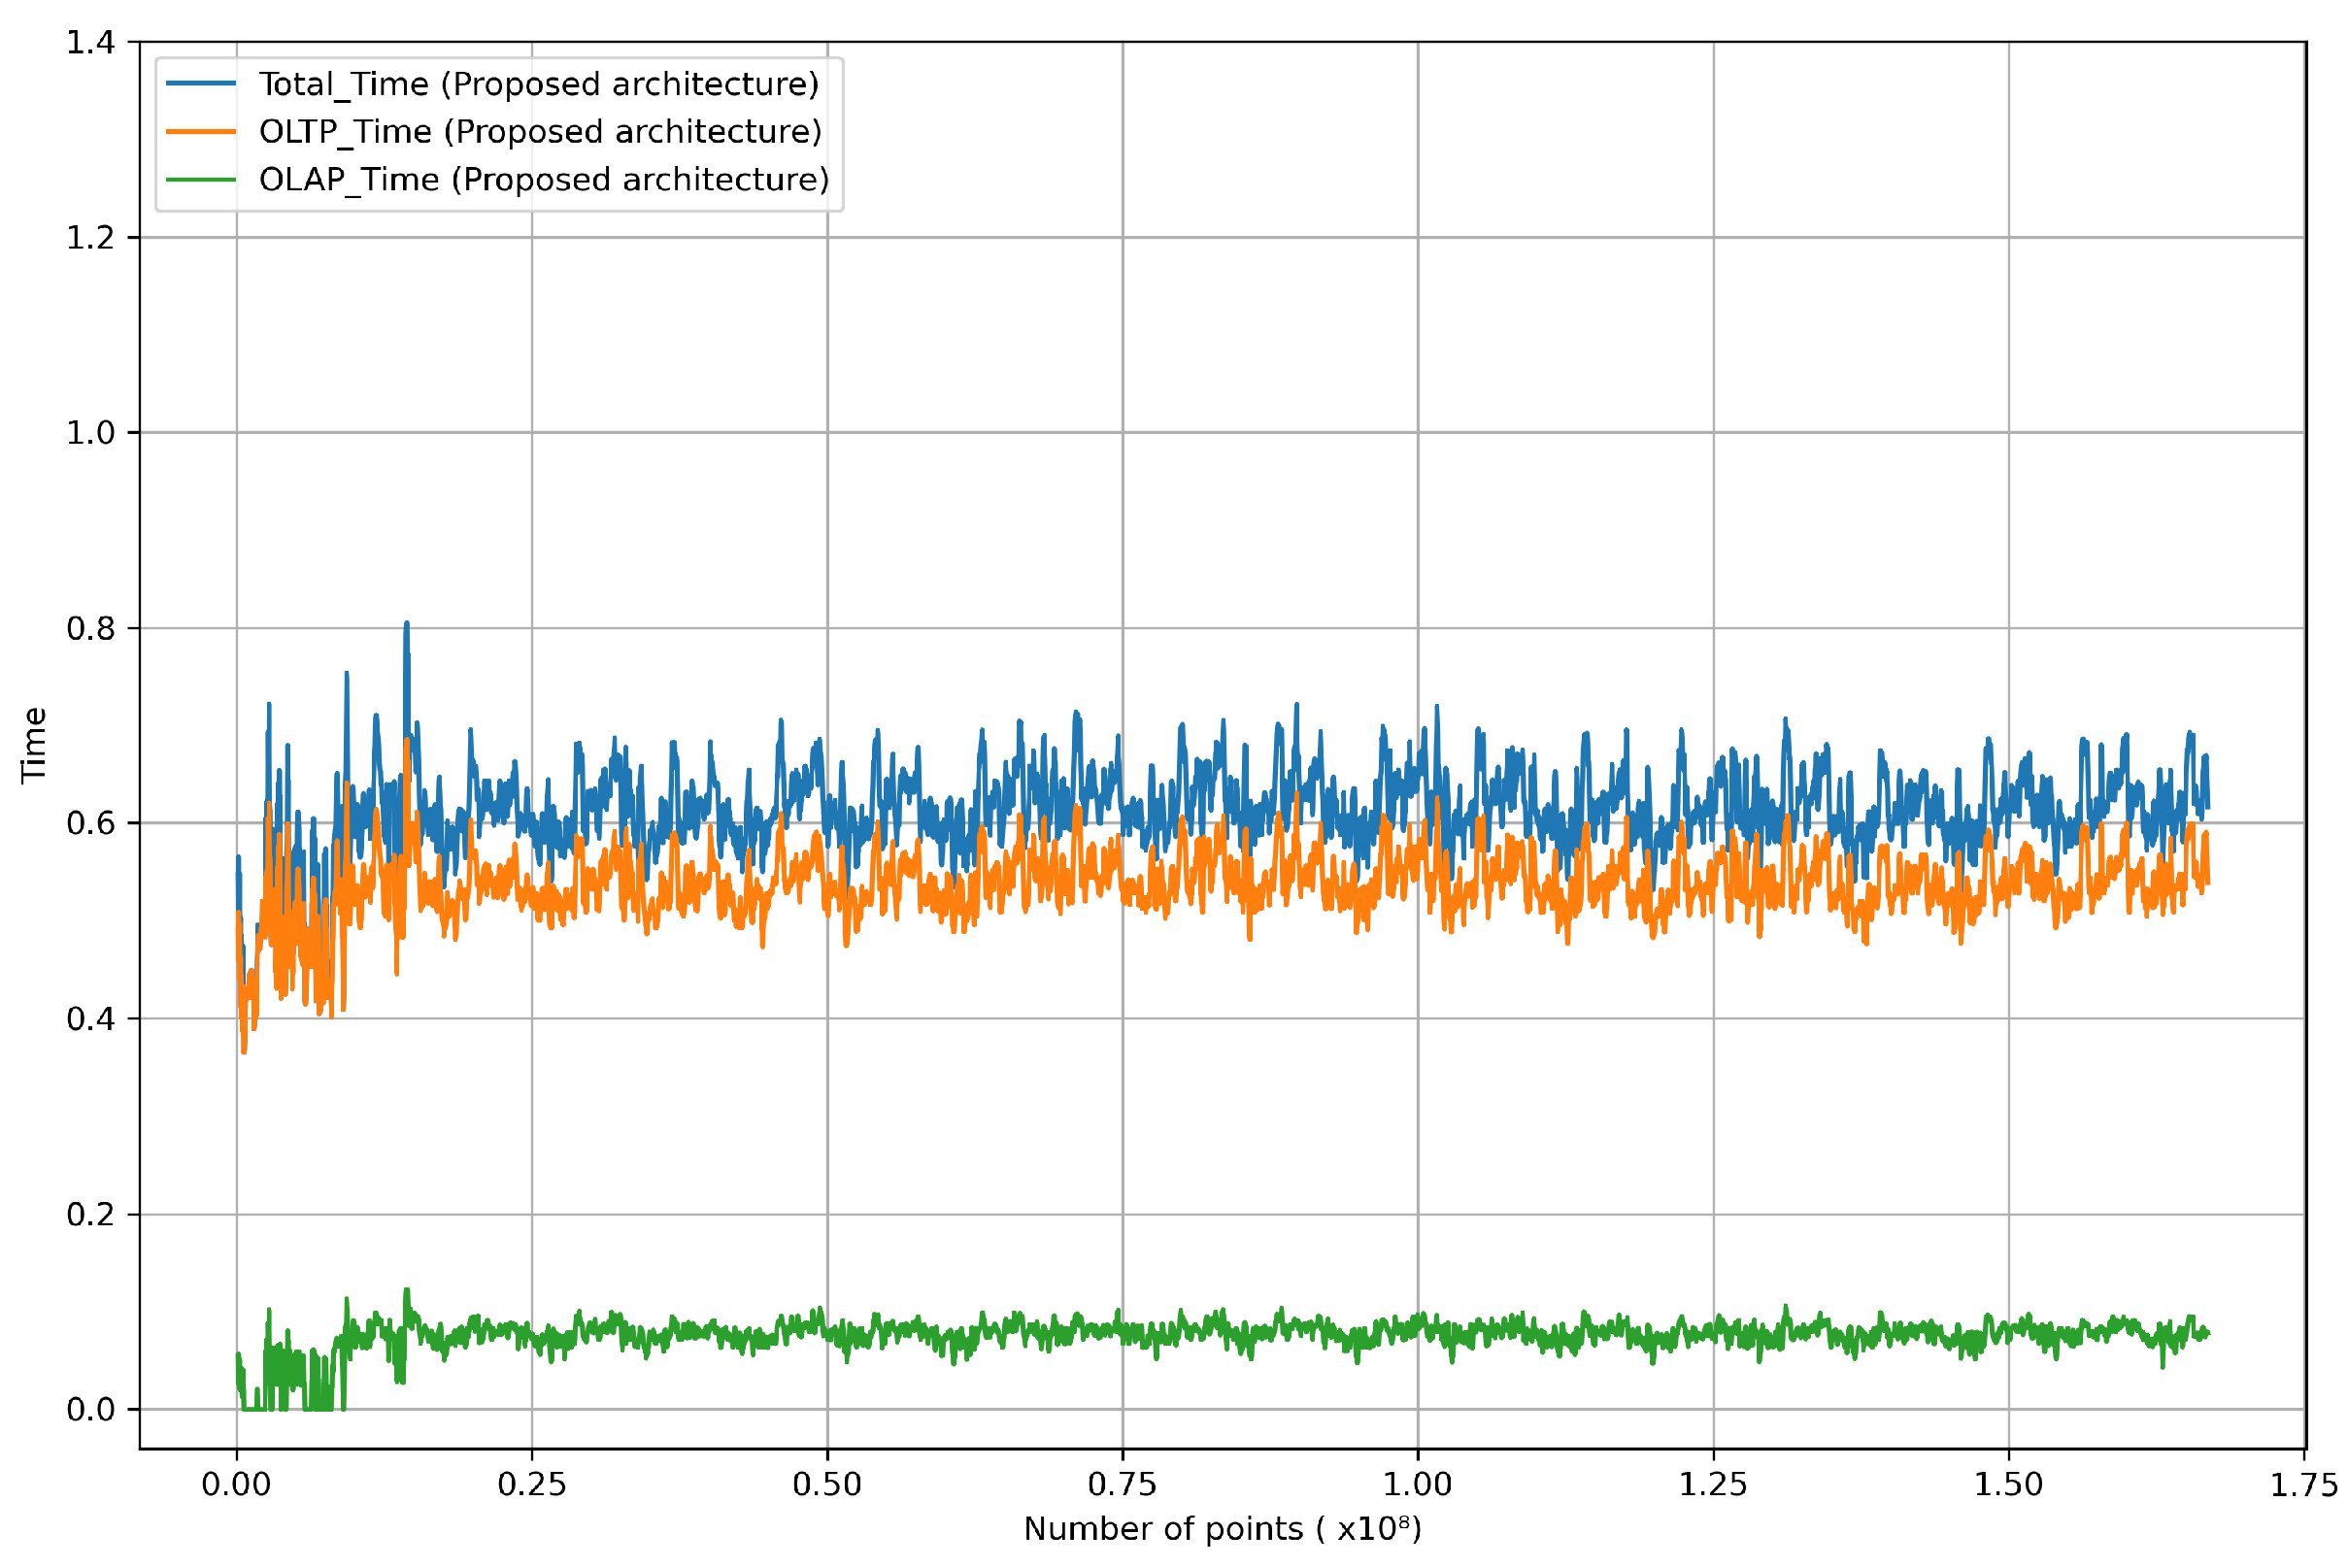
Figure 13 depicts response times for OLTP and OLAP queries and the total processing time from the moment data was collected until it was finally updated or dismissed in the proposed architecture. The proposed system demonstrates consistently stable performance metrics during repeated drives. The OLAP query response time averaged 0.07439 s, while the OLTP query response time was 0.52409 s, resulting in a total response time of 0.59848 s. Furthermore, the total processing time, including the time from data collection in the vehicle to preprocessing and transmission to the architecture, averaged 0.62476 s. Due to the combination of columnar tables and row-based tables in the proposed architecture, the response time for OLAP queries was especially outstanding, with less than 0.1 s. As we receive data from the vehicle at a 1-s interval, we consider a real-time criterion to be within 1 s. Accordingly, the proposed architecture can update point cloud data within an average of 0.6476 s, thereby confirming its real-time capability.
We selected a distributed RDB cluster as the comparative group for the proposed architecture. The distributed RDB cluster was built using PostgreSQL, and all configurations were similar except that they were constructed using row-based storage only, without columnar storage.
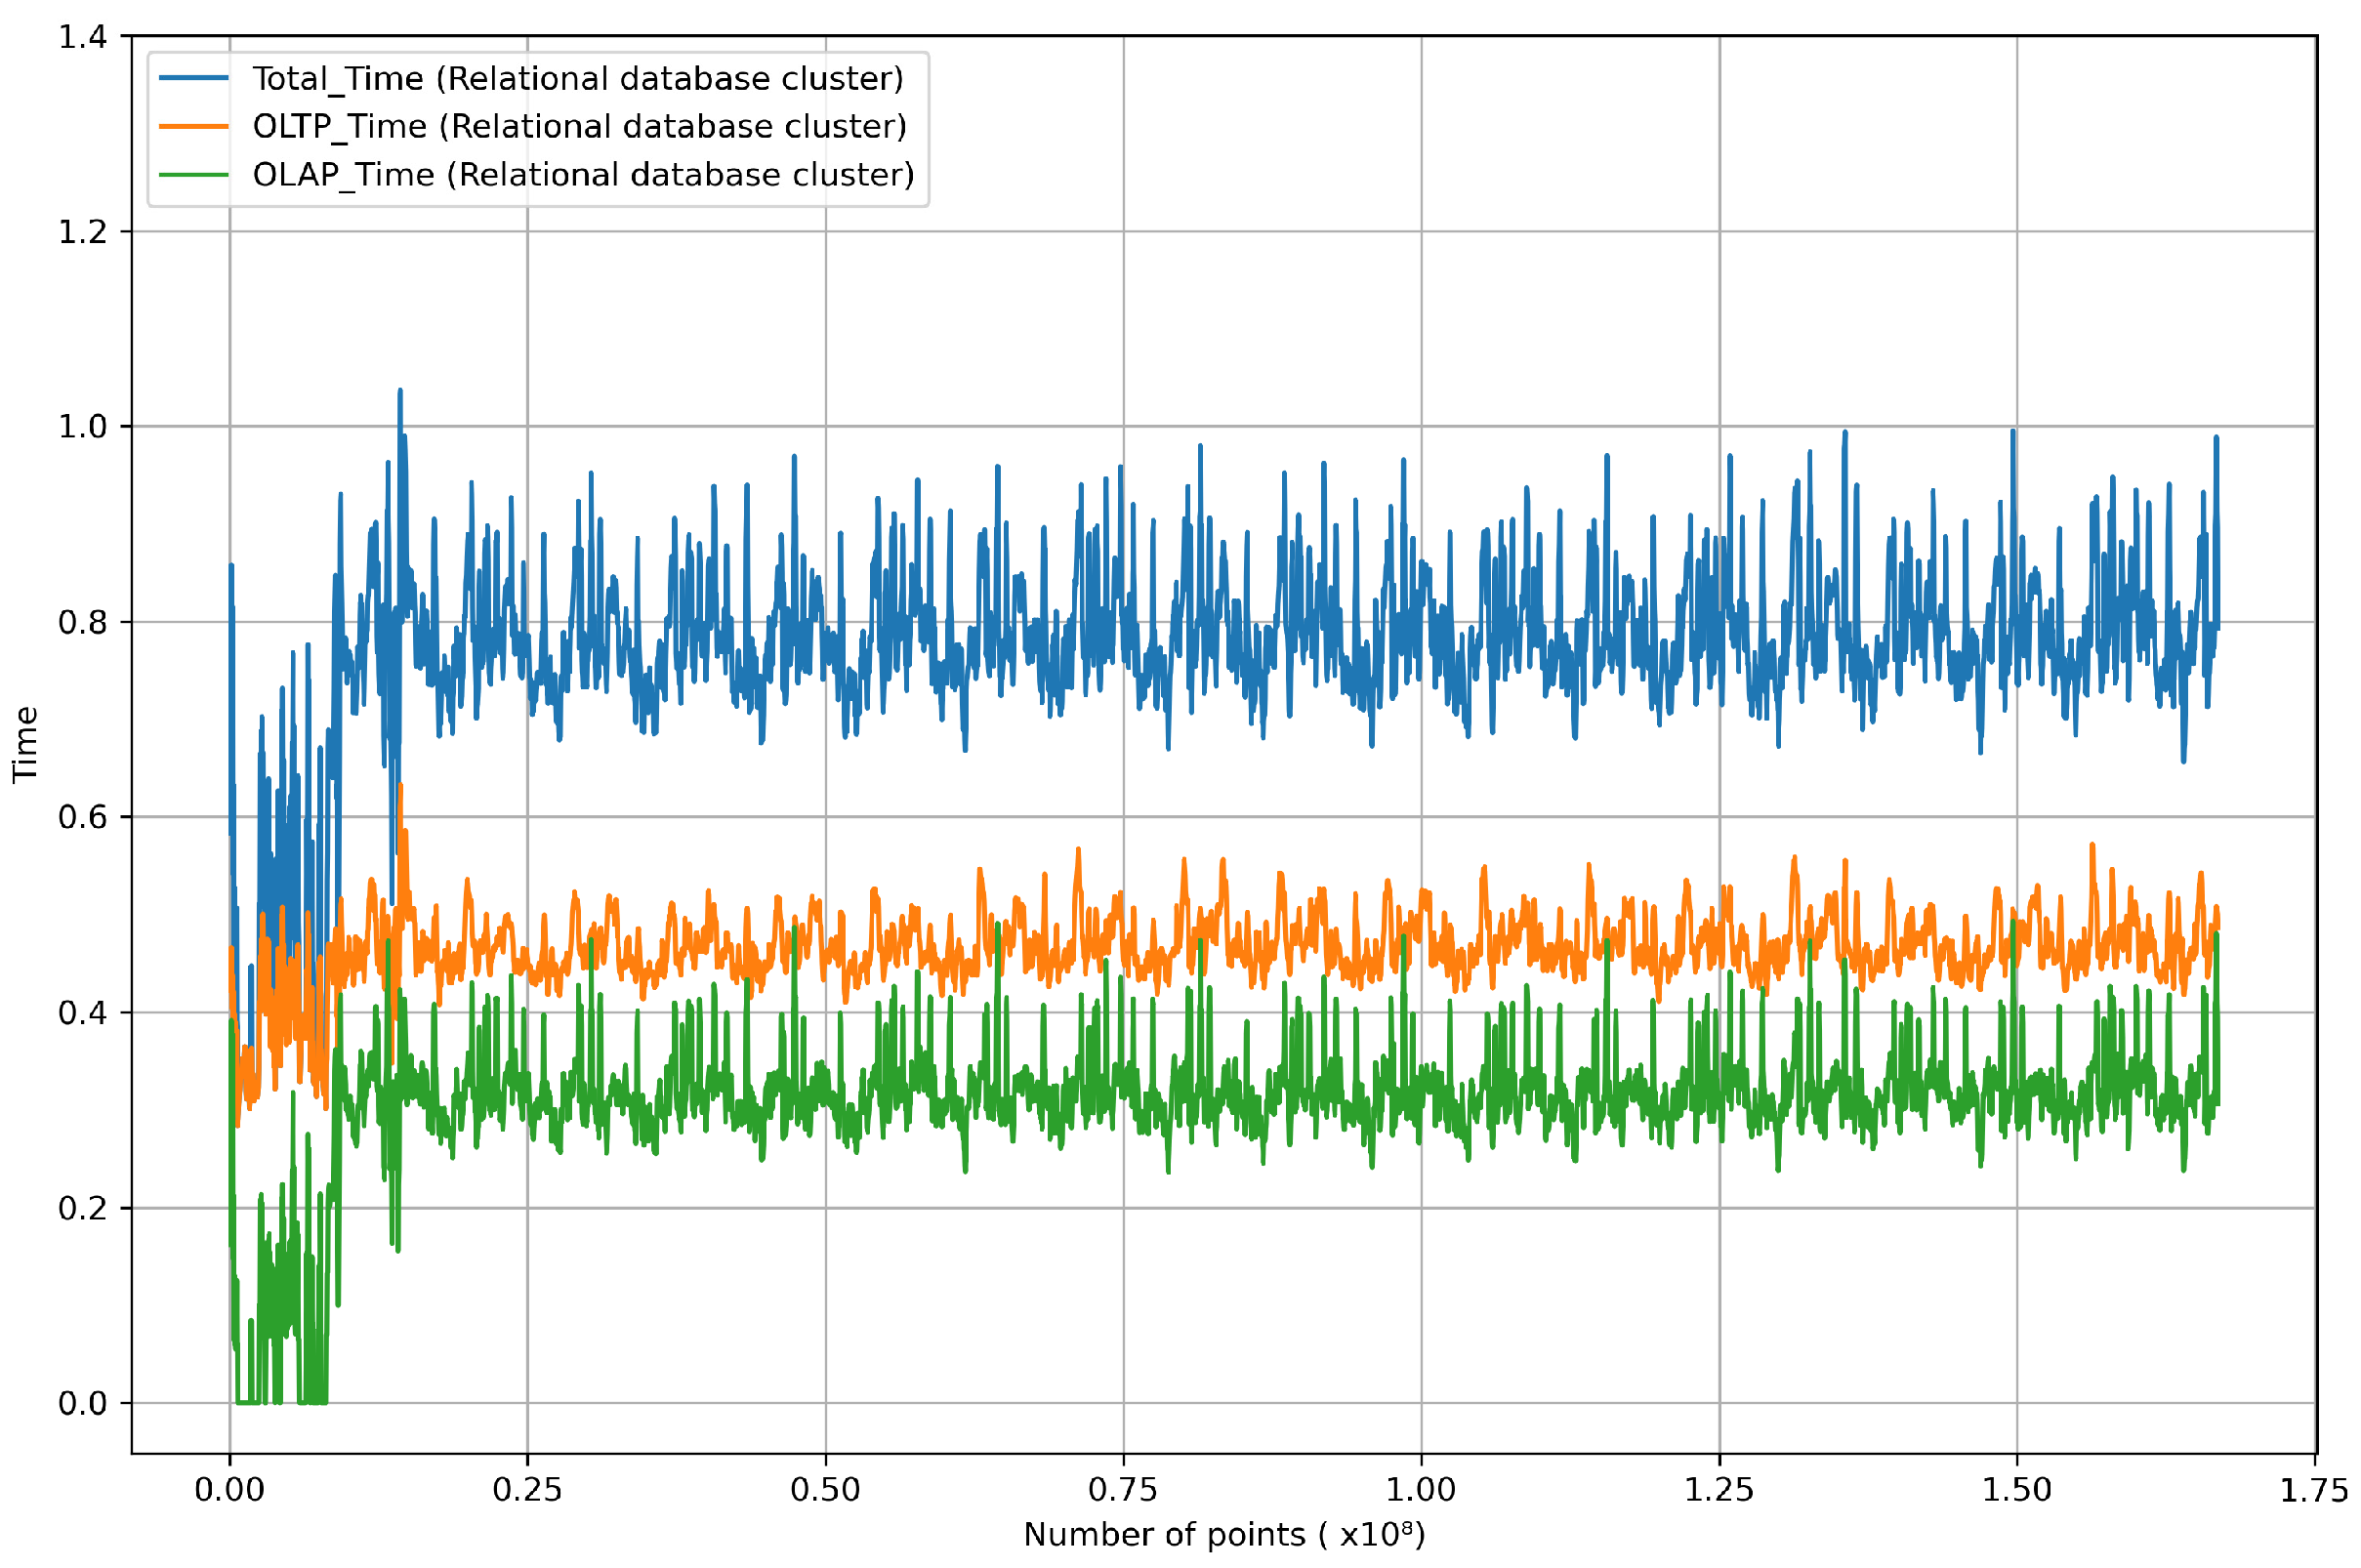
Figure 14 presents the results of the same evaluation conducted on the distributed RDB cluster, which exhibited overall unstable performance metrics. The average response time for OLTP queries was 0.46209 s, and for OLAP queries, it was 0.30399 s, resulting in an average total response time of 0.76608 s. Since it was constructed using row-based tables only, it performed OLTP query response times about 0.062 s faster than the proposed architecture. However, the OLAP query response time was approximately 0.22960 s higher than that of the proposed system, resulting in nearly a threefold difference. The average total processing time was 0.795412 s, which was approximately 27% higher than that of the proposed architecture. While it was measured within our real-time criteria of less than 1 s, there were numerous instances where it slightly exceeded or approached 1 s. This divergence was attributed to the OLAP query response time, indicating an unsuitable pattern for aggregation and analysis queries.
5. Conclusions
In this study, we constructed and evaluated a HTAP (hybrid transactional/analytical processing) architecture that processes and updates point cloud data in real-time using distributed database technology. Unlike previous studies that managed LiDAR data for point cloud map construction in Hadoop, we built a HTAP architecture using a spatial database. This architecture allows real-time insertion, updating, and analysis of point cloud data. The architecture is divided into an Edge part operating in the ROS environment of the vehicle and a Cloud part operating in the PostgreSQL environment of cloud services. Data transmission between the two parts is facilitated through Kafka, and a data pipeline preprocesses point cloud data via a client on AWS Lambda and inserts it into the architecture.
The architecture developed in this study has a feature that autonomously detects changes over time by determining the dissimilarity between sequential runs through the environment and maintaining and managing the latest state of point cloud data. By offering this feature, the proposed system helps enable autonomous vehicles to generate safe, optimized routes. Through a qualitative evaluation of this feature, we confirmed that this feature operates correctly, updating the point cloud map as intended. In the quantitative evaluation, we demonstrated the real-time capability of our architecture with an average total processing time of 0.6476 s, which meets our real-time criterion of a 1-s interval for data generation when continuous table management is performed. We compared the total processing time and processing stability between our proposed architecture and the distributed RDB cluster, confirming approximately 27% faster processing speed and a stable analysis pattern in favor of our architecture. Moreover, by observing faster processing times as the number of distributed nodes increased, we validated the parallel distributed processing capability for queries. While we identified a potential performance degradation with an absolute increase in data volume, we showed that real-time performance can be maintained by adding and redistributing nodes thanks to the parallel distributed processing capability.
However, the limitations of our study to be advanced in the future can be summarized as follows:
The architecture was designed to handle point cloud data processing and updates for a single vehicle. Its performance under simultaneous analysis and updates from multiple vehicles is yet to be fully investigated.
The proposed HTAP architecture demonstrates potential for consistent real-time performance. However, ensuring seamless scalability and robustness of the architecture for uninterrupted operation and expansion during runtime remains an area that requires further development.
We are currently investigating potential performance degradation when multiple vehicles simultaneously access the system for analysis and updates. Through this ongoing research, we anticipate constructing a more robust HTAP architecture.


