1. Introduction
In the realm of autonomous driving, achieving precise 3D object detection is pivotal for vehicles to adeptly navigate obstacles. Presently, prevalent 3D object detection algorithms predominantly rely on costly high-end lidar sensors, which constrains their applicability for widespread usage. An alternative solution that has garnered attention involves employing stereo depth cameras for 3D object detection, although it still faces certain limitations. To further refine target detection accuracy, we introduce a methodology centered around Real Pseudo-Lidar point cloud for object detection. This approach entails generating Pseudo-Lidar point cloud data from images and amalgamating them with authentic, cost-effective, low-line lidar data. This technique not only ensures heightened detection precision but also achieves cost-effectiveness.
Pseudo-Lidar point clouds [
1] is a concept of data similar to lidar point clouds generated through image processing techniques. It utilizes depth information extracted from images and converts it into pseudo-point cloud data. Despite the efforts made by PSEUDO-LIDAR++ to improve depth estimation accuracy, the conversion process from images to pseudo-point cloud data remains relatively straightforward, resulting in challenges in accurately portraying the shape and position of objects. As a consequence, this can result in lower detection accuracy. PSEUDO-LIDAR++ [
2] improves the accuracy of estimating depths for objects at a distance by refining the structure of stereo vision networks and optimizing loss functions. It also utilizes 4-Line lidar point clouds to calibrate the Pseudo-Lidar point cloud data. This approach eliminates depth estimation bias and improves the accuracy of Pseudo-Lidar point cloud data. On the other hand, End-to-End Pseudo-Lidar [
3] takes a different approach by achieving end-to-end detection directly from Pseudo-Lidar point cloud data. It utilizes backpropagation-based end-to-end training to refine the final loss, thus elevating the quality of depth map generation. Consequently, this enhancement augments the quality of the resultant Pseudo-Lidar point cloud, leading to an overall improvement in detection precision. Additionally, SFD [
4] transforms lidar-obtained point cloud information into depth maps and integrates RGB features from 2D images with the lidar point cloud data, resulting in the creation of synthetic pseudo-point cloud data.
The current methods for generating Pseudo-Lidar point cloud data rely on stereo depth estimation, and existing methods such as Pseudo-Lidar [
1,
2] primarily utilize the PSMNet [
4] network for stereo depth estimation from images. Although PSMNet performs well in stereo-matching tasks, it requires high-quality images, and its performance degrades in the presence of noise or distortion in the images. Additionally, PSMNet requires significant computational resources for training and inference, limiting its application on low-cost devices. To address these issues, we adopt Iterative Geometry Encoding Volume for Stereo Matching [
5]. Compared to PSMNet, this approach exhibits better robustness and greatly improves the issue of local blurriness in ill-posed regions, which significantly contributes to the subpar quality of Pseudo-Lidar point cloud data.
Although the technique of Iterative Geometry Encoding Volume for Stereo Matching enhances stereo-matching precision, there remains a discernible disparity between the Pseudo-Lidar point cloud data produced from the disparity map and the high-resolution real point cloud information. Real lidar point cloud data are characterized by exceptional accuracy and the ability to effectively capture spatial positioning details of objects within a 3D space. Moreover, the acquisition process of lidar point cloud data is not affected by lighting conditions or occlusion, resulting in high accuracy. On the other hand, Pseudo-Lidar data, although providing convenient access to the 3D information of objects, fall short of achieving the same level of accuracy in estimating the precise 3D positions of objects as lidar point cloud data. In order to enhance the reliability of Pseudo-Lidar point cloud data, we have opted to employ the ICP algorithm for registration between the Pseudo-Lidar point cloud data and the 16-Line real Lidar point cloud data, using the latter as a reference. This registration process aims to enhance the accuracy of the Pseudo-Lidar point cloud data. Finally, the registered Pseudo-Lidar point cloud data and the 16-Line real lidar point cloud data are fused. The fusion process primarily depends on the 16-Line real lidar point cloud as the primary data, implementing radius-based filtering to preserve the synthetic Pseudo-Lidar point cloud data in proximity to the real point cloud information. This results in fusion point cloud data that contains the 16-Line real lidar point cloud and the Pseudo-Lidar point cloud. Finally, the Real Pseudo point cloud information is input into the pre-existing object detection network that relies on lidar-based point cloud data.
2. Related Work
2.1. 3D Object Detection
Presently, the majority of approaches heavily depend on 64-Line lidar point cloud data [
6,
7,
8,
9,
10,
11]. The methods for target detection using lidar can be broadly categorized into two main types: voxel-based methods [
11] and point-based methods [
12]. In voxel-based methods, the data from the point cloud are converted into a compact voxel grid representation. Subsequently, feature learning and object detection are performed on the voxel grid data. Point-based methods process the lidar point cloud data through hierarchical aggregation, sampling, and interaction to achieve feature learning and object detection. To enhance the precision of object detection through lidar sensors, scholars have investigated integrating RGB details from cameras and depth data from lidar sensor [
13,
14,
15] to create end-to-end solutions applicable in autonomous driving scenarios. Integrating camera and lidar sensor data can bolster the resilience of 3D object detection, particularly in complex situations encompassing occlusions and extended distances. However, there is also a subset of methods that solely utilize image-based detection models. These models primarily perform detection on the frontal views of 2D images [
16,
17,
18]. However, most of these methods significantly lag behind lidar-based detection approaches in terms of accurately locating the positions of 3D objects.
2.2. Pseudo-Lidar
The Pseudo-Lidar method [
1,
2,
3] fundamentally differs from conventional image-based approaches. It employs a model for estimating stereo depth to acquire depth information, represented as
, for every pixel
within the 2D image. Afterward, these depth data are mapped onto the 3D point cloud domain, transforming the image pixels
into their respective
coordinates within the 3D point cloud. This strategy allows for the utilization of well-established object detection techniques on the modified point cloud data, thereby mitigating the disparity in 3D object detection performance.
In this context, denotes the camera center, whereas and stand for the horizontal and vertical focal lengths. Subsequently, the resulting Pseudo-Lidar point cloud data are regarded as authentic lidar point cloud signals, making them applicable to any model based on lidar point clouds. By applying this Pseudo-Lidar framework to the KITTI dataset, we achieved significantly higher detection performance compared to using images alone. Our work is built upon this framework.
2.3. Stereo Disparity Estimation
The precision of depth estimation stands out as a pivotal element affecting the caliber of Pseudo-Lidar point cloud information. Upon aligning the estimated pixel depths from depth estimation with the 16-Line real lidar point cloud data, the Real Pseudo-Lidar point cloud becomes suitable for integration into any model grounded in lidar point cloud data. This integration can result in performance on par with existing models. Depth estimation methods based on disparity mainly include monocular disparity estimation [
19,
20,
21,
22] and stereo depth estimation based on binocular vision [
23,
24,
25,
26,
27]. Through comparison, we found that stereo depth estimation obtained from binocular vision is more accurate than monocular depth estimation. Therefore, our main research focus is on depth estimation algorithms based on binocular vision.
The fundamental concept of the disparity estimation algorithm relies on utilizing a camera pair featuring horizontal displacement and their corresponding left and right images, denoted as
and
, as input data. Initially, the reference image is the left view (
), and this serves as the basis for generating a disparity map (
D). This disparity map reflects the horizontal disparity information between each pixel
p and the corresponding pixel in the
image. Ideally, the pixel
p in the
image and its corresponding displaced pixel
accurately describe the same 3D position.
There are common methods for estimating disparities. An alternative method known as the end-to-end method has been proposed, involving the use of CNNs for feature extraction from images [
28,
29]. These features are then passed through fully connected layers to perform disparity regression, enabling the estimation of depth from disparities. Another approach is a hybrid method that combines traditional disparity estimation algorithms with deep learning [
30,
31,
32]. By leveraging features extracted by deep learning, these methods replace manually designed features in traditional algorithms. This alternative approach enhances the precision and resilience of the estimation procedure, resulting in more dependable outcomes.
3. Approach
Although approaches for 3D object detection using images offer various benefits, there still exists a discrepancy in comparison to algorithms rooted in lidar-based 3D object detection. This gap primarily arises from the limitations of perceiving the 3D space itself using 2D image data. In particular, in stereo depth-based 3D object detection, the depth estimation error increases quadratically with the distance of objects, whereas when using lidar point clouds for depth estimation, this relationship is approximately linear. Therefore, we introduce a technique that transforms image information into lidar point cloud information and integrates 16-Line real lidar point clouds with Pseudo-Lidar point cloud information to improve detection accuracy.
In existing algorithms based on Pseudo-Lidar point clouds, the quality of depth estimation varies, resulting in certain errors in depth reconstruction, which in turn affects the accurate description of objects in 3D Pseudo-Lidar point cloud data. For the purpose of generating refined Pseudo-Lidar point cloud data and enhancing both point cloud quality and computational efficiency, we employ the IGEV [
5]. This model utilizes volume encoding of geometry and contextual information, along with local matching details, and iteratively indexes them to update the disparity map. This approach greatly addresses challenging regions that are difficult to handle, such as occlusions, repetitive textures, low-texture areas, high reflectance areas, and overcomes local ambiguity issues. To boost the precision of the Pseudo-Lidar point cloud information, we employ filtering techniques to eliminate erroneous point clouds and consequently decrease the overall quantity of points. Subsequently, we fuse the processed Pseudo-Lidar point cloud data with 16-Line real lidar point cloud data, resulting in high-quality fused Real Pseudo-point cloud data.
Figure 1 depicts the holistic structure of the algorithm, which relies on the amalgamation of image and 16-Line real lidar point clouds. The blue section illustrates the functionality of the stereo disparity estimation network, which employs a depth estimation network [
5] to analyze stereo images and predict a depth map, thereby generating a stereo disparity map. The green section depicts the fusion process of Real Pseudo-Lidar point clouds. This process utilizes the principles of coordinate transformation to convert the disparity map into the three-dimensional space representation of lidar point clouds. Subsequently, point cloud filtering techniques are applied to eliminate noise and reduce the density of Pseudo-Lidar point clouds. Ultimately, the fused Real Pseudo-Lidar point clouds are input into an object detection network for prediction. The gray section is our detection results presentation, showcasing visual results both on the images and the laser point cloud.
3.1. Stereo Disparity Network
Stereo depth reconstruction aims to obtain depth information of objects in space by analyzing the relationship between corresponding pixels in two images. Nevertheless, elements such as lighting, shadows, and occlusion can induce swift alterations in the depth information present in images, rendering it intricate to precisely characterize the objects’ depth. Contemporary methods for producing Pseudo-Lidar point clouds predominantly hinge on stereo-matching networks rooted in deep learning. For example, PSMNet [
4] utilizes spatial pyramid pooling, and cost volume convolution to analyze feature maps across varying levels and calculate depth values for individual pixels through a cost convolution network. However, depth inconsistencies can arise when object edges do not align in the two images, resulting in depth discontinuities and the generation of scattered and irrelevant point cloud data. Additionally, in low-texture or repetitive texture regions, stereo-matching algorithms may incorrectly match unrelated pixel points together due to the lack of distinct textures or the presence of similar textures, leading to distorted depth estimation and inaccurate representation of the 3D spatial information of objects. To address these issues, we employ IGEV to estimate depth information in complex scenes.
Derive the left feature denoted as
and the corresponding right feature
from the provided left view and right view. Subsequently, segment the feature maps into eight groups based on the feature dimension to create group-specific cost volumes. Utilize a lightweight 3D regularization network
R, modeled after 3D-Unet [
33], to process the correlation volumes specific to each group and generate the geometric encoding volume
:
where
represents the inner product,
d represents the disparity index, and
represents the quantity of feature channels. We utilize the soft argmin function to estimate the initial starting disparity
using the geometry-encoding volume
.
where
is
of the original image size and functions as the initial disparity map. Multiple scales of context features are employed to initialize the hidden layers of a 3-level GRU. Subsequently, the ConvGRUs module is used to iteratively optimize the disparity map.
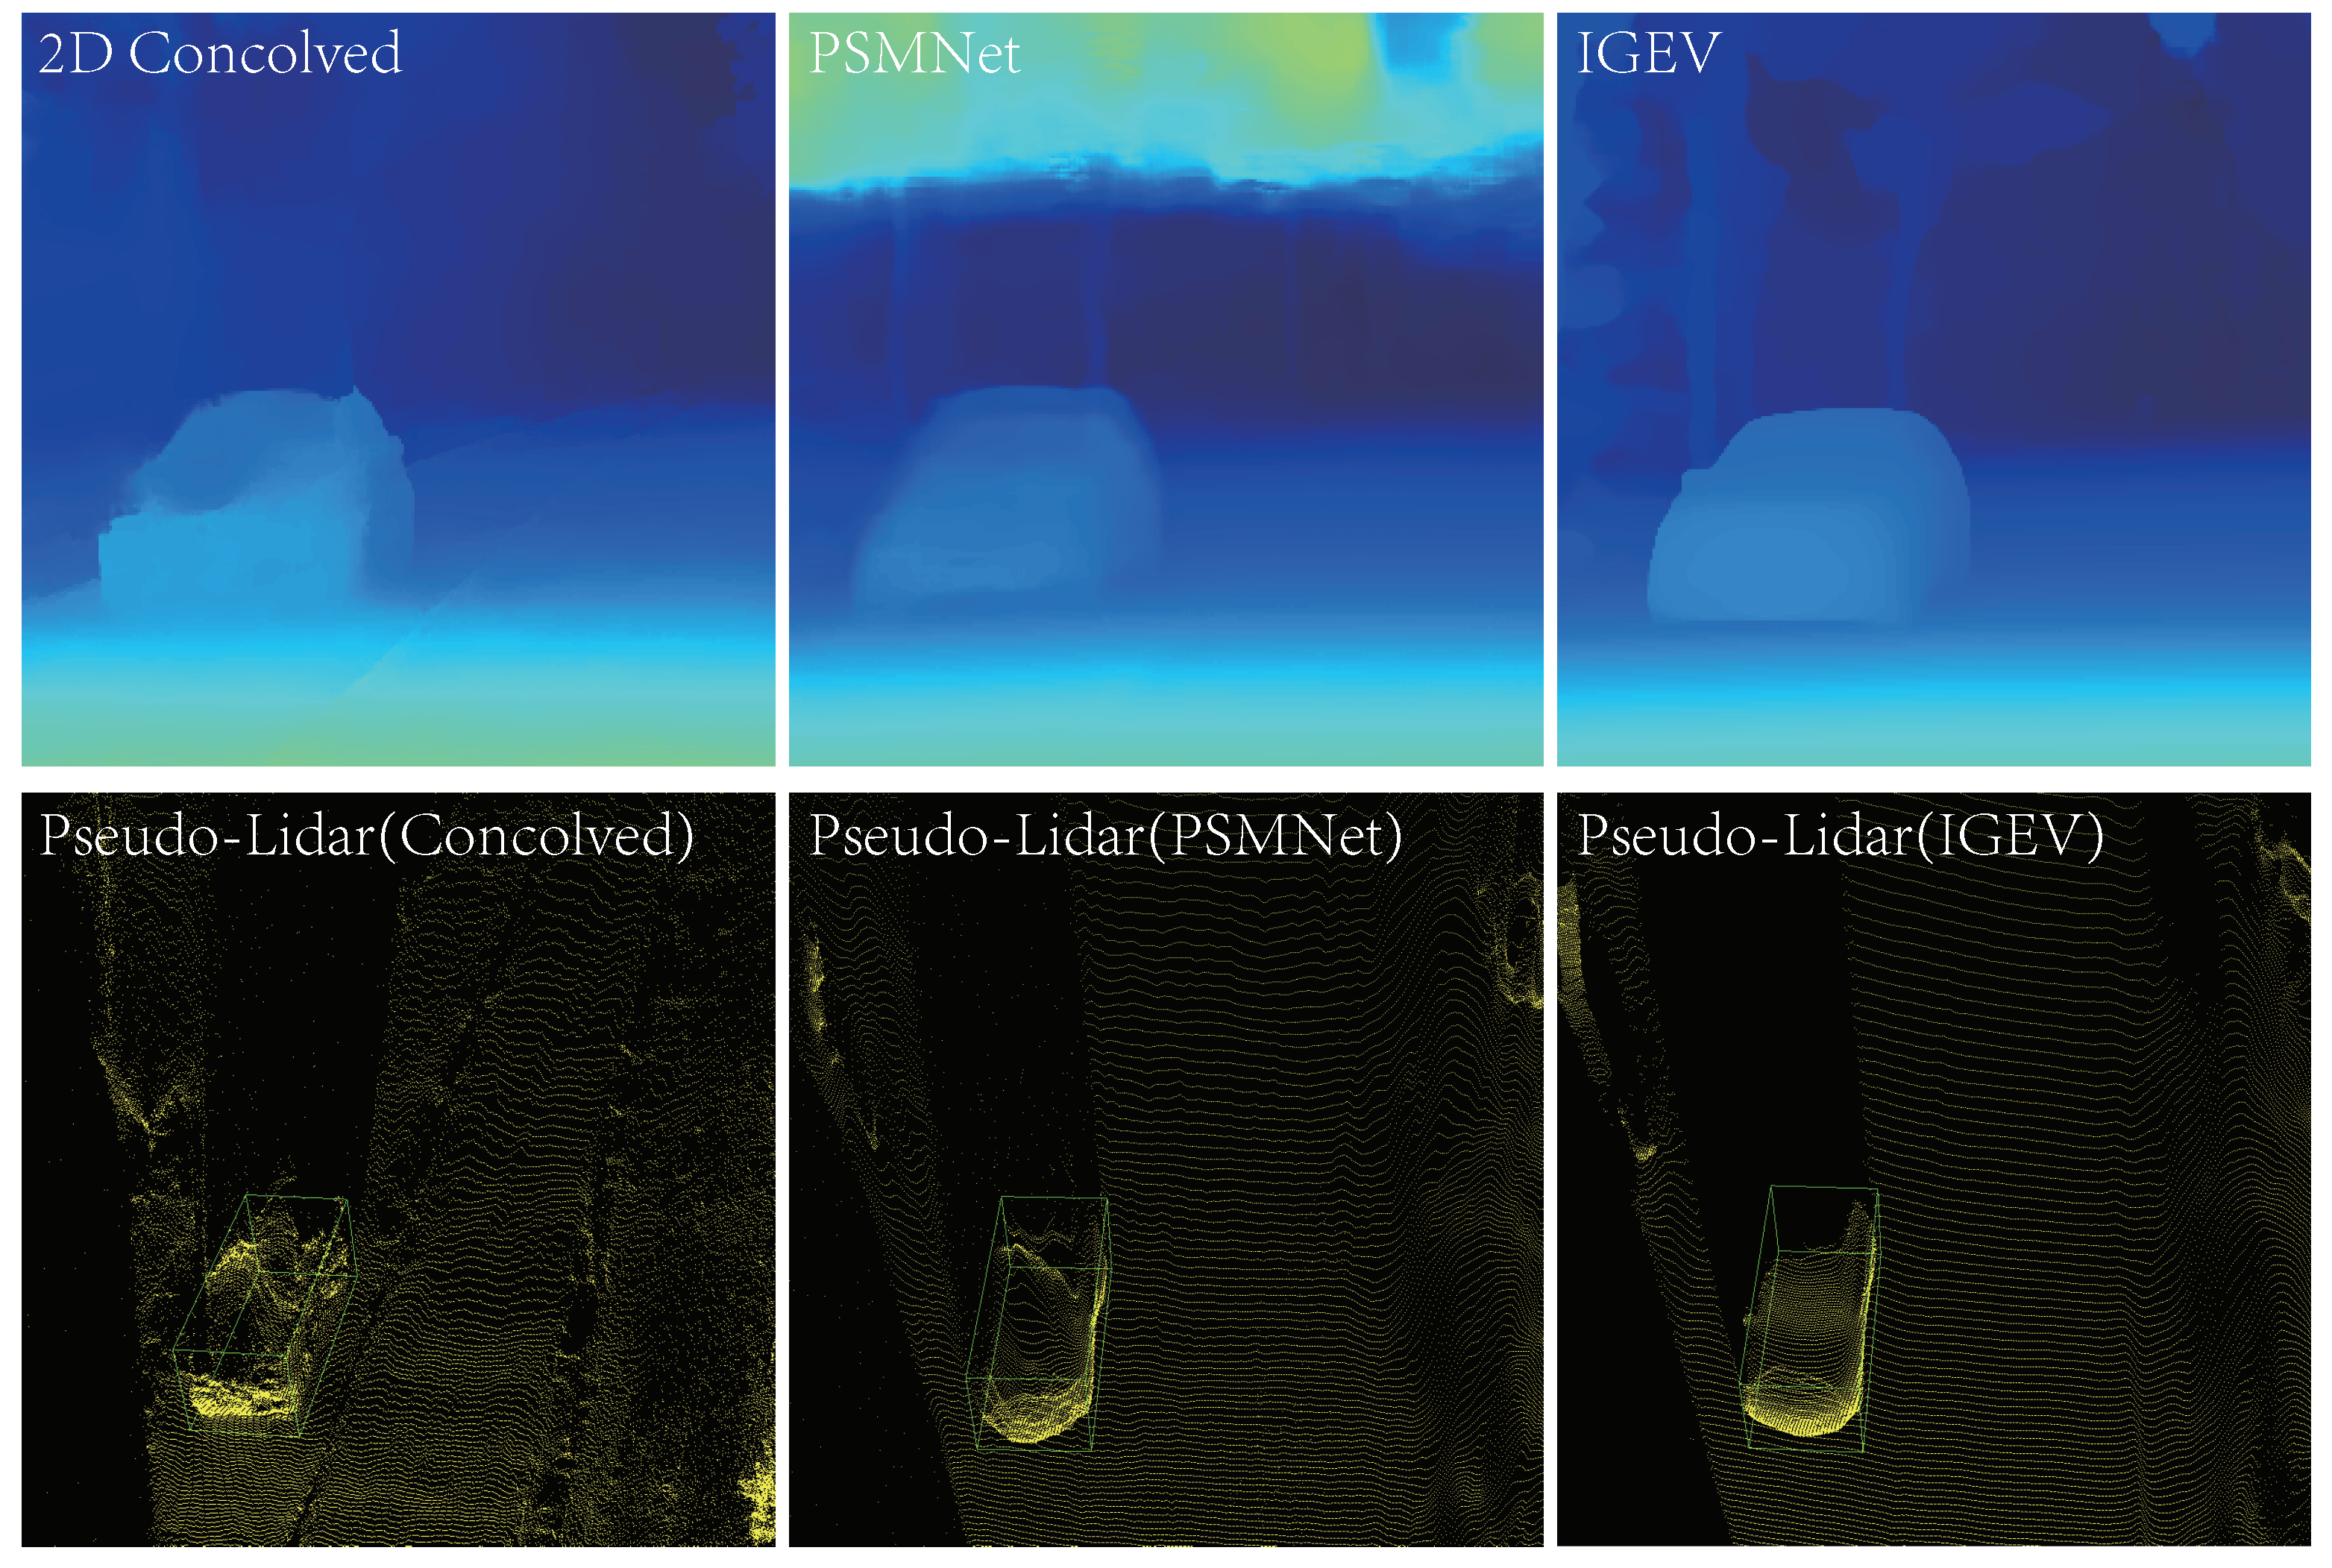
In order to provide further clarification, we conducted a simple experiment in
Figure 2. The first approach involved constructing a 5-layer 3 × 3 convolutional kernel, where each layer’s elements were set to 1. We performed a 7 × 7 convolution operation using the 2D convolution function on the predicted depth map. The input comprised the forecasted depth map alongside the 7 × 7 convolutional kernel, yielding the convolved depth map as output. we projected this map onto the Pseudo-Lidar point cloud and visualized it from a bird’s-eye perspective. We observed that the shape of the car was significantly distorted, as it was stretched vertically, failing to accurately represent the car’s true physical proportions. In the second approach, We utilized a shared encoder network to extract characteristics from both the left and right images, thereby acquiring high-level feature representations for each image. The encoder utilized a stacked hourglass 3D CNN structure, incorporating multi-scale context information. This approach, by filtering the feature maps using 3D CNN, helps mitigate uncertainties caused by repetitive structures and missing correspondences, leading to a clearer cost volume. This reduction in artifacts and distortions contributes to improved quality of the Pseudo-Lidar data. The third approach involved combining the geometry-encoding volume (GEV) and the full correlation volume to create a combined geometry-encoding volume (CGEV). The CGEV was then fed into the ConvGRU update operator for iterative refinement of the depth map, effectively reducing artifacts and depth distortions. This resulted in a significantly higher-quality depth map, and when projected onto the Pseudo-Lidar point cloud, the transformed Pseudo-Lidar data closely aligned with the depth map obtained from the original transformation, demonstrating a more accurate representation.
3.2. Pseudo-Lidar Point Cloud Calibration
During the depth estimation process of the Pseudo-Lidar, factors such as lighting variations, differences in surface reflectivity, and occlusions can result in small disparities in depth estimation. Consequently, the generated Pseudo-Lidar point cloud might demonstrate disparities compared to the actual positions of objects in 3D space. To tackle this challenge, we utilize a point-to-plane ICP algorithm to align the Pseudo-Lidar point cloud with the spatial position of the 16-Line real lidar point cloud.
In
Figure 3, To more accurately represent the real positions of objects, we utilize the ICP algorithm based on the point-to-plane distance for the Pseudo-Lidar point cloud. The point-to-plane error metric serves as the optimization objective, striving to minimize the collective discrepancy between the synthetic Pseudo-Lidar point cloud and the 16-Line real lidar point cloud by identifying the optimal transformation matrix
M. Through an iterative process, every point within the Pseudo-Lidar point cloud is aligned with the planes present in the 16-Line real lidar point cloud, enabling the calculation of the point-to-plane distance error. Then, by minimizing these distance errors, the ICP algorithm adjusts the parameters of the transformation matrix
M to gradually optimize the position and orientation of the Pseudo-Lidar point cloud, making it better align with the 16-Line real lidar point cloud.
where
M is a
rigid-body transformation matrix,
represents the Pseudo-Lidar point cloud,
represents the 16-Line real lidar point cloud, and
is the unit normal vector at
.
3.3. Real Pseudo-Lidar Point Clouds
The Pseudo-Lidar point clouds consist of 1.3 million points, which is significantly higher than the 490,000 points in the real 64-Line lidar point clouds. Directly feeding such a large amount of Pseudo-Lidar point clouds into the object detection network would significantly increase the computational load and potentially reduce the network’s inference speed, especially for real-time applications. To tackle this concern, we employ a radius-filtering approach to diminish the point cloud density and filter out irrelevant points, thereby reducing the quantity of input data.
We use the real 16-Line lidar point clouds as the reference and then calculate the Euclidean distance between each point in the Pseudo-Lidar point clouds and the corresponding point in the real 16-Line lidar point clouds.
Here,
D denotes the Euclidean distance between the 16-Line real lidar point clouds and the Pseudo-Lidar point clouds,
signifies the 3D spatial coordinates of a point within the 16-Line real lidar point clouds, and
indicates the 3D spatial coordinates of the corresponding point in the Pseudo-Lidar point clouds. Then, we establish a radius threshold
r.
By using the radius threshold r, we can determine the Euclidean distance between points. If a point’s distance from the center point is less than or equal to the threshold, the point is retained or considered to be within the acceptable range. This approach allows us to preserve both the 16-Line real lidar point clouds and the neighboring Pseudo-Lidar point clouds, providing more comprehensive and accurate point cloud information.
4. Experiments
We carried out a sequence of experiments juxtaposing our proposed algorithm against alternative object detection methods. In these experiments, we focused on two main approaches: one based solely on Pseudo-Lidar point clouds and the other using the Real Pseudo-Lidar point clouds. In the experiments, the results of our algorithm based on the fusion of pure Pseudo-Lidar point clouds are shown in green, whereas the results of the algorithm based on the fusion of Real Pseudo-Lidar point clouds are presented in blue. Methods utilizing 64-Line LiDAR are depicted in gray.
4.1. Dataset and Metric
The dataset employed in our experiments originates from the KITTI dataset [
34,
35]. It offers not just the left images, but also the corresponding right images, accompanied by the corresponding lidar point cloud data and camera calibration matrices for each image. The KITTI dataset comprises a grand total of 14,999 images, split into 7481 images for training and 7518 images designated for testing. For our experiments, we additionally partitioned the training data, allocating 3712 images for training purposes and 3769 images for validation.
For the car category, we followed the benchmark testing and previous works and reported the Average Precision (AP) at IOU thresholds of 0.5 and 0.7. We used and to represent the average precision for the bird’s-eye view and 3D detection tasks, respectively. It is important to highlight that the benchmark evaluation divides each category into three difficulty levels based on bounding box height and occlusion/truncation levels: easy, moderate, and hard. These levels correspond to objects at distances of 0–30 m, 30–50 m, and beyond 50 m from the ego vehicle in the context of autonomous driving.
4.2. Details of Our Approach
4.2.1. Stereo Disparity Estimation
We used the Iterative Geometry Encoding Volume for Stereo Matching to perform dense disparity estimation. Initially, the model was pretrained on the Scene Flows dataset [
36], encompassing a collection of 30,000 pairs of synthetic images along with their corresponding disparity maps. Subsequently, we proceeded to fine-tune the model using the set of 3712 training images drawn from the KITTI dataset. For the essential disparity maps in this endeavor, we generated quasi-realistic disparity maps through the projection of the corresponding lidar point cloud data onto the 2D space.
4.2.2. Generating Real Pseudo-Lidar Point Clouds
We remove Pseudo-Lidar point clouds that are above 1 m in the system. To create the amalgamated Real Pseudo-Lidar point cloud, we proceed through a series of steps. Firstly, we apply voxelization filtering to the Pseudo-Lidar point cloud to remove noise and reduce the point cloud density. Then, we perform ICP point cloud registration [
37] between the Pseudo-Lidar point cloud and the 16-Line real Lidar point cloud, aligning the pseudo data to be closer to the 16-Line real lidar point cloud. Finally, we use radius filtering to keep the Pseudo-Lidar point cloud data that are in proximity to the real 16-Line Lidar point cloud. The output is the fused Real Pseudo-Lidar point cloud.
4.2.3. 3D Object Detection
We primarily used two 3D detection models: Frustum PointNet [
38] and AVOD [
39]. Specifically, we utilized the F-POINTNET-v1 version and AVOD-FPN. To integrate the Pseudo-Lidar point cloud data produced through stereo disparity and the Real Pseudo-Lidar point cloud data into the models, we substituted the 64-Line lidar point cloud data with these novel data sources. We then retrained both models using the hyperparameters provided in their respective code repositories.
4.3. Experiments Results
The outcomes from our experiments are presented in
Table 1 and
Table 2. We primarily present the results of object detection based on pure Pseudo-Lidar point clouds and Real Pseudo-Lidar point clouds to clearly demonstrate our algorithm’s outstanding performance in terms of accuracy. Specifically, under the evaluation metric of IOU = 0.7, our object detection accuracy based on pure Pseudo-Lidar point clouds in F-POINTNET reached 79.3%, and in AVOD, it reached 84.6%. Our object detection accuracy based on Real Pseudo-Lidar point clouds in F-POINTNET reached 79.3%, and in AVOD, it reached 85.5%.
4.3.1. Impact of Lidar Point Cloud Quality
We compared the performance of a pure Pseudo-Lidar point cloud and the fusion of a Pseudo-Lidar point cloud with a 16-Line real lidar point cloud and observed a significant difference between them. Specifically, at IOU = 0.7, the fusion of point clouds showed an 8% improvement in
and a 12% improvement in
compared to the pure Pseudo-Lidar point cloud. We attribute this improvement to the enhanced caliber of the point cloud data. Since the Pseudo-Lidar point cloud data are derived from stereo disparity estimation, it suffers from depth estimation errors, especially for distant objects due to the limitations of stereo disparity estimation itself. This inaccuracy affects the ability of the Pseudo-Lidar point cloud to accurately represent the 3D spatial positions of objects. Nonetheless, through the integration of 16-Line real lidar point cloud data and the implementation of ICP [
37] on the synthetic point cloud, we achieved a closer alignment between the Pseudo-Lidar point cloud and the actual positions. This refinement led to an improved depiction of the 3D spatial characteristics of the objects.
4.3.2. Impact of Stereo Disparity Estimation Accuracy
We compared the performance of PSMNet and IEGV in terms of detection accuracy relying on Pseudo-Lidar point clouds. On the KITTI 2015 Stereo Vision Benchmark, IEGV achieved a stereo disparity estimation error of only 1.38%, which is significantly lower than the 1.86% error obtained by PSMNet.
As shown in
Table 1, there is a certain relationship between the accuracy of stereo disparity estimation and the accuracy of object detection. The detection accuracy achieved using the pure Pseudo-Lidar point cloud obtained with IGEV for F-POINTNET and AVOD is 79.3% and 77.3%, respectively. Compared to using the pure Pseudo-Lidar point cloud obtained with PSMNet, F-POINTNET’s detection accuracy improved by 6.5%, whereas AVOD’s detection accuracy improved by 2.4%. The reason behind this could be that the geometry-encoding volume used by IEGV helps mitigate the issue of local ambiguity in ill-posed regions, resulting in higher-quality generated point clouds that better reflect the 3D spatial positions of objects.
Currently, there have been numerous research studies [
1,
2,
3] on generating Pseudo-Lidar point clouds for object detection based on images. Analyzing the outcomes presented in
Table 1, it is apparent that the precision of 3D object detection founded on single-view images [
40,
41], featuring values of 5.2% and 2.5%, is notably inferior compared to the performance reliant on stereo-view images. This discrepancy can be attributed to the larger depth estimation errors in single-view images compared to stereo-view images, leading to inaccurate Pseudo-Lidar point cloud data that fail to accurately represent the object’s position. The stereo-view-based Pseudo-Lidar object detection methods have achieved notable performance. At IOU = 0.7, our algorithm achieved a detection accuracy of 79.3% using pure Pseudo-Lidar point clouds obtained through IGEV technology, which is a 6.5% improvement compared to the accuracy obtained using PSMNet technology. Using the Real Pseudo-Lidar point clouds, a detection accuracy of 85.5% was achieved. Furthermore, at IOU = 0.5, the detection accuracy reaches 94.9% using pure Pseudo-Lidar point clouds and 95.7% using the fusion of Real Pseudo-Lidar point clouds. The Real Pseudo-Lidar point cloud approaches performance levels that are nearly on par with the 64-Line lidar point cloud.
4.3.3. Pedestrian and Cyclist Detection
We showcase the detection outcomes concerning pedestrians and cyclists in both the 3D setting and bird’s-eye view (BEV) situations, which present heightened difficulty in contrast to the task of detecting cars. This is because even with the availability of Pseudo-Lidar point cloud signals, the objects’ sizes are small, making it difficult for most Pseudo-Lidar point cloud-based object detection methods to achieve good performance. However, our method has achieved outstanding results in this regard.
In
Table 2, we showcase the results using F-POINTNET on the validation set and compare them with Monocular 3D. For pedestrian detection based on pure Pseudo-Lidar, our detection accuracy reaches 55.4% (
), and for cyclist detection based on pure Pseudo-Lidar, our detection accuracy reaches 53.5% (
). By incorporating fused Pseudo-Lidar with 16-Line lidar, our detection accuracy improves to 68.6% for pedestrians and 61.6% for cyclists in terms of
.
In
Figure 4,
Figure 5 and
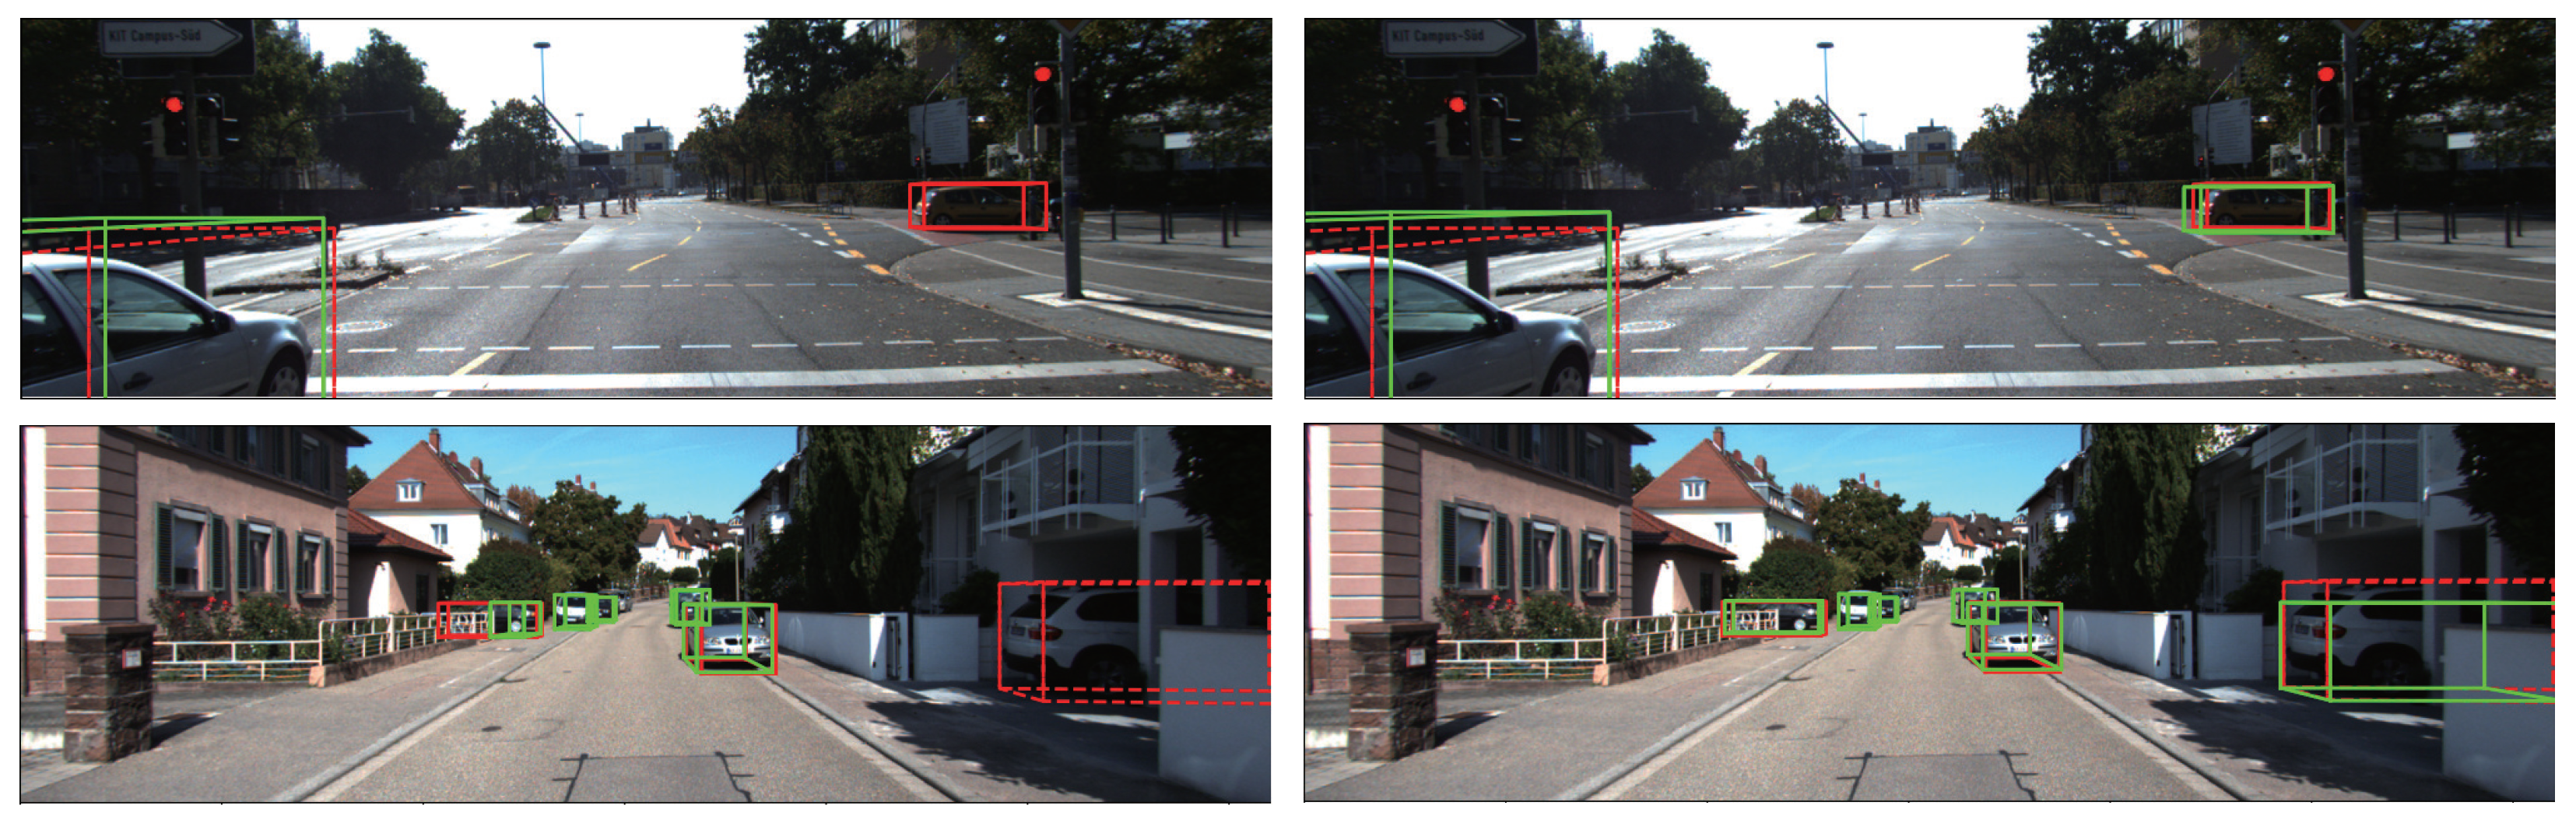
Figure 6, we further visualize our prediction results on the validation set. We compare the detection results based on pure Pseudo-Lidar point clouds with those based on the Real Pseudo-Lidar point clouds. Both approaches achieve high accuracy in predictions, especially for objects in close proximity. However, due to the depth estimation errors in pure Pseudo-Lidar point clouds, the positions of objects in the far distance cannot be accurately reflected. Therefore, when using pure Pseudo-Lidar point clouds for detection in the far distance, there may be cases of missed detections or false positives. Hence, the accuracy of detection based on the fusion of Real Pseudo-Lidar point clouds is significantly higher than that of pure Pseudo-Lidar point clouds, particularly for objects in the far distance.
5. Results
We present two enhancements to the 3D object detection algorithm utilizing Pseudo-Lidar. Firstly, we identified that the main source of error in Pseudo-Lidar point cloud object detection is the inaccurate depth estimation. To tackle this concern, we employed the IGEV technique for depth estimation, which significantly improved the ability to handle ill-posed regions, thus resulting in a more accurate depiction of the object’s contour position in the Pseudo-Lidar point cloud data.
Secondly, we propose the use of low-cost, 16-Line lidar and stereo cameras as a replacement for 64-Line lidar. We leverage the stereo cameras to learn the depth and local shape of objects and then utilize the 16-Line lidar to correct the errors introduced during this process. By combining the information from both sensors, our approach achieves performance comparable to that of 64-Line lidar-based object detection while significantly reducing the cost.
Overall, our proposed approach demonstrates nearly equivalent performance to that of 64-Line lidar-based object detection. By utilizing stereo cameras and 16-Line lidar, we not only improve the accuracy of Pseudo-Lidar-based object detection but also achieve cost savings compared to using 64-Line lidar. These findings suggest that our approach holds promise for practical applications where accurate 3D object detection is desired at a lower cost.
Author Contributions
Conceptualization, X.F. and D.X.; methodology, X.F. and D.X.; software, X.F. and D.X.; validation, X.F., D.X. and D.C.; formal analysis, D.X. and D.C.; investigation, X.F. and D.X.; resources, X.F.; data curation, D.X.; writing—original draft preparation, D.X.; writing—review and editing, X.F., D.X., D.C. and W.D.; visualization, D.X.; supervision, D.C.; project administration, W.D.; funding acquisition, X.F. All authors have read and agreed to the published version of the manuscript.
Funding
This work was supported by the Guangxi Science and Technology Major Project (2023AA10003).
Data Availability Statement
Not applicable.
Conflicts of Interest
The authors declare that they have no conflict of interest in this work.
Abbreviations
The following abbreviations are used in this manuscript:
| RP | Real Pseudo-Lidar Point Cloud |
| PL | Pseudo-Lidar Point Cloud |
| IGEV | Iterative Geometry Encoding Volume for Stereo Matching |
| ICP | Iterative Closest Point |
References
- Wang, Y.; Chao, W.L.; Garg, D.; Hariharan, B.; Campbell, M.; Weinberger, K.Q. Pseudo-lidar from visual depth estimation: Bridging the gap in 3D object detection for autonomous driving. In Proceedings of the IEEE/CVF Conference on Computer Vision and Pattern Recognition, Long Beach, CA, USA, 15–20 June 2019; pp. 8445–8453. [Google Scholar]
- You, Y.; Wang, Y.; Chao, W.L.; Garg, D.; Pleiss, G.; Hariharan, B.; Campbell, M.; Weinberger, K.Q. Pseudo-lidar++: Accurate depth for 3D object detection in autonomous driving. arXiv 2019, arXiv:1906.06310. [Google Scholar]
- Qian, R.; Garg, D.; Wang, Y.; You, Y.; Belongie, S.; Hariharan, B.; Campbell, M.; Weinberger, K.Q.; Chao, W.L. End-to-end pseudo-lidar for image-based 3D object detection. In Proceedings of the IEEE/CVF Conference on Computer Vision and Pattern Recognition, Seattle, WA, USA, 13–19 June 2020; pp. 5881–5890. [Google Scholar]
- Wu, X.; Peng, L.; Yang, H.; Xie, L.; Huang, C.; Deng, C.; Liu, H.; Cai, D. Sparse fuse dense: Towards high quality 3D detection with depth completion. In Proceedings of the IEEE/CVF Conference on Computer Vision and Pattern Recognition, New Orleans, LA, USA, 18–24 June 2022; pp. 5418–5427. [Google Scholar]
- Xu, G.; Wang, X.; Ding, X.; Yang, X. Iterative Geometry Encoding Volume for Stereo Matching. In Proceedings of the IEEE/CVF Conference on Computer Vision and Pattern Recognition, Vancouver, BC, Canada, 18–22 June 2023; pp. 21919–21928. [Google Scholar]
- Wu, H.; Deng, J.; Wen, C.; Li, X.; Wang, C.; Li, J. CasA: A cascade attention network for 3-D object detection from LiDAR point clouds. IEEE Trans. Geosci. Remote Sens. 2022, 60, 5704511. [Google Scholar] [CrossRef]
- Zhang, Y.; Zhang, Q.; Zhu, Z.; Hou, J.; Yuan, Y. GLENet: Boosting 3D Object Detectors with Generative Label Uncertainty Estimation. arXiv 2022, arXiv:2207.02466. [Google Scholar] [CrossRef]
- Yang, Z.; Jiang, L.; Sun, Y.; Schiele, B.; Jia, J. A unified query-based paradigm for point cloud understanding. In Proceedings of the IEEE/CVF Conference on Computer Vision and Pattern Recognition, New Orleans, LA, USA, 18–24 June 2022; pp. 8541–8551. [Google Scholar]
- Hu, J.S.; Kuai, T.; Waslander, S.L. Point density-aware voxels for lidar 3D object detection. In Proceedings of the IEEE/CVF Conference on Computer Vision and Pattern Recognition, New Orleans, LA, USA, 18–24 June 2022; pp. 8469–8478. [Google Scholar]
- Deng, J.; Shi, S.; Li, P.; Zhou, W.; Zhang, Y.; Li, H. Voxel R-CNN: Towards high performance voxel-based 3D object detection. In Proceedings of the AAAI Conference on Artificial Intelligence, Vancouver, BC, Canada, 2–9 February 2021; Volume 35, pp. 1201–1209. [Google Scholar]
- Zhou, Y.; Tuzel, O. Voxelnet: End-to-end learning for point cloud based 3D object detection. In Proceedings of the IEEE Conference on Computer Vision and Pattern Recognition, Salt Lake City, UT, USA, 18–23 June 2018; pp. 4490–4499. [Google Scholar]
- Qi, C.R.; Su, H.; Mo, K.; Guibas, L.J. Pointnet: Deep learning on point sets for 3D classification and segmentation. In Proceedings of the IEEE Conference on Computer Vision and Pattern Recognition, Honolulu, HI, USA, 21–26 July 2017; pp. 652–660. [Google Scholar]
- Yang, H.; Liu, Z.; Wu, X.; Wang, W.; Qian, W.; He, X.; Cai, D. Graph R-CNN: Towards accurate 3D object detection with semantic-decorated local graph. In Proceedings of the European Conference on Computer Vision, Tel Aviv, Israel, 23–27 October 2022; Springer: Cham, Switzerland, 2022; pp. 662–679. [Google Scholar]
- Kim, Y.; Park, K.; Kim, M.; Kum, D.; Choi, J.W. 3D Dual-Fusion: Dual-Domain Dual-Query Camera-LiDAR Fusion for 3D Object Detection. arXiv 2022, arXiv:2211.13529. [Google Scholar]
- Chen, Y.; Li, Y.; Zhang, X.; Sun, J.; Jia, J. Focal sparse convolutional networks for 3D object detection. In Proceedings of the IEEE/CVF Conference on Computer Vision and Pattern Recognition, New Orleans, LA, USA, 18–24 June 2022; pp. 5428–5437. [Google Scholar]
- Chen, X.; Kundu, K.; Zhu, Y.; Berneshawi, A.G.; Ma, H.; Fidler, S.; Urtasun, R. 3D object proposals for accurate object class detection. Adv. Neural Inf. Process. Syst. 2015, 28, 424–432. [Google Scholar]
- Xu, B.; Chen, Z. Multi-level fusion based 3D object detection from monocular images. In Proceedings of the IEEE Conference on Computer Vision and Pattern Recognition, Salt Lake City, UT, USA, 18–23 June 2018; pp. 2345–2353. [Google Scholar]
- Chen, J.; Wang, Q.; Peng, W.; Xu, H.; Li, X.; Xu, W. Disparity-Based Multiscale Fusion Network for Transportation Detection. IEEE Trans. Intell. Transp. Syst. 2022, 23, 18855–18863. [Google Scholar] [CrossRef]
- Liu, L.; Song, X.; Sun, J.; Lyu, X.; Li, L.; Liu, Y.; Zhang, L. MFF-Net: Towards Efficient Monocular Depth Completion with Multi-Modal Feature Fusion. IEEE Robot. Autom. Lett. 2023, 8, 920–927. [Google Scholar] [CrossRef]
- Tosi, F.; Aleotti, F.; Poggi, M.; Mattoccia, S. Learning monocular depth estimation infusing traditional stereo knowledge. In Proceedings of the IEEE/CVF Conference on Computer Vision and Pattern Recognition, Long Beach, CA, USA, 15–20 June 2019; pp. 9799–9809. [Google Scholar]
- Li, Z.; Wang, X.; Liu, X.; Jiang, J. Binsformer: Revisiting adaptive bins for monocular depth estimation. arXiv 2022, arXiv:2204.00987. [Google Scholar]
- Yuan, W.; Gu, X.; Dai, Z.; Zhu, S.; Tan, P. New CRFs: Neural window fully-connected crfs for monocular depth estimation. arXiv 2022, arXiv:2203.01502. [Google Scholar]
- Xu, G.; Cheng, J.; Guo, P.; Yang, X. Attention concatenation volume for accurate and efficient stereo matching. In Proceedings of the IEEE/CVF Conference on Computer Vision and Pattern Recognition, New Orleans, LA, USA, 18–24 June 2022; pp. 12981–12990. [Google Scholar]
- Cheng, X.; Zhong, Y.; Harandi, M.; Dai, Y.; Chang, X.; Li, H.; Drummond, T.; Ge, Z. Hierarchical neural architecture search for deep stereo matching. Adv. Neural Inf. Process. Syst. 2020, 33, 22158–22169. [Google Scholar]
- Shen, Z.; Dai, Y.; Song, X.; Rao, Z.; Zhou, D.; Zhang, L. PCW-Net: Pyramid combination and warping cost volume for stereo matching. In Proceedings of the Computer Vision—ECCV 2022, 17th European Conference, Tel Aviv, Israel, 23–27 October 2022; Springer: Cham, Switzerland, 2022; pp. 280–297. [Google Scholar]
- Liu, B.; Yu, H.; Long, Y. Local similarity pattern and cost self-reassembling for deep stereo matching networks. Proc. AAAI Conf. Artif. Intell. 2022, 36, 1647–1655. [Google Scholar] [CrossRef]
- Li, J.; Wang, P.; Xiong, P.; Cai, T.; Yan, Z.; Yang, L.; Liu, J.; Fan, H.; Liu, S. Practical stereo matching via cascaded recurrent network with adaptive correlation. In Proceedings of the IEEE/CVF Conference on Computer Vision and Pattern Recognition, New Orleans, LA, USA, 18–24 June 2022; pp. 16263–16272. [Google Scholar]
- Luo, W.; Schwing, A.G.; Urtasun, R. Efficient deep learning for stereo matching. In Proceedings of the IEEE Conference on Computer Vision and Pattern Recognition, Las Vegas, NV, USA, 27–30 June 2016; pp. 5695–5703. [Google Scholar]
- Kendall, A.; Martirosyan, H.; Dasgupta, S.; Henry, P.; Kennedy, R.; Bachrach, A.; Bry, A. End-to-end learning of geometry and context for deep stereo regression. In Proceedings of the IEEE International Conference on Computer Vision, Venice, Italy, 22–29 October 2017; pp. 66–75. [Google Scholar]
- Chang, J.R.; Chen, Y.S. Pyramid stereo matching network. In Proceedings of the IEEE Conference on Computer Vision and Pattern Recognition, Salt Lake City, UT, USA, 18–23 June 2018; pp. 5410–5418. [Google Scholar]
- Khamis, S.; Fanello, S.; Rhemann, C.; Kowdle, A.; Valentin, J.; Izadi, S. Stereonet: Guided hierarchical refinement for real-time edge-aware depth prediction. In Proceedings of the European Conference on Computer Vision (ECCV), Munich, Germany, 8–14 September 2018; pp. 573–590. [Google Scholar]
- Zhang, Y.; Poggi, M.; Mattoccia, S. TemporalStereo: Efficient Spatial-Temporal Stereo Matching Network. arXiv 2022, arXiv:2211.13755. [Google Scholar]
- Çiçek, Ö.; Abdulkadir, A.; Lienkamp, S.S.; Brox, T.; Ronneberger, O. 3D U-Net: Learning dense volumetric segmentation from sparse annotation. In Proceedings of the Medical Image Computing and Computer-Assisted Intervention—MICCAI 2016, 19th International Conference, Athens, Greece, 17–21 October 2016; Springer: Cham, Switzerland, 2016; pp. 424–432. [Google Scholar]
- Geiger, A.; Lenz, P.; Stiller, C.; Urtasun, R. Vision meets robotics: The kitti dataset. Int. J. Robot. Res. 2013, 32, 1231–1237. [Google Scholar] [CrossRef]
- Geiger, A.; Lenz, P.; Urtasun, R. Are we ready for autonomous driving? The kitti vision benchmark suite. In Proceedings of the 2012 IEEE Conference on Computer Vision and Pattern Recognition, Providence, RI, USA, 16–21 June 2012; pp. 3354–3361. [Google Scholar]
- Mayer, N.; Ilg, E.; Hausser, P.; Fischer, P.; Cremers, D.; Dosovitskiy, A.; Brox, T. A large dataset to train convolutional networks for disparity, optical flow, and scene flow estimation. In Proceedings of the IEEE Conference on Computer Vision and Pattern Recognition, Las Vegas, NV, USA, 27–30 June 2016; pp. 4040–4048. [Google Scholar]
- Besl, P.J.; McKay, N.D. Method for registration of 3-D shapes. In Sensor Fusion IV: Control Paradigms and Data Structures, Proceedings of the ROBOTICS ’91, Boston, MA, USA, 14–15 November 1991; SPIE: Bellingham, WA, USA, 1992; Volume 1611, pp. 586–606. [Google Scholar]
- Qi, C.R.; Liu, W.; Wu, C.; Su, H.; Guibas, L.J. Frustum pointnets for 3D object detection from rgb-d data. In Proceedings of the IEEE Conference on Computer Vision and Pattern Recognition, Salt Lake City, UT, USA, 18–23 June 2018; pp. 918–927. [Google Scholar]
- Ku, J.; Mozifian, M.; Lee, J.; Harakeh, A.; Waslander, S.L. Joint 3D proposal generation and object detection from view aggregation. In Proceedings of the 2018 IEEE/RSJ International Conference on Intelligent Robots and Systems (IROS), Madrid, Spain, 1–5 October 2018; pp. 1–8. [Google Scholar]
- Weng, X.; Kitani, K. Monocular 3D object detection with pseudo-lidar point cloud. In Proceedings of the IEEE/CVF International Conference on Computer Vision Workshops, Seoul, Republic of Korea, 27–28 October 2019. [Google Scholar]
- Chen, X.; Kundu, K.; Zhang, Z.; Ma, H.; Fidler, S.; Urtasun, R. Monocular 3D object detection for autonomous driving. In Proceedings of the IEEE Conference on Computer Vision and Pattern Recognition, Las Vegas, NV, USA, 27–30 June 2016; pp. 2147–2156. [Google Scholar]
Figure 1.
Real Pseudo-Lidar Point Cloud Object Detection Framework. The blue part corresponds to the disparity estimation using the IGEV. The green part represents the framework for fusing Real Pseudo-Lidar point clouds. The gray part shows the 3D object detection results.
Figure 1.
Real Pseudo-Lidar Point Cloud Object Detection Framework. The blue part corresponds to the disparity estimation using the IGEV. The green part represents the framework for fusing Real Pseudo-Lidar point clouds. The gray part shows the 3D object detection results.
Figure 2.
We show the depth maps generated using 2D convolution (top left) and their projection onto the Pseudo-Lidar from a top-down view (bottom left). The depth maps generated using the stacked hourglass 3DCNN with intermediate supervision (top middle) and their projection onto the Pseudo-Lidar from a top-down view (bottom middle) are also displayed. Additionally, the depth maps generated using the iterative geometry-encoding volume (top right) and their projection onto the Pseudo-Lidar from a top-down view (bottom right) are shown.
Figure 3.
Point cloud calibration results. The red bounding box indicates the actual range of the car’s position. In the first row, we present uncalibrated Pseudo-Lidar point cloud data. In the second row, we display Pseudo-Lidar point cloud data after undergoing ICP calibration; it is now much closer to the actual position.
Figure 4.
We demonstrate the 2D detection results using Pseudo-Lidar point clouds on AVOD (left image) and the detection results using Real Pseudo-Lidar point clouds on AVOD (right image). The red boxes in the KITTI dataset correspond to the ground truth bounding boxes of objects, whereas the bounding boxes depicted in green signify the forecasted bounding boxes.
Figure 5.
We demonstrate the 3D detection results using Pseudo-Lidar point clouds on AVOD (left image) and the detection results using Real Pseudo-Lidar point clouds on AVOD (right image). The red boxes in the KITTI dataset correspond to the ground truth bounding boxes of objects, whereas the green boxes represent the predicted bounding boxes.
Figure 6.
We present the detection results on lidar point clouds using Pseudo-Lidar point clouds on F-PointNet (left image) and the detection results of Real Pseudo-Lidar point clouds on F-PointNet (right image). The red boxes in the KITTI dataset correspond to the ground truth bounding boxes of objects, whereas the green boxes represent the predicted bounding boxes.
Table 1.
Performance of 3D object detection on the KITTI validation set. We present the car category’s (in percentage), which represents the average precision of bird’s-eye view and 3D bounding box detection. “Mono” denotes monocular cameras, “Stereo” represents stereo cameras, “4L”, “16L”, and “L”, respectively, refer to 4-Line, 16-Line, and 64-Line lidar sensors. The results of our algorithm based on the fusion of pure Pseudo-Lidar point clouds are shown in green, whereas the results of the algorithm based on the fusion of Real Pseudo-Lidar point clouds are presented in blue. Methods utilizing 64-Line lidar point clouds are depicted in gray.
| Detection Algorithm | Input Signal | IOU = 0.5 | IOU = 0.7 |
|---|
| Easy | Moderate | Hard | Easy | Moderate | Hard |
|---|
| Mono3D | Mono | 30.5/25.2 | 22.4/18.2 | 19.2/15.5 | 5.2/2.5 | 5.2/2.3 | 4.1/2.3 |
| Monocular 3D | Mono | 72.1/68.4 | 53.1/48.3 | 44.6/43.0 | 41.9/31.5 | 28.3/21.0 | 24.5/17.5 |
| PL:AVOD | Stereo | 89.0/88.5 | 77.5/76.4 | 68.7/61.2 | 74.9/61.9 | 56.8/45.3 | 49.0/39.0 |
| PL:F-POINTNET | Stereo | 89.8/89.5 | 77.6/75.5 | 68.2/66.3 | 72.8/59.4 | 51.8/39.8 | 44.0/33.5 |
| PL++:P-RCNN | Stereo | 89.8/89.7 | 83.8/78.6 | 77.5/75.1 | 82.0/67.9 | 64.0/50.1 | 57.3/45.3 |
| PL++:P-RCNN | 4L + Stereo | 90.3/90.3 | 87.7/86.9 | 84.6/84.2 | 88.2/75.1 | 76.9/63.8 | 73.4/57.4 |
| RP:AVOD | Stereo | 89.7/89.3 | 78.7/77.0 | 69.9/68.6 | 77.3/62.5 | 58.1/45.4 | 50.1/39.0 |
| RP:F-POINTNET | Stereo | 94.94/89.9 | 77.8/75.8 | 68.5/67.0 | 79.3/68.9 | 52.7/42.4 | 44.9/38.5 |
| RP:AVOD | 16L + Stereo | 90.4/90.2 | 88.3/87.7 | 80.3/79.8 | 85.5/72.7 | 76.3/57.0 | 68.9/55.0 |
| RP:F-POINTNET | 16L + Stereo | 95.7/95.3 | 88.6/87.3 | 79.2/78.0 | 84.6/75.2 | 70.7/57.8 | 62.1/50.0 |
| AVOD | LiDAR + Mono | 90.5/90.5 | 89.4/89.2 | 88.5/88.2 | 89.4/82.8 | 86.5/73.5 | 79.3/67.1 |
| F-POINTNET | LiDAR + Mono | 96.2/96.1 | 89.7/89.3 | 86.8/86.2 | 88.1/82.6 | 82.2/68.8 | 74.0/62.0 |
Table 2.
Results of object detection for the pedestrian and cyclist categories on the validation set. We report the (standard metrics) at IOU = 0.5. The results of our algorithm based on the fusion of pure Pseudo-Lidar point clouds are shown in green, whereas the results of the algorithm based on the fusion of Real Pseudo-Lidar point clouds are presented in blue. Methods utilizing 64-Line lidar point clouds are depicted in gray.
| Detection Algorithm | Category | Input Signal | Easy | Moderate | Hard |
|---|
| Monocular 3D | Pedestrian | Mono | 14.4/11.6 | 13.8/11.2 | 12.0/10.9 |
| Cyclist | Mono | 11.0/8.5 | 7.7/6.5 | 6.8/6.5 |
| PL:F-POINTNET | Pedestrian | Stereo | 41.3/33.8 | 34.9/27.4 | 30.1/24.0 |
| Cyclist | Stereo | 47.6/41.3 | 29.9/25.2 | 27.0/24.9 |
| RP:F-POINTNET | Pedestrian | Stereo | 55.4/49.1 | 44.8/39.0 | 40.0/34.4 |
| Cyclist | Stereo | 53.5/43.8 | 33.1/28.3 | 30.9/26.3 |
| Pedestrian | 16L + Stereo | 68.6/62.0 | 57.9/51.0 | 50.5/43.8 |
| Cyclist | 16L + Stereo | 61.6/56.3 | 41.7/37.7 | 38.3/34.6 |
| F-POINTNET | Pedestrian | LiDAR + Mono | 69.7/64.7 | 60.6/56.5 | 53.4/49.9 |
| Cyclist | LiDAR + Mono | 70.3/66.6 | 55.0/50.9 | 52.0/46.6 |
| Disclaimer/Publisher’s Note: The statements, opinions and data contained in all publications are solely those of the individual author(s) and contributor(s) and not of MDPI and/or the editor(s). MDPI and/or the editor(s) disclaim responsibility for any injury to people or property resulting from any ideas, methods, instructions or products referred to in the content. |
© 2023 by the authors. Licensee MDPI, Basel, Switzerland. This article is an open access article distributed under the terms and conditions of the Creative Commons Attribution (CC BY) license (https://creativecommons.org/licenses/by/4.0/).


