
Novel Application of Open-Source Cyber Intelligence


School of Public Health and Preventive Medicine, Monash University, Melbourne, VIC 3004, Australia
Electronics 2023, 12(17), 3610; https://doi.org/10.3390/electronics12173610
Submission received: 13 July 2023
/
Revised: 14 August 2023
/
Accepted: 23 August 2023
/
Published: 26 August 2023
(This article belongs to the Special Issue AI in Disaster, Crisis, and Emergency Management)
Abstract
:The prevalence of cybercrime has emerged as a critical issue in contemporary society because of its far-reaching financial, social, and psychological implications. The negative effects of cyber-attacks extend beyond financial losses and disrupt people’s lives on social and psychological levels. Conventional practice involves cyber experts sourcing data from various outlets and applying personal discernment and rational inference to manually formulate cyber intelligence specific to a country. This traditional approach introduces personal bias towards the country-level cyber reports. However, this paper reports a novel approach where country-level cyber intelligence is automatically generated with artificial intelligence (AI), employing cyber-related social media posts and open-source cyber-attack statistics. Our innovative cyber threat intelligence solution examined 37,386 tweets from 30,706 users in 54 languages using sentiment analysis, translation, term frequency–inverse document frequency (TF-IDF), latent Dirichlet allocation (LDA), N-gram, and Porter stemming. Moreover, the presented study utilized 238,220 open-intelligence cyber-attack statistics from eight different web links, to create a historical cyber-attack dataset. Subsequently, AI-based algorithms, like convolutional neural network (CNN), and exponential smoothing were used for AI-driven insights. With the confluence of the voluminous Twitter-derived data and the array of open-intelligence cyber-attack statistics, orchestrated by the AI-driven algorithms, the presented approach generated seven-dimensional cyber intelligence for Australia and China in complete automation. Finally, the topic analysis on the cyber-related social media messages revealed seven main themes for both Australia and China. This methodology possesses the inherent capability to effortlessly engender cyber intelligence for any country, employing an autonomous modality within the realm of pervasive computational platforms.
1. Introduction
By 2020, the expense of global cyber-attacks had reached over USD 1 trillion [1]. By 2025, it is anticipated that cybercrime will cost up to USD 10.5 trillion annually [2]. Cybercrime costs billions of dollars in consumer losses in countries with larger economies including China, Brazil, the United States, India, Mexico, France, Australia, and even the United Arab Emirates [3]. For instance, China’s consumers lost USD 66.3 billion to cybercrime in 2017 [3]. In addition to causing financial losses, cyber-attacks negatively affect people’s life on a social and psychological level [4]. For instance, a recent cyber-attack disclosed data from Optus, one of Australia’s largest telecom companies, causing people to feel extremely stressed and angry [5,6].
Information about Optus customers, such as name, date of birth, email addresses, driver’s license, Medicare card, passport numbers, etc., may have been revealed as a result of this cyber-attack, upsetting 2.1 million people [6,7]. Most recently, cybercriminals obtained private patient data from Australia’s top health insurance provider, including medical diagnoses and procedures [8]. Therefore, one of the most important contemporary issues facing countries, states, companies, and people is cybercrime.
The availability of data related to cyberspace and highly developed analytical algorithms to spot and stop threats are two essential requirements to lessen the effects of cybercrime. Recent studies in [1,9] illustrated the needs of cyber data. These cyber data could be found from actual network traffic [10,11,12,13], simulation [14], survey [15], open-source anti-virus intelligence [16], or even from social media data [16,17,18,19,20,21,22,23,24]. Out of all other sources of cyber intelligence, open-source data, as well as the social media data from Twitter, are by far the most efficient way to obtain cyber data that we have seen from recent research [16,17,18,19,20,21,22,23,24]. However, none of these existing studies provided multi-dimensional cyber intelligence purely by analyzing cyber-related social media data from Twitter.
In this paper, first, we critically reviewed existing studies on multi-dimensional cyber intelligence to find out the strategic questions they answer [25,26,27,28,29,30,31]. Then, based on these existing studies, we created a seven-dimensional cyber threat intelligence model. Next, we reviewed existing studies that harnessed social-media-based cyber intelligence. We then designed a new method of social-media-based cyber intelligence solutions using sentiment analysis, translation, term frequency–inverse document frequency (TF-IDF), latent Dirichlet allocation (LDA), N-gram, Porter stemming, a convolutional neural network (CNN), and exponential smoothing.
Finally, to evaluate this newly designed and developed social-media-based cyber threat intelligence system, we analyzed 37,386 Tweets from 30,706 users from 13 October 2022 to 6 April, 2023. During this period, Tweets in 54 languages were captured, processed, and analyzed to produce seven-dimensional cyber threat intelligence for both China and Australia. It should be mentioned that using the presented methodology, a cyber-security strategist would be able to obtain seven-dimensional cyber threat intelligence for any country in the world in an automated manner. Apart from reporting the first seven-dimensional cyber threat intelligence solution with social media analytics, the following are some of the core contributions of this paper:
- Previous studies in [32,33,34] showed dependencies on the manual aggregation of multiple reports along with personal judgements, and the analysis of cyber professionals that potentially introduces the authors’ biasness towards certain countries. In contrast, this paper introduces a methodology that automatically obtains cyber-related information from multiple sources and provides instantaneous AI-driven insights without personal prejudice or preconception.
- Compared to all existing social-media-based cyber intelligence solutions [16,17,19,20,21,22,23,24], the presented method utilized the most comprehensive set of natural language processing (NLP) algorithms like sentiment analysis, translation, TF-IDF, LDA, N-gram, Porter stemming, etc. Unlike the existing research on social-media-based cyber intelligence [19,20,21,22,23,24], the presented study provides the most comprehensive cyber intelligence by analyzing social media post in 54 languages, performing 8199 dynamic translations.
- The innovative AI-based method presented in this paper was used for the first time to automatically generate multi-dimensional cyber intelligence for both Australia and China. It was identified that China suffers from higher levels of cyber threat being attacked with spam (i.e., China was identified as the second most attacked country based on spam). On the other hand, Australia’s cyber threat level is moderate with exploit being the most common type of attack (i.e., Australia was identified as the 11th most attacked country in terms of exploit).
- Australians are concerned with data breaches (e.g., Optus, Medibank), cybersecurity threats and assaults, and issues like malware, phishing, and ransomware. Both the general public (i.e., Australians through data breaches) and organizations (e.g., Optus, Medibank) are victims of cyber-attacks in Australia. On the other hand, Chinese social media posts tend to be more geopolitical in nature, discussing cyberespionage and intrusions by foreign countries, particularly the United States. The target of cyber-attacks in China are Chinese tech firms, Chinese-owned apps (e.g., TikTok), as well as supply chains.
2. Background and Literature
This section provides a succinct background on the multi-dimensional analysis of cyber threats as well as NLP-based analysis of cyber-related social media posts. Table 1 summarizes the multiple dimensions of cyber intelligence along with the different strategic questions they offer to strategic decision-makers. This section also investigates existing research on NLP-based processing of cyber-related social media messages (as summarized in Table 2). Using the existing knowledge of both multi-dimensional cyber threat analysis and NLP-based processing of social media posts, a new seven-dimensional cyber threat intelligence model is constructed (as shown in Figure 1).
2.1. Multi-Dimensional Analysis of Cyber Threats
Research in [25] attempts to highlight the importance of a common definition and conceptual framework for cyber terrorism and to ascertain the public’s perceptions of cyber terrorism. Additionally, it creates a framework for terrorist action that emphasizes the connections between conventional, cyber-enabled, and cyber-dependent terrorism as well as a definition of cyber terrorism that is compatible with UK legislative definitions.
The study in [26] offers a thorough analysis of cybersecurity concerns from a variety of angles, including technical weaknesses, sociopolitical and cognitive aspects, as well as ramifications for the economy, ethics, and privacy. Additionally, it covers the problems with and fixes for cybersecurity in various industries, including energy, healthcare, transportation, and education.
The taxonomy of cyber-harms proposed in [27] can be used to categorize and assess the effects of cyber-attacks on people, organizations, and society. Additionally, it points out the shortcomings and difficulties in the current study on cyber-harms and makes recommendations for future research. The paper examines four real-world case studies to show the connections between various forms of harm and the potential spread of cyber-violence. The study makes an argument for the requirement of analytical tools for organizational cyber-harm based on a proposed taxonomy.
The report in [31] underscores how crucial employee and organizational education and training are to preventing and minimizing cybersecurity events. It also outlines the major obstacles and potential in this area and offers a framework for doing research on cybersecurity awareness.
The common cybersecurity vulnerabilities and their recurrence rates are identified and examined in [30]. The publication venue, country, and important targeted infrastructures and applications are also displayed. According to the report, more research is needed on identifying the most important cybersecurity vulnerabilities and mitigation strategies. There also needs to be more empirical validation and practical application of security tactics.
By examining previous phishing strategies and assessing the condition of phishing today, the study in [28] examines phishing attacks. Additionally, it suggests a brand-new, in-depth anatomy of phishing that covers attack phases, different sorts of attackers, weaknesses, threats, targets, attack media, and attacking strategies. The goal of the study is to raise awareness of phishing assaults and the methods utilized, as well as to aid in the creation of a comprehensive anti-phishing system.
The article in [29] examines several perspectives on cybersecurity dangers, including technical, human, organizational, and environmental ones. Additionally, it proposes a methodology for examining cybersecurity concerns in light of these factors and how they interact. According to the article, a multi-dimensional approach can be used to pinpoint the underlying causes of cybersecurity problems and develop more potent defenses.
2.2. Cyber Intelligence Analysis from Social Media with NLP
Machine learning (ML) algorithms have been used to obtain deeper insights on various research domains like diabetic foot ulcers [35], image classification [36], and depression detection [37]. ML algorithms like decision trees can help social media platforms detect and filter spam more efficiently, as shown in [38]. These resent research works inspired this study of using ML and NLP for analyzing social media and generating cyber intelligence.
The process of cyber intelligence analysis, conducted through the lens of NLP, entails a comprehensive examination of individuals’ opinions, perceptions, attitudes, thoughts, and emotions, as expressed on various social media platforms. Among the numerous NLP techniques employed within this process, sentiment analysis holds particular prominence. This technique aims to categorize written texts into neutral, positive, or negative sentiments, thereby facilitating a nuanced understanding of the expressed content [39]. In the realm of digital forensic investigation, the utilization of NLP techniques, coupled with a proposed blockchain framework, serves as a foundational pillar. NLP plays a pivotal role in several key aspects of this investigation, including the data collection analysis, representations at each phase, vectorization, feature selection, and classifier evaluation. By harnessing NLP methodologies, this framework enables comprehensive analysis and the interpretation of digital forensic evidence, contributing to the overall investigative process [40]. Moreover, text-based personality prediction, drawing upon multiple sources of social media data, can be accomplished through the deployment of pre-trained models. These models, which have been trained to address diverse NLP challenges such as text-based emoticon classification and toxic comment classification, leverage advanced architectures like RoBERTa and XLNet. Notably, the integration of these pre-trained models with other NLP features, such as TF-IDF and sentiment analysis, has demonstrated enhanced accuracy, substantiating their efficacy in predicting personality traits based on textual content [41].
Analyzing cyber-related social media posts from Twitter started almost 10 years ago [42]. However, these studies did not utilize the power of ML and deep learning (DL) techniques for automated critical analysis of social media posts. Rather, the study in [42] used general statistical techniques manually to obtain insights into cyber bullying and other cyber-related issues.
The methodology described in [21] uses sentiment analysis of Tweets to forecast cyber-attacks. The authors gathered Tweets and used machine learning algorithms to categorize them as security-related, positive, or neutral. After that, they assessed the relationship between the sentiment scores and the cyber-attacks covered by Google News using a regularized regression model. They discovered that, particularly when the coefficient of determination was high, their methodology might be used as a warning system to identify potential cyber-attacks. They discussed how hacktivists responded to the candidates’ comments and actions in the 2016 US presidential elections as they examined their methods and provided examples.
Term frequency–inverse document frequency (TF-IDF) is used in [22] to extract features from a dataset of 2000 Tweets that are evenly split between bully and non-bully Tweets. The paper compares the performance of five different classifiers based on metrics including precision, recall, F1-score, accuracy, specificity, MCC, fall out, miss rate, and mean square error. The classifiers are support vector classifier (SVC), logistic regression, multinomial naive Bayes, random forest classifier, and stochastic gradient descent classifier [22]. Finally, the study in [22] concludes that logistic regression, which achieved 91% precision, 96% recall, 93% F1-score, and 93% accuracy for detecting bullying Tweets, is the best classifier among the five. The paper also makes some recommendations for future research, including reporting and automatically deleting Tweets that abuse people as well as taking harsh action against them.
The research article in [23] utilized the TF-IDF and LGBM algorithms to identify cyber-attacks in darknet traffic. The study gathered information about darknet traffic from a variety of sources and used TF-IDF to identify features in the packet payloads [23]. In order to categorize the packets into various cyber-attacks, including worms, dos attacks, backdoor attacks, DDoS assaults, spam, and malicious content, the paper used LGBM [23]. Finally, the study assessed LGBM’s performance and compared it to other algorithms, concluding that LGBM performed better than the other algorithms based on testing results and obtained the greatest accuracy of 98.97% [23].
In [19], two new machine-learning-based classifiers were utilized to collect a large-scale Twitter dataset and analyze the themes inside it using LDA. Wi-Fi, smartphones, laptops, smart home technology, financial security, help-seeking, and the roles of many stakeholders were among the themes covered. Additionally, sentiment analysis was completed for the study, and all themes had a generally negative sentiment.
When combined with the benchmarked cyber keywords, the next level of sensitive keywords that could lead to vulnerability were identified in a study using LDA [20]. In order to extract sensitive terms from Twitter data, the study developed a framework combining cyber keywords with LDA.
Using the hashtags #scamdemic and #plandemic, the research study in [24] analyzes COVID-19 misinformation spread on Twitter. The study gathers and analyzes 227,067 Tweets from 2020 that utilize these hashtags and investigates their sentiment, emotion, topic, and user attributes. The majority of the Tweets, according to the study, are negative, afraid, angry, and mistrustful. One in five users who used these hashtags had their Twitter accounts suspended by January 2021 [24]. The paper concludes that the Tweets show a denial of the COVID-19 epidemic and the dissemination of false or misleading information that jeopardizes public health initiatives.
Table 2 and Table 3 highlight various NLP algorithms used by the existing research works in [16,19,20,21,22,23,24]. As seen from Table 2 and Table 3, the proposed system presented in this study employs the most comprehensive use of NLP-based algorithms on cyber-related social media posts to generate seven-dimensional cyber intelligence.
3. Material and Methods
As shown in Table 2 and Table 3, the proposed solution uses several NLP algorithms like sentiment analysis, translation, term frequency analysis (e.g., TF-IDF, Porter stemming, N-grams), and topic modelling (LDA).
Moreover, the proposed method utilizes CNN-based deep learning and exponential-smoothing-based forecasting. It should be highlighted that the rationale behind selecting this wide range of algorithms was due to the background studies presented in the previous section (i.e., [16,19,20,21,22,23,24,25,26,27,28,29,30,31]). Figure 2 demonstrates the use of these algorithms for generating the 7-dimensional cyber threat intelligence. Figure 2 shows the processing of social media messages that starts with obtaining Tweets. Then, the AI-based analysis of the Tweets is performed, with phases such as language detection, English translation, sentiment analysis, anomaly detection, topic modelling and term frequency analysis before the visualization. On the other hand, Figure 3 demonstrates the processing of open-source cyber-attack data (obtained from anti-virus vendors like Kaspersky [16,43]). As seen from Figure 3, analysis of open-source cyber-attack data involves anomaly detection as well as threat prediction phases. It should be noted that in [17,18], eight different attack statistics (e.g., spam, ransomware, malware attack, network attack, etc.) were obtained from 8 different web-sources using web scraping technology (applicable for the phases demonstrated in Figure 3). Detailed descriptions of these major phases are provided within Section 3.1, Section 3.2, Section 3.3, Section 3.4, Section 3.5 and Section 3.6.
3.1. Language Detection and Translation
Microsoft offers a set of AI-powered services called Azure Cognitive Services that let programmers create intelligent applications without needing to create the underlying AI technology themselves. Language translation and detection are among the capabilities provided by Azure Cognitive Services [44].
The method of determining the language of a given text is known as language detection. A Language Detection API provided by Azure Cognitive Services may automatically determine the language of a given text input. This API is available in a variety of computer languages, including C#, Java, Python, and more, and it is capable of accurately detecting more than 120 different languages [44].
The process of translating text from one language to another, on the other hand, is called translation. A Text Translation API is available from Azure Cognitive Services that allows for real-time text translation between any of the more than 90 supported languages. The API uses neural machine translation to produce precise and audible translations of the highest caliber. To enhance the translation quality for particular fields or businesses, the Text Translation API can also be modified.
You must register for an Azure account and subscribe to the Language Detection and/or Text Translation APIs to access these services. Following that, you can use the offered SDKs or REST APIs to integrate the APIs into your application. The SDKs make it simple to include the APIs into your application and are accessible for a variety of programming languages. You can include the REST APIs into any platform or programming language that supports HTTP requests. Line 1 to line 5 of Algorithm 1 converts a multilingual stream of social media messages xi to yi, where i = 0 to N.
| Algorithm 1: Application of NLP to Processing of Social Media Messages with Cyber Concerns | |
| 1: | For each xi in N, Multilingual Social Media Messages |
| 2: | If Language(xi)<> ‘English’ |
| 3: | yi = Translate(xi) |
| 4: | Else |
| 5: | yi = xi |
| 6: | For each yi in N, English Social Media Messages |
| 7: | si = Sentiment(yi) |
| 8: | If yi Contains ‘Country Name’ |
| 9: | } = yi |
| 10: | For each cr in C, Countries |
| 11: | ) |
| 12: | }, …} = TermFrequency(Tokenize(yi)) |
| 13: | }, …} = Stemming(Tokenize(yi)) |
| 14: | }, …} = n_gram(Tokenize(yi)) |
| 15: | , {{}…}}, …} = Topic(Tokenize(yi)) |
| 16: | Generate Interactive Visualization |
3.2. Sentiment Analysis
The technique of figuring out the emotional undertone or sentiment communicated in a piece of text, whether a Tweet, review, or article, is known as sentiment analysis. With the help of the Sentiment Analysis API provided by Azure Cognitive Services, the overall positive or negative sentiment indicated in the text may be determined by automatically analyzing the sentiment of a particular text input [44].
The Sentiment Analysis API functions by first analyzing the sentiment connected to each of the important phrases, entities, and linguistic constructions found in the input text using natural language processing techniques. The API provides extremely accurate sentiment analysis for a variety of text inputs, including social media postings, customer reviews, and support issues, using a machine learning model trained on a vast corpus of text data.
A user must register for an Azure account and subscribe to the Sentiment Analysis API in order to utilize it. Following that, the user can use the offered SDKs or REST APIs to incorporate the API into the user’s application. The SDKs make it simple to include the API into the user’s application and are accessible for a variety of programming languages. The user can include the REST APIs into any platform or programming language that supports HTTP requests [44].
Together with the overall sentiment score, the Sentiment Analysis API also offers extensive information about the sentiment represented in the input text, such as the sentiment scores for individual sentences and the key phrases and entities linked to each sentiment score. In a variety of situations, including customer service, marketing, and social media monitoring, this information can be used to make decisions and acquire deeper insights into the sentiment expressed in the input text [19,21,45,46]. Line 7 of Algorithm 1 depicts the sentiment analysis process with Equation (1). The sentiment classification is shown in Equation (2).
si = Sentiment(yi)
3.3. Anomaly Detection
By automatically identifying anomalies in time-series data, the anomaly detector enhances line charts. A dynamic explanation of the identified anomalies is provided by the anomaly detection method using NLP-based root-cause analysis [44]. Additionally, by employing anomaly detection on a live social media feed, catastrophic occurrences can be dynamically examined, as shown in [45]. Anomaly detection algorithms were also used to critically analyze international news, as illustrated in [46]. A more recent critical analysis of the COVID-19 situation was conducted using a CNN-based anomaly detection system [47]. In this section, we will first examine the problem definition before delving deeply into the method of anomaly detection.
When presented with a sequence of real values, , the objective of time-series anomaly detection is to generate an output sequence, where each indicates whether corresponds to an anomaly point.
The research conducted in [48] showcased the process of saliency reduction (SR) within the domain of visual saliency detection, followed by the application of CNN to the output of the SR model. In line with the approach described in [48], this study incorporates a similar process, focusing on three fundamental tasks:
- The application of Fourier transforms to generate the log amplitude spectrum.
- The computation of the SR operation.
- The utilization of inverse Fourier transform to revert the sequence back to the spatial domain.
By adhering to these core tasks, the study aims to achieve effective anomaly detection within the time-series data, leveraging the principles established in [48].
Within this context, the Fourier transform is symbolized by f, while the inverse Fourier transform is denoted as f1. Additionally, the input sequence, characterized by its shape as n X 1, is represented by the variable x. The amplitude spectrum of sequence x is designated as A(f), whereas the phase spectrum is denoted as P(f). Furthermore, the logarithmic representation of the amplitude spectrum, L(f), is employed. The average spectrum, denoted as AL(f), is estimated by convolving the input sequence with hq(f). Notably, hq(f) can be described as a q × q matrix, as illustrated in Equation (9).
In Equation (7), the computation of R(f) is performed by subtracting the averaged log spectrum, denoted as AL(f), from the log spectrum, represented as L(f). This subtraction operation is carried out to obtain the desired spectral residual, where SR is designated as R(f). Subsequently, as depicted in Equation (8), an inverse Fourier transform is applied to assign the resulting sequence back to the spatial domain. This sequence, denoted as S(x), is referred to as the saliency map, serving as the final output representation [49]. Notably, the computation of anomaly points is accomplished using Equation (10), which provides a means of identifying deviations from the expected patterns within the saliency map.
Within Equation (10), the computation of the local average of preceding data points is denoted as . Simultaneously, Equation (10) incorporates the mean (mean) and variance (var) of all data points within the current sliding window, which is randomly sampled from a normal distribution, r ∼ N (0, 1). Notably, this approach involves applying CNN to the saliency map, rather than the raw input data. By adopting this methodology, the process of anomaly detection aims to achieve both enhanced effectiveness and efficiency [48,49]. It is important to highlight that the anomaly identification technique employed in this study leverages NLP to furnish comprehensive explanations, expressed in plain English, elucidating the origins of all detected anomalies [44].
3.4. Term Frequency
The method of text analysis, referred to as term frequency–inverse document frequency (TF-IDF), is employed to ascertain the relative significance of words within a given document [19,20,21,22,23]. This technique involves multiplying a word’s frequency in a particular document by its inverse frequency across the entire corpus, resulting in a numerical score known as the inverse document frequency. Consequently, terms that exhibit significance within a specific document while being infrequent across the entire corpus are assigned greater weight. Notably, as evident in line 12 of Algorithm 1, the TF-IDF process generates a vector comprising words alongside their respective frequencies, represented as {{, }, …}, where represents a word and signifies its corresponding frequency.
Porter stemming constitutes a method employed to condense words to their fundamental or root form [21]. This technique normalizes words by eliminating common suffixes, thereby unifying the root forms of various related words. For instance, the root form of the words “running”, “runs”, and “run” would all be identical. By reducing the number of distinct terms and consolidating similar words, this method augments the accuracy of text analysis. Line 13 of Algorithm 1 exemplifies the creation of a vector, denoted as {{, }, …}, wherein represents the root word and denotes its corresponding frequency.
In the realm of text analysis, N-grams denote contiguous groups of n words [19,20,21]. These N-grams are commonly employed to capture linguistic context and structure. For instance, trigrams (n = 3) allow for the inclusion of more intricate word sequences, such as “deep learning algorithms”, while bigrams (n = 2) facilitate the identification of frequently co-occurring word pairs, such as “machine learning”. N-grams can be utilized to generate features for tasks such as text classification, clustering, and other forms of text analysis. Line 14 of Algorithm 1 demonstrates the unions of words (i.e., ) and their corresponding frequency, fo. In the case of bigrams, this would correspond to , whereas for trigrams, it would entail .
By employing a combination of TF-IDF, Porter stemming, and N-grams, one can preprocess and analyze textual data, thereby enhancing the precision and efficiency of text analysis operations.
3.5. Topic Modelling
The process of identifying the principal themes or subjects within a corpus of texts is known as topic modeling, an approach highly regarded for its efficacy. Among the various algorithms utilized for this purpose, latent Dirichlet allocation (LDA) stands out as a prominent choice [19,20]. According to the statistical model underlying LDA, each document within a collection comprises a mixture of distinct themes, with each word being generated from one of these topics.
To enable the LDA algorithm’s functioning, an initial random assignment of topics is bestowed upon each word in every document. Subsequently, the topic assignments are iteratively updated based on the words encountered within the texts, striving to attain a set of topic assignments that optimally captures the observed words. Following the determination of the document collection’s subjects, the LDA method offers diverse avenues for exploring and analyzing the content of the documents [19,20]. For instance, it allows for the identification of the most prevalent topics within the collection, the investigation of interrelationships between topics, and the discovery of documents closely associated with each topic. Leveraging LDA opens up a wide array of applications, encompassing natural language processing, text mining, and information retrieval, thereby serving as a potent instrument for uncovering latent subjects within a collection of texts.
Illustratively demonstrated in line 15 of Algorithm 1, the LDA algorithm provides insights into topics, denoted as , and furnishes a list of words alongside their corresponding frequencies pertaining to each topic, designated as This presentation of topics and their associated word distributions constitutes a fundamental component of the LDA algorithm’s output.
3.6. Exponential Smoothing
Exponential smoothing, a statistical technique employed for the analysis and prediction of time-series data, is characterized by the assignment of exponentially diminishing weights to past observations. This weighting scheme bestows greater importance upon more recent observations while diminishing the influence of older ones. In a notable research article referenced as [50], the authors utilize historical data and exponential smoothing to forecast the frequency of malware attacks targeting computer systems. Within this study, the effectiveness of single and double exponential smoothing models is evaluated through the employment of various performance metrics, namely mean squared error (MSE), mean absolute error (MAE), and mean absolute percentage error (MAPE). The findings suggest that the single exponential smoothing model yields favorable results in predicting the occurrences of malware attacks.
The single exponential smoothing model solely relies on a single smoothing parameter, denoted as α. This model operates under the fundamental assumption that the mean of the data remains constant while the actual data fluctuate around it. Consequently, the single exponential smoothing model is mathematically represented by Equation (11). On the other hand, the double exponential smoothing model represents an extension of the single exponential smoothing approach. In the double exponential smoothing method, two parameter constants, namely α and β, are employed. Smoothing constant α is employed to smooth the estimate of the level value, while β is utilized to smooth the estimate of the trend value. Double exponential smoothing is employed when there is evidence of a trend within the data, yet no discernible seasonal effects are present. Although resembling single exponential smoothing, double exponential smoothing necessitates the adjustment of α and β, the parameters governing the smoothing of level and trend, respectively, on an ongoing basis. Equation (11) encapsulates the formulation of double exponential smoothing, while Equation (12) depicts the estimation of the trend, and Equations (13) and (14) outline the forecasting process for m steps ahead.
In Equation (11), signifies the forecast for the subsequent period, while represents the previous forecast for period t. Additionally, corresponds to the actual value observed at time t. Moving on to Equation (12), denotes the estimated level of the time series at time t. The smoothing constant for the data is represented as α, whereas b signifies the smoothing constant for the trend estimate. Furthermore, signifies the estimate of the slope of the series at time t, and m denotes the number of periods to be forecasted into the future. In an earlier section, Figure 2 visually illustrated the foundational components of the proposed systems. These constituent elements are subsequently elucidated and succinctly summarized in Table 4. Notably, each of these building blocks, as presented within this section, has been implemented in accordance with the procedures outlined in Algorithm 1.
As seen from Algorithm 1, at the beginning the language is detected. For all non-English Tweets, translation is performed. As sentiment analysis can only be formed on English language text, all non-English Tweets are required to be translated. Then, sentiment analysis is performed (on the Tweets translated into English). Next, if the Tweet includes a country name, then all of them are required to be grouped under different country names (to allow a country-wise comparison). Finally, for each country, anomaly detection, term frequency/stemming, N-gram, and topic analysis is performed to support the critical analysis with interactive visualizations.
4. Results
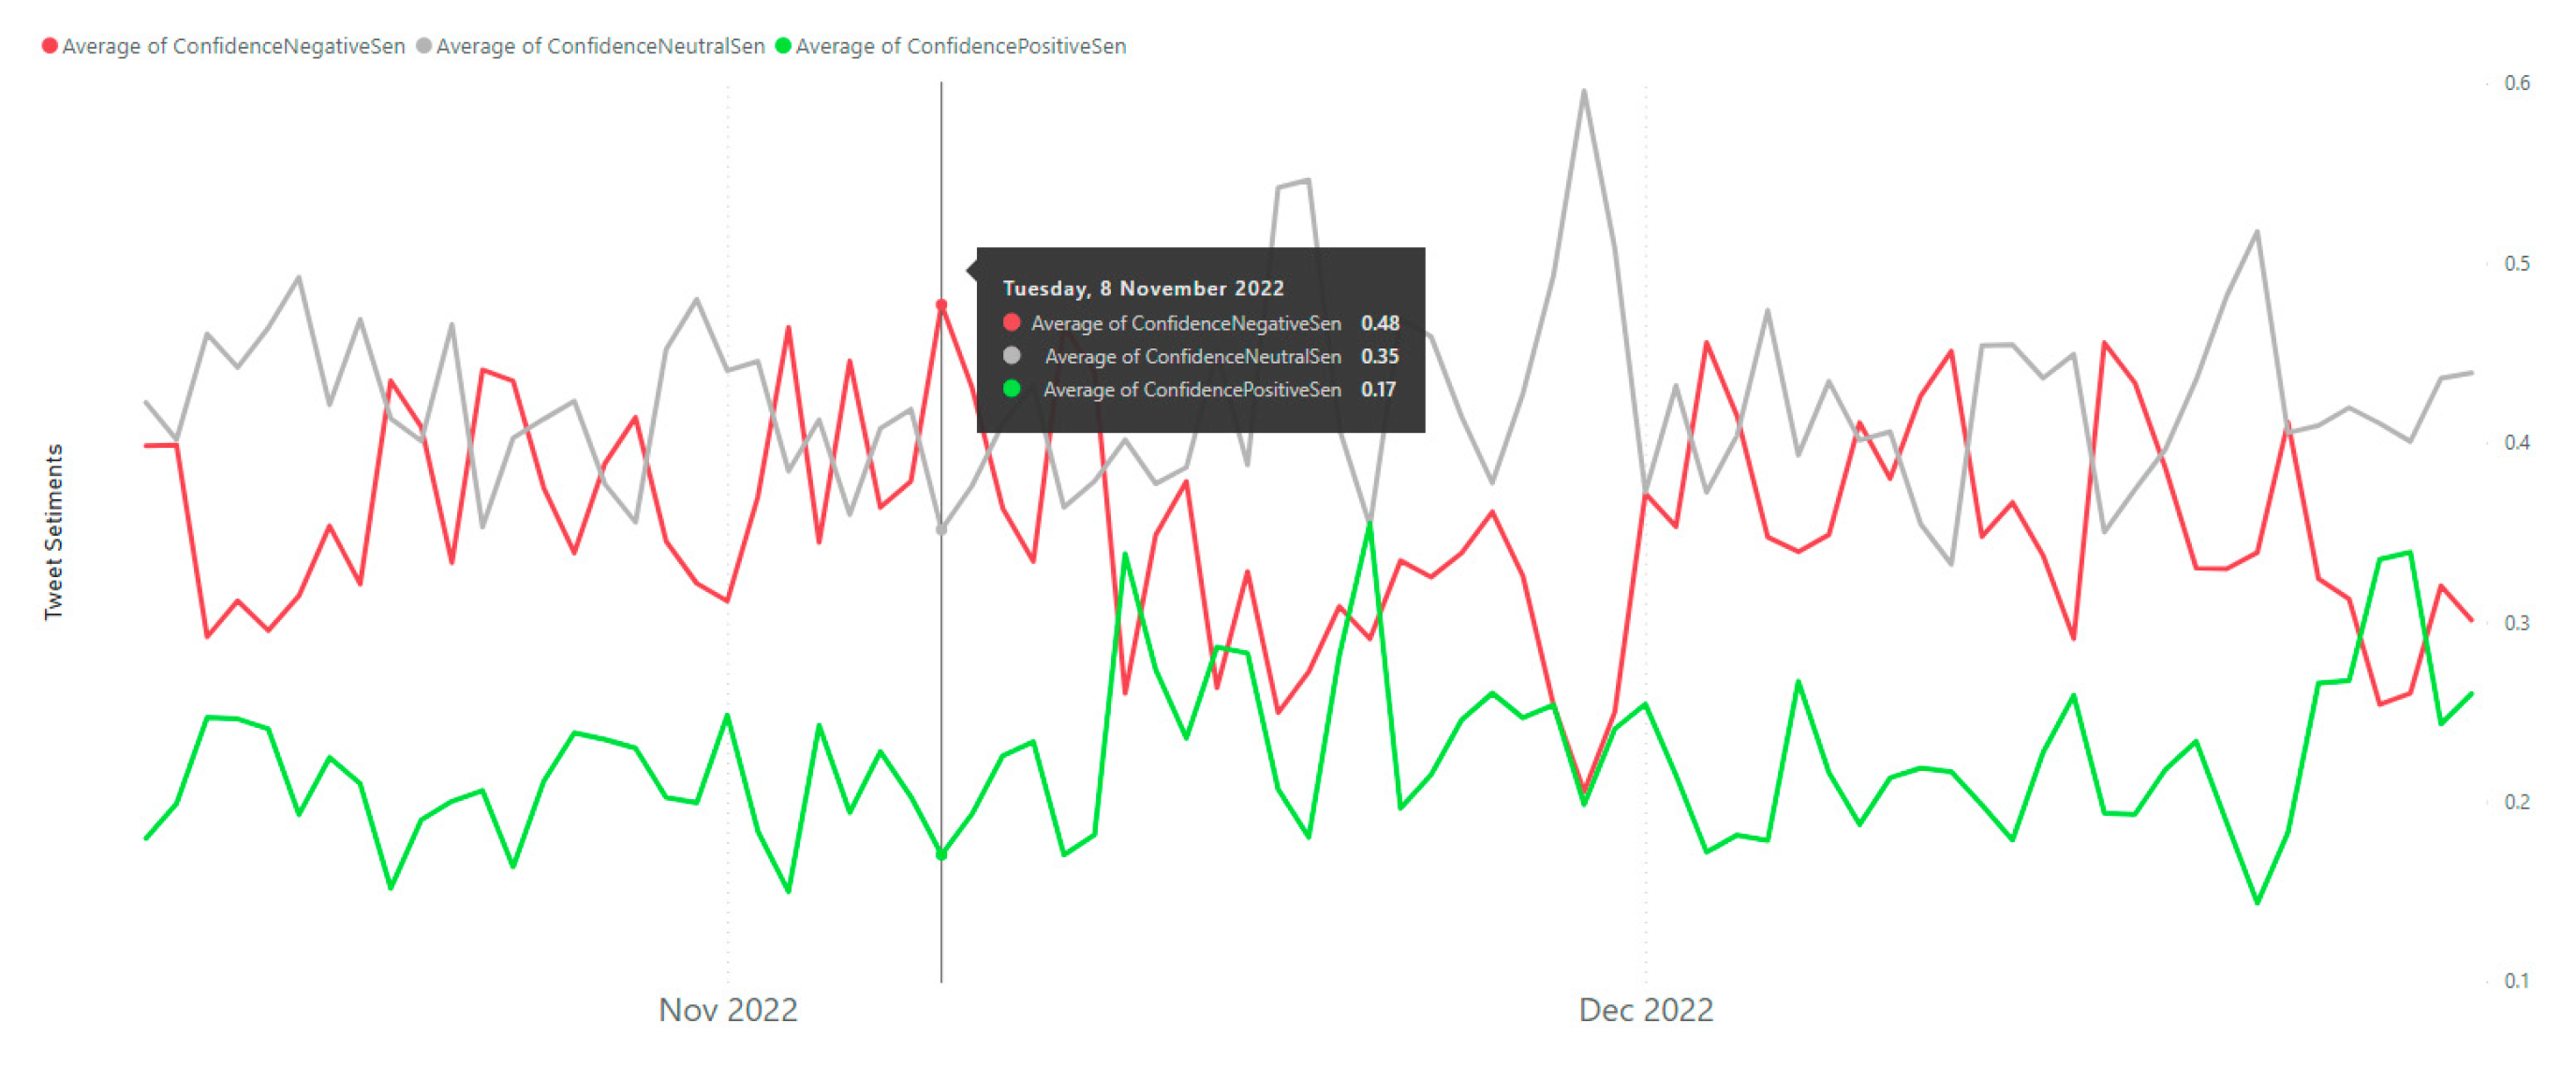
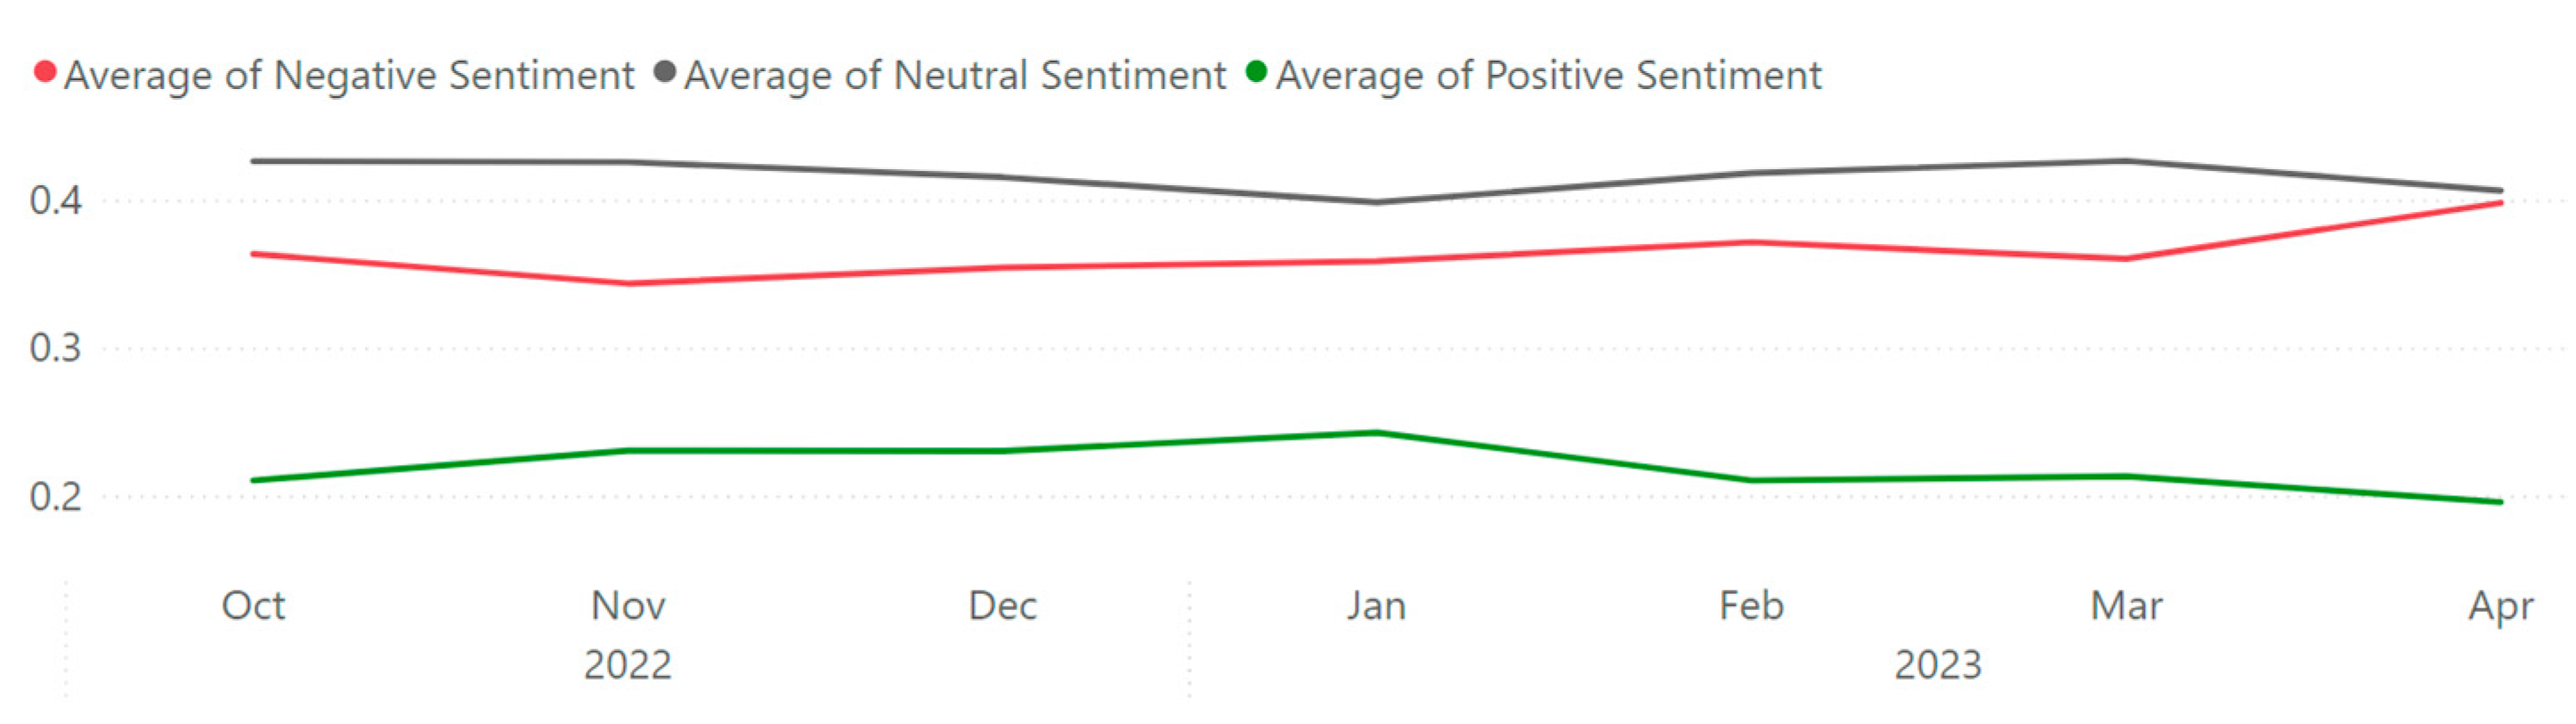
After implementing the proposed method using Algorithm 1, we evaluated the system from 13 October 2022 to 6 April, 2023, with 37,386 Tweets from 30,706 users. During this period, Tweets in 54 languages were captured, processed, and analyzed. In total, 8199 http requests were made to translate non-English Tweets. Table 5 provides information on Twitter data over a period of 7 months, from October 2022 to April 2023. Within Table 5, the column “Time” provides the time frame of the data collected. Then, “No. of Twitters” shows the number of Tweets posted during that period. “No. of Users” shows the number of unique users who posted Tweets. “No. of Locations” depicts the number of unique locations mentioned in the Tweets. “No. of Languages” shows the number of unique languages used in the Tweets. Next, “Total Retweets” displays the number of times the Tweets were retweeted. “Avg. Confidence of -Ve Seti.”, “Avg. Confidence of Neut. Seti.”, and “Avg. Confidence of +Ve Seti.” demonstrate the average confidence scores of negative, neutral, and positive sentiment analyses of the Tweets, respectively (on a scale of 0 to 1). Finally, “No. of Translations” provides the number of Tweets that were translated. Overall, Table 5 demonstrates that between October 2022 and April 2023, the quantity of Tweets, distinct individuals, and distinct locations gradually rose. However, despite a minor increase over the previous month, the number of languages used remained stable. Each month saw a different variation in the overall number of retweets, with November 2022 seeing the greatest total. Over the course of the seven months, the average confidence scores for neutral, positive, and negative sentiment analyses remained stable, with negative sentiment having higher confidence levels than neutral and positive sentiment. It is also important to note that just a small portion of Tweets were translated, with December 2022 seeing the largest percentage. While Figure 4 shows the average daily sentiment scores, Figure 5 represents the scores at a monthly average scale. Unlike Figure 4 and Figure 5, Figure 6 only shows the negative sentiment score. Cyber-related posts with negative sentiments are considered to be alerts [17,46]. As seen from Figure 6, on average, the negative sentiment associated with Chinese cyber threats are higher than that of Australia. This indicates that Australia suffers lower levels of cyber alerts compared to China.
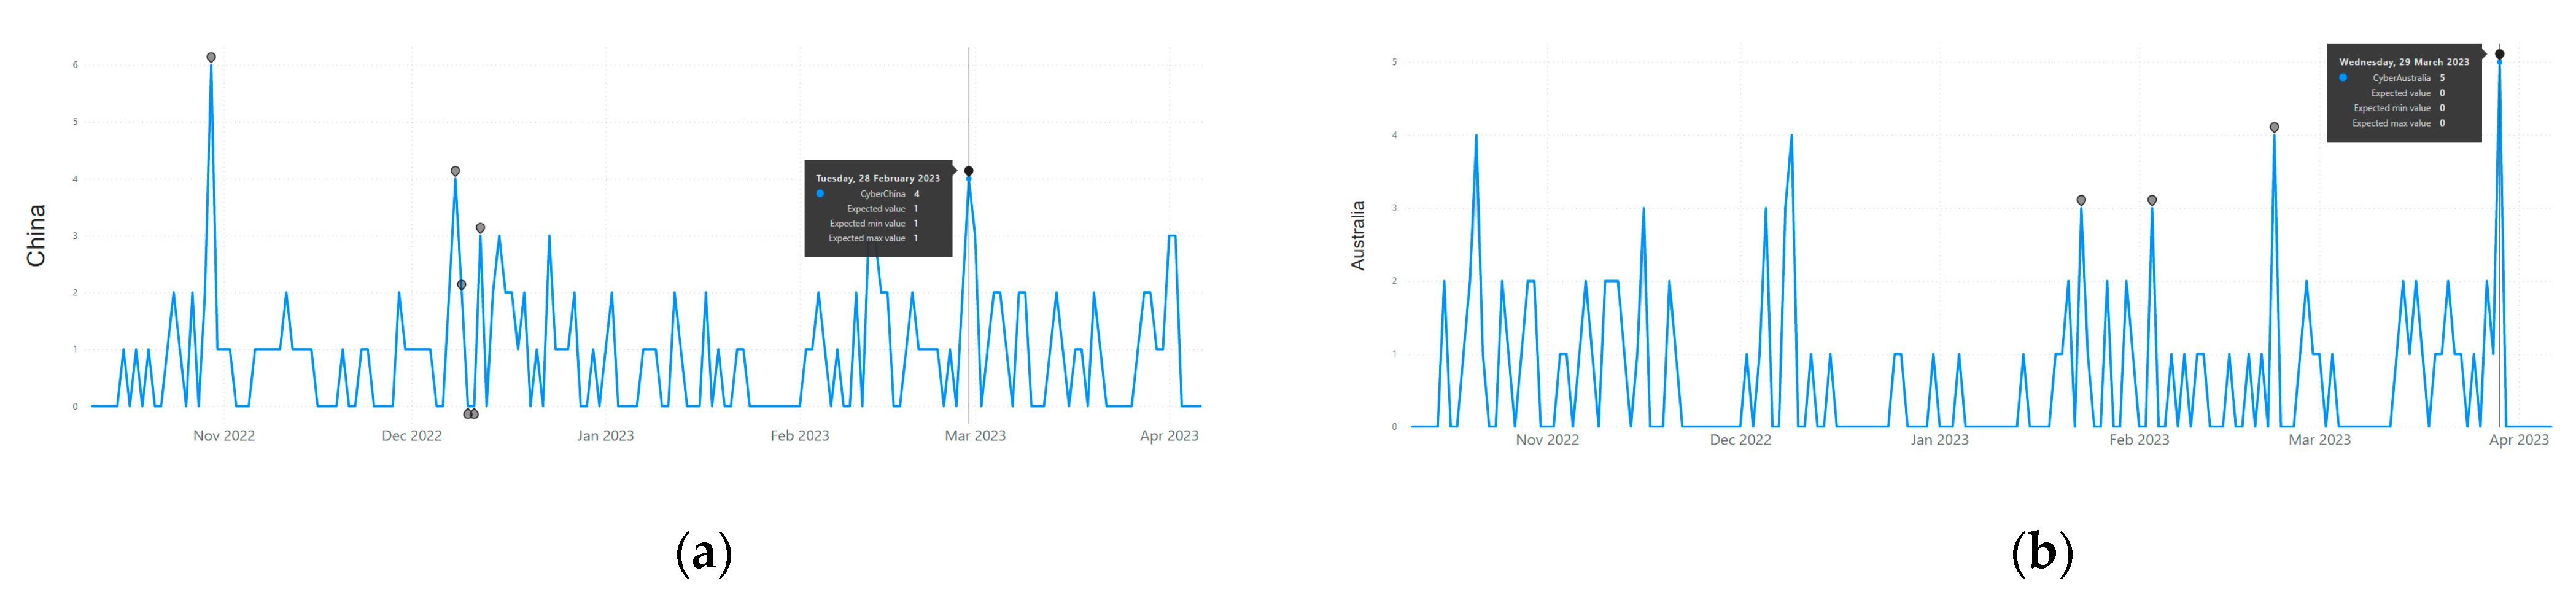
To comprehend the type of cyber threat suffered by China and Australia, the open-source cyber-attack data presented in [16,18] was utilized. The research work in [16,18] utilized daily cyber-attack statistics from Kaspersky. Kaspersky’s Securelist site in [43] shows how many cyber-attacks occurred for every single country on a daily basis from eight different types of cyber threats. These types of cyber threat range from spam, web-threats, ransomwares, malwares, network attacks, exploit, and many others. Anti-virus companies like Kaspersky and others ([51,52,53,54,55]) collect these statistics as computers around the globe run virus scans. The research work presented in this study automatically aggregated these cyber threat statistics (i.e., 238,220 records) and applied AI-driven algorithms to generate country-wise threat reports and threat levels (i.e., a greater number of attack statistics results in a higher level of threat). As shown in Figure 7a, China was found to be the second most threated country in the world during the monitored period (i.e., 13 October 2022 to 6 April, 2023) with respect to spam. China also faced higher number of networks attacked (i.e., third most threatened country in the world by network attack). On the other hand, as shown in Figure 7b, Australia suffers fewer cyber-attacks. The type of cyber threat that dominates Australia’s cyber-attacks were found to be exploit (as Australia is ranked 11th most threatened country in terms of exploit attacks). Figure 8 shows the result of CNN-based anomaly detection. It should be mentioned that the application of CNN as shown in Figure 8 was implemented with Microsoft Power BI’s line chart visual. With this implementation, anomalies are detected instantly without separately going through training phases, as demonstrated in [56]. Once the time-series data are added to Power BI’s chart visual and anomaly detection is configured (with the steps shown in [56]), all the anomalies are immediately highlighted (i.e., without the process of training CNN). The most recent anomalies detected for China and Australia were on the 28 February 2023 and 29 March 2023, respectively (as highlighted in Figure 8a,b).
Figure 9 shows the results of cyber threat prediction using the exponential smoothing algorithm presented in the previous section. As seen from Figure 9, China suffers a higher scale of threat compared to Australia. The results for topic analysis with LDA for China are summarized in Table 6. Table 7, on the other hand, represents the result of the topic analysis for Australia.
China Topic 1: The word “cyber” appears most frequently in this topic, which appears to center on cyber-attacks involving China. The terms “China” and “attacks” together imply that the subject is about cyber-attacks coming from China. The comparison of cyber threats from different nations may be implied by the reference to Russia and the United States.
China Topic 2: The word “China” appears most frequently in this topic, which seems to be about cyber-hacks related to China. The fact that “TikTok” is present suggests that the subject may be related to the possible security hazards of Chinese-owned apps.
China Topic 3: The phrases “China”, “country”, and “national” are most frequently used in this topic, which may be related to China’s national cybersecurity. The term “IMMEDIATELY” makes it possible that the subject may be a request for quick action to strengthen China’s cybersecurity.
China Topic 4: The phrases “Russia”, “China”, and “reports” are the most frequently used in this topic, which seems to be about cyber reports involving China and Russia. The word “North” could be alluding to North Korea’s online operations.
China Topic 5: The words “China”, “hack”, “chains”, and “supply” are most frequently used in this topic, which is about cyber-attacks on the Chinese supply chain. The word “etc.” indicates that the subject may cover other connected problems.
China Topic 6: The phrases “China,” “cyber,” and “war” have the highest frequencies in this topic, which seems to be about a prospective cyber conflict involving China. The word “Russia” could be a hint to a cyberwar alliance or conflict between China and Russia.
China Topic 7: The words “China”, “Chinese”, “sophisticated”, “databases”, and “Tech” are most frequently used in this topic, which is about China’s advanced cyber capabilities. This subject may be connected to China’s research and development of innovative technologies like 5G and AI, which may have effects on cybersecurity.
Australia Topic 1: Words like “scamming” and “Yahoo” suggest potential email scams or phishing efforts, and it appears that this issue is related to internet scams and fraud that target Australians. It is uncertain whether the word “Boys” refers to a specific occurrence or group.
Australia Topic 2: The terms “Medibank” and “health” may refer to a specific incident in the healthcare sector. This topic is about cyber assaults and breaches of Australian companies. The word “million” implies a significant attack or data leak.
Australia Topic 3: Words like “way” and “fundamental” suggest a potential discussion of best practices and policies. This topic is discussing the fundamentals of cybersecurity in Australia.
Australia Topic 4: This topic is a little obscure because “POTUS” (President of the United States) and “Instagram” are the only words that are mentioned specifically. It is probable that this subject has to do with the cybersecurity effects of social media use or potential dangers to well-known people.
Australia Topic 5: The word “attack” in this topic’s title suggests a potential discussion of the strategies employed by cybercriminals. This issue relates to data breaches and cyber assaults in Australia. The word “data” implies an emphasis on the privacy and protection of data.
Australia Topic 6: The phrase “Leaks” may be a reference to recent data breaches or leaks. This subject is discussing current cybersecurity incidents in Australia. The word “amp” implies that this subject may be associated with Twitter or other social media.
Australia Topic 7: The terms “Police” and “Australian” indicate a focus on how law enforcement organizations are combating cybercrime in the nation. This issue relates to law enforcement and cybercrime in Australia. It is unclear why the word “love” was used, and it might not even be relevant to the subject.
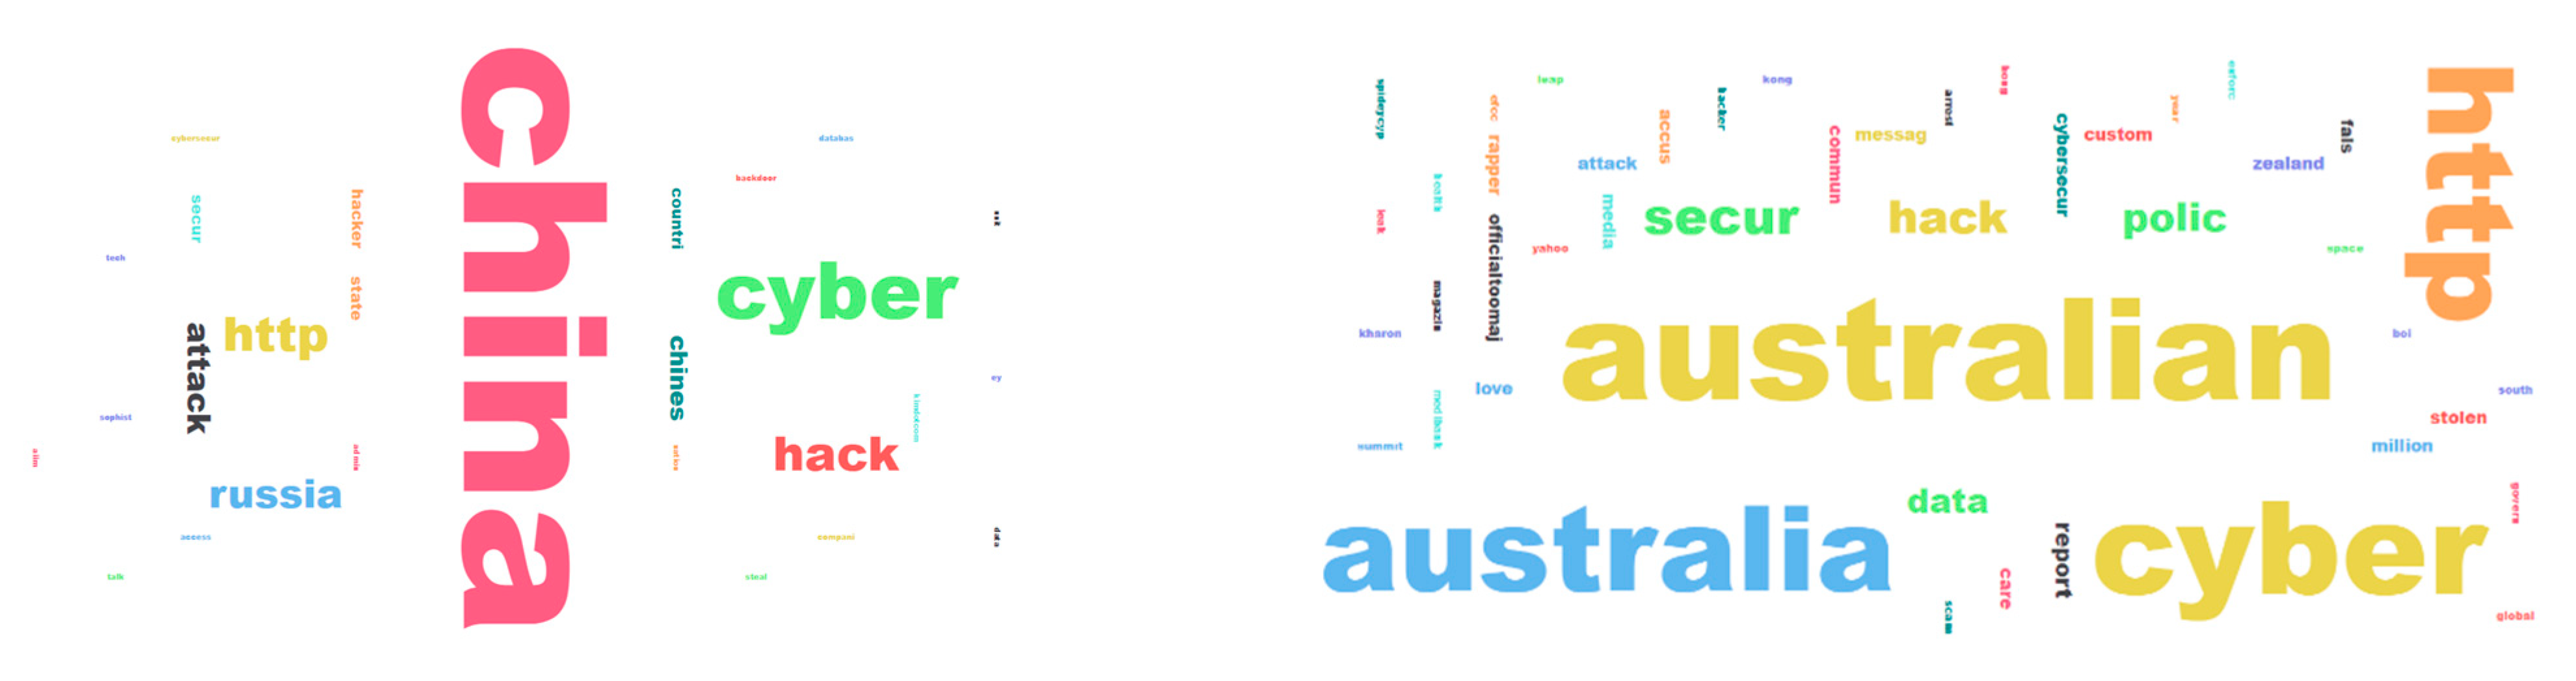
Finally, Figure 10 and Figure 11 show the results of the term frequencies based on TF-IDF and N-grams. The results depicted within this section would be used to generate seven-dimensional cyber threat intelligence for both China and Australia. The next section (i.e., Discussion) presents the difference between China’s and Australia’s cyber threats in each of the seven dimensions.
5. Discussion
5.1. Analysis of the Differences in Cyber-Related Concerns
In general, the subject, vocabulary, and nation-specifics included in the posts varied significantly between Australia and China, according to the topic analysis of cyber-related social media posts. With various articles focusing on Australian-specific incidents or worries, such as scams targeting Australians and the Australian health system, there is a heavy emphasis on cyber-attacks and cybersecurity for Australia. Other subjects touch on more general cybersecurity issues, including data leaks and breaches. The Australian police and their efforts to prevent cybercrime are another noteworthy subject.
The topic analysis of Chinese cyber-related social media posts, however, reveals a higher concentration on espionage and national security, with several topics focusing on purported cyber-attacks against China or China’s efforts to improve its own cybersecurity. There are various subjects pertaining to Chinese tech firms and their function in cybersecurity. Based on the results presented in the previous section, there are major differences in cyber threats by topic, regional focus, terminology, and industry focus.
Difference in Topics: Social media posts on cyberspace in Australia and China have diverse topic concentrations. In Australia, the emphasis is on cybersecurity threats and assaults, and issues like malware, phishing, and ransomware are routinely brought up in conversation. Chinese social media posts, on the other hand, tend to be more geopolitical in nature, discussing cyberespionage and intrusions by foreign countries, particularly the United States.
Difference in Regional Focus: The mentions of each nation differ between the two. Australia is more focused on Chinese actors and their cyber activities. On the other hand, China is more concerned with the US and Russia.
Difference in Terminology: The language employed in social media posts on cyberspace varies between the two nations as well. In Australia, the terminology is highly technical and includes references to particular malware and security procedures. In contrast, social media posts from China frequently utilize more generic phrases like “cyber”, “hack”, and “databases”.
Industry Focus: The concentration on particular industries in cyber-related social media posts is another distinction. Attacks against vital infrastructure, including hospitals and electricity networks, are a concern in Australia. The tech sector is given increased attention in China, where supply chain attacks and Chinese tech firms are mentioned. These differences are detailed in Table 8 and summarized in Figure 12.
5.2. Implementation of Multi-Dimensional Cyber-Intelligence in Mobile Phones
The proliferation of mobile phones has transformed the landscape of cyber-attack intelligence gathering, juxtaposing their benefits with those of desktop and laptop computers [16,17,45]. By drawing upon scholarly research and empirical evidence from [16,17], this section sheds light on the distinct advantages afforded by mobile phones and their implications for cyber intelligence gathering, like their ubiquitous presence, portability, real-time generation, and enhanced accessibility.
Ubiquitous Presence: Mobile phones have achieved widespread adoption, becoming integral components of everyday life across diverse demographics. Their ubiquity ensures pervasive access to digital activities, making them an invaluable source of cyber intelligence. In contrast, desktop and laptop computers are constrained by their stationary nature, limiting their scope and timeliness of data collection.
Portability: The portability of mobile phones enables users to carry them at all times, facilitating continuous data generation. This mobility empowers cyber intelligence professionals to monitor digital activities, even in dynamic and transient environments. Desktop and laptop computers, being stationary devices, lack this flexibility and are often confined to specific locations.
Real-Time Data Generation: Mobile phones generate an immense volume of data in real-time due to their constant connectivity to the internet. This real-time data flow allows for the immediate monitoring and analysis of digital activities, providing a comprehensive and up-to-date understanding of evolving cyber threats. In contrast, desktop and laptop computers may have intermittent internet connectivity, potentially impeding real-time intelligence gathering.
Social Media Integration: Mobile phones are extensively utilized for social media interactions, affording access to a rich source of information. The integration of social media platforms into mobile applications enables the collection and analysis of user-generated content, facilitating the identification of cyber threats, extremist ideologies, and malicious activities. Desktop and laptop computers, while also capable of accessing social media platforms, lack the pervasive presence and portability offered by mobile phones.
Enhanced Accessibility: The widespread adoption of mobile phones transcends geographical, socio-economic, and demographic boundaries, ensuring accessibility to a broad user base. This inclusive accessibility amplifies the potential for gathering cyber intelligence, encompassing diverse populations, and enabling a more comprehensive understanding of cyber threats. Desktop and laptop computers, though prevalent, may exhibit variances in adoption rates and accessibility among different demographic groups.
Mobile-phone-based solutions play a pivotal role in gathering cyber-attack intelligence due to their ubiquitous presence, portability, real-time data generation, social media integration, and enhanced accessibility. These advantages, when compared to desktop and laptop computers, provide unique opportunities for monitoring and analyzing digital activities. Leveraging mobile phones as primary sources of cyber intelligence significantly enhances threat detection, incident response, and overall cybersecurity preparedness. Hence, the proposed approach was implemented in desktop, tablet, and mobile solutions, as demonstrated in Figure 13, Figure 14 and Figure 15.
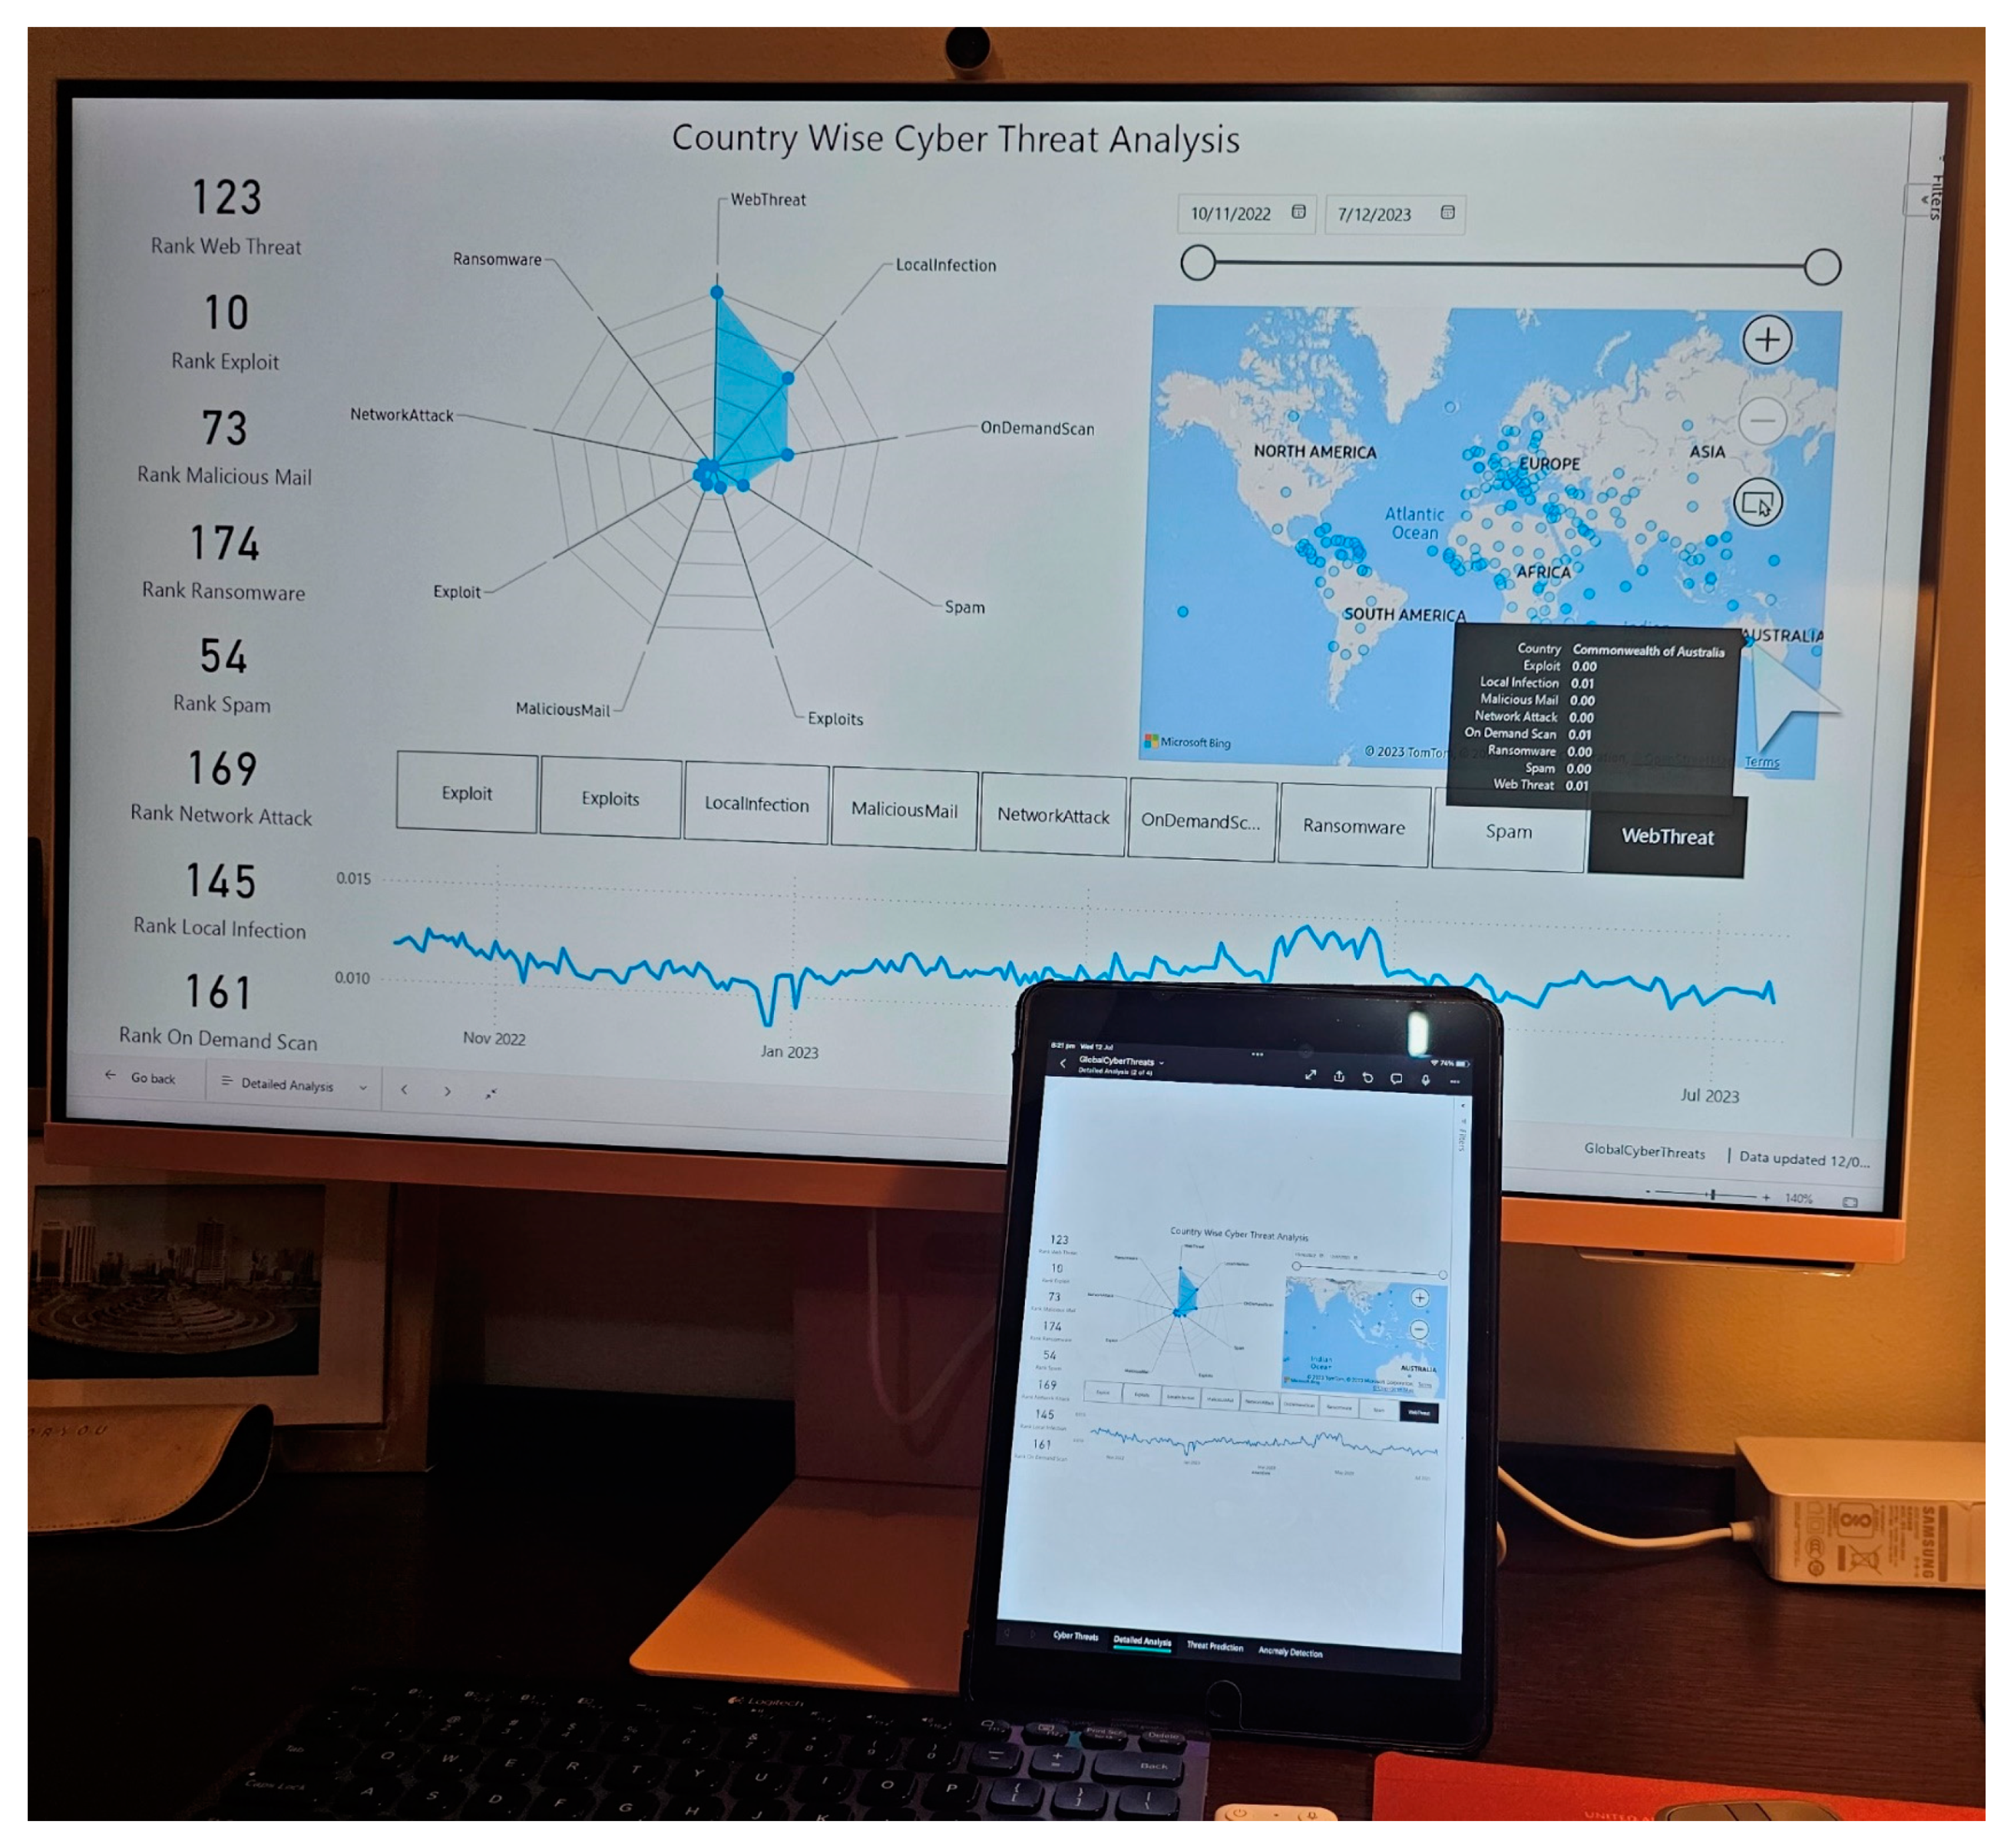
Figure 13 shows the multi-dimensional cyber threat intelligence framework running on a Samsung Smart Monitor M8 in a desktop environment. The same solution was deployed on an iPad running iOS version 16 as a deployed mobile app (as shown in Figure 13 and Figure 14). Figure 14 particularly demonstrates the applicability of threat-prediction using exponential smoothing (previously described in Section 3.6) for China in a mobile/tablet environment. Finally, Figure 15 shows the deployment of the proposed solution within the latest Samsung Galaxy s-23 Ultra phone (as a deployed mobile app). As seen from Figure 15, China was found to be world’s 31st most threatened (in terms of cyber-attack) country in the word during the time it was monitored. It should be mentioned that the cyber threat ranking is dynamic in nature and changes from time to time. This mobile deployment followed the implementation guidance from the recent research works in [16,17].
Since topic analysis was core to this study, the performance of the LDA was measured with six different metrics, namely LogLikelihood, Perplexity, AlphaSum, Beta, and BetaSum. For China, these values were −15,617.27, 517.155, 0.091, 0.285, and 378.828. For Australia, these metrics were evaluated as −9514.318, 322.952, 0.058, 0.26, and 226.947. Overall, the distinctions between the posts’ cyber-related subjects imply that Australia and China have different priorities and cybersecurity concerns. While China is more concerned with enhancing its own skills to defend against cyber-attacks and secure its technological infrastructure, Australia is more focused on responding to individual instances of cybercrime. The discrepancies imply that cybersecurity is a problem for both nations, but the precise worries and priorities can vary depending on the distinct geopolitical and economic circumstances of each nation.
6. Conclusions
Within this paper, firstly, a seven-dimensional cyber intelligence framework is presented. Secondly, a new methodology on a social-media-driven cyber intelligence solution is presented. Next, using the presented methodology, 37,386 cyber-related Tweets from 13 October 2022 to 6 April, 2023, were used to generate seven-dimensional cyber threat intelligence for both China and Australia. Lastly, the proposed model was deployed in mobile and tablet environments, harnessing their practical competitive advantages, like their ubiquitous presence, portability, real-time generation, and enhanced accessibility. It should be highlighted that this paper reported a technique for generating cyber intelligence specifically from intelligently mining social media users’ opinion. The outcome of the cyber intelligence produced by this approach provides the aggregated mentality of social media users. While the overall perception of social media users might be a critical dimension for a cyber-strategist, the actual attack dynamics might be different.
Unlike the studies in [32,33,34], the aim of this study was not to promote a personal political discourse on a certain nation or country. Rather, this study was designed to represent an AI-driven aggregated and generalized view of social media users (particularly Twitter users) and open-source cyber-attack statistics (particularly Kaspersky’s Cyber Statistics [43]). The aggregated Tweets as well as AI- and NLP-driven results have been made publicly accessible in [57] for the sake of research reproducibility. In addition, the results of global cyber-attack statistics, aggregated and analyzed by CNN within this study, have been made publicly available at [58]. Both [57,58] reinstate the fact that the outcome of the study is the result of open-source intelligence (and not the personal view of the author).
Within the confines of this present investigation, a dichotomy of divergent modes of open intelligence sources was employed—specifically, the utilization of social media posts extracted from Twitter and the daily records of cyber-attack occurrences documented by Kaspersky. It is noteworthy that the limitations inherent to this study are intrinsically intertwined with the very origins of these two sources. Initially, with regard to the Twitter-derived data, it is imperative to acknowledge the presence of a myriad of fake accounts [59] permeating the Twitter landscape. Furthermore, Twitter has been recognized as a breeding ground for disinformation and deceptive content dissemination [60]. In this particular study, a foundational premise was established, postulating the validity of all 37,386 cyber-related Tweets under examination. Consequently, an inherent limitation materializes in the form of an absence of rigorous validation protocols applied to the open-source data derived from the Twitter feed.
Secondarily, the utilization of cyber-attack statistics gleaned from Kaspersky invites an array of limitations into the discourse. It is incumbent upon us to recognize that the global landscape of computing devices does not universally adopt Kaspersky as the preeminent choice for anti-virus protection. Therefore, the cyber statistics furnished by Kaspersky may be imbued with a bias that precludes a holistic representation of worldwide cyber-attack trends. In pursuit of a more comprehensive panorama of cyber-attack statistics, it is imperative that we embrace the aggregation of diverse open intelligence platforms. Such platforms encompass, among others, Checkpoint’s Threat Map [51], Fortinet’s Threat Map [52], Netcout’s Cyber-Attack Map [53], Radware’s Live Threat Map [54], and Bitdefender’s Real-Time Cyberthreat Map [55]. The concatenation of these platforms is imperative for future endeavors seeking to engender a more comprehensive and authenticated tapestry of cyber-attack statistics. Consequently, a strategic trajectory for future investigations involves the implementation of algorithms designed to discern and neutralize the influence of counterfeit users and spurious information within these data sources.
In this continuing trajectory, our aspiration is to not only augment the analytic sophistication of this study but also to enrich the repository of open intelligence sources that underpin our comprehension of real-time cyber-attack statistics. By fortifying our methodological arsenal, we aspire to engender a more validated and exhaustive realm of cyber intelligence.
Funding
This research received no external funding.
Data Availability Statement
Data will be made available upon request.
Acknowledgments
The author would like to thank COEUS Institute, Maine, US, where the author works as the Chief Technology Officer.
Conflicts of Interest
The author declares no conflict of interest.
References
- Cremer, F.; Sheehan, B.; Fortmann, M.; Kia, A.N.; Mullins, M.; Murphy, F.; Materne, S. Cyber risk and cybersecurity: A systematic review of data availability. Geneva Pap. Risk Insur. Issues Pract. 2022, 47, 698–736. [Google Scholar] [CrossRef]
- Cybercrime Magazine. Cybercrime to Cost the World $10.5 Trillion Annually by 2025. 13 November 2020. Available online: https://cybersecurityventures.com/hackerpocalypse-cybercrime-report-2016/ (accessed on 15 October 2022).
- Statista Research Department. Consumer Loss through Cyber Crime Worldwide in 2017, by Victim Country. 7 July 2022. Available online: https://www.statista.com/statistics/799875/countries-with-the-largest-losses-through-cybercrime/ (accessed on 26 October 2022).
- Bada, M.; Nurse, J.R. Chapter 4—The Social and Psychological Impact of Cyberattacks. In Emerging Cyber Threats and Cognitive Vulnerabilities; Benson, V., Mcalaney, J., Eds.; Academic Press: Cambridge, MA, USA, 2020; pp. 73–92. [Google Scholar]
- BBC. News: Optus: How a Massive Data Breach Has Exposed Australia. 29 September 2022. Available online: https://www.bbc.com/news/world-australia-63056838 (accessed on 16 October 2022).
- Australian Securities & Investments Commissions. Guidance for Consumers Impacted by the Optus Data Breach. October 2022. Available online: https://asic.gov.au/about-asic/news-centre/news-items/guidance-for-consumers-impacted-by-the-optus-data-breach/ (accessed on 19 October 2022).
- Merritt, K.; OPTUS Confirms 2.1 Million Customers Affected by Cyberattack. Total Telecom, 3 October 2022. Available online: https://totaltele.com/optus-confirms-2-1-million-customers-affected-by-cyberattack/ (accessed on 23 October 2022).
- Kaye, B. Australia’s No. 1 Health Insurer Says Hacker Stole Patient Details, Reuters. 20 October 2022. Available online: https://www.reuters.com/technology/after-telco-hack-australia-faces-wave-data-breaches-2022-10-20/ (accessed on 25 October 2022).
- Zibak, A.; Simpson, A. Cyber Threat Information Sharing: Perceived Benefits and Barriers. In Proceedings of the ARES’19: Proceedings of the 14th International Conference on Availability, Reliability and Security, Canterbury, UK, 26–29 August 2019. [Google Scholar]
- Xu, S.; Qian, Y.; Hu, R.Q. Data-Driven Network Intelligence for Anomaly Detection. IEEE Netw. 2019, 33, 88–95. [Google Scholar] [CrossRef]
- Keshk, M.; Sitnikova, E.; Moustafa, N.; Hu, J.; Khalil, I. An Integrated Framework for Privacy-Preserving Based Anomaly Detection for Cyber-Physical Systems. IEEE Trans. Sustain. Comput. 2021, 6, 66–79. [Google Scholar] [CrossRef]
- Ten, C.-W.; Hong, J.; Liu, C.-C. Anomaly Detection for Cybersecurity of the Substations. IEEE Trans. Smart Grid 2011, 2, 865–873. [Google Scholar] [CrossRef]
- Yang, J.; Zhou, C.; Yang, S.; Xu, H. Anomaly Detection Based on Zone Partition for Security Protection of Industrial Cyber-Physical Systems. IEEE Trans. Ind. Electron. 2018, 65, 4257–4267. [Google Scholar] [CrossRef]
- Shi, D.; Guo, Z.; Johansson, K.H.; Shi, L. Causality Countermeasures for Anomaly Detection in Cyber-Physical Systems. IEEE Trans. Autom. Control 2017, 63, 386–401. [Google Scholar] [CrossRef]
- Khan, N.F.; Ikram, N.; Saleem, S.; Zafar, S. Cyber-security and risky behaviors in a developing country context: A Pakistani perspective. Secur. J. 2022, 36, 1–33. Available online: https://link.springer.com/content/pdf/10.1057/s41284-022-00343-4.pdf (accessed on 22 January 2023). [CrossRef]
- Sufi, F. Algorithms in Low-Code-No-Code for Research Applications: A Practical Review. Algorithms 2023, 16, 108. [Google Scholar] [CrossRef]
- Sufi, F. A New Social Media-Driven Cyber Threat Intelligence. Electronics 2023, 12, 1242. [Google Scholar] [CrossRef]
- Sufi, F. A New AI-Based Semantic Cyber Intelligence Agent. Future Internet 2023, 15, 231. [Google Scholar] [CrossRef]
- Pattnaik, N.; Li, S.; Nurse, J.R. Perspectives of non-expert users on cyber security and privacy: An analysis of online discussions on twitter. Comput. Secur. 2023, 125, 103008. [Google Scholar] [CrossRef]
- Geetha, R.; Karthika, S. Sensitive Keyword Extraction Based on Cyber Keywords and LDA in Twitter to Avoid Regrets. In Computational Intelligence in Data Science. ICCIDS 2020. IFIP Advances in Information and Communication Technology; Springer: Berlin/Heidelberg, Germany, 2020; Volume 578. [Google Scholar]
- Hernandez-Suarez, A.; Sanchez-Perez, G.; Toscano-Medina, K.; Martinez-Hernandez, V.; Perez-Meana, H.; Olivares-Mercado, J.; Sanchez, V. Social Sentiment Sensor in Twitter for Predicting Cyber-Attacks Using ℓ1 Regularization. Sensors 2018, 18, 1380. [Google Scholar] [CrossRef] [PubMed]
- Shah, R.; Aparajit, S.; Chopdekar, R.; Patil, R. Machine Learning based Approach for Detection of Cyberbullying Tweets. Int. J. Comput. Appl. 2020, 175, 51–56. [Google Scholar] [CrossRef]
- Rawat, R.; Mahor, V.; Chirgaiya, S.; Nath Shaw, R.; Ghosh, A. Analysis of Darknet Traffic for Criminal Activities Detection Using TF-IDF and Light Gradient Boosted Machine Learning Algorithm. In Lecture Notes in Electrical Engineering Book Series; Springer: Berlin/Heidelberg, Germany, 2021; Volume 756. [Google Scholar]
- Lanier, H.D.; Diaz, M.I.; Saleh, S.N.; Lehmann, C.U.; Medford, R.J. Analyzing COVID-19 disinformation on Twitter using the hashtags #scamdemic and #plandemic: Retrospective study. PLoS ONE 2022, 17, e0268409. [Google Scholar]
- Correia, V.J. An Explorative Study into the Importance of Defining and Classifying Cyber Terrorism in the United Kingdom. SN Comput. Sci. 2021, 3, 84. [Google Scholar] [CrossRef]
- Li, Y.; Liu, Q. A comprehensive review study of cyber-attacks and cyber security; Emerging trends and recent developments. Energy Rep. 2021, 7, 8176–8186. [Google Scholar] [CrossRef]
- Agrafiotis, I.; Nurse, J.R.C.; Goldsmith, M.; Creese, S.; Upton, D. A taxonomy of cyber-harms: Defining the impacts of cyber-attacks and understanding how they propagate. J. Cybersecur. 2018, 4, tyy006. [Google Scholar] [CrossRef]
- Alkhalil, Z.; Hewage, C.; Nawaf, L.; Khan, I. Phishing Attacks: A Recent Comprehensive Study and a New Anatomy. Front. Comput. Sci. 2021, 3, 563060. [Google Scholar] [CrossRef]
- Hagen, R.A. Unraveling the Complexity of Cyber Security Threats: A Multidimensional Approach. 15 April 2023. Available online: https://www.linkedin.com/pulse/unraveling-complexity-cyber-security-threats-approach-hagen/ (accessed on 25 April 2023).
- Humayun, M.; Niazi, M.; Jhanjhi, N.; Alshayeb, M.; Mahmood, S. Cyber Security Threats and Vulnerabilities: A Systematic Mapping Study. Arab. J. Sci. Eng. 2020, 45, 3171–3189. [Google Scholar] [CrossRef]
- Bhaskar, R. Better Cybersecurity Awareness through Research. 2022. Available online: https://www.isaca.org/resources/isaca-journal/issues/2022/volume-3/better-cybersecurity-awareness-through-research (accessed on 1 April 2023).
- Xu, M.; Lu, C. China–U.S. cyber-crisis management. China Int. Strategy Rev. 2021, 3, 97–114. [Google Scholar] [CrossRef]
- Lai, R.; Rahman, S. Analytics of China Cyberattack. Int. J. Multimed. Its Appl. (IJMA) 2012, 4, 37–56. [Google Scholar] [CrossRef]
- Yuen, S. Becoming a Cyber Power: China’s cybersecurity upgrade and its consequences. China Perspect. 2015, 2, 53–58. [Google Scholar] [CrossRef]
- Deng, L.; Xie, P.; Chen, Y.; Rui, S.; Yang, C.; Deng, B.; Wang, M.; Armstrong, D.; Ma, Y.; Deng, W. Impact of acute hyperglycemic crisis episode on survival in individuals with diabetic foot ulcer using a machine learning approach. Front. Endocrinol. 2022, 13, 974063. [Google Scholar] [CrossRef]
- Huayue, C.; Tingting, W.; Tao, C.; Wu, D. Hyperspectral Image Classification Based on Fusing S3-PCA, 2D-SSA and Random Patch Network. Remote Sens. 2023, 15, 3402. [Google Scholar]
- Li, M.; Zhang, J.; Song, J.; Li, Z.; Lu, S. A Clinical-Oriented Non-Severe Depression Diagnosis Method Based on Cognitive Behavior of Emotional Conflict. IEEE Trans. Comput. Soc. Syst. 2023, 10, 131–141. [Google Scholar] [CrossRef]
- Kurni, M.; Mrunalini, M.; Saritha, K. Deep Learning Techniques for Social Media Analytic. In Principles of Social Networking. Smart Innovation, Systems and Technologies; Biswas, A., Patgiri, R., Biswas, B., Eds.; Springer: Singapore, 2022. [Google Scholar]
- Alsayat, A. Improving Sentiment Analysis for Social Media Applications Using an Ensemble Deep Learning Language Model. Arab. J. Sci. Eng. 2022, 47, 2499–2511. [Google Scholar] [CrossRef]
- Shahbazi, Z.; Byun, Y.-C. NLP-Based Digital Forensic Analysis for Online Social Network Based on System Security. Int. J. Environ. Res. Public Health 2022, 19, 7027. [Google Scholar] [CrossRef]
- Christian, H.; Suhartono, D.; Chowanda, A.; Zamli, K.Z. Text based personality prediction from multiple social media data sources using pre-trained language model and model averaging. J. Big Data 2021, 8, 68. [Google Scholar] [CrossRef]
- Alim, S. Analysis of Tweets Related to Cyberbullying: Exploring Information Diffusion and Advice Available for Cyberbullying Victims. Int. J. Cyber Behav. Psychol. Learn. 2015, 5, 31–52. [Google Scholar] [CrossRef]
- Kaspersky. Securelist. 2023. Available online: https://statistics.securelist.com/ (accessed on 9 August 2023).
- Microsoft Documentation. Choosing a Natural Language Processing Technology in Azure. 25 February 2020. Available online: https://docs.microsoft.com/en-us/azure/architecture/data-guide/technology-choices/natural-language-processing (accessed on 22 January 2023).
- Sufi, F.; Khalil, I. Automated Disaster Monitoring from Social Media Posts using AI based Location Intelligence and Sentiment Analysis. IEEE Trans. Comput. Soc. Syst. 2022, 1–11. [Google Scholar] [CrossRef]
- Sufi, F.K.; Alsulami, M. Automated Multidimensional Analysis of Global Events With Entity Detection, Sentiment Analysis and Anomaly Detection. IEEE Access 2021, 9, 152449–152460. [Google Scholar] [CrossRef]
- Sufi, F.K. Automatic identification and explanation of root causes on COVID-19 index anomalies. MethodsX 2023, 10, 101960. [Google Scholar] [CrossRef] [PubMed]
- Ren, H.; Xu, B.; Wang, Y.; Yi, C.; Huang, C.; Kou, X.; Xing, T.; Yang, M.; Tong, J.; Zhang, Q. Time-Series Anomaly Detection Service at Microsoft. In Proceedings of the KDD’19: Proceedings of the 25th ACM SIGKDD International Conference on Knowledge Discovery & Data Mining, New York, NY, USA, 4–8 August 2019. [Google Scholar]
- Zhao, R.; Ouyang, W.; Li, H.; Wang, X. Saliency detection by multi-context deep learning. In Proceedings of the IEEE Conference on Computer Vision and Pattern Recognition, Boston, MA, USA, 7–12 June 2015. [Google Scholar]
- Abas, M.N.; Jalil, S.Z.; Aris, S.A.M. Malware Attack Forecasting by Using Exponential Smoothing. In Lecture Notes in Electrical Engineering Book Series; Springer: Berlin/Heidelberg, Germany, 2022; Volume 842. [Google Scholar]
- Checkpoint. Live Cyber Threat Map. 2023. Available online: https://threatmap.checkpoint.com/ (accessed on 9 August 2023).
- Fortinet. Fortinet Fortiguard Threatmap. 2023. Available online: https://threatmap.fortiguard.com/ (accessed on 9 August 2023).
- Netscout. DDoS & Cyber-Attack Map. 2023. Available online: https://www.netscout.com/ddos-attack-map (accessed on 9 August 2023).
- Radware. Live Threat Map. 2023. Available online: https://livethreatmap.radware.com/ (accessed on 9 August 2023).
- Bitdefender. Cyberthreat Real-Time Map. 2023. Available online: https://threatmap.bitdefender.com/ (accessed on 9 August 2023).
- Microsoft Documentation, Anomaly Detection. 17 January 2023. Available online: https://learn.microsoft.com/en-us/power-bi/visuals/power-bi-visualization-anomaly-detection (accessed on 9 August 2023).
- Microsoft Power BI Report by F. Sufi. Global Cyber Threat with Attach Statistics and Social Media Analysis. 9 August 2023. Available online: https://app.powerbi.com/view?r=eyJrIjoiYWJjOGY5YTUtZDBlNy00MTg1LWFkMTMtM2RmYzYzODQ1NzE1IiwidCI6IjBkMWI4YmRlLWZmYzEtNGY1Yy05NjAwLTJhNzUzZGFjYmEwNSJ9&pageName=ReportSection (accessed on 9 August 2023).
- Microsoft Power BI Report by F. Sufi, Worldwide Cyber Threats. 9 August 2023. Available online: https://app.powerbi.com/view?r=eyJrIjoiMzRmNjU2YjItNDk2Zi00YWU3LThjYzctYmIyOGYwYzQ1OWExIiwidCI6IjBkMWI4YmRlLWZmYzEtNGY1Yy05NjAwLTJhNzUzZGFjYmEwNSJ9 (accessed on 9 August 2023).
- Gurajala, S.; White, J.S.; Hudson, B.; Voter, B.R.; Matthews, J.N. Profile characteristics of fake Twitter accounts. Big Data Soc. 2016, 3, 2053951716674236. [Google Scholar] [CrossRef]
- Ajao, O.; Bhowmik, D.; Zargari, S. Fake News Identification on Twitter with Hybrid CNN and RNN Models. In Proceedings of the 9th International Conference on Social Media and Society, Copenhagen, Denmark, 18–20 July 2018. [Google Scholar]
Figure 1.
Conceptual development of the seven-dimensional cyber threat intelligence model.

Figure 2.
Flow chart of AI-based analysis of tweets.

Figure 3.
Flow chart of AI-based analysis of cyber-attack data.

Figure 4.
Average daily Tweet sentiments (8 November 2022, logged the maximum level of -ve sentiments).
Figure 4.
Average daily Tweet sentiments (8 November 2022, logged the maximum level of -ve sentiments).

Figure 5.
Monthly average of Tweet sentiments.

Figure 6.
Average monthly negative sentiments for Australia and China.

Figure 7.
Attack spectrum for China and Australia. (a) Attack spectrum from China. (b) Attack spectrum for Australia. (c) Multi-spectrum cyber threat monitoring.
Figure 7.
Attack spectrum for China and Australia. (a) Attack spectrum from China. (b) Attack spectrum for Australia. (c) Multi-spectrum cyber threat monitoring.

Figure 8.
Anomaly detection on aggregated attack spectrum for China and Australia. (a) Anomaly detection for China. (b) Anomaly detection for Australia.
Figure 8.
Anomaly detection on aggregated attack spectrum for China and Australia. (a) Anomaly detection for China. (b) Anomaly detection for Australia.

Figure 9.
Prediction of cyber-attack for China and Australia. (a) Attack trend and prediction for China. (b) Attack trend and prediction for Australia.
Figure 9.
Prediction of cyber-attack for China and Australia. (a) Attack trend and prediction for China. (b) Attack trend and prediction for Australia.

Figure 10.
Word cloud of term frequencies for China and Australia.

Figure 11.
Word cloud of N-grams for China and Australia.

Figure 12.
Summarization of cyber intelligence for China and Australia (multi-criteria and multi-dimensional).
Figure 12.
Summarization of cyber intelligence for China and Australia (multi-criteria and multi-dimensional).

Figure 13.
Cyber intelligence deployed on a Samsung M8 Smart Monitor (Desktop) and Apple iPad 9th Generation.
Figure 13.
Cyber intelligence deployed on a Samsung M8 Smart Monitor (Desktop) and Apple iPad 9th Generation.

Figure 14.
Cyber intelligence showing the threat prediction for China on an Apple iPad 9th Generation (running iOS Ver. 16).
Figure 14.
Cyber intelligence showing the threat prediction for China on an Apple iPad 9th Generation (running iOS Ver. 16).

Figure 15.
Seven-dimensional cyber intelligence running on a Samsung Galaxy S-23 Ultra (running Android Ver. 13).
Figure 15.
Seven-dimensional cyber intelligence running on a Samsung Galaxy S-23 Ultra (running Android Ver. 13).


Table 1.
High-level concerns addressed by muti-dimensional cyber intelligence.
| High-Level Concern | Dimension of Cyber Intelligence | Reference |
|---|---|---|
| 1. Threat Type | Threat Spectrum (e.g., malware, spyware) | [26,28,29,30] |
| 2. Attacker 3. Attack Origin 4. Reason for the Attack 5. Motivation for Conducting the Attack | Socioeconomic/Geopolitical | [29] |
| 6. Attack Target 7. Victim of the Attack | Victimization (System/Human) | [25,26] |
| 8. Critical Cyber-Related Concern | National Priority and Concerns | [27,31] |
| 9. Impact of Attack | Impacted Target (Supply Chain, Infrastructure, Others, etc.) | [26] |
| 10. Societal Perception 11. Societal Effect 12. Negative Perception of the Attack | Societal/Psychological | [27] |
| 13. Seriousness/Criticality 14. Intensity | Threat Level (Hi, Mid, Lo) | [26] |
Table 2.
Machine learning algorithms used within existing research.
| Algorithms Name | Abbreviated Name | Reference |
|---|---|---|
| Naïve Bayes Classifier | NV | [21,22] |
| Support Vector Machines | SVM | [19,21,22] |
| Maximum Entropy Classifier | ME | [21] |
| BERT-based | BERT | [19] |
| Logistic Regression | LR | [19,22] |
| Random Forest | LR | [19,22] |
| Extreme Gradient Boosting | XGBoost | [19] |
| Stochastic Gradient Descent Classifier | SGD | [22] |
| Light Gradient-Boosted Machine | LightGBM | [23] |
| Convolutional Neural Network | CNN | Proposed |
Table 3.
Summary of literature review on analyzing social media posts (concerned with cyber issues) using NLP algorithms.
Table 3.
Summary of literature review on analyzing social media posts (concerned with cyber issues) using NLP algorithms.
| Reference | Sentiment Analysis | Translation | LDA | TF-IDF | Stemming | N-Gram | Forecasting |
|---|---|---|---|---|---|---|---|
| [21] | Yes | No | No | Yes | Yes | Yes | Yes (Regression) |
| [16] | Yes | Yes | No | No | No | No | No |
| [19] | Yes | No | Yes | Yes | No | Yes | No |
| [20] | No | No | Yes | Yes | No | Yes (bigram) | No |
| [22] | No | No | No | Yes | No | No | No |
| [23] | No | No | No | Yes | No | No | No |
| [24] | Yes | No | Yes | No | No | No | No |
| Proposed | Yes | Yes | Yes | Yes | Yes | Yes | Yes |
Table 4.
Details of the algorithms applied in the presented AI-based cyber threat intelligence model.
Table 4.
Details of the algorithms applied in the presented AI-based cyber threat intelligence model.
| Process Name | Algorithm Used | Data Used | Algorithm Type | API Used | References |
|---|---|---|---|---|---|
| Sentiment Analysis | Microsoft Text Analytics | Twitter [17,18] | Language Processing | Yes | [19,21,45,46] |
| English Translate | Microsoft Text Analytics | Twitter [17,18] | Language Processing | Yes | [45,46] |
| Anomaly Detection | CNN | Cyber-Attack Statistics [16] | Deep Learning | No | [44,45,46] |
| Analysis with Topic Modelling | LDA | Twitter [17,18] | Language Processing | No | [19,20] |
| Analysis with Term Frequency | TF-IDF | Twitter [17,18] | Language Processing | No | [19,20,21,22,23] |
| Analysis with Term Frequency | Porter Stemming | Twitter [17,18] | Language Processing | No | [21] |
| Analysis with Term Frequency | N-Gram | Twitter [17,18] | Language Processing | No | [19,20,21] |
| Forecasting of Threat | Exponential Smoothing | Cyber-Attack Statistics [16] | Statistical Analysis | No | [50] |
Table 5.
Details of AI-based Tweet processing for the proposed system.
| Month | Tweets | Users | Locations | Languages | Retweets | Confidence of Negative Setiments | Confidence of Neutral Sentiments | Confidence of Positive Setiments | Translations |
|---|---|---|---|---|---|---|---|---|---|
| 22 Oct | 3954 | 3556 | 1588 | 38 | 3,727,756 | 0.36 | 0.43 | 0.21 | 941 |
| 22 Nov | 6470 | 5875 | 2358 | 38 | 9,981,856 | 0.34 | 0.43 | 0.23 | 1283 |
| 22 Dec | 6512 | 5544 | 2225 | 42 | 7,565,946 | 0.35 | 0.42 | 0.23 | 1533 |
| 23 Jan | 6685 | 5785 | 2364 | 40 | 7,802,301 | 0.36 | 0.40 | 0.24 | 1419 |
| 23 Feb | 5976 | 5053 | 2114 | 43 | 4,276,479 | 0.37 | 0.42 | 0.21 | 1373 |
| 23 Mar | 6634 | 5749 | 2357 | 41 | 4,799,540 | 0.36 | 0.43 | 0.21 | 1469 |
| 23 Apr | 1155 | 1083 | 538 | 27 | 713,083 | 0.40 | 0.41 | 0.20 | 258 |
| Total | 37,386 | 30,706 | 10,178 | 54 | 38,866,961 | 0.36 | 0.42 | 0.22 | 8199 |
Table 6.
Result of topic analysis for China with LDA.
| China Topic 1 | China Topic 2 | China Topic 3 | China Topic 4 | China Topic 5 | China Topic 6 | China Topic 7 | |||||||
|---|---|---|---|---|---|---|---|---|---|---|---|---|---|
| cyber | 29 | China | 20 | China | 16 | Russia | 6 | China | 21 | China | 15 | China | 17 |
| China | 22 | Cyber | 9 | Hack | 5 | China | 6 | hack | 12 | cyber | 7 | Chinese | 10 |
| attacks | 14 | hack | 6 | country | 4 | North | 4 | chains | 4 | war | 6 | sophisticated | 8 |
| Russia | 8 | TikTok | 4 | national | 3 | Cyber | 4 | supply | 4 | would | 6 | databases | 8 |
| States | 7 | China’s | 4 | IMMEDIATELY | 3 | reports | 3 | etc | 4 | Russia | 5 | Tech | 8 |
Table 7.
Result of topic analysis for Australia with LDA.
| Aus. Topic 1 | Aus. Topic 2 | Aus. Topic 3 | Aus. Topic 4 | Aus. Topic 5 | Aus. Topic 6 | Aus. Topic 7 | |||||||
|---|---|---|---|---|---|---|---|---|---|---|---|---|---|
| Australians | 10 | Australian | 9 | Australia | 7 | cyber | 4 | cyber | 12 | amp | 7 | Police | 16 |
| Australian | 9 | hack | 7 | way | 4 | POTUS | 3 | Australia | 11 | Australia | 7 | Australian | 14 |
| scamming | 6 | Medibank | 6 | Cyber | 3 | Australia | 3 | data | 8 | Cyber | 5 | Cyber | 12 |
| Boys | 6 | million | 5 | Australian | 3 | 2 | Australian | 7 | Leaks | 3 | Australia | 10 | |
| Yahoo | 6 | health | 5 | fundamental | 2 | AustralianOpen | 2 | attack | 5 | https://t.co | 3 | love | 7 |
Table 8.
Detailed cyber analysis through the lenses of seven cyber dimensions for China and Australia.
Table 8.
Detailed cyber analysis through the lenses of seven cyber dimensions for China and Australia.
| Dimensions | China | Australia |
|---|---|---|
| Threat Spectrum | China suffers from spam (second in the world) and web threats (third in the world), as seen in Figure 7 | As seen from Figure 7, the topmost cyber threat affecting Australia is exploit (11th in the world) |
| Geopolitical | Tension surrounding US and Russia in cyberspace, as evident from Table 6 and Figure 10 and Figure 11 | Tension surrounding China in cyberspace, as evident from Table 7 and Figure 10 and Figure 11 |
| Psychological and Societal | By measuring the negative sentiments of cyber-related Tweets, China has highly negative psychological and societal effects (Figure 6) | By measuring the negative sentiments of cyber-related Tweets, Australia has moderately negative psychological and societal effects (Figure 6) |
| Impacted Target | Chinese-owned apps like TikTok and database attack, as seen in Table 6 and Figure 10 and Figure 11 | Cyber-attack and data breach in Australian Health Sector (like, Medicare) as well as infrastructure (like the electricity network), as seen in Table 7 and Figure 10 and Figure 11 |
| National Concerns | Chinese concerns are geopolitical in nature, discussing cyberespionage and intrusions by foreign countries, particularly the United States, as observed in Table 6, Figure 10 and Figure 11 | Australians are concerned with data breach (e.g., Optus, Medibank) and cybersecurity threats and assaults, and issues like malware, phishing, and ransomware, as observed in Table 7 and Figure 10 and Figure 11 |
| Victimization | As noticed from Table 6 and Figure 10 and Figure 11, Chinese tech firms as well as the supply chains are most often the victims of cyber-attacks | As noticed from Table 7 and Figure 10 and Figure 11, both the general public (i.e., Australians through data breaches) and organizations (e.g., Optus, Medibank) are victims of cyber-attacks |
| Threat Level | Very high, as seen from Figure 7 (ranked second in terms of global spam attack and ranked third in terms of global network attack). Moreover, the attack scale in Figure 9 represents a higher value (i.e., 0.03 on average) for China | Moderate, as seen from Figure 7 (11th in terms of global exploits). Moreover, the attack scale in Figure 9 represents a lower value (i.e., 0.004 on an average) than China |
Disclaimer/Publisher’s Note: The statements, opinions and data contained in all publications are solely those of the individual author(s) and contributor(s) and not of MDPI and/or the editor(s). MDPI and/or the editor(s) disclaim responsibility for any injury to people or property resulting from any ideas, methods, instructions or products referred to in the content. |
© 2023 by the author. Licensee MDPI, Basel, Switzerland. This article is an open access article distributed under the terms and conditions of the Creative Commons Attribution (CC BY) license (https://creativecommons.org/licenses/by/4.0/).
Share and Cite
MDPI and ACS Style
Sufi, F. Novel Application of Open-Source Cyber Intelligence. Electronics 2023, 12, 3610. https://doi.org/10.3390/electronics12173610
AMA Style
Sufi F. Novel Application of Open-Source Cyber Intelligence. Electronics. 2023; 12(17):3610. https://doi.org/10.3390/electronics12173610
Chicago/Turabian StyleSufi, Fahim. 2023. "Novel Application of Open-Source Cyber Intelligence" Electronics 12, no. 17: 3610. https://doi.org/10.3390/electronics12173610
Note that from the first issue of 2016, this journal uses article numbers instead of page numbers. See further details here.