
Recognition of Human Mental Stress Using Machine Learning: A Case Study on Refugees


Institute of Mechatronics and Information Systems, Lodz University of Technology, 90-924 Łódź, Poland
Electronics 2023, 12(16), 3468; https://doi.org/10.3390/electronics12163468
Submission received: 16 July 2023
/
Revised: 2 August 2023
/
Accepted: 10 August 2023
/
Published: 16 August 2023
(This article belongs to the Special Issue Perception and Interaction in Mixed, Augmented, and Virtual Reality)
Abstract
:This paper introduces a study on stress recognition utilizing mobile EEG and GSR sensors. The research involved collecting samples from a group of 55 refugees who participated in Virtual Reality stress-reduction sessions. The timing of the study coincided with an influx of refugees, prompting the development of software specifically designed to alleviate acute stress among them. The paper focuses on presenting an EEG/GSR signals pipeline for classifying stress levels, emphasizing selecting the most informative features. The classification process employed popular machine learning methods, yielding results of 86.7% for two-stress-level classification and 82.3% and 67.7% for the three- and five-level classifications, respectively. Most importantly, the positive impact of the system has been proven by subjective assessment in alignment with objective features analysis. Such a system has not yet reached the level of autonomy, but it can be a valuable support tool for mental health professionals.
1. Introduction
The term stress, used as a descriptor of a human condition, first appeared in the scientific literature in the 1930s [1]. However, it came into everyday use in the 1970s [2]. Today it is often used to describe various unpleasant feelings, illustrating frustration, anger, dilemmas, and being overwhelmed or exhausted. Although the term is widely used, “stress” is a rather vague and challenging concept to define precisely [3].
According to the WHO, stress is defined as any type of change that causes physical, emotional, or psychological strain [4]. Stress is the human body’s response to a disturbance that requires attention or action [5]. People experience positive and negative emotions that affect their interactions with others, perception of reality, and general well-being. How one responds to a stressful situation defines their life’s comfort and health [6].
Stress causes changes in vegetative-somatic indicators. When in danger, the sympathetic system is activated, adrenaline secretion by the adrenal glands increases, blood pressure rises, the heart rate accelerates, blood glucose levels rise, and digestion processes are inhibited [7]. This is because stress affects the nervous system (especially the hypothalamus and pituitary gland) and mobilizes the body to a “fight or flight” response [8]. Short-term stress mobilizes the body for effort and action, while long-term stress may cause harm. The symptoms of an acute stress reaction usually subside quickly, depending on a person’s psychological ability to cope and recover. Untreated stress leads to more severe conditions, strains the nervous system, and causes somatic ailments [9]. That is why treatment and stress therapy is so important.
So-called stressors, i.e., events that disrupt the body’s equilibrium and strain or exceed our ability to cope effectively are invariably linked to the definition of stress. Their source can be physical (e.g., overcrowding, disease, natural disasters) or social (e.g., lack of employment, family problems, loss of a loved one, or crime) [10]. Stressors can also vary in terms of their strength. The weakest of them can be described as ordinary, everyday nuisances. However, despite their low strength, they can be problematic due to their commonness (e.g., tardiness, conflicts). The next level is severe stressors, which are associated with so-called life changes. These are ground-breaking circumstances, such as getting married, changing jobs, or the birth of a new family member [11]. The last level is catastrophic stressors, which dramatically affect entire groups of people (such as wars, natural disasters, and terrorist attacks), striking at the most basic human needs and values, such as life or safety. The stress accompanying them is usually extreme, sometimes traumatic, and can leave a long-lasting psychological effect [12]. Undoubtedly, refugees are in such a situation.
According to various estimates, more than 3 million refugees from Ukraine appeared in Poland in a short period [13]. Women and children found themselves in an environment that was utterly unfamiliar, often without essential personal belongings, money, or a guaranteed place to stay. Separated from their loved ones, who remained in the bombed-out cities, these individuals were naturally highly stressed [14].
Having previous experience in using VR technology for stress reduction [15,16], a Ukrainian-language VR-therapeutic application involving various relaxation techniques such as breathing methods, visualization, and bilateral stimulation (BLS) [17] was developed. Furthermore, relatively minimally invasive biomedical sensors (dry frontal electroencephalography—EEG [18], Galvanic Skin Response—GSR [19], and induced eye movement tracers) enhanced the application to continuously monitor users’ activities. As a result, user interaction with the application was completely natural, relying on gestures and bio-responses. Before and after the session, participants filled out questionnaires about their current mental health, stress levels, and general mood. The primary goal of this study is to validate the effectiveness of the proposed system using data recorded by portable EEG and GSR devices during VR-based training. This work’s contribution may be summed up as follows:
- An EEG/GSR-head mounted display (HMD) system is used to build a relaxation training system and assess stress levels;
- It has been demonstrated that a portable integrated HMD can collect high-quality EEG/GRS data during relaxation training in virtual reality, allowing for objective and quantitative monitoring of the stress level;
- The main contributions of this research include the creation of a novel EEG/GRS corpus for stress recognition, along with comparative experimental results that evaluate different approaches to managing this issue.
2. Materials and Methods
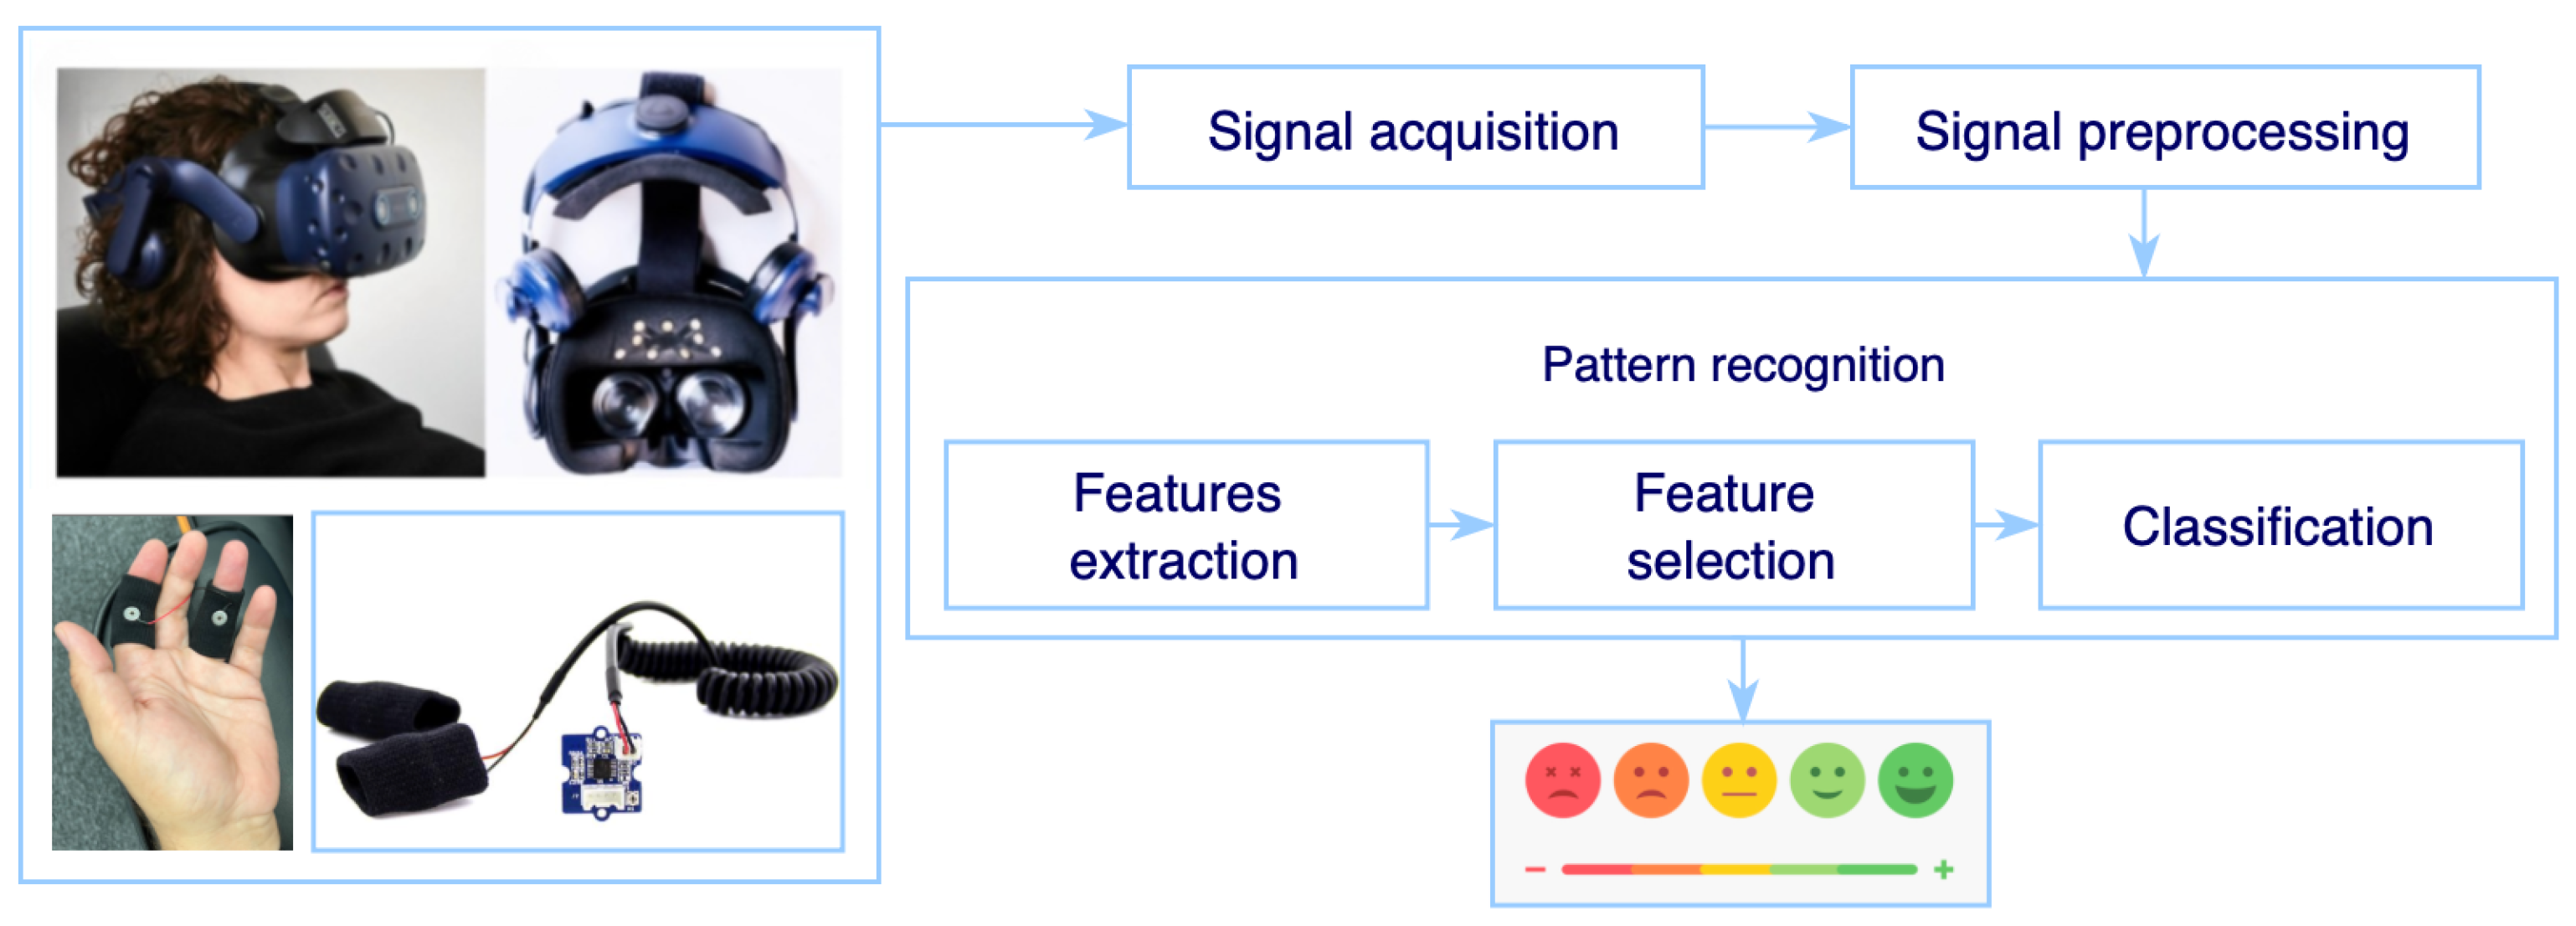
In this section, an EEG/GRS-based system for stress level recognition is presented. As depicted in Figure 1, to achieve this goal, the system has four sequential components: signal acquisition, preprocessing, pattern recognition, and device output (stress level).
2.1. VR-Based Stress Reduction Training
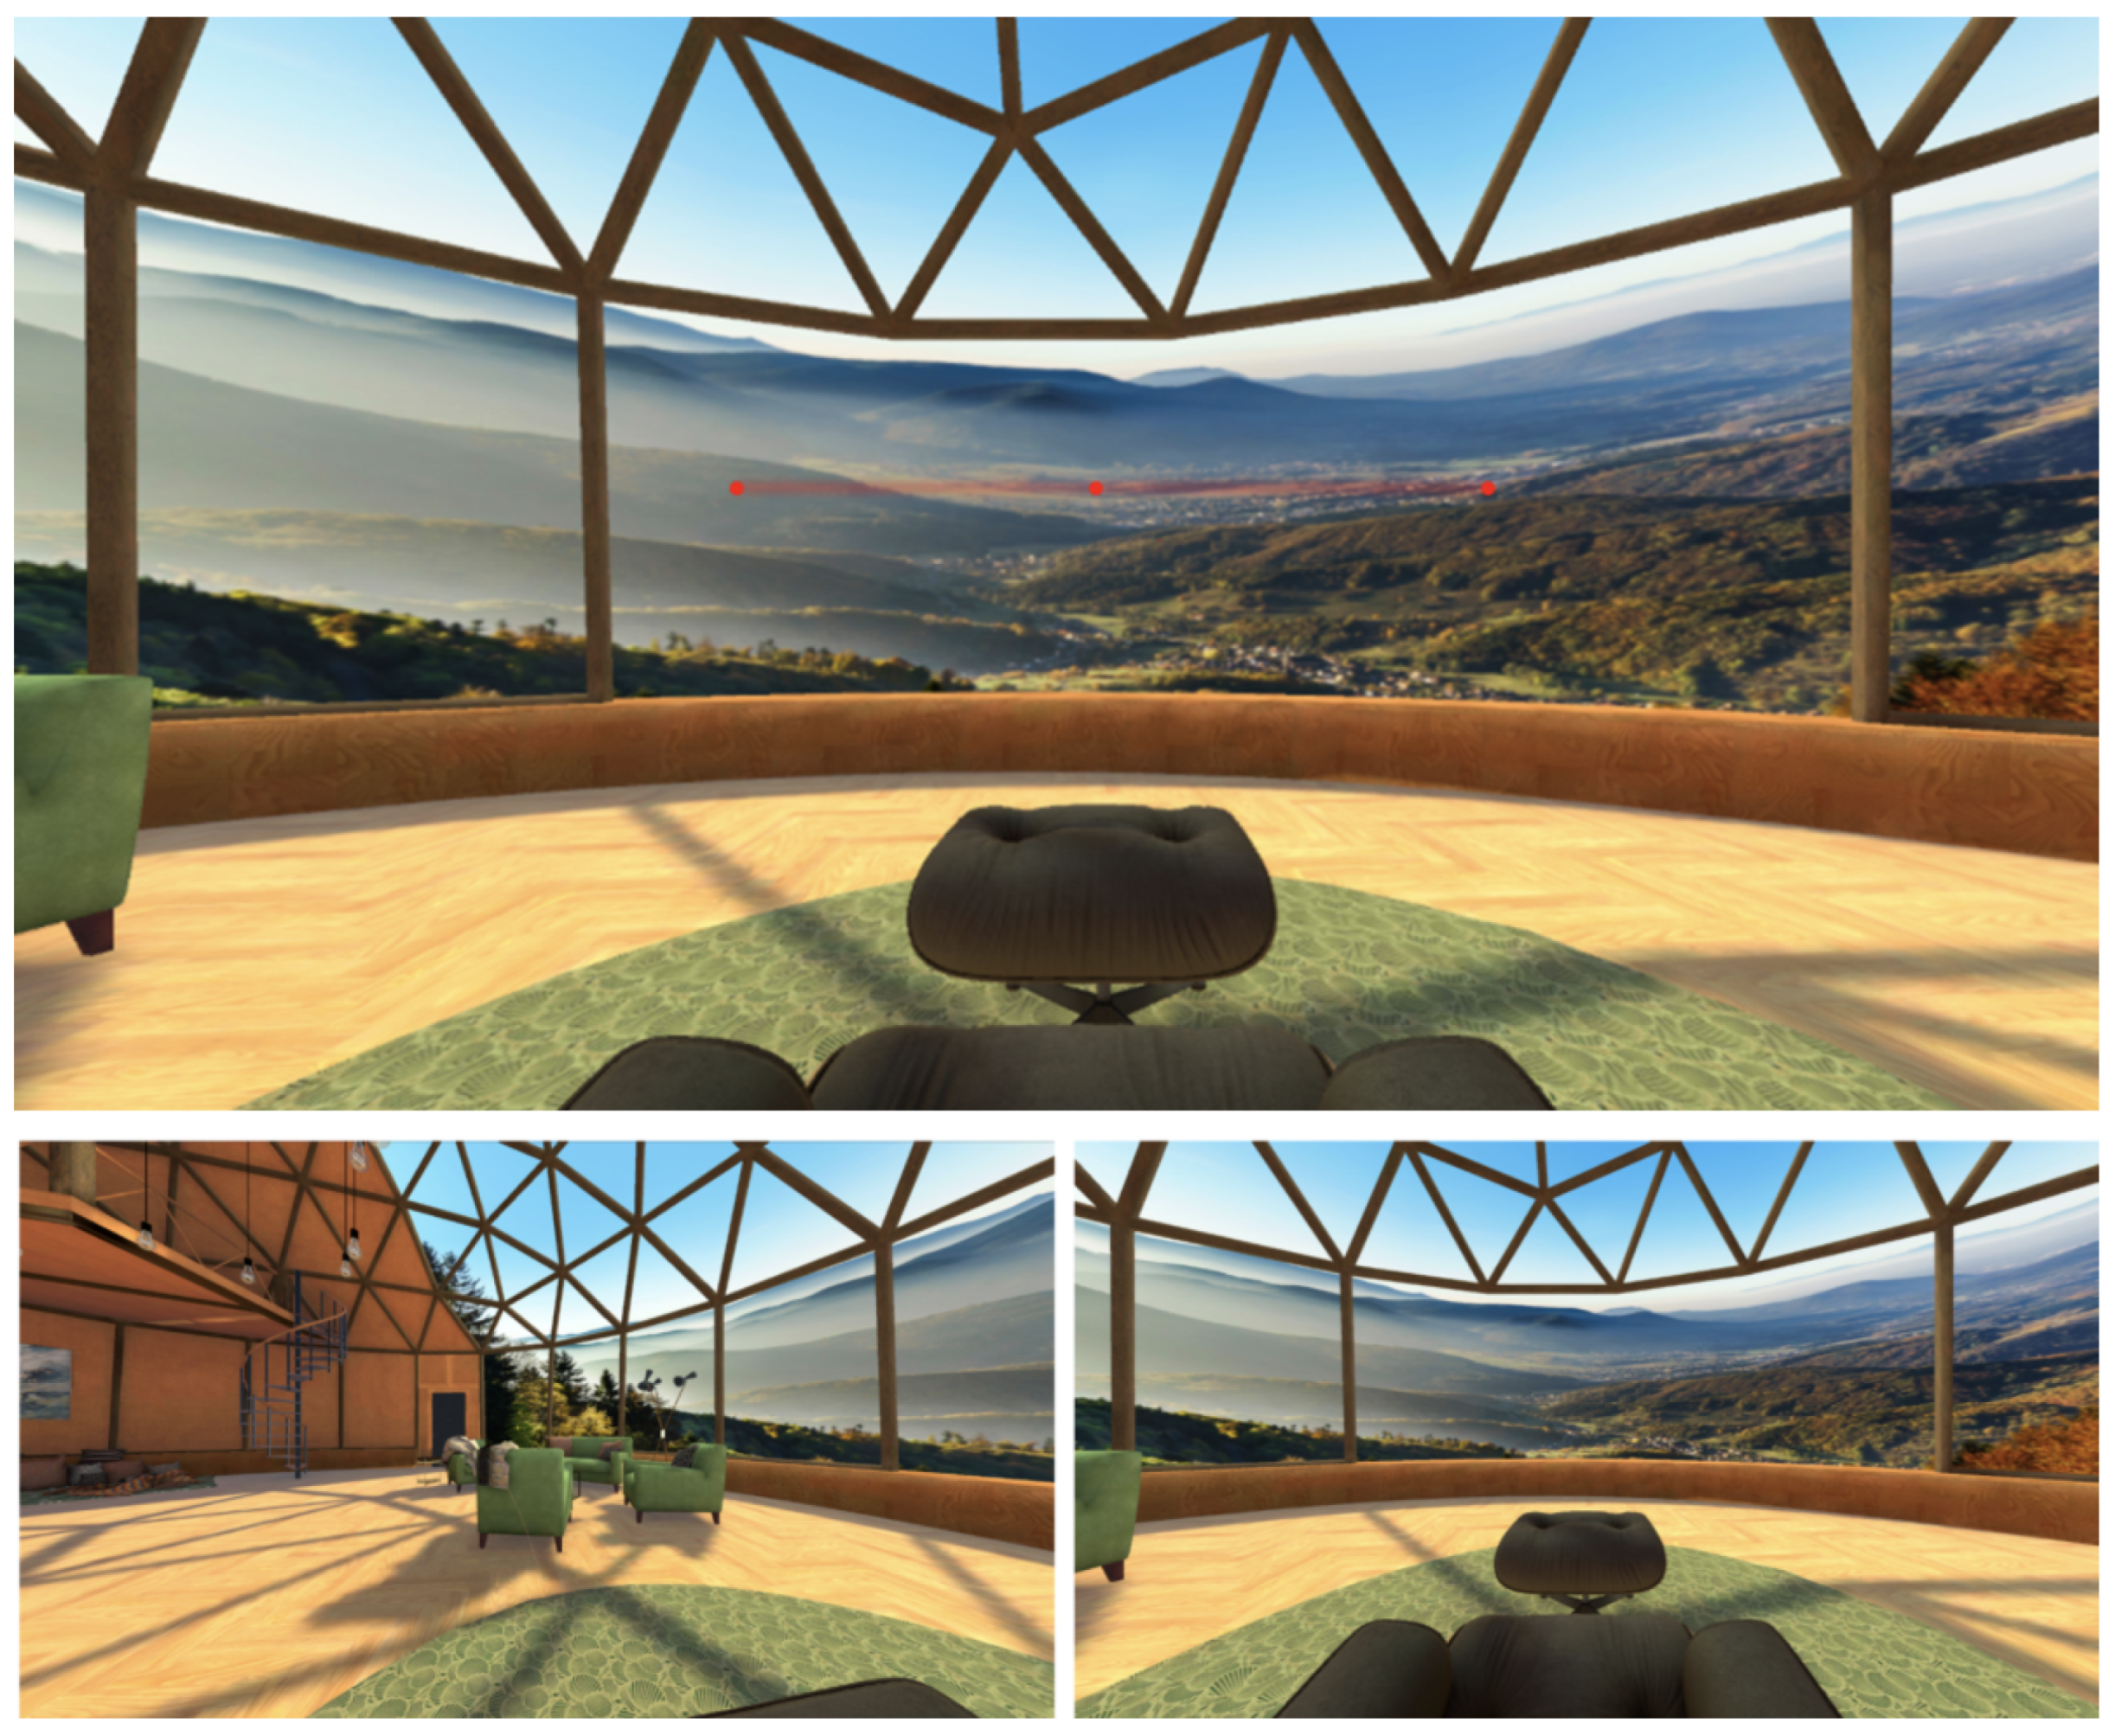
For the purpose of this study, a VR application was developed, specifically designed to simulate the process of stress reduction therapy. Within the virtual environment, a quiet mountain apartment is depicted, carefully crafted to create a soothing atmosphere. The initial scene serves as a setup and tutorial, offering customization options for the virtual camera and the patient’s location.
During the therapy session, each participant is encouraged to relax in a comfortable chair (see Figure 2). The visual scene presented to the participant is automatically calibrated based on their head position, ensuring that the central element—a window showcasing a stunning mountain view—is perfectly aligned vertically and horizontally for the individual participant. The VR device incorporates built-in sensors to accurately determine the participant’s position.
To ensure the participant’s safety and minimize the potential occurrence of negative effects during the simulation, such as cybersickness or VR sickness, a 2 min adaptive session is initially employed. This session helps acclimate the participant to the virtual environment before proceeding to the actual relaxation simulation. Throughout the experience, a native Ukrainian narrator guides the user, providing instructions on various relaxation techniques, including breathing techniques, visualization, and bilateral stimulation.
2.2. Course of the Experiment
To recruit participants, an information campaign was conducted in cooperation with the City of Łódź. This campaign began with a press conference, widely covered in local media, such as television, newspapers, and social media, dealing mainly with Ukrainian affairs.
Before each session, users were informed about the course of the VR experience and the exclusionary conditions, and provided informed consent. The entire course of the session was monitored by the supervisory staff. It was assumed that each participant would be able to benefit from five therapeutic sessions (one session per week). Unfortunately, due to personal reasons and relocation, not everyone has completed the session sequence.
Finally, we recruited n = 55 participants, 52 female, 3 male, aged M = 35, SD = 10.93. Detailed participants characteristics are presented in Table 1. Most participants came to the sessions repeatedly (up to 5 times/once a week). The study was conducted at Łódź University of Technology, in a period when the university was closed (there were no students), in a quiet, air-conditioned room.
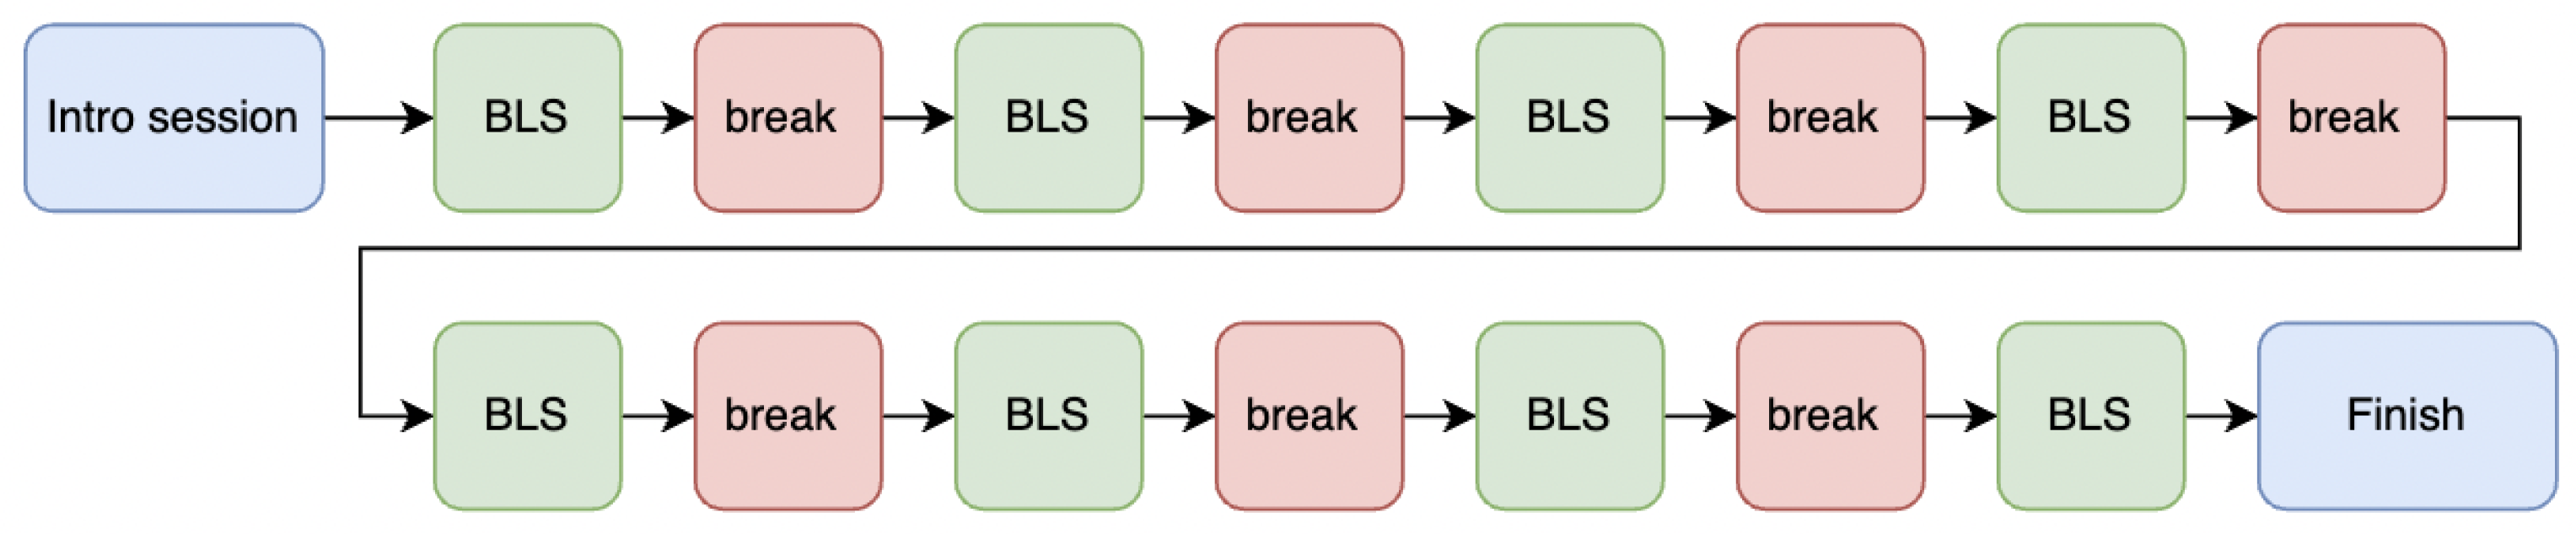
The participant’s primary objective is to track a moving sphere with their eyes as it traverses an invisible horizontal line outside the window. Sensors integrated into the display glasses continuously monitor the participant’s gaze-tracking accuracy throughout the session. The study comprises eight 90 s sessions of BLS (see Figure 3), wherein the participant focuses on following the sphere located at the center of their visual field. This division into BLS sessions and breaks ensured that the study participant had adequate time to relax and unwind, thus avoiding fatigue and keeping the BLS session as effective as possible.
2.3. EEG
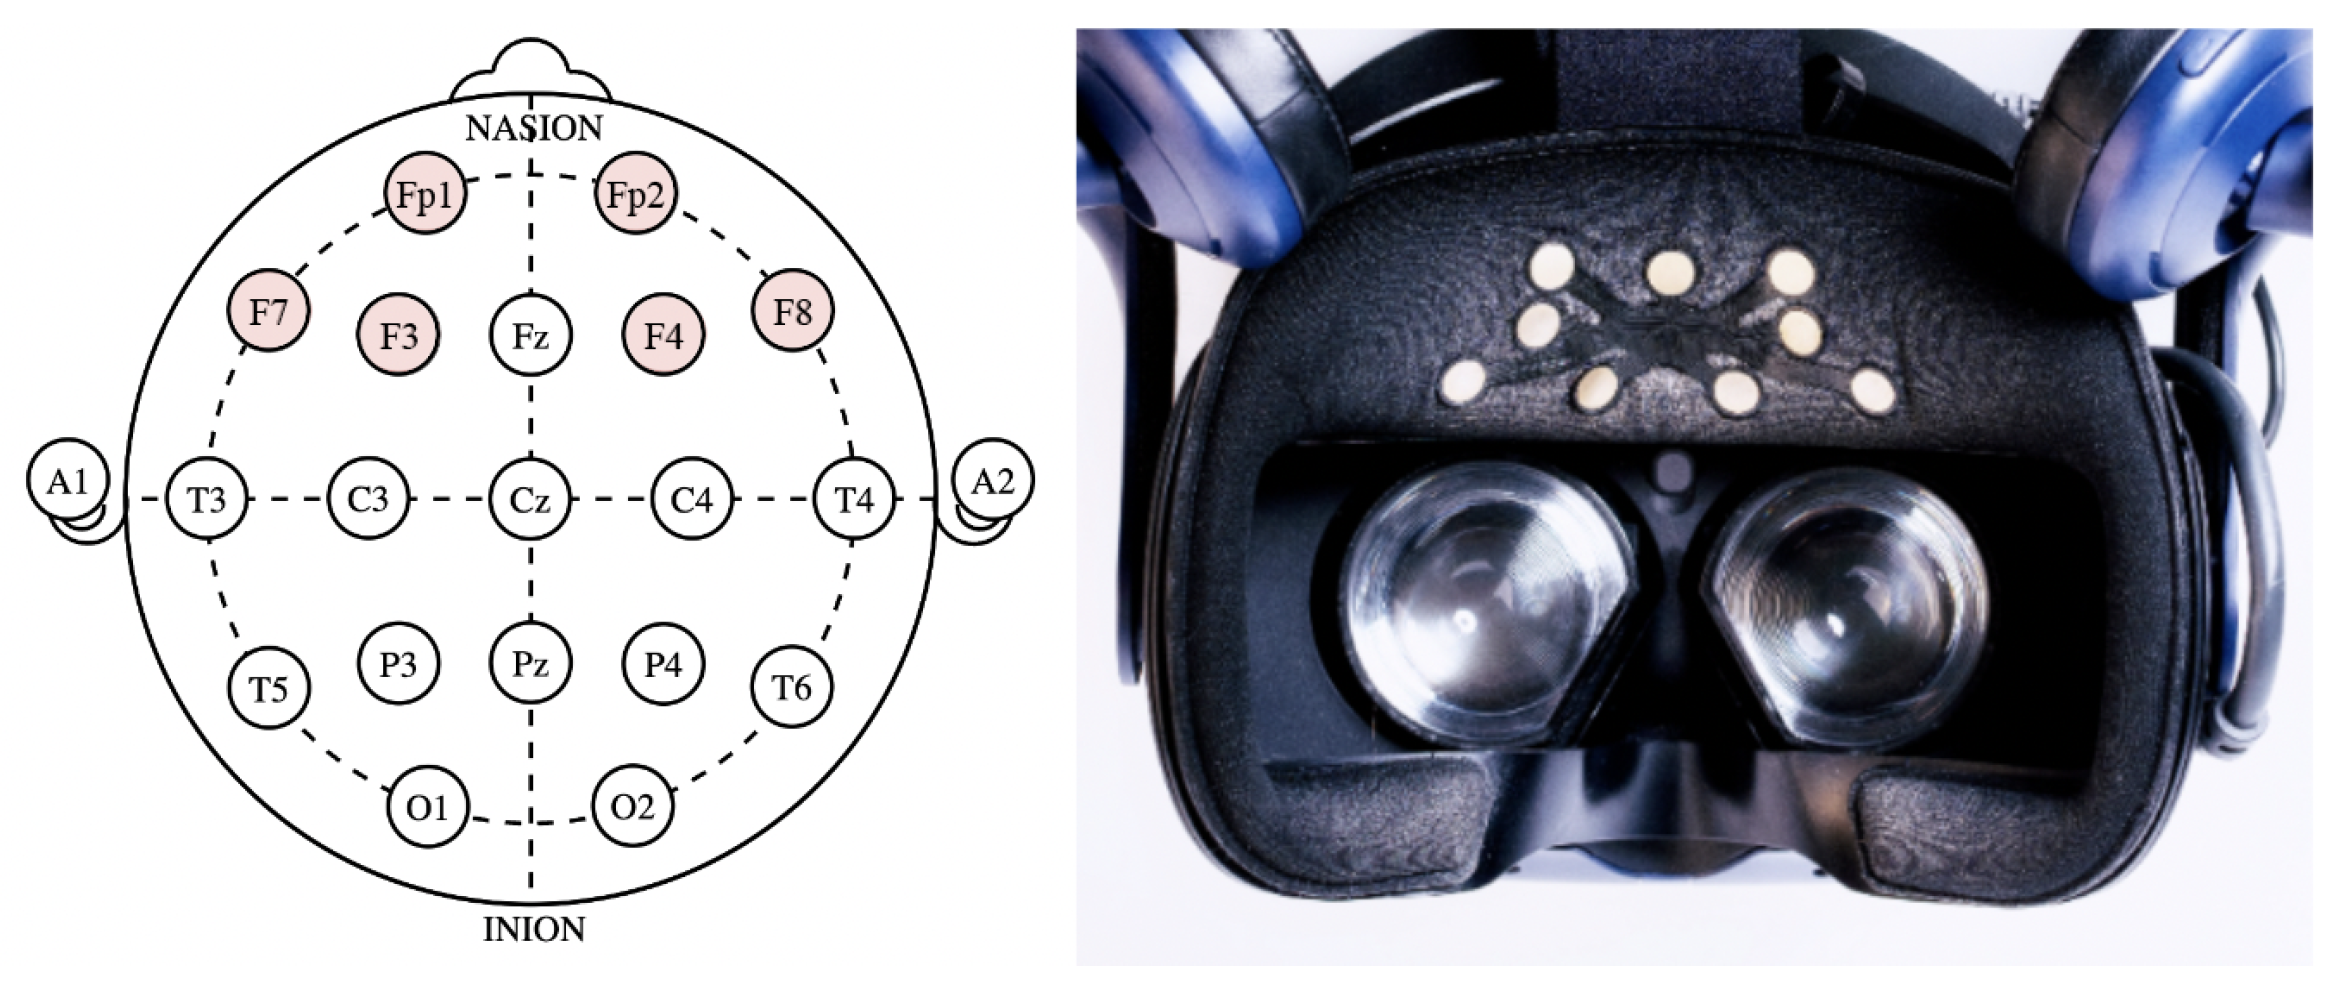
A non-invasive EEG system, Looxid Link, was used for the study to maintain comfort during the session. Looxid Link is a VR headset-compatible hardware configuration that includes a frontal six-channel EEG system (F3, F4, F7, F8, Fp1, and Fp2) conforming to International System 10-10 [20] (see Figure 4). Unlike conventional wet-EEG with wires and voluminous amplifiers, wireless dry-electrode mobile EEG allows for effortless attachment to the VR headset and it is virtually unnoticeable by the user [21]. Table 2 shows the data generated at the output of the device.
Delta, theta, and alpha brain waves are categorized as “slow” brain waves, indicating a more relaxed or tranquil state of the brain. For instance, delta brain waves are associated with deep sleep and help facilitate falling asleep. Alpha waves are activated when someone is engaged in activities like meditation or enjoying a leisurely day. On the other hand, beta, high beta, and gamma brain waves are classified as “fast”. When these brainwaves dominate, it signifies an active and engaged state of the brain. Beta waves are associated with significant cognitive activities, while gamma waves are involved in deep concentration [22].
During times of stress, beta brain waves become hyperactive, triggering the amygdala, which is responsible for emotional processing. This leads to the production of high beta brain waves, making them fast and active. It activates the nervous and adrenal systems, preparing the body for a physical response to the stressor. Ideally, once the stressor is no longer present, the intensity of high beta waves diminishes, allowing the individual to return to a relaxed state [23].
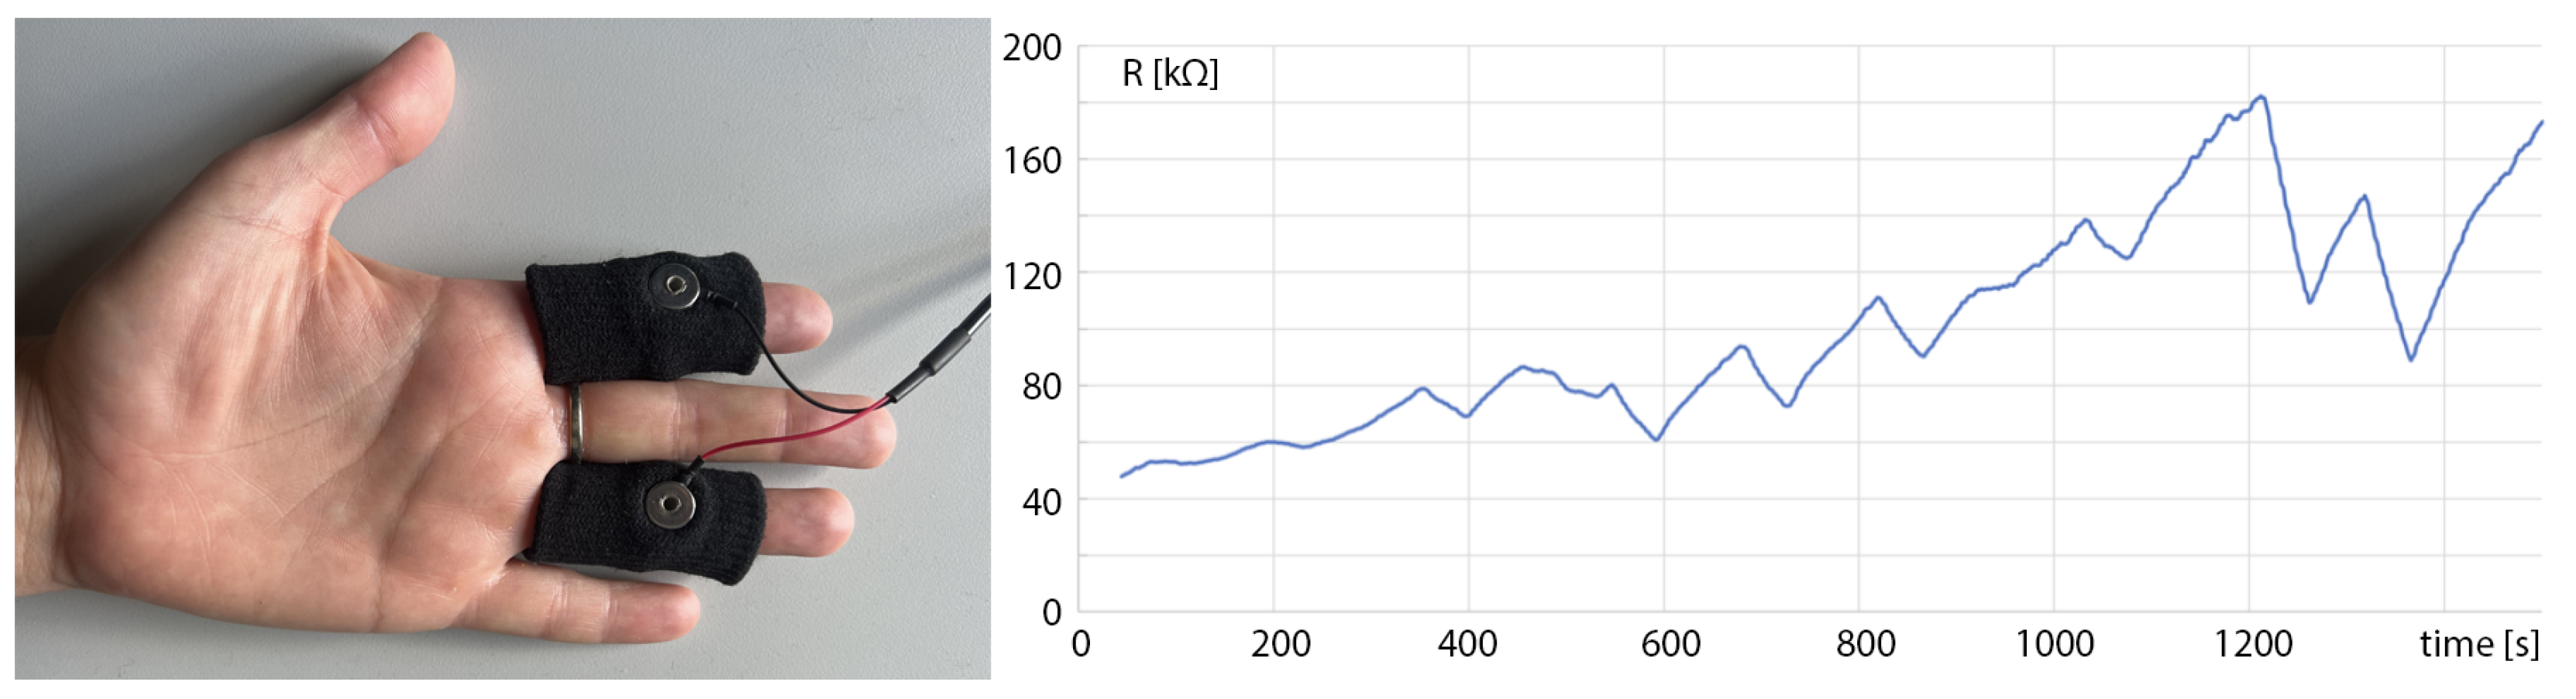
This research utilized the Grove GSR sensor in conjunction with a Raspberry Pi 3. GSR sensors measure and record changes in the electrical resistance of the skin. The skin’s resistance is influenced by different levels of hydration due to sweat gland activity controlled by the sympathetic nervous system. A typical GSR reaction involves a relationship between skin resistance and sweating—as the sweat glands fill up, the skin becomes more conductive. GSR is believed to be influenced by the psychological state of the individual, where increased activity in the cerebral cortex is reflected in sweating and higher GSR readings. Conversely, a decrease in stimulation leads to higher skin resistance and lower GSR [24]. Typically, the measured value is the skin resistance or its inverse conductance (R = 1/G). The process involves placing two dry electrodes on two fingers (refer to Figure 4). It is important to maintain an appropriate room temperature during the experiment to avoid inducing additional sweating that could affect the accuracy of the collected measurements. Furthermore, participants were instructed not to move their hands during the session, to prevent any artifacts in the signal. An example of a GSR waveform recorded for a random participant during the relaxation session is presented in Figure 5.
3. Results
After discarding files unsuitable for further analysis (unsteady connection of EEG electrodes or GRS sensors during testing), a total of 155 samples were obtained (simultaneous EEG and GSR). However, dividing the recordings into “before” and “after” samples, it was found that 5 of them had stopped registering roughly in the middle. Therefore, for classification, ultimately, 305 samples were used, of which 155 were collected before the VR sessions and 150 at the end of the VR sessions. To recognize stress levels, two approaches were used. In the first one, only the psychological condition into two states—before and after the session—was classified. The second was based on participants’ self-assessment before and after the session. The following sections will describe the results of both approaches.
3.1. Two-Stress-Level Analysis
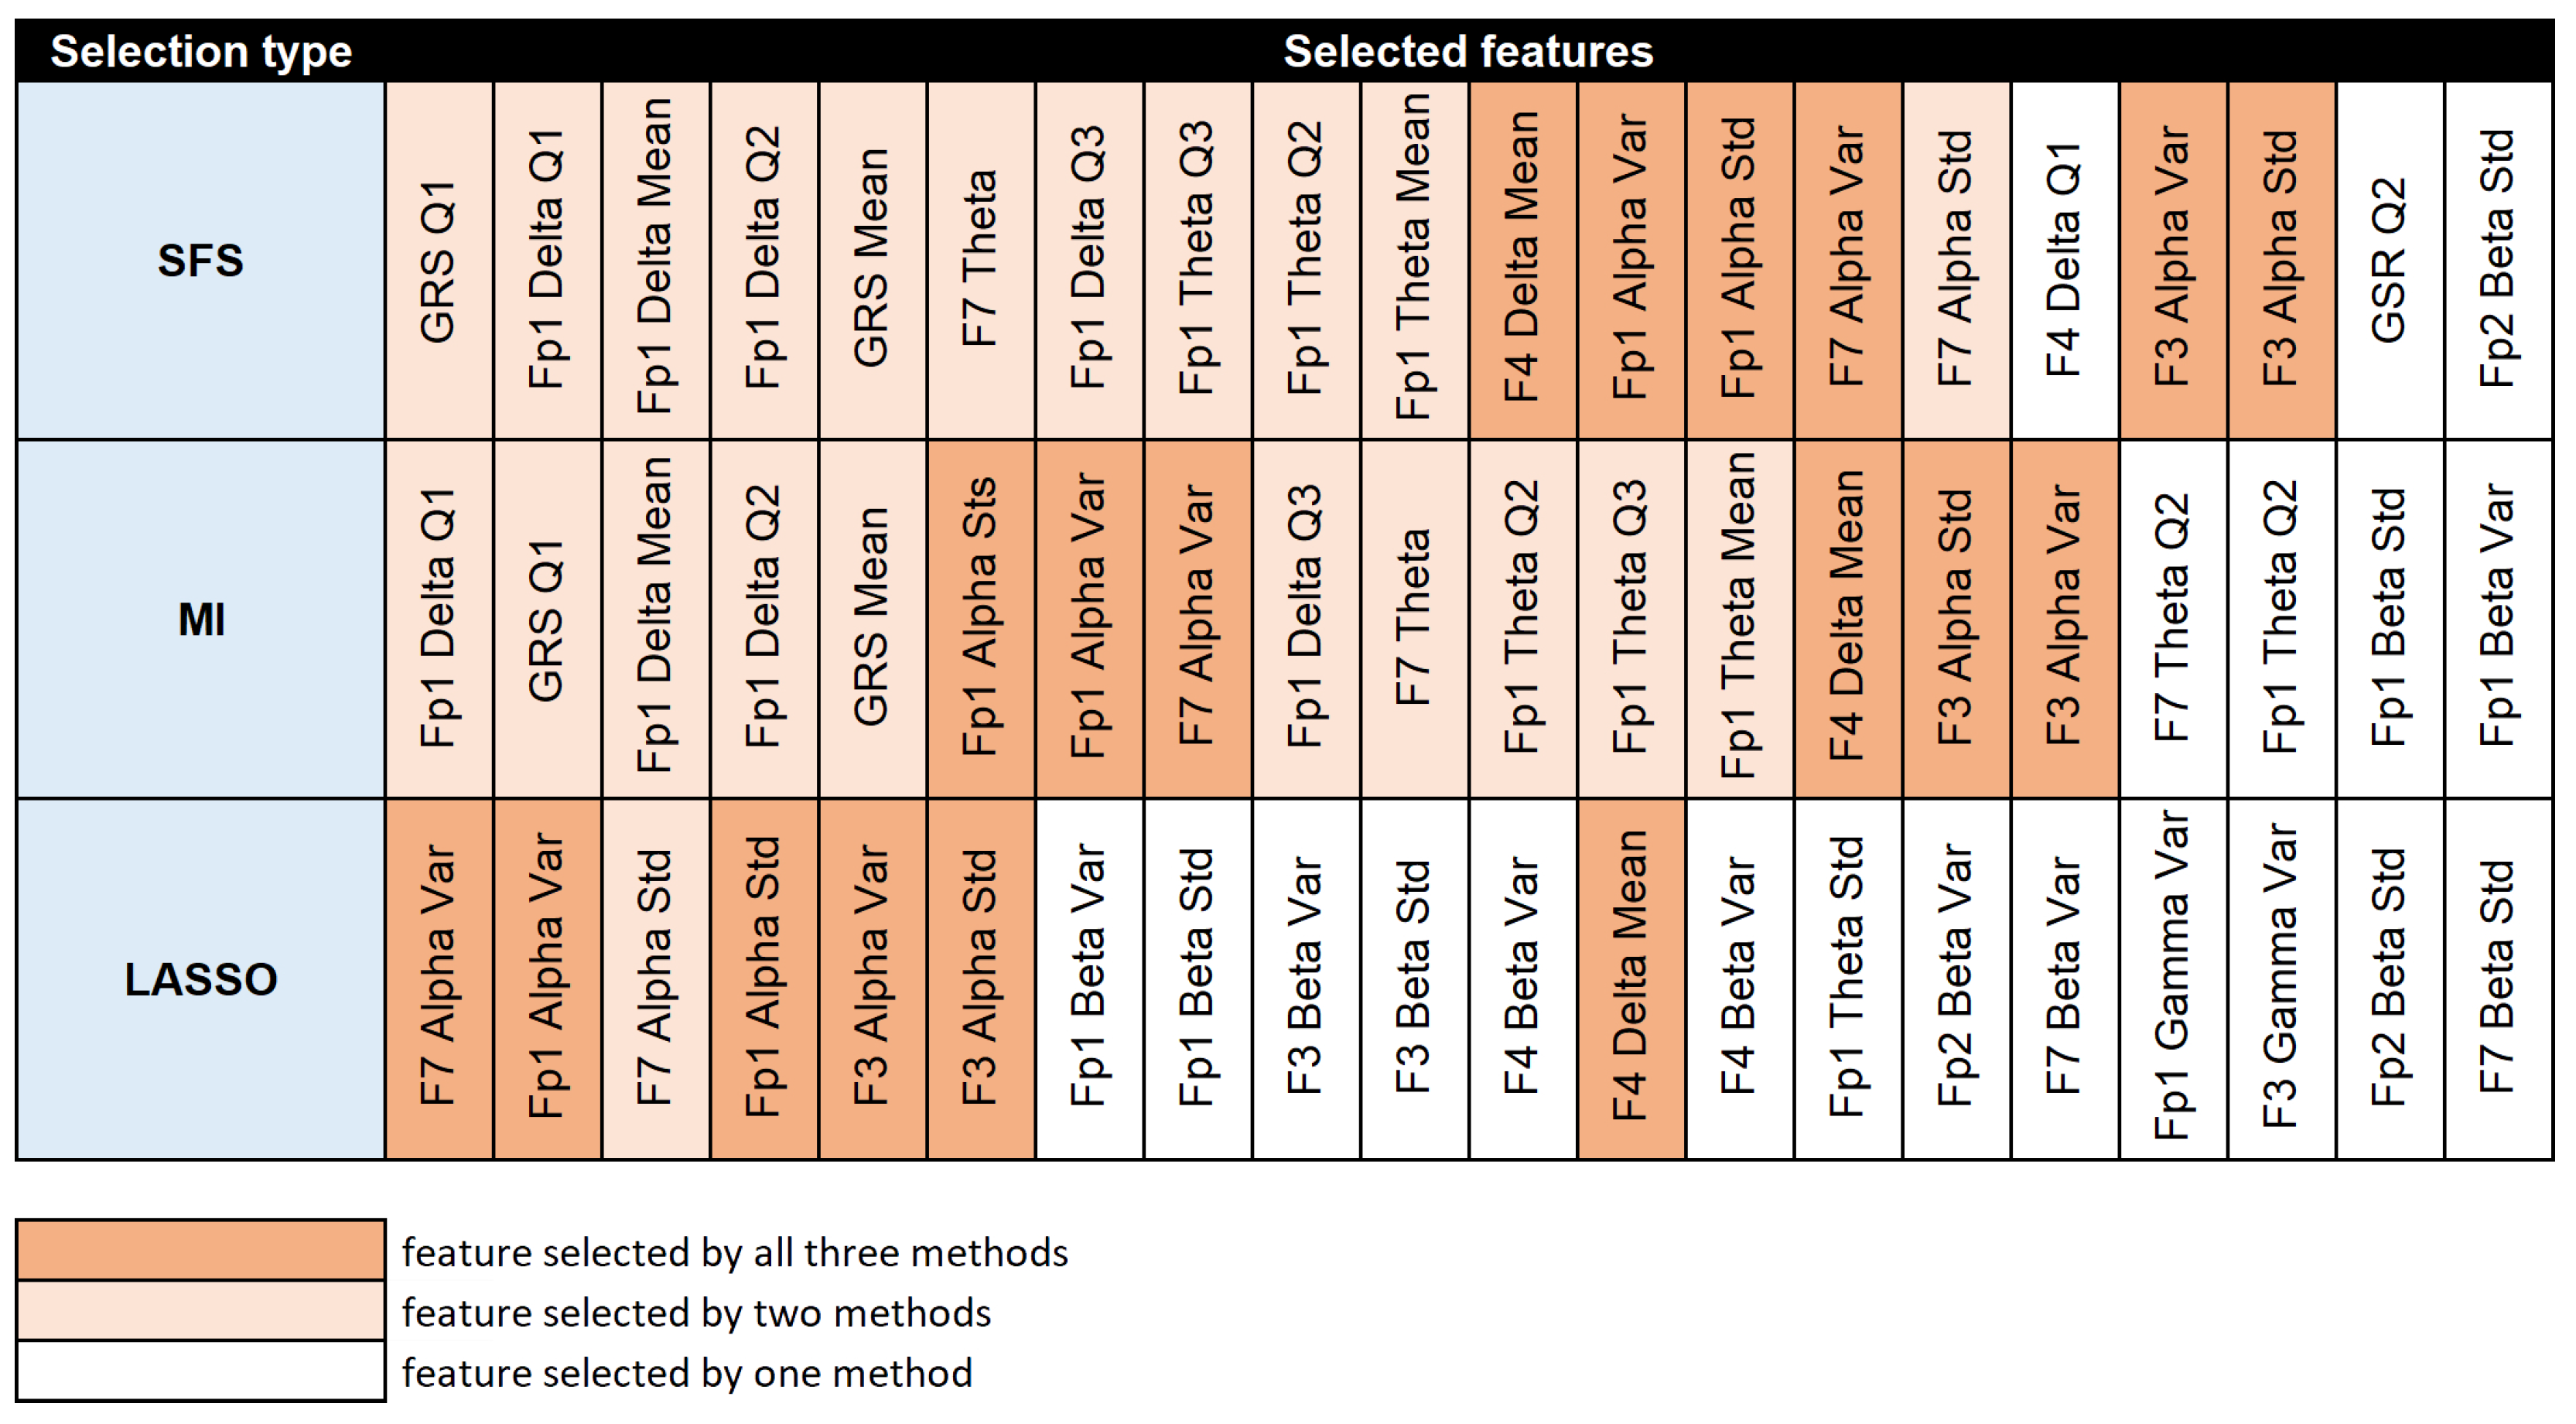
Since the majority (98%) of study participants indicated a significant reduction in stress levels during the proposed VR session, the first step was to verify the possibility of recognizing the initial (higher stress levels) and final (reduced stress levels) states. Thus, two fragments of the signal waveforms were juxtaposed: the last 60 s from the Intro session and the first 60 s from the Finish session (just after the last BLS). From these fragments, a high-dimensional feature set, which initially consisted of 312 descriptors, was created. All the features were based on the outputs of both EEG and GSR sensors. More specifically, statistical characteristics such as mean, median, standard deviation, first and third quartiles, kurtosis, and skewness were determined from all outputs. Since the final set contained 1.2% missing data, an argumentation with the average/most frequent value was performed. Then, several different selection methods were juxtaposed to minimize the feature set: one wrapper method (Sequential Forward Selection, SFS), one filter method (Mutual Information, MI), and one embedded method (LASSO). The methods were implemented with preliminary feature correlation analysis, which rejected features with a degree of correlation higher than 0.8. This operation reduced the initial set size from 312 to 108. The selected features, listed in the ranking order, are presented in Figure 6. Since none of the classifiers achieved maximum accuracy performance with a set of more than 20 features, the table is limited to this number.
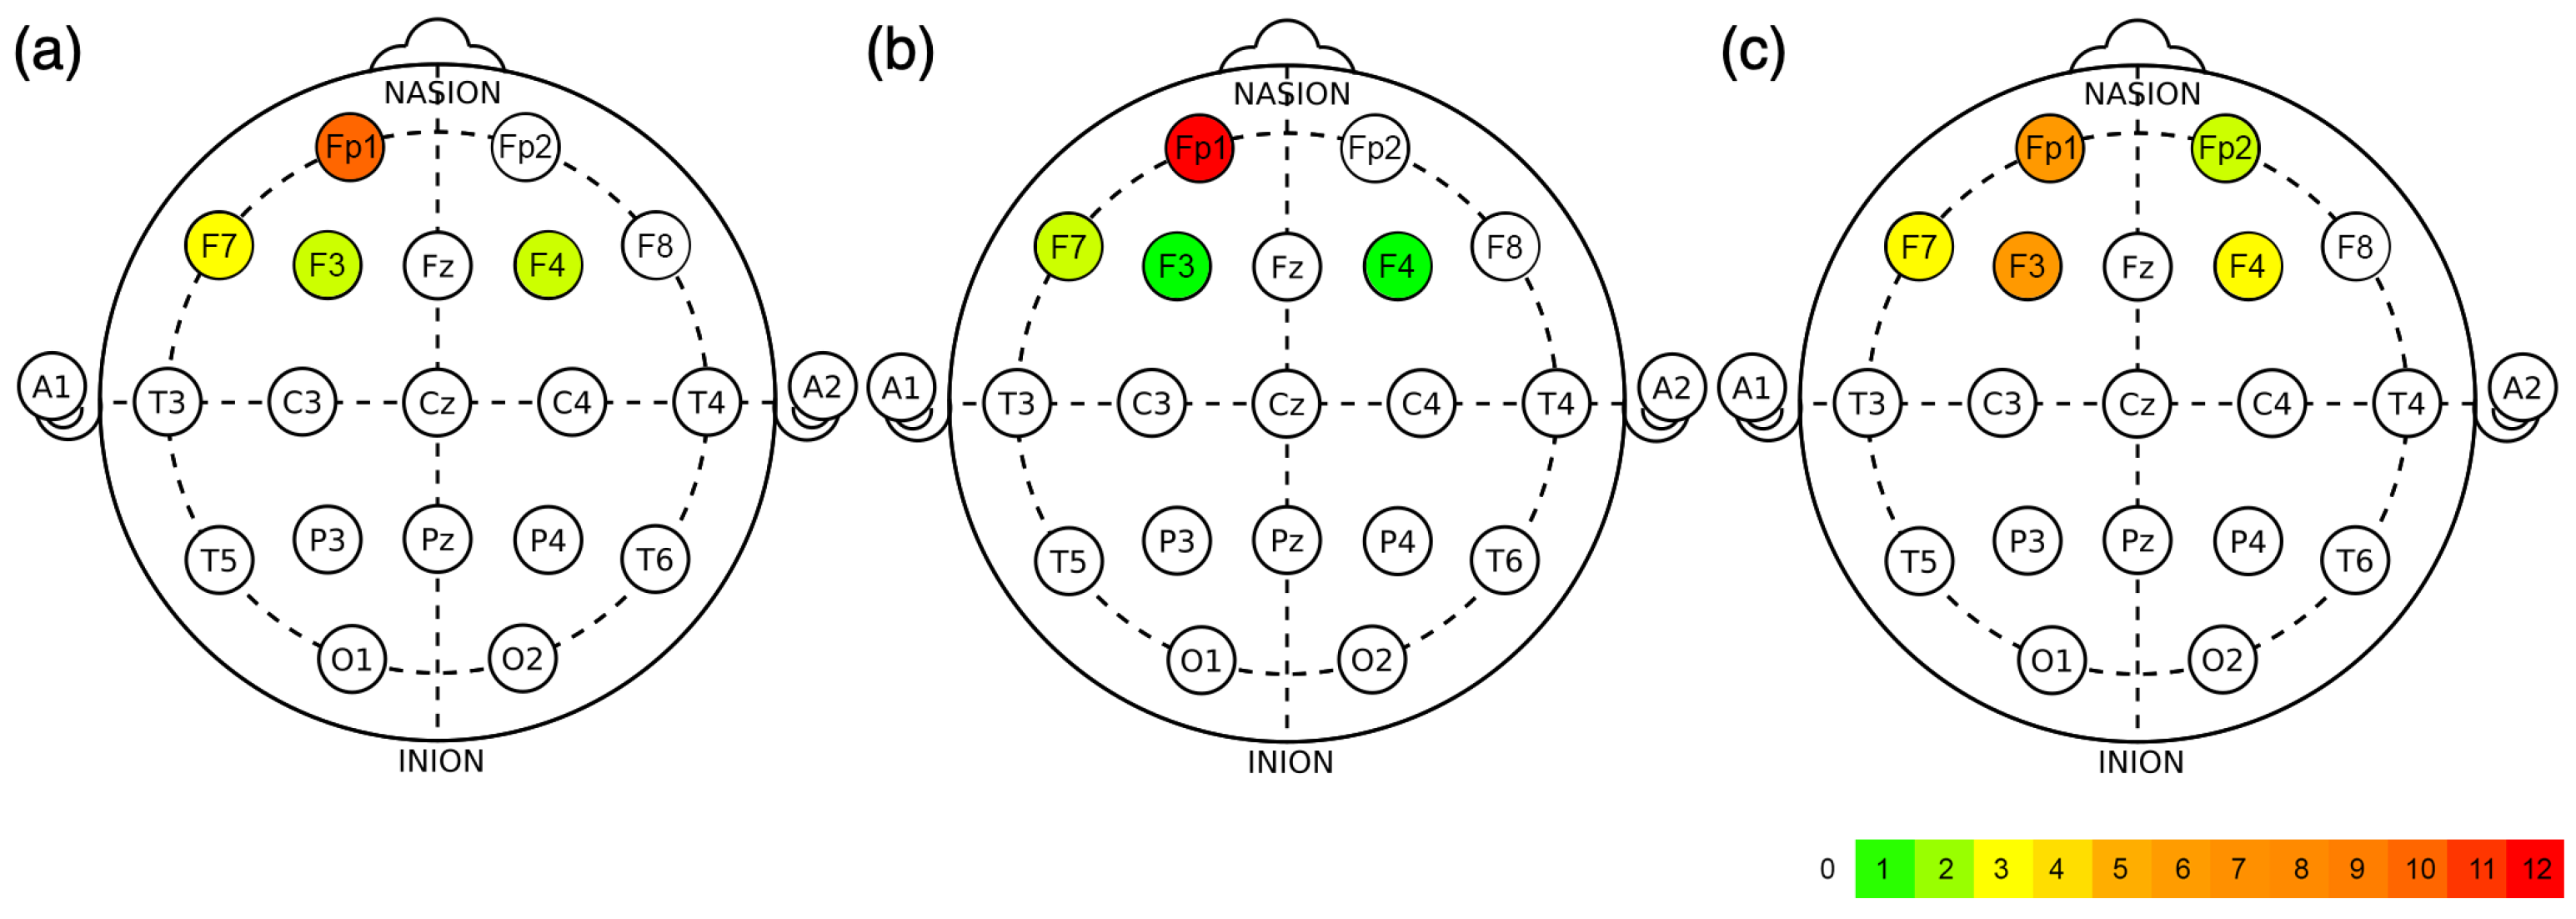
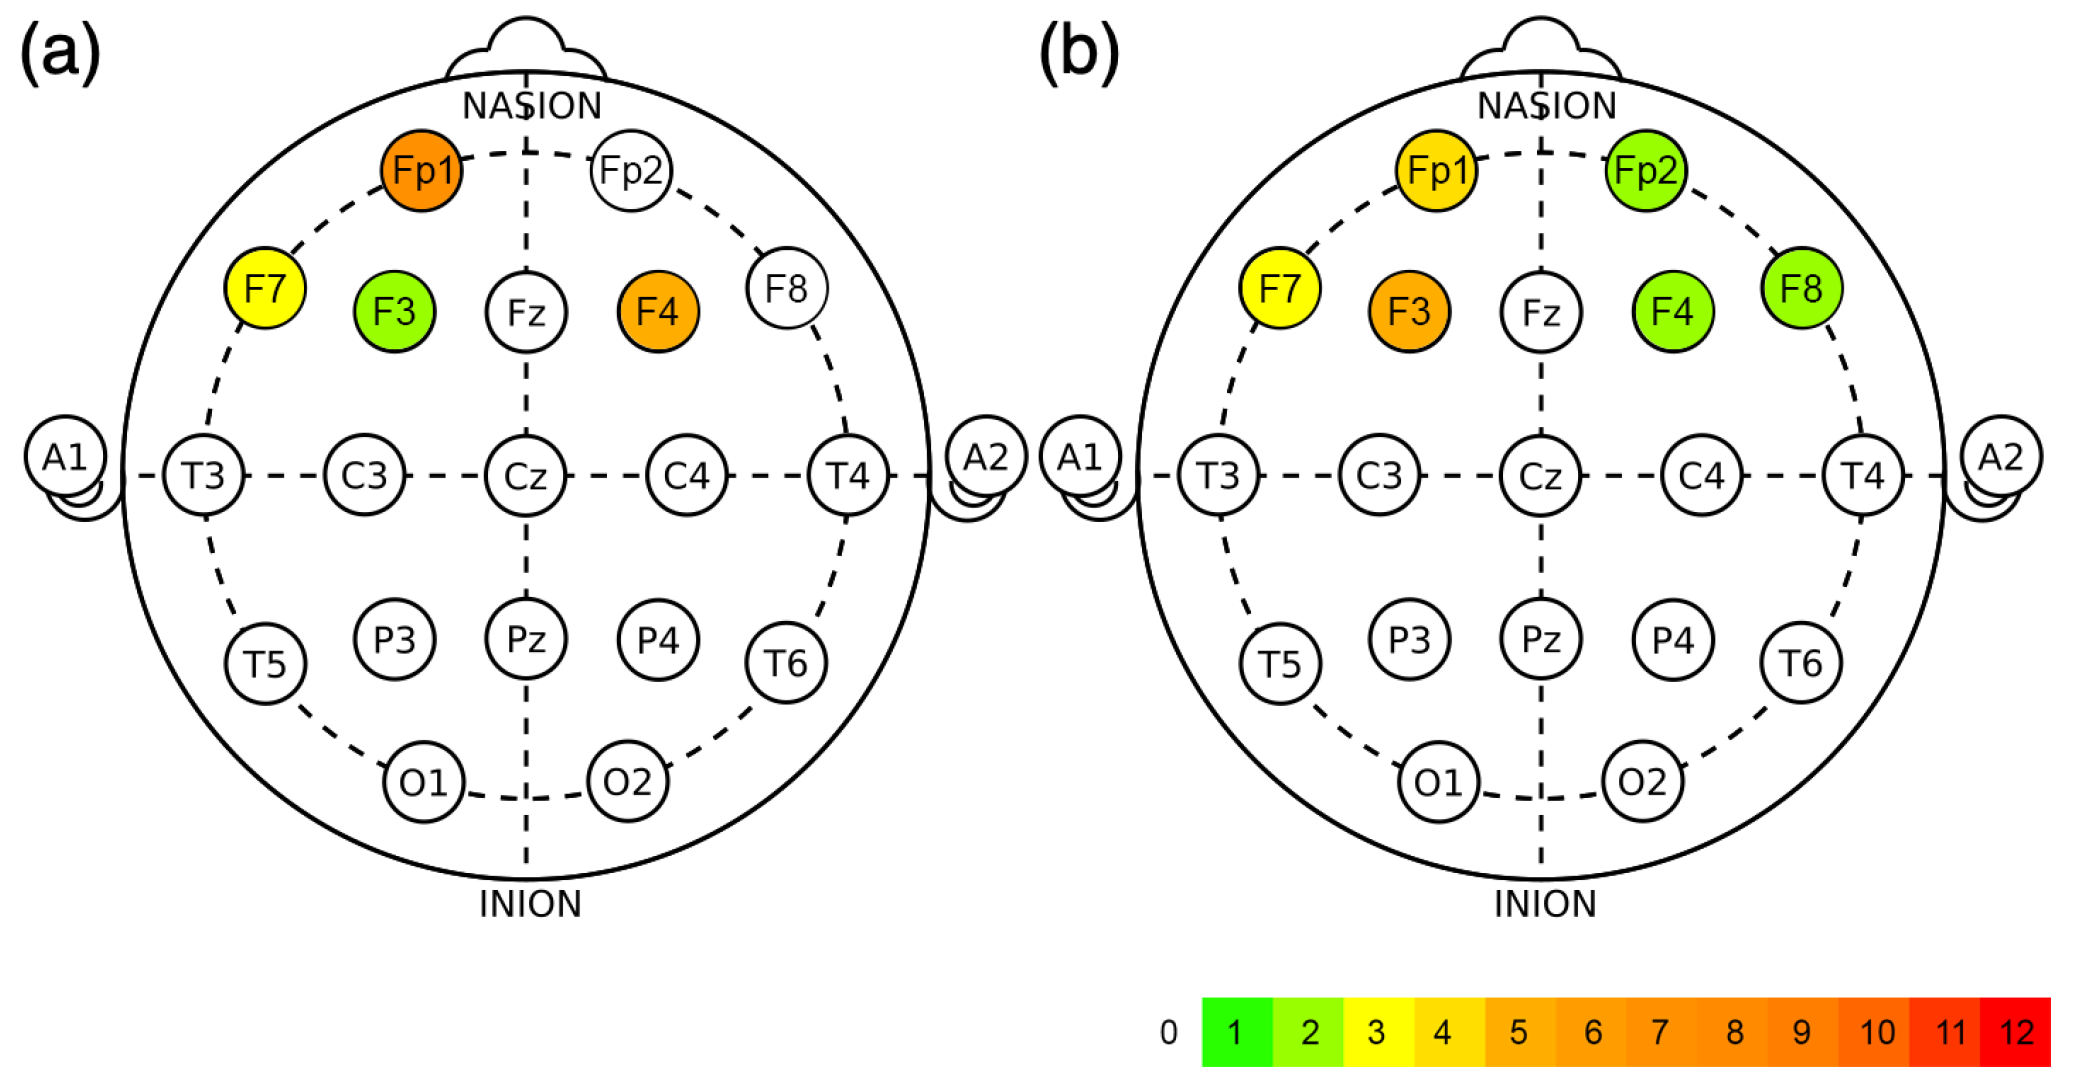
As can be noticed in the case of the SFS and MI methods, 80% of the features overlap. In contrast, for the LASSO method, the similarity of the sets is much lower, amounting to 35% and 45% with the SFS and MI methods, respectively. It should also be noted that the first two methods rank quite high for GSR-related features not present in the LASSO set. The distribution of EEG-based features derived from specific electrodes is shown in Figure 7. The most frequently chosen features come from the left hemisphere from electrodes Fp1, F7, and F3 for each selection method.
Next, five different classifiers (k-NN [25], AdaBoost [26], Random Forest RF [27], multilayer perceptron MLP [28]: 200 neurons in hidden layers, activation function ReLu, and CN2 induction algorithm [29]) with previously mentioned feature selection methods were employed. Each model’s parameters were chosen experimentally to maximize the results. Tests were performed using 10-fold cross-validation. The results are presented in Table 3.
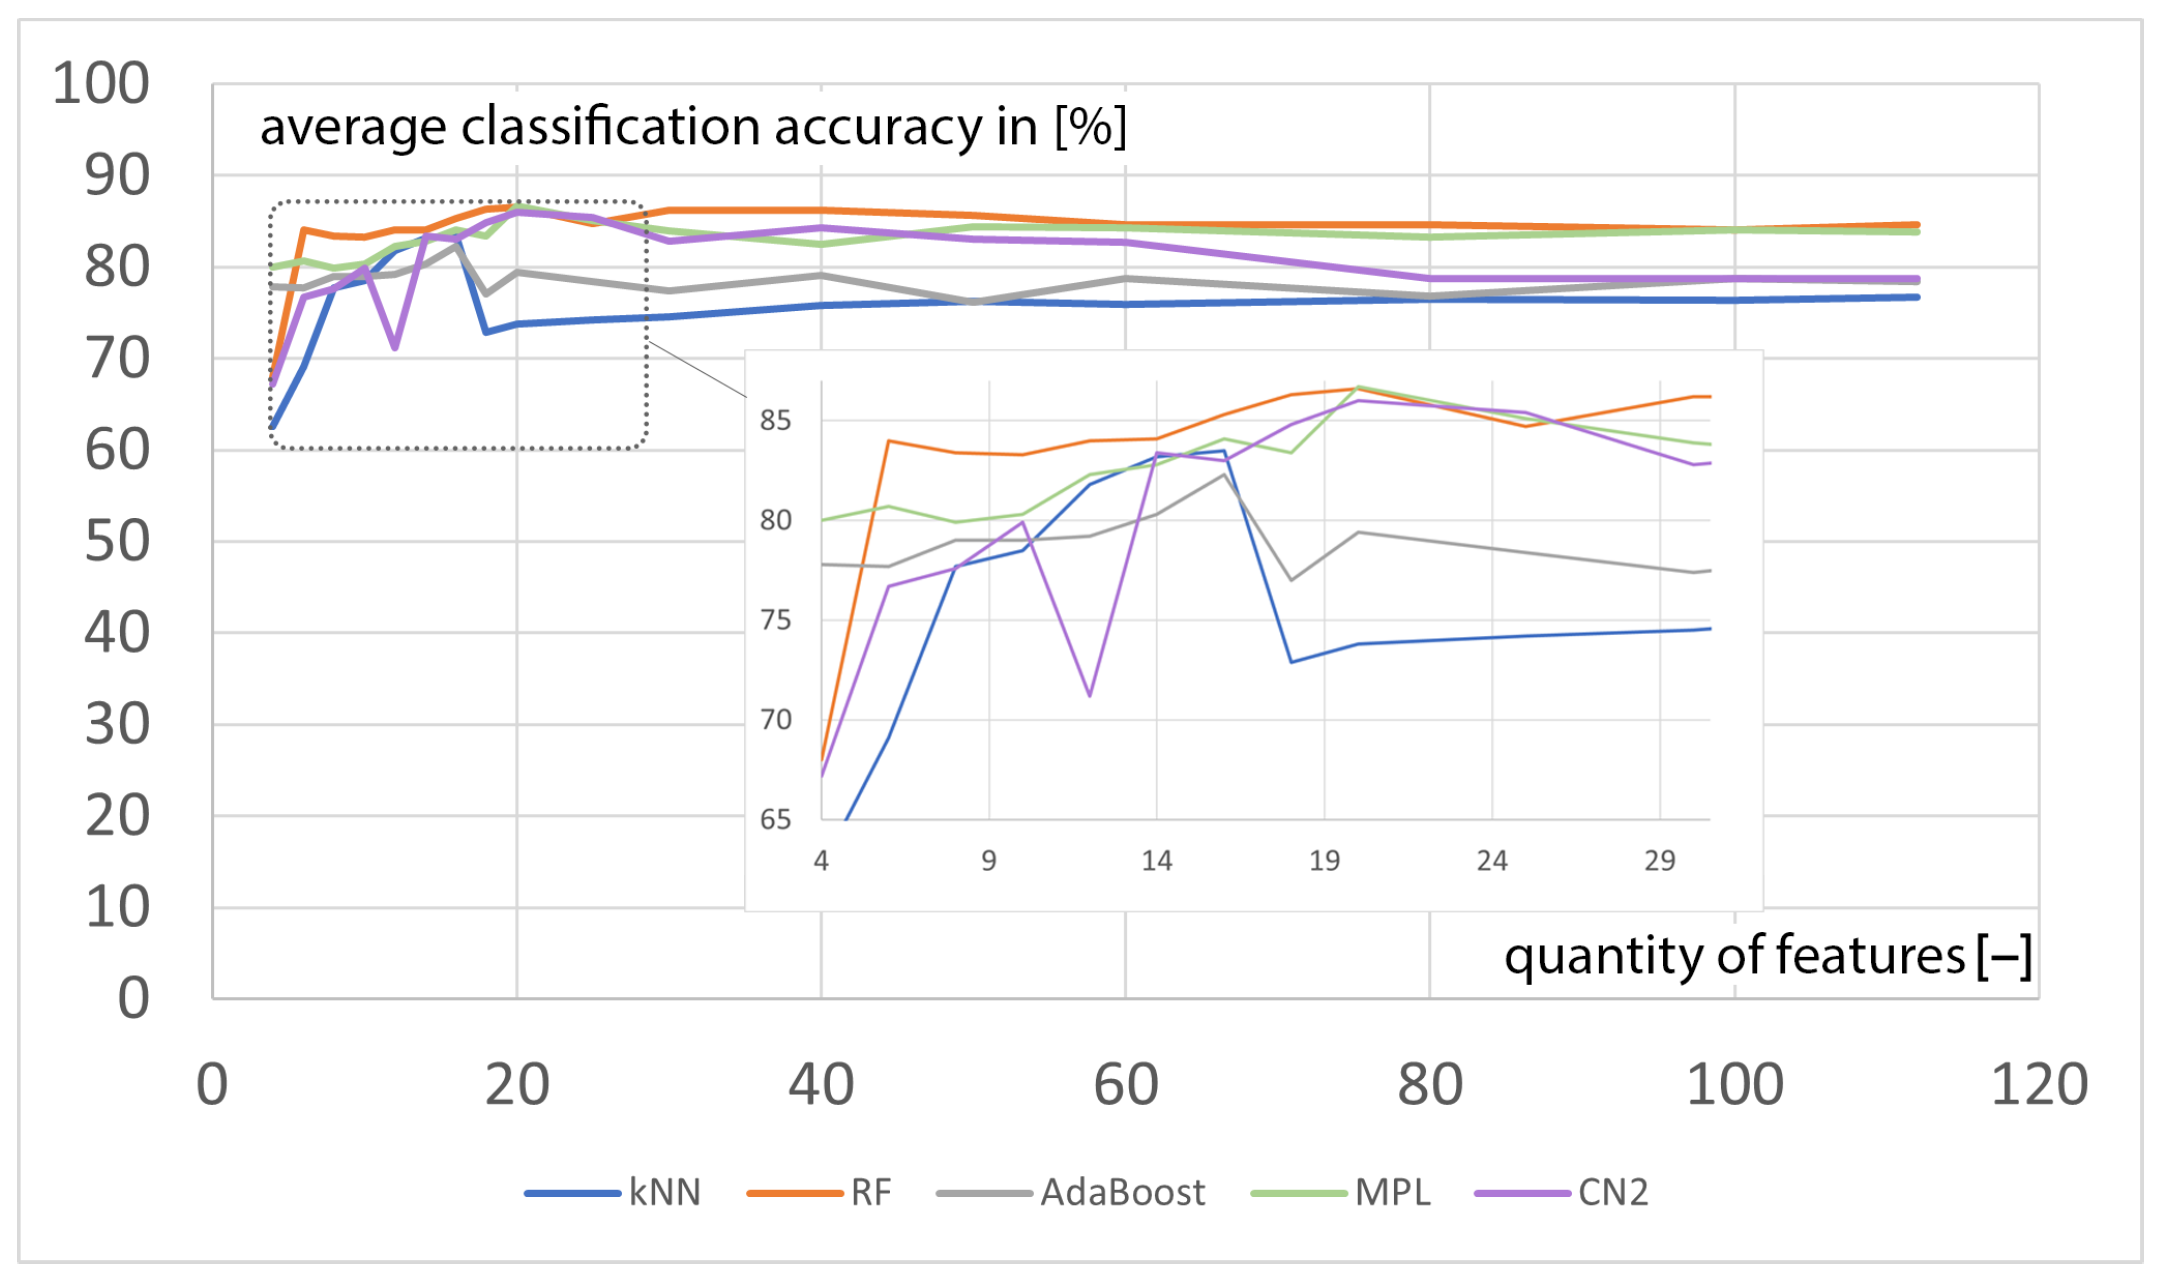
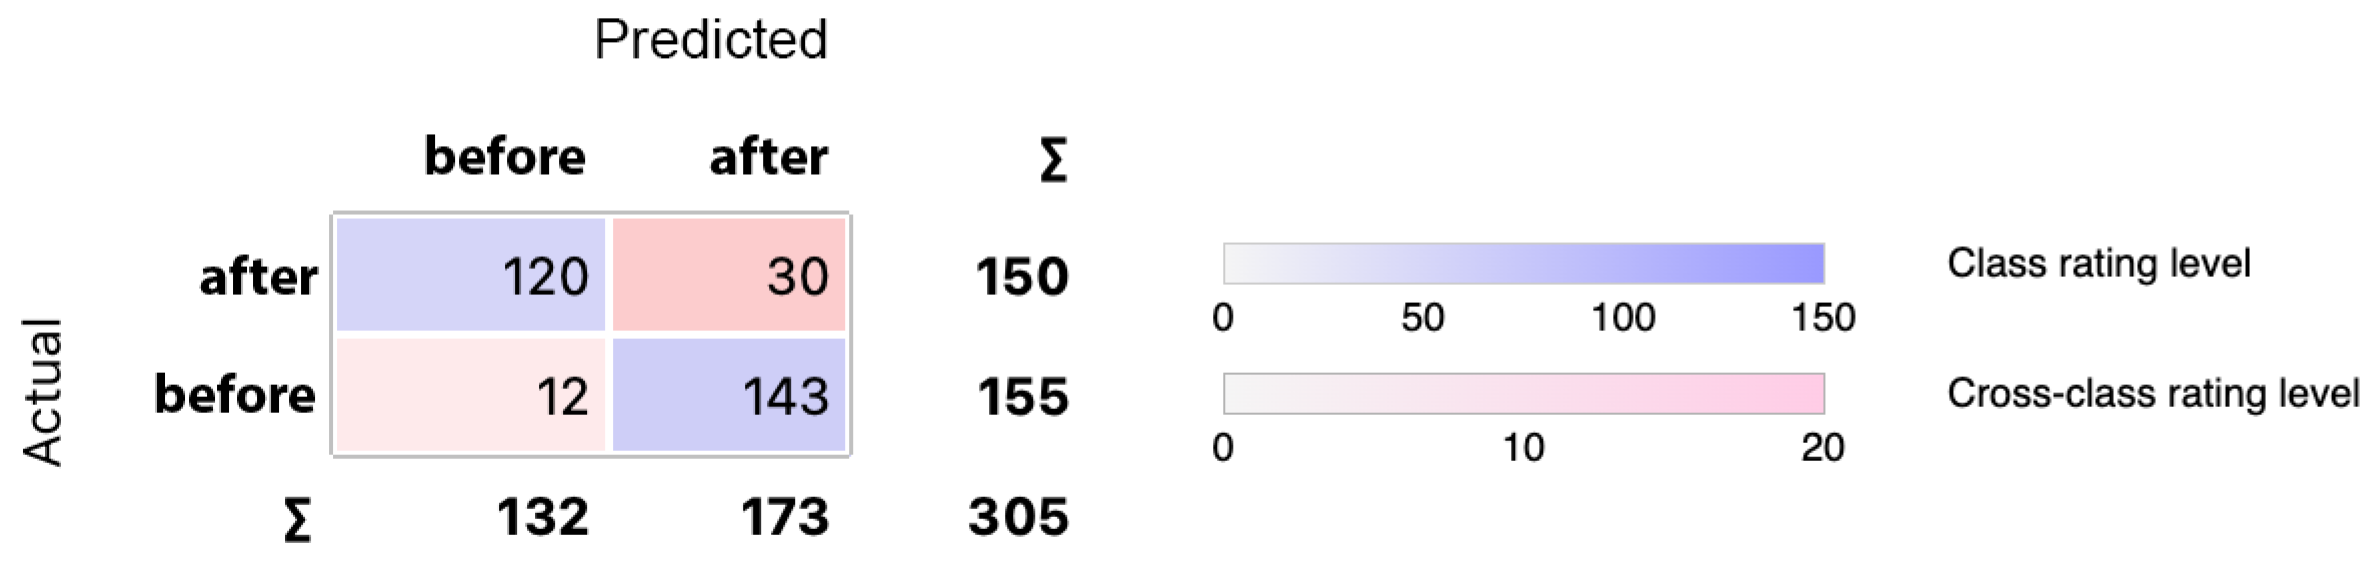
MLP yielded the most favorable outcomes when distinguishing between two states: before and after relaxation. The impact of feature selection methods on the quality of classification was minimal for SFS and MI. For LASSO, the classification drops by more than 8%. When considering SFS and MI, the results were comparable, reaching an accuracy level of 86%. Figure 8 illustrates the correlation between the number of features and the classification outcomes achieved through the SFS selection method for two classes. Furthermore, Figure 9 depicts the confusion matrix for MLP and SFS selection.
3.2. Stress Level Analysis Based on Participants Labels
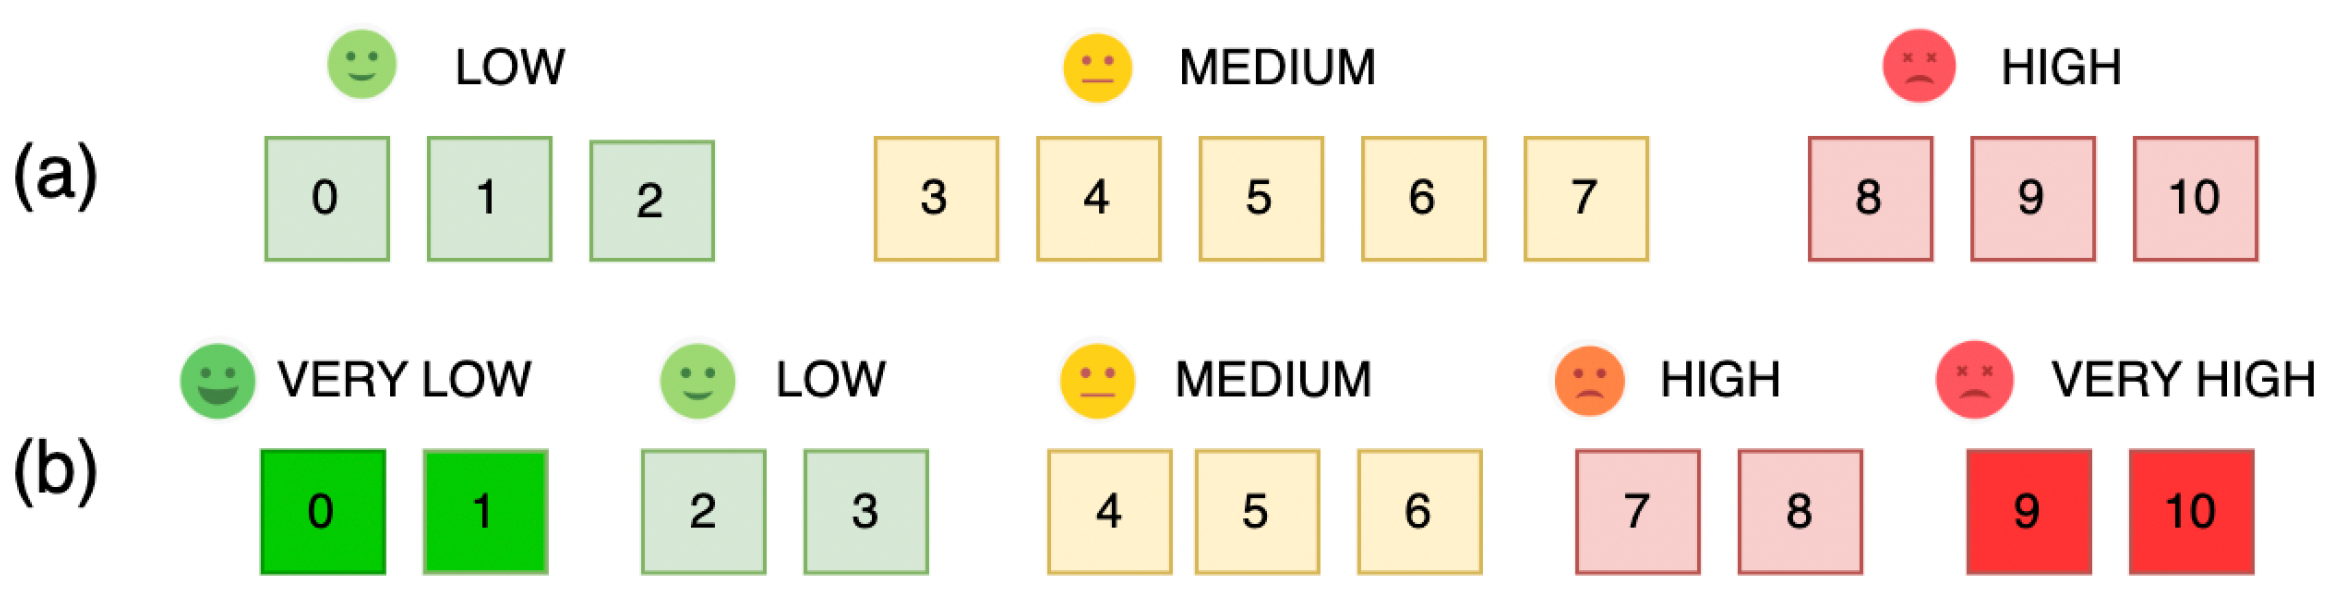
At this stage, subjective ratings given before and after the survey by the participants were used to identify the stress level. Since the questionnaire answer range was set from 0 to 10, to allow successful classification the adjacent answers were grouped in classes. This solution has been tested for two cases, three and five classes, as illustrated in Figure 10.
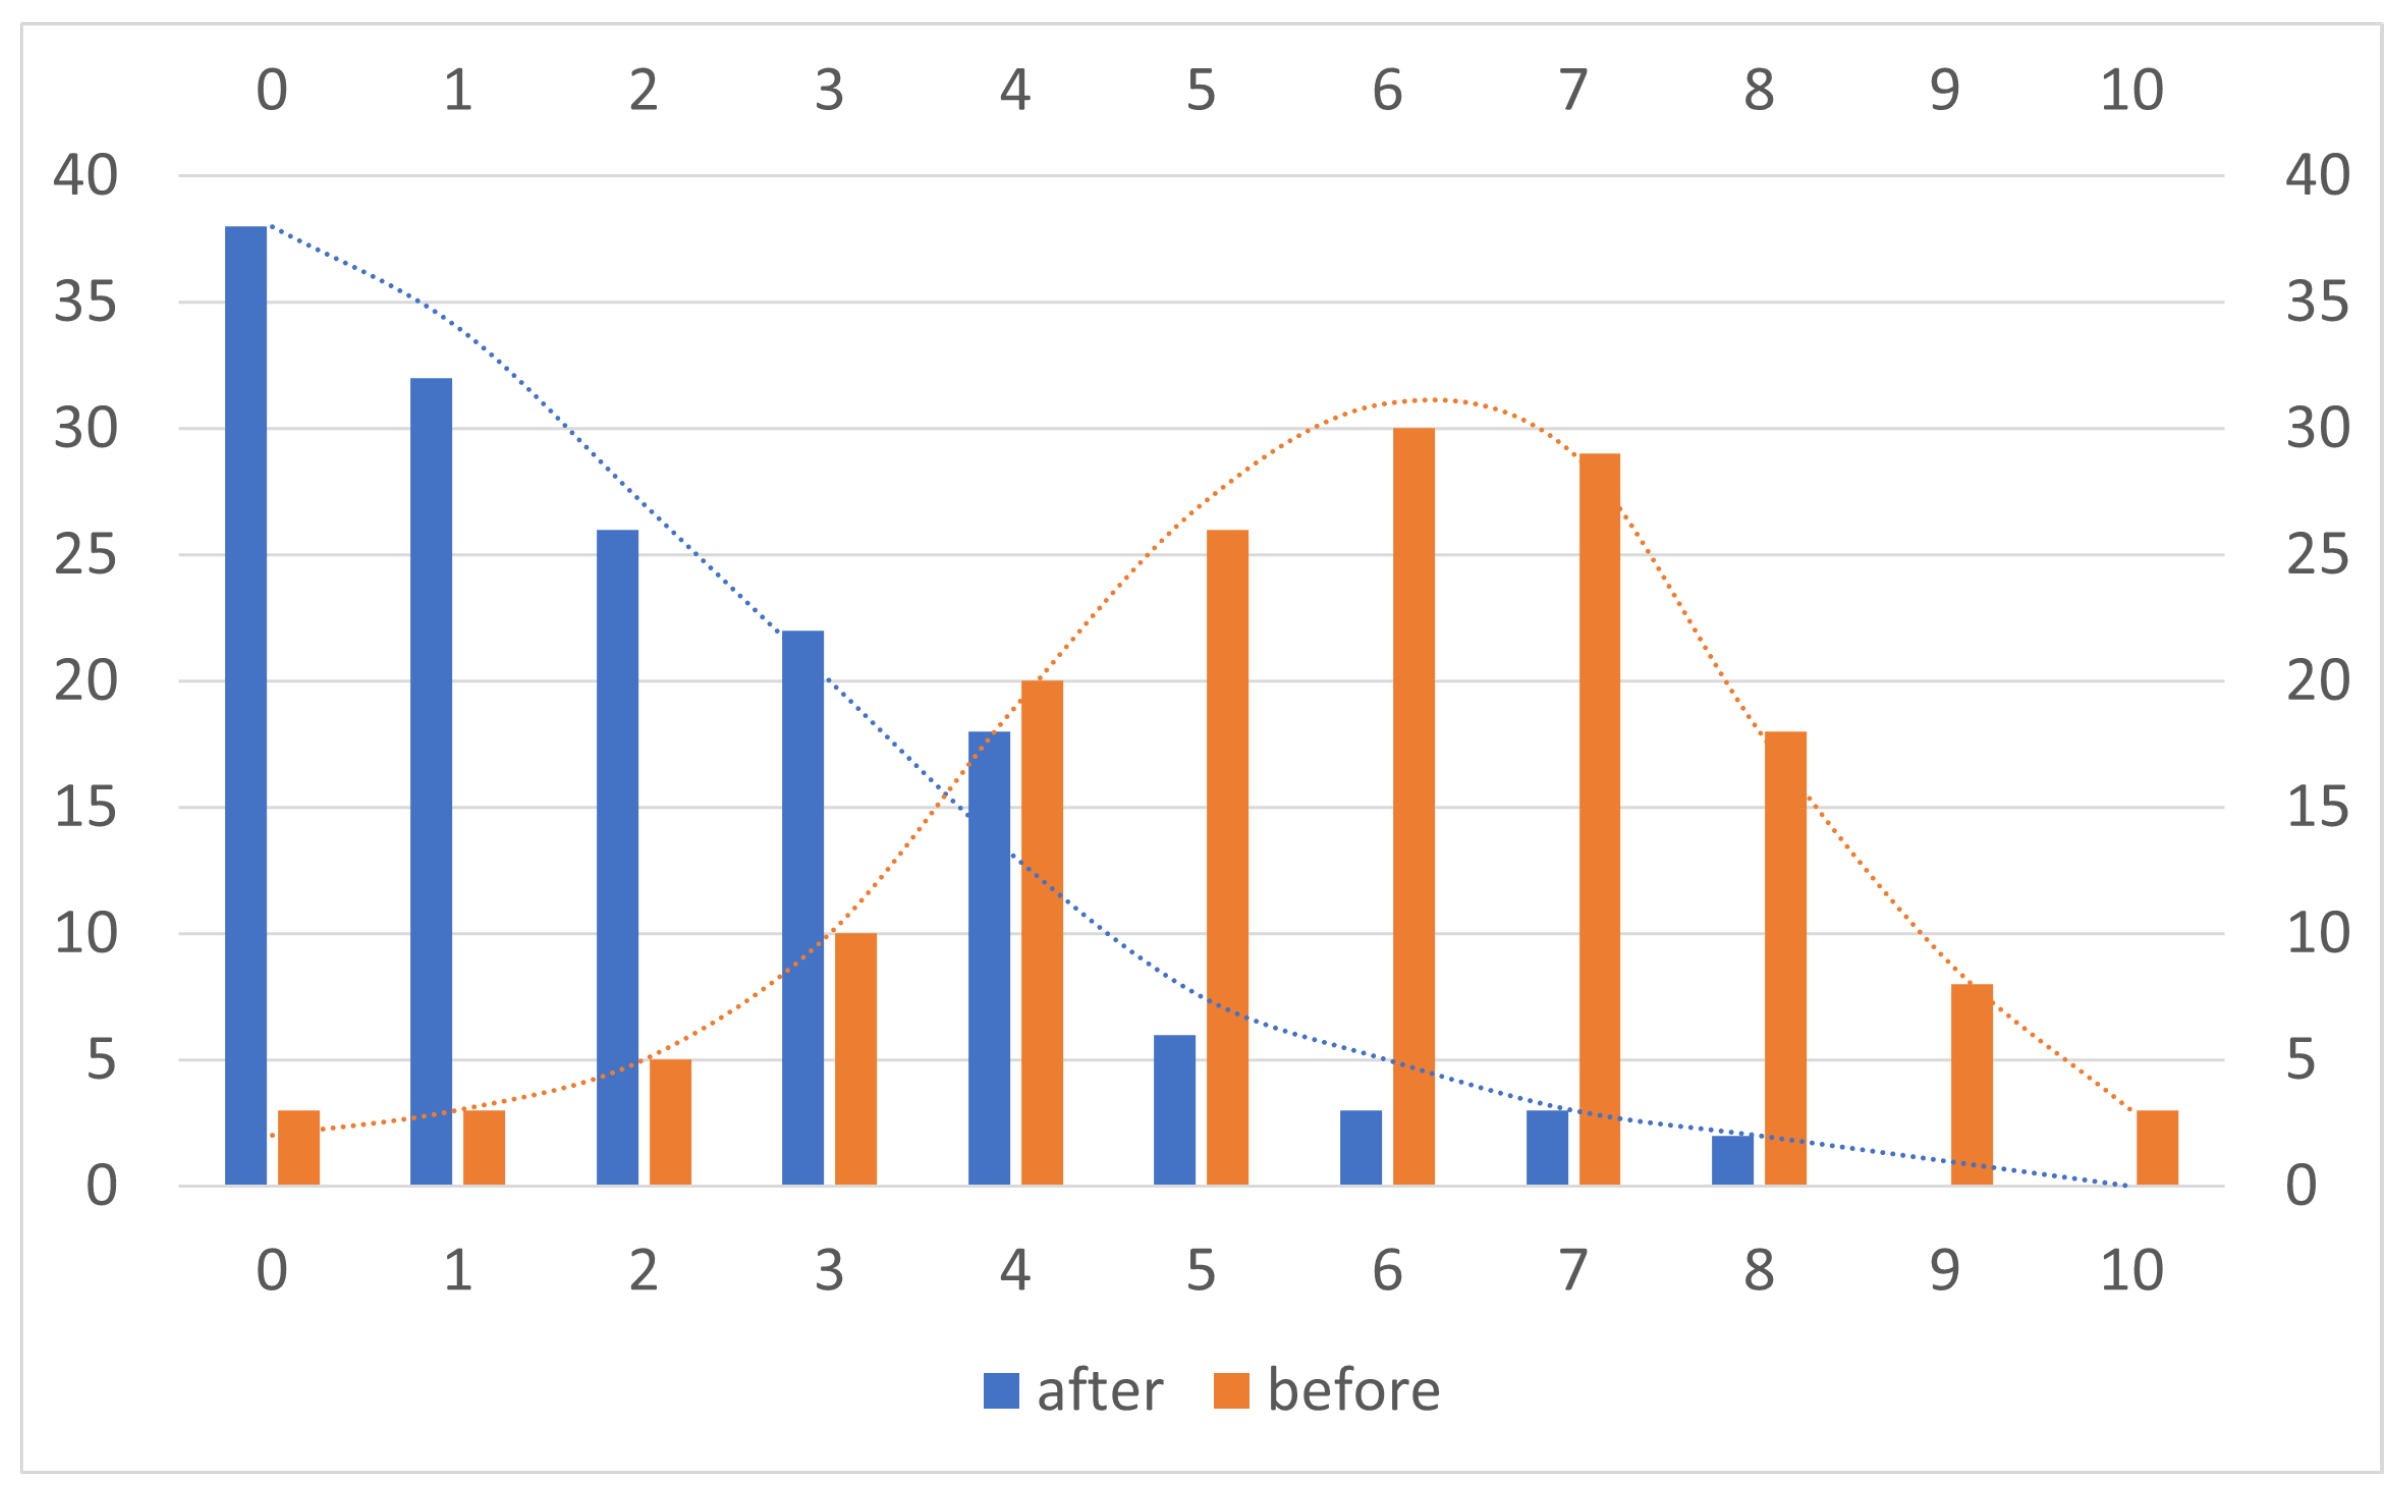
Thus, in the first case, if a participant identified their overall stress in the range of 0 to 3, it was marked as low, 4 to 7 as medium, and 8 to 10 as high. In the second case, a division was made into five ranges, and so if a participant defined their overall stress in the range of 0 to 1, it was marked as very low, 2 to 3 as low, 4 to 6 as medium, 7 to 8 as high, and 9 to 10 as very high. The distribution of labels obtained from participants before and after the session is presented in Figure 11.
Similar to the previous case, different feature selection methods were used, and the results of the various classification methods were compared. The results obtained are shown in Table 4 and Table 5 for three and five classes, respectively.
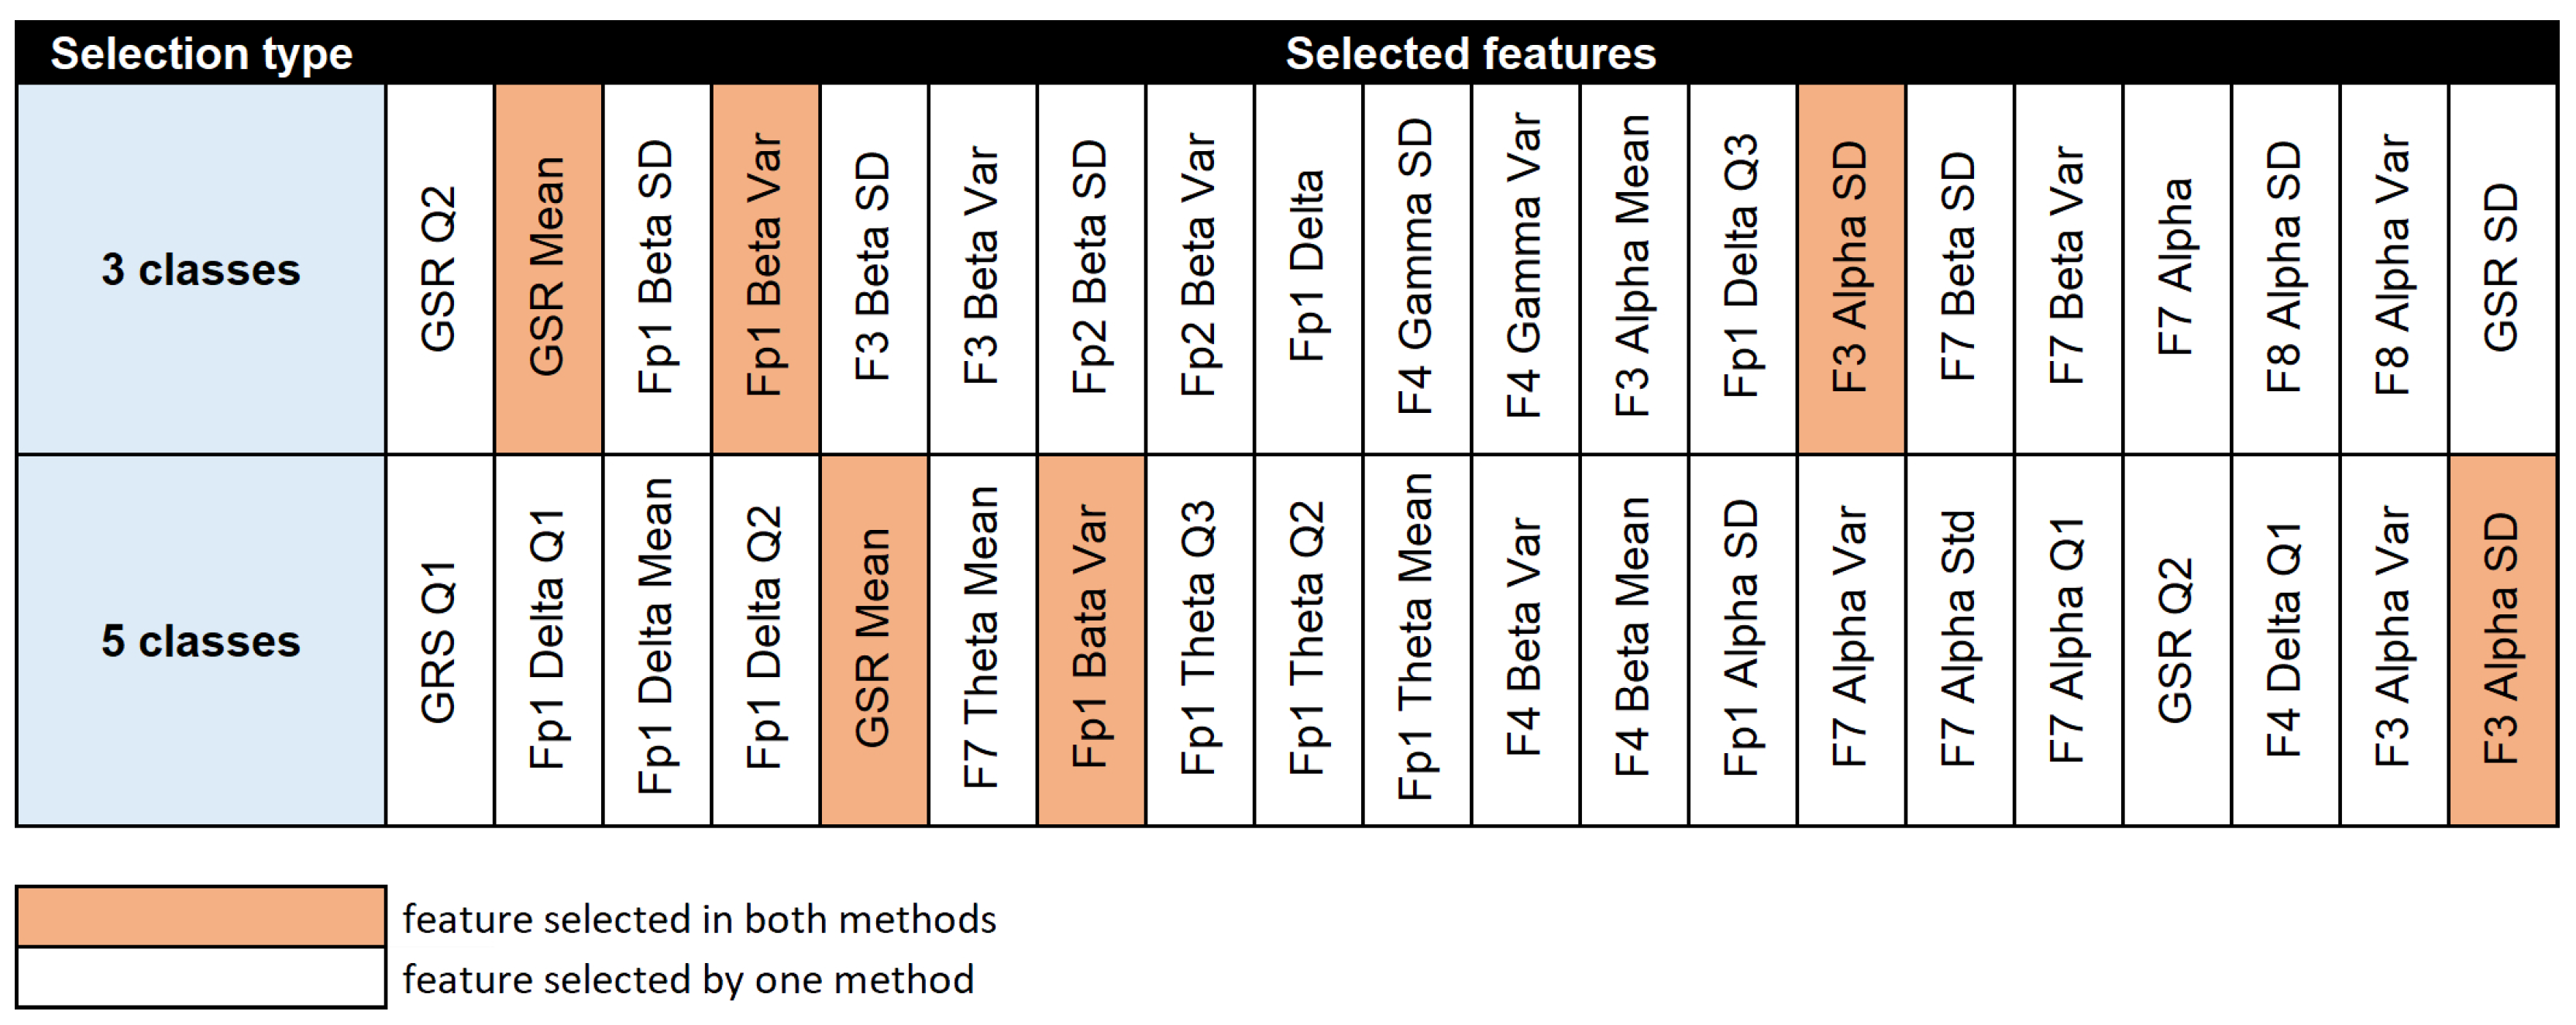
As for two-class recognition, the highest classification quality was in the 16–20 descriptor range. Therefore, Figure 12 refers only to the top 20 features (listed in ranking order). The results present descriptors selected by the SFS method. The distribution of EEG-based features derived from specific electrodes is shown in Figure 13.
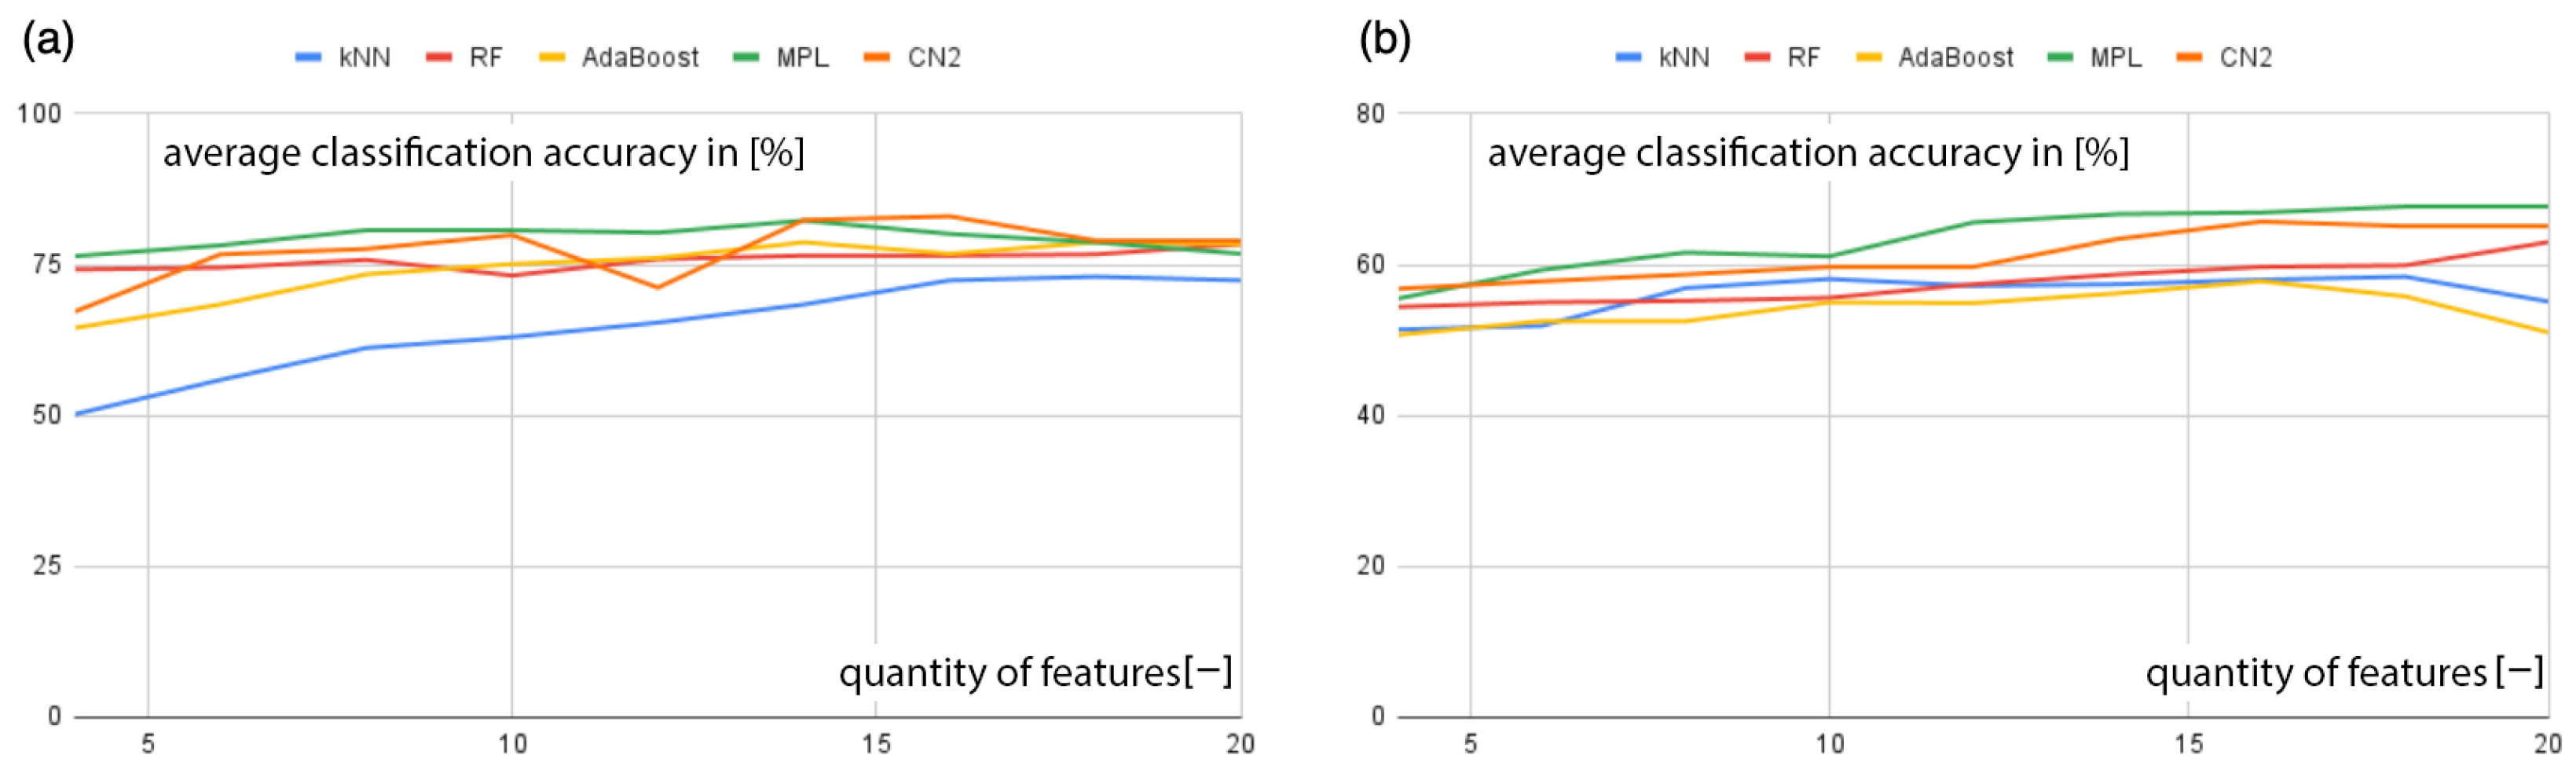
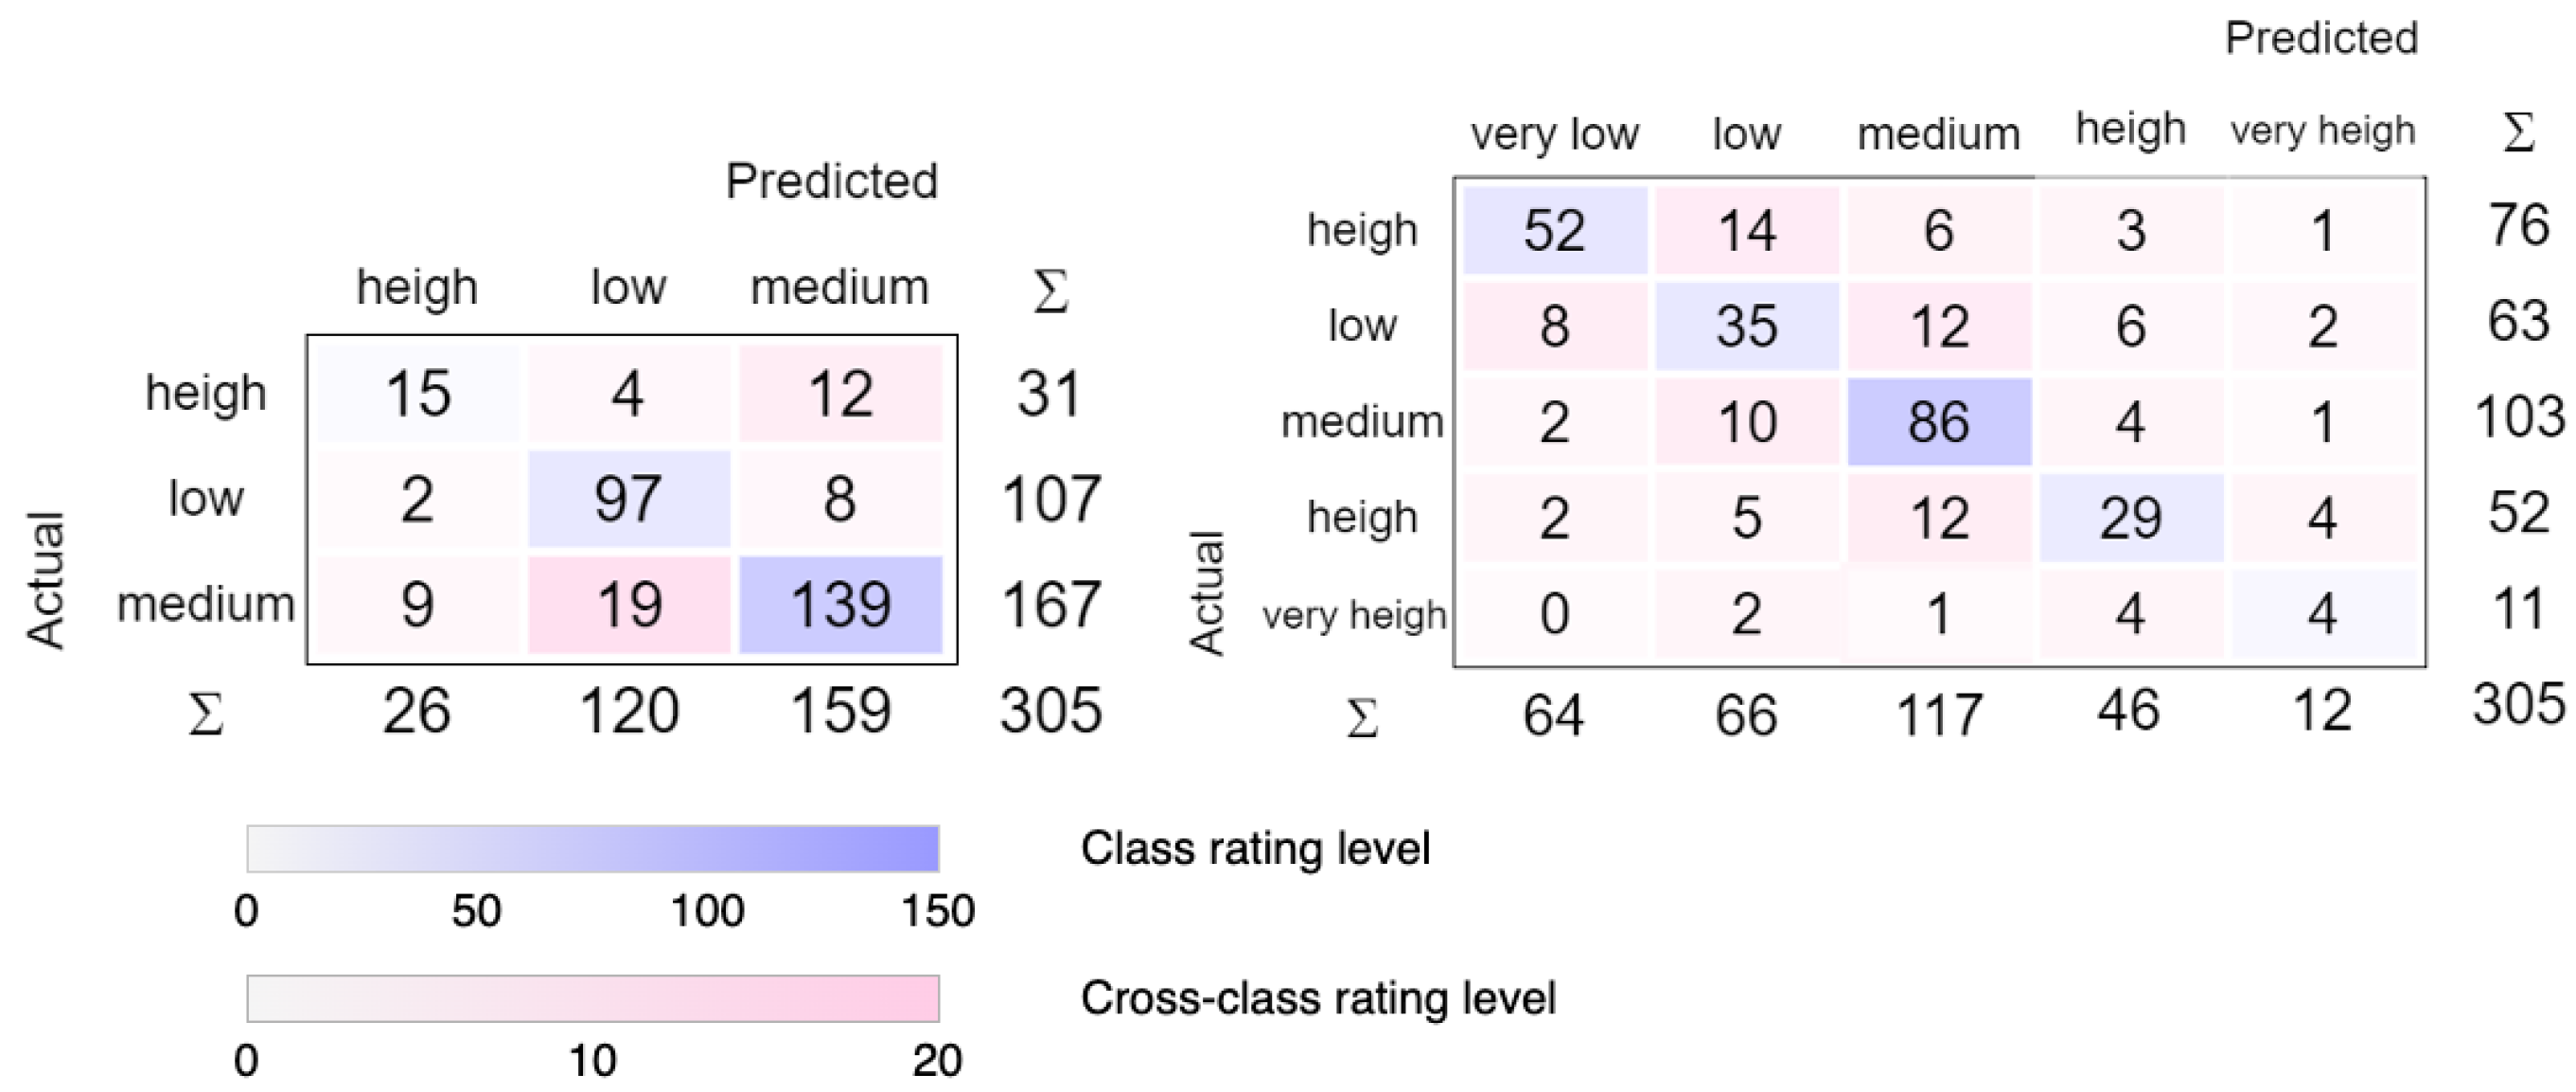
For three classes in Figure 14, the best performance was achieved by the MLP and CN2 algorithms, reaching an accuracy of 82.3%. Similarly to the previous case, the chosen feature selection method exhibited minimal influence on the outcomes, resulting in a mere 2% variation. Upon partitioning the data into four distinct classes, the algorithms exhibited comparable behavior, albeit with a noticeable decline in recognition accuracy. The highest achievement was recorded by MLP with SFS, yielding 67.7% accuracy, which signifies a high deterioration in performance compared to the three-class classification. Figure 15 depicts the confusion matrix for MLP and SFS selection for both cases.
4. Discussion and Conclusions
This paper explores the feasibility of classifying stress levels among refugees using an EEG/GRS dataset. The signals were extensively analyzed, emphasizing feature selection to predict stress across three scales. The findings suggest that it is possible to achieve a 67.7% accuracy in recognizing five stress classes. Notably, reducing the number of levels to three leads to a significant improvement, increasing the classification results by 14.6%. Furthermore, the study demonstrates the ability to discriminate between the psychical condition before and after the session with an accuracy of 86.7%.
The accuracy results obtained for both five and three classes fall short of meeting the requirements for implementing the proposed system as a reliable decision-support tool in real-world clinical applications. However, it is important to note that this limitation can be attributed, at least partially, to the limited size of the training dataset, particularly due to the uneven distribution of subjective labels. Participants’ subjective evaluation of their stress levels can introduce ambiguity in the dataset. Utilizing a 0 to 10 scale may prove challenging for humans to determine accurately, and this can lead to difficulties in effectively training the algorithm. In this case, a scale ranging from 1 to 5 would have been preferable. Additionally, there were issues with the equipment used in the study, as it sometimes disconnected during the sessions. Consequently, the number of complete samples available for analysis was significantly reduced compared to the number of participants involved and the number of sessions conducted. This equipment-related problem posed an additional challenge in achieving reliable and robust results.
However, the system demonstrates a high level of reliability in distinguishing between states before and after the session, indicating the positive influence of the system on participants. This assertion is further supported by the participants’ subjective opinions, which align with the system outcomes. Additionally, the recordings were captured in an authentic environment amidst a challenging group of individuals and with background noise. These factors make this particular database highly valuable for research and analysis purposes.
The successful integration of machine learning methods for identifying and classifying stress levels holds great promise in quantifying therapy response. To further enhance the accurate discrimination of stress levels, incorporating additional information alongside EEG/GRS features shows potential. This augmentation can improve classification performance, enabling monitoring systems to predict treatment response. As a result, the entire framework can be deployed as a decision support system for psychologists, offering valuable insights and aiding in treatment planning.
Funding
The research leading to these results has received partial funding from the Polish National Science Centre (NCN) in the framework of the Miniatura project [2020/04/X/ST6/00841].
Institutional Review Board Statement
The study was conducted in accordance with the Declaration of Helsinki, and approved by the Ethics Committee of Łódź University of Technology (resolution no. 3/2021, dated 21 October 2021).
Informed Consent Statement
Informed consent was obtained from all subjects involved in the study.
Data Availability Statement
Not applicable.
Conflicts of Interest
The authors declare no conflict of interest.
References
- Tan, S. Yip A. Hans Selye (1907–1982): Founder of the stress theory. Singap. Med. J. 2018, 59, 170–171. [Google Scholar] [CrossRef] [PubMed]
- Selye, H. The stress concept. Can. Med. Assoc. J. 1976, 115, 718. [Google Scholar] [PubMed]
- Hutmacher, F. Putting Stress in Historical Context: Why it is important that being stressed out was not a way to be a person 2000 years ago. Front. Psychol. 2021, 12, 539799. [Google Scholar] [CrossRef] [PubMed]
- Marmot, M.; Friel, S.; Bell, R.; Houweling, T.A.; Taylor, S. Closing the gap in a generation: Health equity through action on the social determinants of health. Lancet 2008, 372, 1661–1669. [Google Scholar] [CrossRef]
- Yaribeygi, H.; Panahi, Y.; Sahraei, H.; Johnston, T.P.; Sahebkar, A. The impact of stress on body function: A review. EXCLI J. 2017, 16, 1057. [Google Scholar]
- Hammen, C. Stress and depression. Annu. Rev. Clin. Psychol. 2005, 1, 293–319. [Google Scholar] [CrossRef]
- Tsigos, C.; Kyrou, I.; Kassi, E.; Chrousos, G.P. Stress: Endocrine physiology and pathophysiology. In Endotext [Internet]; MDText.com, Inc.: South Dartmouth, MA, USA, 2020. [Google Scholar]
- Bracha, H.S.; Ralston, T.C.; Matsukawa, J.M.; Williams, A.E.; Bracha, A.S. Does “fight or flight” need updating? Psychosomatics 2004, 45, 448–449. [Google Scholar] [CrossRef]
- Bryant, R.A. Acute stress disorder. Curr. Opin. Psychol. 2017, 14, 127–131. [Google Scholar] [CrossRef]
- Wheaton, B. The nature of stressors. In A Handbook for the Study of Mental Health: Social Contexts, Theories, and Systems; Cambridge University Press: Cambridge, UK, 1999. [Google Scholar]
- Mazure, C.M. Life stressors as risk factors in depression. Clin. Psychol. Sci. Pract. 1998, 5, 291. [Google Scholar] [CrossRef]
- Spielman, R.M.; Dumper, K.; Jenkins, W.; Lacombe, A.; Lovett, M.; Perlmutter, M. What Is Psychology? In Psychology-H5P Edition; Rice University: Houston, TA, USA, 2021. [Google Scholar]
- Malchrzak, W.; Babicki, M.; Pokorna-Kałwak, D.; Doniec, Z.; Mastalerz-Migas, A. COVID-19 vaccination and Ukrainian refugees in Poland during Russian–Ukrainian war—Narrative review. Vaccines 2022, 10, 955. [Google Scholar] [CrossRef]
- Murphy, A.; Fuhr, D.; Roberts, B.; Jarvis, C.I.; Tarasenko, A.; McKee, M. The health needs of refugees from Ukraine. BMJ 2022, 377, o864. [Google Scholar] [CrossRef] [PubMed]
- Kamińska, D.; Smółka, K.; Zwoliński, G.; Wiak, S.; Merecz-Kot, D.; Anbarjafari, G. Stress reduction using bilateral stimulation in virtual reality. IEEE Access 2020, 8, 200351–200366. [Google Scholar] [CrossRef]
- Kamińska, D.; Smółka, K.; Zwoliński, G. Detection of mental stress through EEG signal in virtual reality environment. Electronics 2021, 10, 2840. [Google Scholar] [CrossRef]
- Tripp, T. A short term therapy approach to processing trauma: Art therapy and bilateral stimulation. Art Ther. 2007, 24, 176–183. [Google Scholar] [CrossRef]
- Cooper, R.; Osselton, J.W.; Shaw, J.C. EEG Technology; Butterworth-Heinemann: Oxford, UK, 2014. [Google Scholar]
- Montagu, J.; Coles, E.M. Mechanism and measurement of the galvanic skin response. Psychol. Bull. 1966, 65, 261. [Google Scholar] [CrossRef]
- Jurcak, V.; Tsuzuki, D.; Dan, I. 10/20, 10/10, and 10/5 systems revisited: Their validity as relative head-surface-based positioning systems. Neuroimage 2007, 34, 1600–1611. [Google Scholar] [CrossRef]
- Costa, R.; Gomes, P.V.; Correia, A.; Marques, A.; Pereira, J. The Influence of Brain Activity on the Interactive Process through Biofeedback Mechanisms in Virtual Reality Environments. Eng. Proc. 2021, 7, 15. [Google Scholar]
- Başar, E.; Güntekin, B. Review of delta, theta, alpha, beta, and gamma response oscillations in neuropsychiatric disorders. Suppl. Clin. Neurophysiol. 2013, 62, 303–341. [Google Scholar]
- Nagar, P.; Sethia, D. Brain mapping based stress identification using portable eeg based device. In Proceedings of the 2019 11th International Conference on Communication Systems & Networks (COMSNETS), Bengaluru, India, 7–11 January 2019; IEEE: Piscataway, NJ, USA, 2019; pp. 601–606. [Google Scholar]
- Bakker, J.; Pechenizkiy, M.; Sidorova, N. What is your current stress level? Detection of stress patterns from GSR sensor data. In Proceedings of the 2011 IEEE 11th International Conference on Data Mining Workshops, Vancouver, BC, Canada, 11 December 2011; IEEE: Piscataway, NJ, USA, 2011; pp. 573–580. [Google Scholar]
- Guo, G.; Wang, H.; Bell, D.; Bi, Y.; Greer, K. KNN model-based approach in classification. In Proceedings of the On The Move to Meaningful Internet Systems 2003: CoopIS, DOA, and ODBASE: OTM Confederated International Conferences, CoopIS, DOA, and ODBASE 2003, Catania, Sicily, Italy, 3–7 November 2003; Springer: Berlin/Heidelberg, Germany, 2003; pp. 986–996. [Google Scholar]
- Schapire, R.E. Explaining adaboost. In Empirical Inference: Festschrift in Honor of Vladimir N. Vapnik; Springer: Berlin/Heidelberg, Germany, 2013; pp. 37–52. [Google Scholar]
- Rigatti, S.J. Random forest. J. Insur. Med. 2017, 47, 31–39. [Google Scholar] [CrossRef]
- Noriega, L. Multilayer perceptron tutorial. Sch. Comput. Staffs. Univ. 2005, 4, 444. [Google Scholar]
- Clark, P.; Niblett, T. The CN2 induction algorithm. Mach. Learn. 1989, 3, 261–283. [Google Scholar] [CrossRef]
- Demšar, J.; Curk, T.; Erjavec, A.; Gorup, Č.; Hočevar, T.; Milutinovič, M.; Možina, M.; Polajnar, M.; Toplak, M.; Starič, A.; et al. Orange: Data mining toolbox in Python. J. Mach. Learn. Res. 2013, 14, 2349–2353. [Google Scholar]
Figure 1.
Architecture of an EEG/GRS-based system for stress level recognition.

Figure 2.
VR environment in the form of a cozy mountain apartment. The red sphere (first image) is moving from left to right during bilateral stimulation—the figure presents the sphere is trajectory.
Figure 2.
VR environment in the form of a cozy mountain apartment. The red sphere (first image) is moving from left to right during bilateral stimulation—the figure presents the sphere is trajectory.

Figure 3.
Scenario of the VR application. The relaxation session contains eight consecutive periods of 90 s of BLS, followed by 30 s break (without BLS).
Figure 3.
Scenario of the VR application. The relaxation session contains eight consecutive periods of 90 s of BLS, followed by 30 s break (without BLS).

Figure 4.
Looxid Link EEG electrode placement.

Figure 5.
An example of a GSR waveform recorded for a random participant during the relaxation session.
Figure 5.
An example of a GSR waveform recorded for a random participant during the relaxation session.

Figure 6.
The selected features listed in the ranking order obtained with three different methods (SFS, MI, and LASSO).
Figure 6.
The selected features listed in the ranking order obtained with three different methods (SFS, MI, and LASSO).

Figure 7.
The distribution of EEG-based features derived from specific electrodes: (a) SFS, (b) MI, (c) LASSO.
Figure 7.
The distribution of EEG-based features derived from specific electrodes: (a) SFS, (b) MI, (c) LASSO.

Figure 8.
The relationship between the number of features and the classification results—results for two classes with features selected by SFS method.
Figure 8.
The relationship between the number of features and the classification results—results for two classes with features selected by SFS method.

Figure 9.
Confusion matrix for MLP and SFS selection for two classes. The correctly classified instances are highlighted in violet. Confusion matrix generated by Orange Data Mining [30].
Figure 9.
Confusion matrix for MLP and SFS selection for two classes. The correctly classified instances are highlighted in violet. Confusion matrix generated by Orange Data Mining [30].

Figure 10.
Division of the stress scale (a) three levels (classes: low, medium, high) (b) five levels (classes: very low, low, medium, high, very high).
Figure 10.
Division of the stress scale (a) three levels (classes: low, medium, high) (b) five levels (classes: very low, low, medium, high, very high).

Figure 11.
The distribution of labels obtained from participants before and after the session.

Figure 12.
The selected features listed in the ranking order obtained for three- and five-stress-level classifications with SFS.
Figure 12.
The selected features listed in the ranking order obtained for three- and five-stress-level classifications with SFS.

Figure 13.
The distribution of EEG-based features derived from specific electrodes: (a) for three-classes recognition, and (b) two-classes recognition.
Figure 13.
The distribution of EEG-based features derived from specific electrodes: (a) for three-classes recognition, and (b) two-classes recognition.

Figure 14.
The relationship between the number of features and the classification results. Results for three (a) and four classes (b) with features selected by SFS method.
Figure 14.
The relationship between the number of features and the classification results. Results for three (a) and four classes (b) with features selected by SFS method.

Figure 15.
Confusion matrix for MLP and SFS selection for three and five classes. Confusion matrices generated by Orange Data Mining [30].
Figure 15.
Confusion matrix for MLP and SFS selection for three and five classes. Confusion matrices generated by Orange Data Mining [30].


Table 1.
Participant characteristics.
| Partic. | #1 | #2 | #3 | #4 | #5 | #6 | #7 | #8 | #9 | #10 | #11 | #12 | #13 | #14 | #15 | #16 | #17 | #18 | #19 | #20 |
| Sex | F | F | F | F | F | F | F | F | F | F | F | F | F | F | F | F | F | F | F | M |
| Age | 31 | 24 | 29 | 46 | 26 | 33 | 28 | 40 | 41 | 24 | 31 | 22 | 32 | 45 | 52 | 54 | 31 | 31 | 71 | 35 |
| Partic. | #21 | #22 | #23 | #24 | #25 | #26 | #27 | #28 | #29 | #30 | #31 | #32 | #33 | #34 | #35 | #36 | #37 | #38 | #39 | #40 |
| Sex | F | F | F | F | F | F | F | F | F | F | F | M | F | F | F | F | M | F | F | M |
| Age | 47 | 35 | 35 | 31 | 22 | 44 | 45 | 35 | 58 | 45 | 36 | 19 | 39 | 33 | 39 | 44 | 38 | 31 | 51 | 20 |
| Partic. | #41 | #42 | #43 | #44 | #45 | #46 | #47 | #48 | #49 | #50 | #51 | #52 | #53 | #54 | #55 | |||||
| Sex | F | F | F | F | F | F | F | F | F | F | F | F | F | F | F | |||||
| Age | 19 | 24 | 31 | 25 | 46 | 32 | 23 | 28 | 31 | 24 | 35 | 39 | 39 | 57 | 36 |
Table 2.
Data generated at the output of Looxid Link.
| Data Type | Description |
|---|---|
| TimeStamp | The moment in time when specific data was recorded during the session; on average, 90 entries per second; |
| leftActivity | A marker indicating the activity of the left hemisphere of the brain, calculated from sensors located on the left side of the prefrontal cortex (an algorithm built in Looxid Link); |
| rightActivity | A marker indicating the activity of the right hemisphere of the brain, calculated from sensors located on the right side of the prefrontal cortex (an algorithm built in Looxid Link); |
| attention | A marker that determines the subject’s overall focus in the range of 0–1 (an algorithm built in Looxid Link); |
| relaxation | A marker determining the relaxation of the subject in the range of 0–1 (an algorithm built in Looxid Link); |
| asymmetry | A marker determining the ratio of left to right brain hemisphere activity; |
| frequency bands | Delta, theta, alpha, beta, and gamma for each of the 6 sensors. |
Table 3.
Classification results for two stress levels (before and after relaxation session). The best result is bolded.
Table 3.
Classification results for two stress levels (before and after relaxation session). The best result is bolded.
| k-NN | AdaBoost | RF | MLP | CN2 | |
|---|---|---|---|---|---|
| SFS | 74.5 | 77.4 | 83 | 86.7 | 82.8 |
| MI | 74.5 | 80 | 84.3 | 86.1 | 85 |
| LASSO | 76.5 | 67.5 | 76.1 | 78.4 | 76.4 |
Table 4.
Classification results for three stress levels (low, medium, and high).
| k-NN | AdaBoost | RF | MLP | CN2 | |
|---|---|---|---|---|---|
| SFS | 73 | 76.8 | 78.4 | 82.3 | 82.3 |
| MI | 72.4 | 76.1 | 76.7 | 80.4 | 80.4 |
| LASSO | 68.4 | 73.4 | 75.9 | 78.8 | 79 |
Table 5.
Classification results for five stress levels (very low, medium, high, and very high).
| k-NN | AdaBoost | RF | MLP | CN2 | |
|---|---|---|---|---|---|
| SFS | 58.4 | 57.8 | 63 | 67.7 | 65.7 |
| MI | 58 | 56.2 | 61.1 | 66.9 | 65.1 |
| LASSO | 55.1 | 54.9 | 59.9 | 61.1 | 63.4 |
Disclaimer/Publisher’s Note: The statements, opinions and data contained in all publications are solely those of the individual author(s) and contributor(s) and not of MDPI and/or the editor(s). MDPI and/or the editor(s) disclaim responsibility for any injury to people or property resulting from any ideas, methods, instructions or products referred to in the content. |
© 2023 by the author. Licensee MDPI, Basel, Switzerland. This article is an open access article distributed under the terms and conditions of the Creative Commons Attribution (CC BY) license (https://creativecommons.org/licenses/by/4.0/).
Share and Cite
MDPI and ACS Style
Kamińska, D. Recognition of Human Mental Stress Using Machine Learning: A Case Study on Refugees. Electronics 2023, 12, 3468. https://doi.org/10.3390/electronics12163468
AMA Style
Kamińska D. Recognition of Human Mental Stress Using Machine Learning: A Case Study on Refugees. Electronics. 2023; 12(16):3468. https://doi.org/10.3390/electronics12163468
Chicago/Turabian StyleKamińska, Dorota. 2023. "Recognition of Human Mental Stress Using Machine Learning: A Case Study on Refugees" Electronics 12, no. 16: 3468. https://doi.org/10.3390/electronics12163468
Note that from the first issue of 2016, this journal uses article numbers instead of page numbers. See further details here.