1. Introduction
Cloud computing offers advantages such as rapid deployment, low cost, low maintenance, large storage capacity, and high scalability [
1]. As a result, it can provide enterprises and individuals with abundant computing resources and data storage services. Furthermore, the scope of cloud computing development and usage has expanded to financial and information technology systems utilized by government agencies [
2,
3].
Once these critical infrastructures are maliciously attacked, they become highly vulnerable to significant security incidents such as data loss or theft [
4]. Constantly evolving variants of malicious software have become one of the primary causes of anomalies in the cloud environment. Malicious software encompasses a wide range of types, predominantly including Trojans, worms, spyware, and rootkits [
5]. Moreover, infected virtual machines (VMs) resulting from malicious software are also a major factor contributing to the overall abnormal operation of the cloud infrastructure [
6]. Therefore, developing efficient and robust security architectures/methods to detect abnormal VMs is crucial in the cloud environment.
Researchers have proposed various malicious-behavior-detection methods to ensure the normal operation of tenant virtual machines (TVMs) in the cloud. These methods can be classified into software-based and hardware-based malware-detection methods based on the types of VM characteristics they acquire. Software-based detection methods can be broadly categorized into two types: signature-matching or rule-based methods and behavior-modeling methods [
7,
8]. Signature-matching methods primarily rely on static analysis, exhibiting high Accuracy, but they are complex and time-consuming. Moreover, recent malicious software can alter its signature, rendering it undetectable. Behavior-modeling methods, on the other hand, mainly employ dynamic analysis, the tracking feature, and the response of the monitored system, flagging any inconsistency with expected behavior as an anomaly [
9]. Traditional dynamic analysis can also be used to detect attacks in the cloud [
10,
11]. However, these methods run and employ pattern-matching algorithms within the monitored VM, making it easy for attackers to evade detection [
6].
The aforementioned detection methods require acquiring VM-related data for analysis. Based on the way the data are obtained, we classify data-acquisition methods into In-VM and Out-VM. The In-VM approach is defined as methods that involve directly obtaining advanced semantic information from within the VM, such as process information, system calls, and user system file data. Most security methods in the cloud are designed based on the deployment scheme using the In-VM technique [
6]. For example, a lightweight proxy [
12] can be set up between the VM and the virtual machine monitor (VMM) (or hypervisor) to extract advanced semantic information from within the VM for external analysis.
In the cloud, most Out-VM-based methods also rely on the virtual machine introspection (VMI) technique [
13,
14] to acquire user-level semantic information for analysis. Compared to the In-VM method, the Out-VM approach provides more-reliable data, but it requires bridging the semantic gap and incurs higher performance overhead. Additionally, due to increasing concerns about privacy protection in society, all the methods mentioned above for acquiring user-level semantic information also face issues such as user privacy leakage.
Hardware-based methods involve collecting the hardware features of thew computer system (such as instruction execution count, cache hit rate, memory access latency, etc.) by accessing hardware performance counters (HPC) [
15,
16,
17,
18,
19]. HPCs exhibit strong resilience against the polymorphism and obfuscation technique employed by malicious software, enabling monitoring system behavior effectively. Compared to software-based detection methods, these approaches offer advantages such as low performance overhead, strong interference resistance, and high Accuracy. However, hardware-based malware-detection methods are primarily tested in physical bare-metal environments [
16,
19,
20] or development boards [
15,
17,
18].
Hardware performance counters exist in the CPU of the physical machine while the virtual hardware performance counters (vHPCs) of VMs exist within the virtual CPU (vCPU) virtualized by the hypervisor, so obtaining reliable vHPC data may be challenging. There is a limited literature that addresses the analysis of the vHPCs of VMs in the cloud environment.
Virtualization technology is a key component of cloud computing, and virtualization security is a crucial issue in cloud security. To address the aforementioned challenges, this paper proposes a feature-fusion-based abnormal-behavior-detection method (FFABD) in a virtualization environment. FFABD is an Out-VM-based approach that acquires both the hardware features and syscalls of VMs at the physical machine level (or physical host level) and the virtualization level, respectively. Compared to mainstream detection methods for VMs [
21,
22], the proposed method captures low-level hardware features [
23] without the need to bridge the semantic gap and acquire user-level semantic information, thus reducing the performance overhead of the detection method and safeguarding VM data privacy. Hence, the operating system running on the VM does not impose any limitations on this method. This characteristic enhances the efficiency and universal applicability of our approach in comparison to conventional abnormal-VM-detectionmethods. Furthermore, the resilience of hardware features against the polymorphism and obfuscation technique employed by malicious software enhances the method’s resistance to interference. To minimize the influence of external factors, this experiment runs only a single VM on the virtualization platform, without considering multi-tenancy or multiple VMs. The main contributions of this paper are as follows:
This paper presents a feature-fusion-based abnormal-behavior-detection method in a virtualization environment. The method combines hardware features (e.g., HPCs and vHPCs) and software features (e.g., syscalls) from both the physical machine level and the virtualization level, enhancing the reliability of the acquired data in the virtualization environment and enriching the diversity of the features.
The proposed anomaly-detection method in this article is based on the Out-VM. This approach does not require the modification or installation of and internal agent within the VM to obtain advanced semantic information. This greatly improves user privacy and security.
This method does not depend on a specific VM system version, greatly enhancing the transparency, universality, and robustness of the monitoring system. Furthermore, This method does not require reverse engineering such as semantic reconstruction, which significantly reduces the overhead and improves the detection efficiency. Lastly, this article provides an explanation of the experimental results based on the contribution of the features.
2. Related Work
2.1. Hypervisor-Based Detection Method
Virtualization technology is a key component of cloud computing, and an increasing number of critical cloud infrastructures leverage virtualization technology to enhance security measures [
24]. A VM anomaly in the cloud infrastructure is one of the main causes of anomalies in the cloud environment. Therefore, detecting the internal state of the VMs is of paramount importance. Traditional In-VM detection methods primarily rely on security tools installed within the VM. However, such methods are prone to evasion by malicious software. For instance, rootkit malware running with operating-system-level privileges can utilize these privileges to conceal its existence, evading detection by OS-based rootkit-detection tools.
In order to improve the detection effectiveness of malicious software, researchers have started to observe VMs from the virtual machine monitor (VMM) level. One of the earliest proposal was made by Klemperer [
25]. It was suggested that placing the detection system out of the VM would not be affected by any tampering or manipulation from inside the VM. Since the VMM operates at a higher privilege level, it provides an isolated vantage point from which the presence of malicious software in the VM can be examined [
24]. Their approach was named virtual machine introspection (VMI), and several suggestions were put forward [
26,
27,
28] with the aim of monitoring VMs from the VMM level.
Hypervisor-based methods allow for the acquisition of various software features from inside the VM at the VM’s external level. For example, the method needs to understand the version and type of the virtual machine to perform appropriate operations during introspection based on different virtual machine types. It needs to obtain the virtual machine’s memory mapping information, including the memory page distribution and access permission, to achieve the memory-level introspection operation. Obtaining the virtual machine’s CPU information, such as the CPU type, quantity, and register status, is necessary for monitoring and adjusting the virtual machine’s CPU behavior. Therefore, these features obtained by hypervisor-based methods include VM memory [
29,
30,
31], internal process system calls, application programming interface (API) characteristics [
30,
31,
32,
33,
34], and others. Most of these methods require crossing the semantic gap to achieve their goals. While these methods exhibit high detection rates, they also come with significant performance overhead, susceptibility to TVM system influence, and challenges with respect to user privacy protection.
2.2. Hardware-Feature-Based Detection Method
Hardware-based malware-detection methods utilize low-level hardware events generated by HPC monitoring programs to obtain hardware features. These methods have been extensively studied and proven to be accurate and effective [
35,
36,
37,
38,
39]. HPC-based malware-detection methods are capable of combating the polymorphism and obfuscation technique employed by malicious software, as they capture malicious behavior at the microarchitectural level, making the collected data less prone to tampering. HPC values can be securely collected and processed by applications running in the ARM TrustZone and Intel Security Enclaves. Lightweight HPC-based malware-detection methods offer advantages such as low performance overhead, strong resilience to interference, and high Accuracy.
However, due to the fact that virtual HPCs (vHPCs) within VMs are not physically present, but rather emulated by hardware simulation modules (such as QEMU), the reliability of the data obtained from vHPCs is subject to debate. Currently, hardware-based malware-detection methods are primarily applied in scenarios that involve physical bare-metal machines and development boards.
To address the aforementioned issues, the proposed abnormal-behavior-detection method in this paper not only acquires data from the vHPC, but also collects data from the HPC corresponding to the processes of the VM on the physical host. This approach not only enhances the reliability of the data features, but improves the Accuracy of the detection method. The specific methodology will be elaborated in detail in the following section.
2.3. Syscall-Based Detection Method
The syscall-based detection method is a common dynamic analysis approach used to detect malicious software. This method typically involves collecting all the calls (sometimes referred to as system calls or API calls) made by a binary file to the operating system (OS) [
40]. The experimental environment for this method mainly includes sandboxes [
40,
41], VMs with VMI technology support [
33,
34,
42], and containers [
43].
Sandbox-based detection techniques can be deployed on different operating systems without being limited by the operating system itself. However, some advanced malware can detect whether it is running in a sandbox environment and utilize vulnerabilities or specific attack techniques to evade detection. The VMI-based detection technique can provide deeper malware detection and analysis capability. However, VMI technology operates within the kernel of the OS inside the VM, making the VMI monitoring environment itself a potential target for attacks. Malware can exploit vulnerabilities or specific attack techniques to bypass or disrupt VMI-based detection methods.
Container technology has lower performance overhead compared to traditional VMs and enables rapid deployment. However, containers share the kernel with the host operating system. If there is a vulnerability in the application or component within the container, an attacker may be able to perform container escape attacks and gain access to the host operating system or other containers, posing a threat to the overall system security.
To address the aforementioned issues, the method used in this experiment to obtain syscalls from the VM involves directly capturing the syscalls of the VM process at the physical machine level. This approach does not rely on the VMM and does not require running any additional programs within the VM kernel. The strong isolation provided by virtualization technology ensures high reliability of the obtained data. The details of this method will be described in the next section.
4. Methods
4.1. Cross-Validation Technique
Cross-validation is a technique used to evaluate the performance of machine learning models. It involves dividing the dataset into training and validation sets, repeatedly training the model on the training set, and evaluating its performance on the validation set. Based on the evaluation results, the model’s parameters or structure can be adjusted to improve its performance. One advantage of this method is that it assesses the model’s ability to generalize, i.e., its performance on new data. Compared to training the model multiple times on the training set, cross-validation provides a more-accurate assessment of the model’s performance and helps researchers determine the optimal parameters and structure for the model.
This paper applied the cross-validation technique to tune and optimize the machine learning model such as XGBoost, ExtraTree, and RandomForest. By using this method, we can find the optimal model parameters and structure to improve the performance of the model. Below is an example of the parameter-tuning process for one of the models (XGBoost).
Extreme gradient boosting (XGBoost) is an ensemble learning algorithm that consists of a collection of decision trees (DTs) trained using the boosting technique. XGBoost has several commonly used parameters. For example, eta (learning rate) controls the step size for updating weights in each iteration. A smaller learning rate can make the model more stable, but it may require more iterations to converge. max_depth limits the maximum depth of the trees and is used to control the complexity of the model. A larger depth allows the model to learn more-complex relationships, but it may also lead to overfitting. N_estimators refers to the number of weak learners (i.e., decision trees) and is also known as the iteration count. Increasing the number of iterations can make the model more accurate, but it may also increase the computational cost.
The parameter num_trees represents the number of iterations or the count of trees in the XGBoost algorithm’s training process. During the training process of XGBoost, multiple decision trees are generated, and each tree serves as a weak classifier. num_trees specifies the number of decision trees to be generated, indicating how many rounds of iteration the algorithm will undergo in training. A larger number of iterations may lead to higher model complexity and fitting ability, but also bring the risk of overfitting. There are also other parameters such as reg_alpha (L1 regularization term) and reg_lambda (L2 regularization term) that can be used to reduce model complexity and prevent overfitting.
The training process of the XGBoost algorithm (as shown in Algorithm 1) involves several steps. In Step 1, the training dataset is input along with parameters such as num_trees, max_depth, and learning_rate. In Step 2, the initial prediction is initialized to a constant value, such as 0, as the starting point of the model. The training process continues in Step 3, where iterations are performed. In each iteration, the gradient
and second-order derivative
of the loss function are computed and regularization terms are applied. The parameter
t represents the number of iterations or training rounds of the XGBoost algorithm, indicating how many times the model will be updated during the training process. Increasing the value of t allows the model to learn more from the data and can potentially improve the model’s performance. However, setting
t to a very large value may lead to overfitting.
represents the gradient of the loss function, which is the first derivative of the loss function with respect to the predicted values. The gradient is used to update the model parameters in each iteration. A larger gradient indicates a steeper slope in the loss function, which means the model is far from the optimal solution. The algorithm will make larger updates to the model parameters to move closer to the optimal solution.
represents the second derivative of the loss function, also known as the Hessian matrix. It is used to further optimize the model parameters during the training process. The Hessian matrix provides information about the curvature of the loss function, and it helps the algorithm make more-precise updates to the model parameters. In Step 4, weak classifiers (DT) are fit by constructing decision trees and fitting the negative gradient of the residual. In Step 5, the model is updated by adjusting the prediction based on the outputs of the weak classifiers, and the predictions of multiple weak classifiers are aggregated with the weights. This aggregated prediction is represented as
, as shown in Equation (
1).
represents the predicted values of the XGBoost model. It is the final prediction obtained by combining the outputs of multiple weak classifiers in a weighted manner through the iterative process. The weights assigned to each weak classifier depend on their performance and contribution to the overall prediction. By repeating the iteration through Steps 3 to 5, the process continues until the specified number of iterations or stopping criteria are reached. Finally, the trained XGBoost model is returned. In this paper, the XGBoost model’s hyperparameter values are adjusted by performing three rounds of 10-fold cross-validation on the training set to obtain an XGBoost training model that best fits the current dataset.
| Algorithm 1 XGBoost algorithm |
| Input: Training dataset(D), num_trees, max_depth, learning_rate |
| Output: Adjusted XGBoost model |
| 1: Initialization: F(0) = 0 |
| 2: Iterative Training: |
| 3: for t in range (num_trees) do |
| 4: g(t) = compute_gradient(D, F(t)) |
| 5: h(t)= compute_hessian(D, F(t)) |
| 6: Fit Weak Learner(DT): h(t) = fit_weak_learner(D, g, h, max_depth) |
| 7: Update Model: F(t)= F(t)+ learning_rate * h(t) |
| 8: Return XGBoost model |
4.2. Ensemble Learning Method
4.2.1. AdaBoost Model
AdaBoost is a machine learning algorithm that combines multiple weak classifiers into a strong classifier. The principle of AdaBoost is as follows: Firstly, each sample in the training data is assigned an initial weight that is equal for all samples, and the weight vector
D is formed by these weights. Then, weak classifiers are trained using the training set, and the error rate is calculated for each sample in the dataset. Error rate
refers to the probability that the prediction made by the classifier
on an instance
after training does not match the actual value
. The specific formula is shown as follows:
The weight of each sample in the dataset will be adjusted based on the error rate of the classifier. Correctly classified samples have their weights decreased, while incorrectly classified samples have their weights increased. The total sum of these weights always remains equal to 1. The importance of each classifier
a is determined by the error rate of each classifier, as shown in the following equation:
Finally, the classifier is trained again using the same dataset until the error rate becomes zero or the number of weak classifiers reaches a user-defined value, at which point training stops.
4.2.2. Voting Combination Strategy
Different types of features are used in this experiment, and a single classifier may not satisfy all features. However, the combination of multiple weak classifiers can compensate for the shortcomings of a single weak classifier and achieve the best classification performance. We assumed that there are T primitive learners
combined into the ensemble learning model. The classifier
predicts a tag from the class tag sets
. We represent the predicted output of
on sample
x as an N-dimensional vector,
, which represents the output of
on the class
. The weighted voting equation used in this paper is as follows:
The weight of is , generally . In the voting combination strategy, the classifier with high classification Accuracy has a great impact on the final result. This method can reduce the probability of poor generalization due to classifier misclassification, reduce the possibility of classifiers falling into local optimal, and expand the hypothesis space of the algorithm.
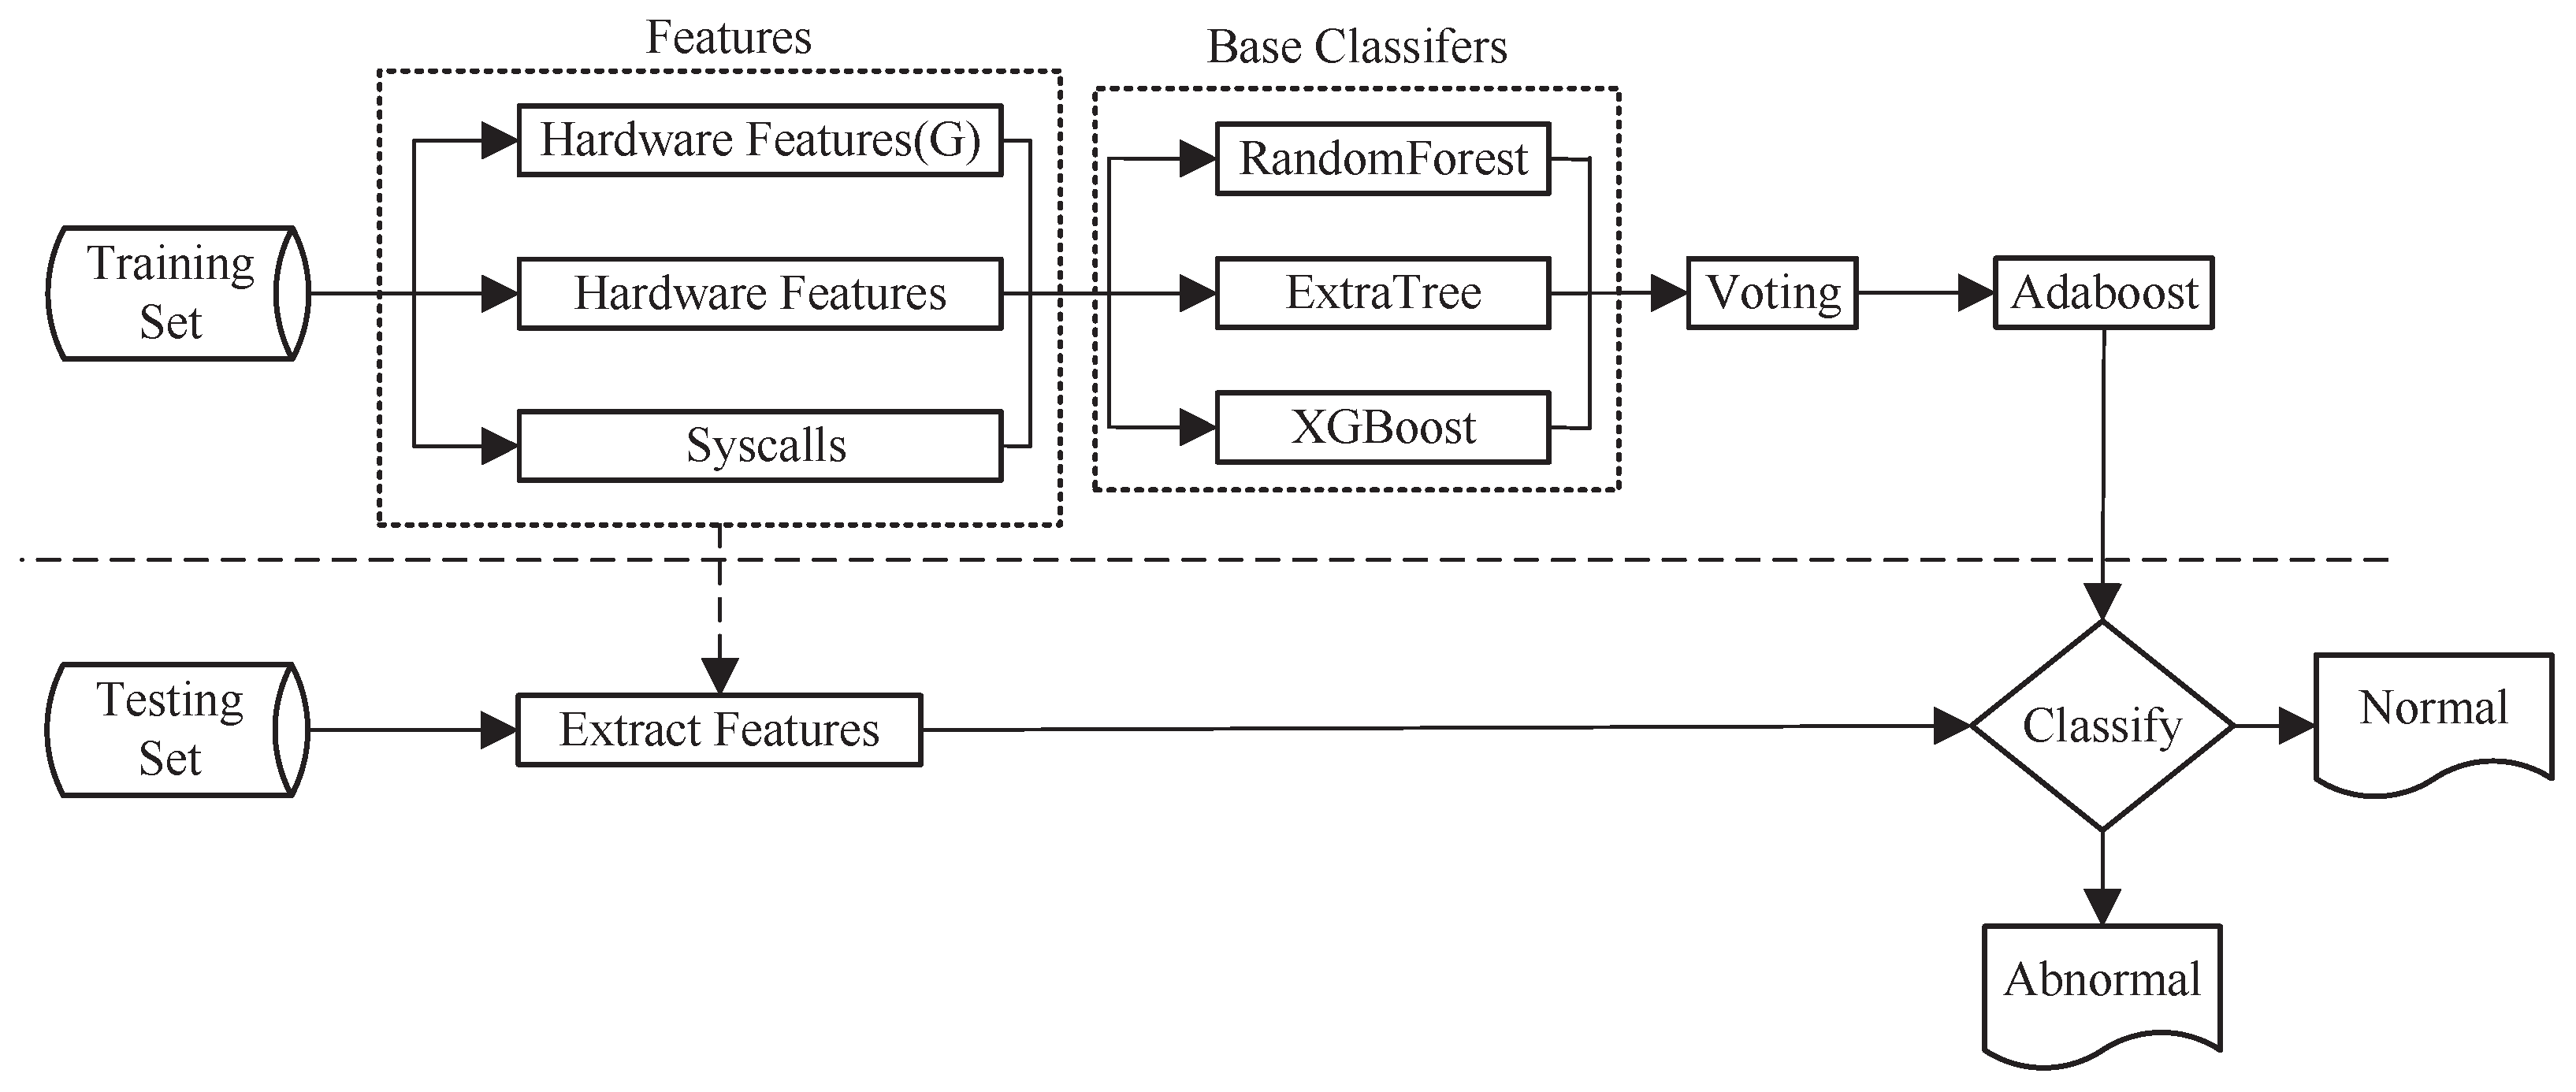
4.3. Algorithm Modeling
This paper proposes an ensemble learning method based on multi-level features. The approach follows a progressive strategy to achieve the best matching of features for each classifier. Firstly, we add a feature to the classifier and use it to select the base classifier with the best classification performance. Secondly, we gradually add the remaining classifiers using weighted voting. This process is repeated iteratively until all features are added to the feature set. The final AdaBoost ensemble classifier consists of the previously identified best base classifiers. The experimental architecture is illustrated in
Figure 4.
5. Experiments
5.1. Experimental Environment
The software and hardware configuration of the system used in this experiment is as follows: The system was deployed on the hardware environment of a GeForce Titan XP GPU (with 12 GB video memory), an Intel Xeon E5-2600 CPU, 64 GB of RAM, and a 4 TB HDD. The physical machine system ran on the Ubuntu 20.04 64-bit operating system. We utilized the KVM platform to create a virtualization environment that simulated the cloud environment. The VM operated on a vanilla installation of Windows 7 with 4 GB virtual memory, two dual-core virtual CPUs, and a 60 GB virtual hard disk. We chose 64-bit Windows 7 because it has extensive support in terms of official documentation and other resources for our experimental samples. Additionally, since the most-common type of malware samples found in the wild are 32-bit [
44], this allowed for relatively easy detection. We believe that this choice did not compromise the effectiveness of our result or their applicability to a newer version of Windows, as all 64-bit systems are backward compatible with 32-bit binary files [
41]. For obtaining the hardware features of the VM, we employed Version 5.9 of the perf tool.
5.2. Experimental Dataset
We collected 220 normal executable software programs, including popular web browsers, video players, image browsers, PDF readers, word processing software, and so on. When running in a VM, these executable software programs do not result in any system anomalies or abnormal behaviors. Additionally, we collected 440 software programs from VirusShare, including viruses, Trojans, worms, adware, and other software that can lead to abnormal system behavior. Running these programs in a VM can lead to system slowdown, a blue screen, crashes, and other abnormal behavior, putting the VM in an abnormal operational state.
During the execution of the normal program, we performed additional operations, such as opening a normal web page with a web browser, opening a PDF file with a PDF reader, playing a video with a video player, and so on.
To enhance the resilience of the abnormal-behavior-detection method against interference, we introduced a strategy of simultaneously executing a normal program while running the abnormal program. After each normal or abnormal program was launched, we conducted sampling at specific time intervals to collect five samples for each case. This approach allowed us to capture the underlying hardware behavior of both the normal and abnormal programs and obtain a diverse set of samples for analysis.
5.3. Experimental Design
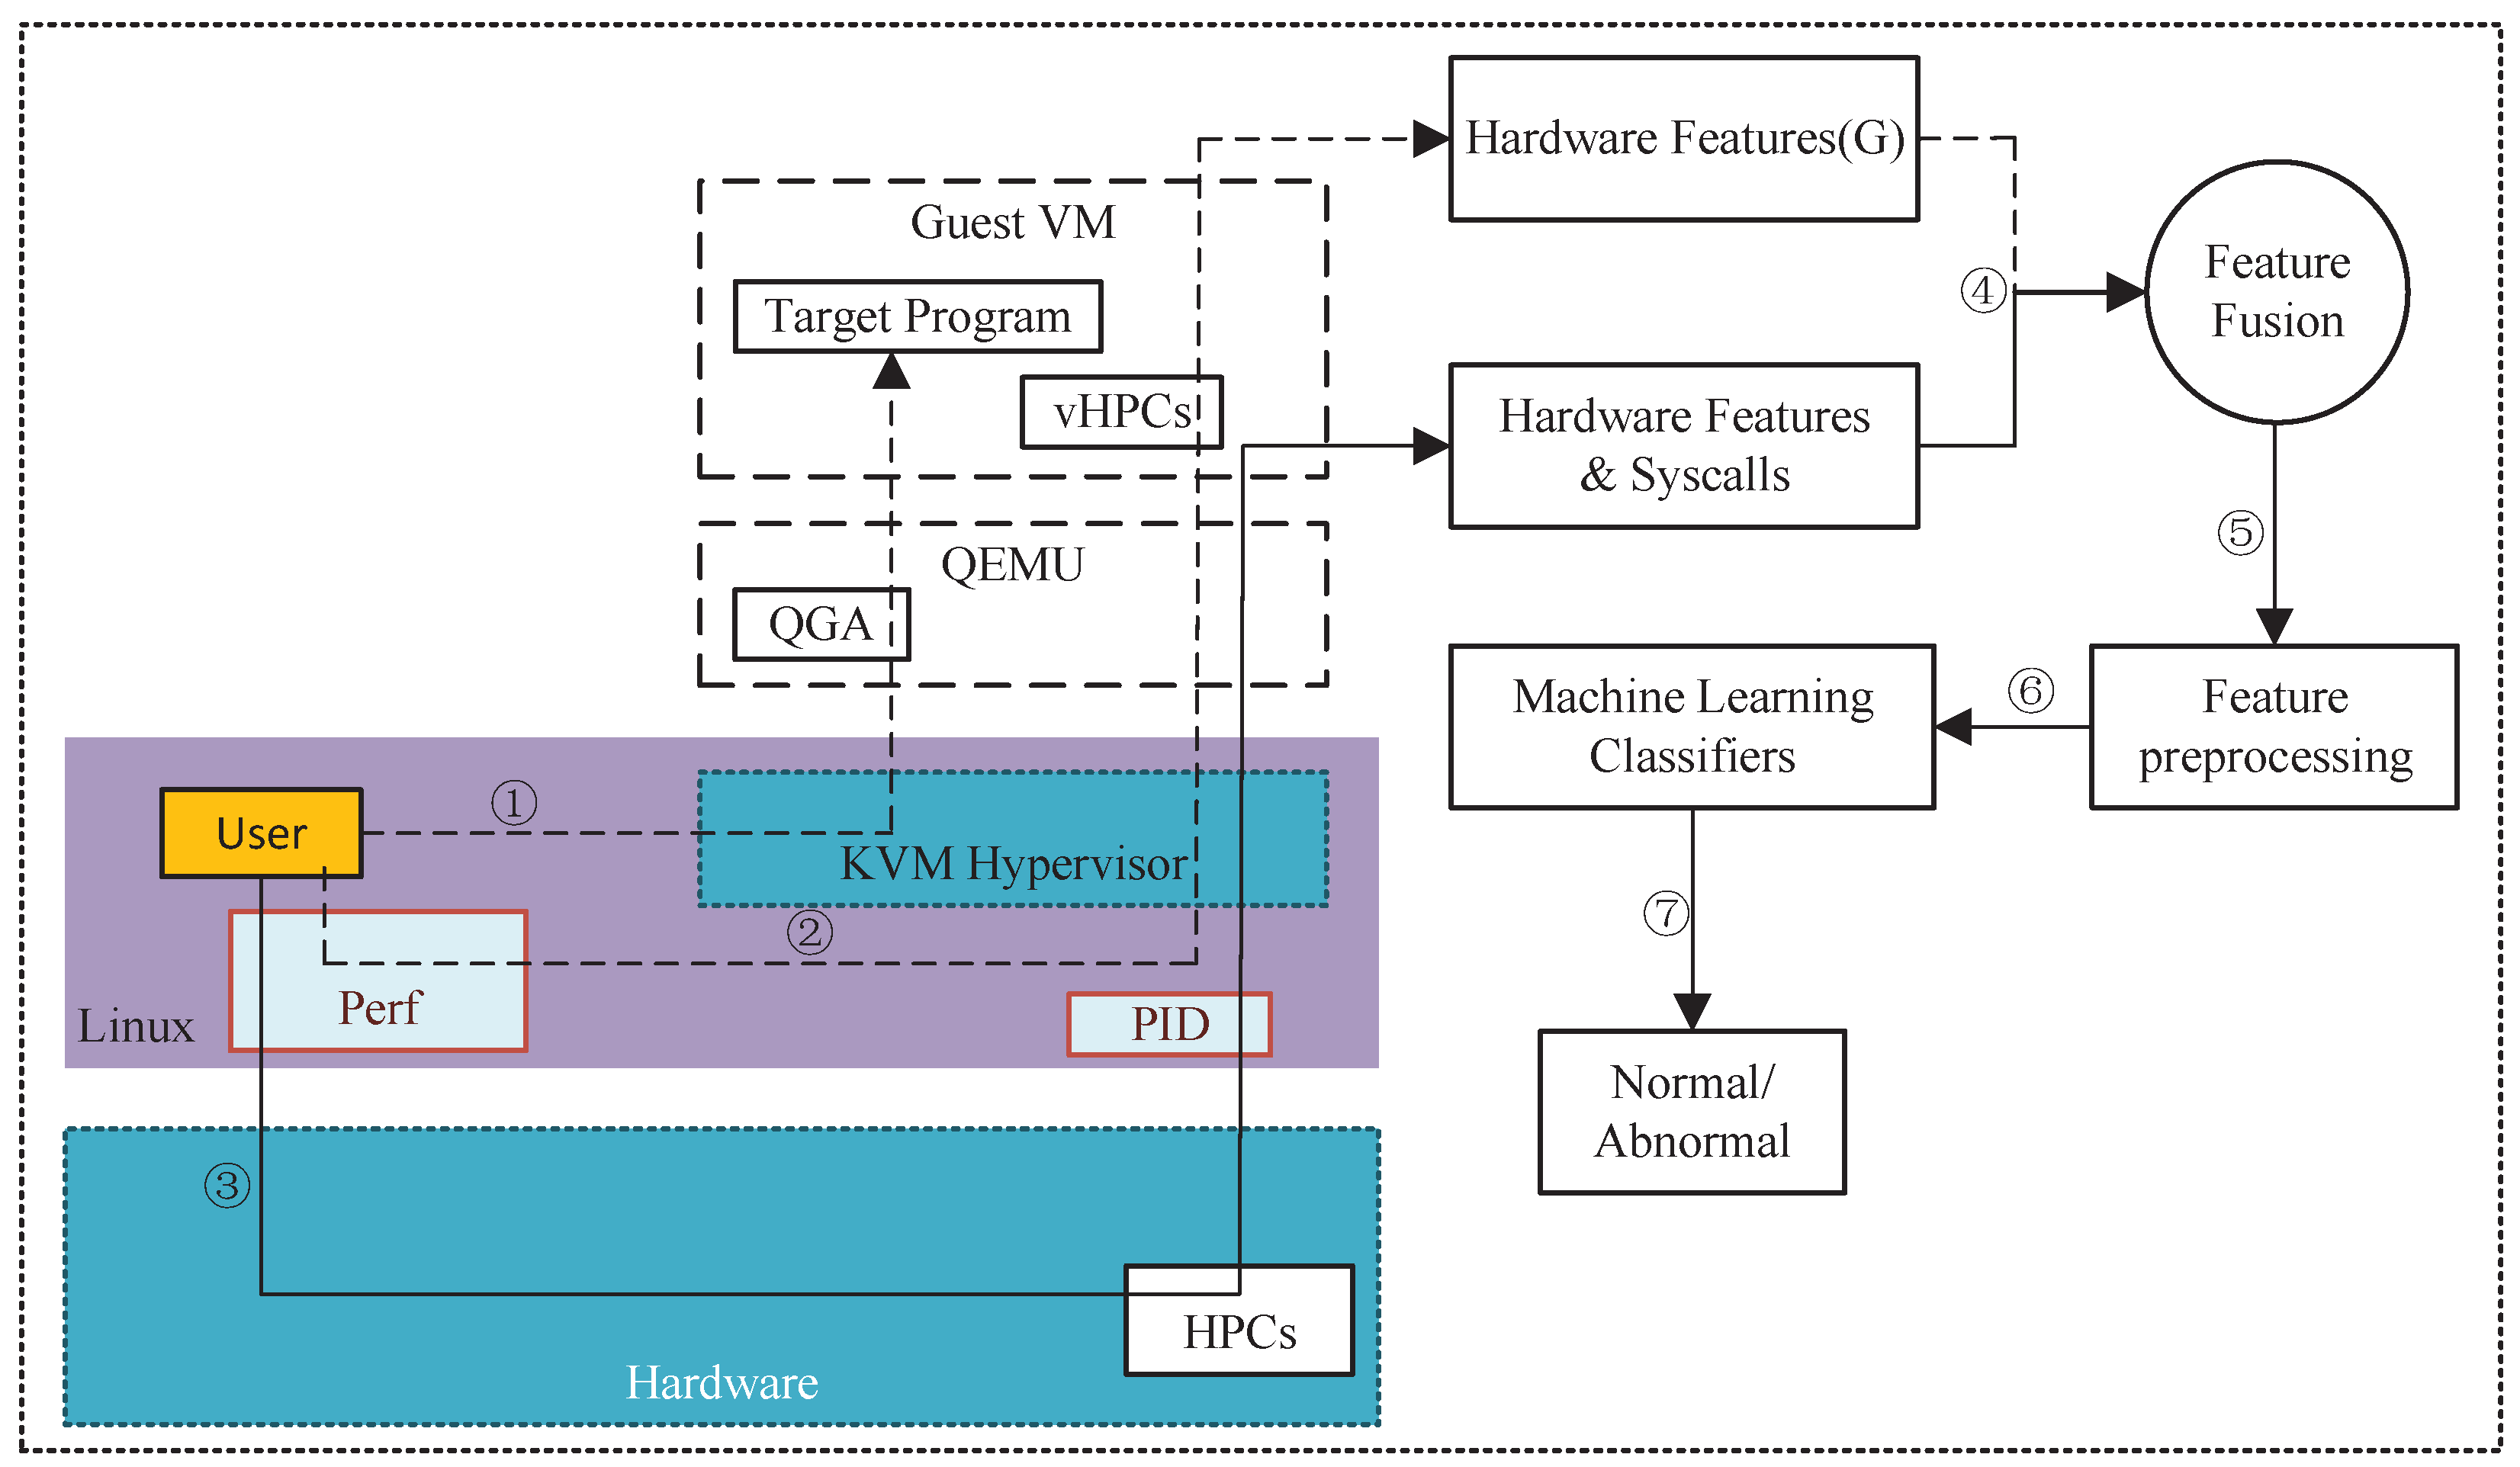
In this study, our goal was to obtain the feature data of the GVM at both the virtualization level and the physical machine level. After creating a GVM, a snapshot of the VM should be taken and saved. Before running the next program, the snapshot should be restored to ensure that each program runs in the same environment.
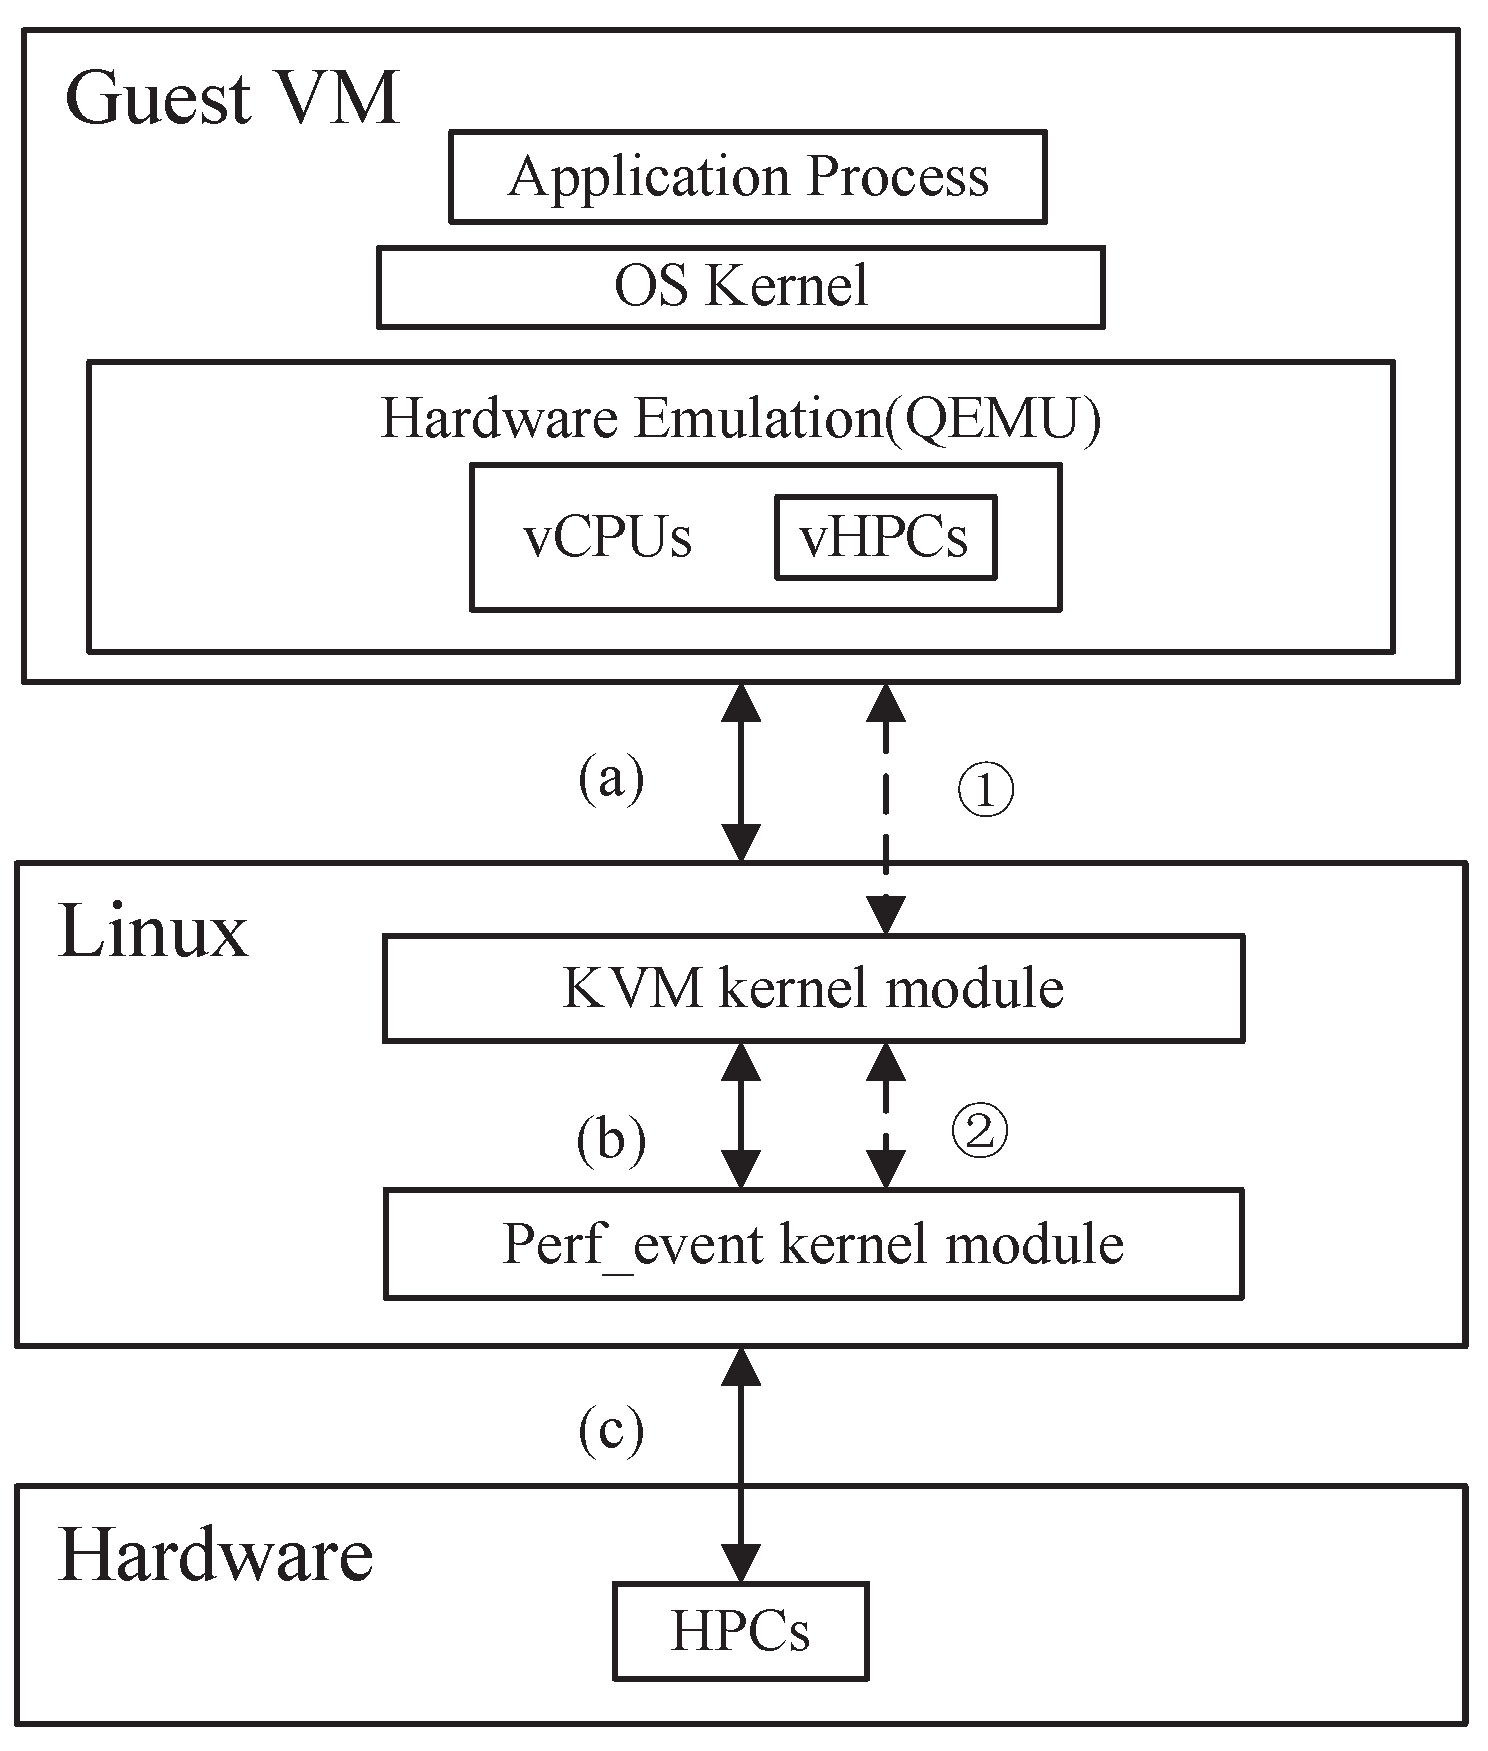
The main steps to obtain hardware features at the virtualization level are as follows: After a program was executed in the GVM, we sampled the GVM at specific time intervals, with a total of 5 samples taken. The time interval between each sample was the same, during which 4 hardware features were captured. The sampling command utilized the KVM-related commands in the perf event to retrieve information from the GVM. Each program was executed repeatedly, and a total of 20 hardware features were collected in 5 batches. Finally, these features were consolidated into a feature dataset called , which contained 1100 normal hardware feature samples and 2200 abnormal hardware feature samples. Each sample in this dataset consisted of 20 hardware features. The reason for monitoring only 4 hardware features at a time was to avoid the impact of time-division multiplexing on the experiment. Since typical CPUs usually have 4–6 HPCs and some advanced CPUs may have even more, the number of monitored events should not exceed the number of HPCs.
The main steps to obtain hardware features at the physical machine level were similar to those at the virtualization level, including the sampling time intervals and other external factors. The steps were as follows: After a program was executed in the GVM, the PID of the GVM was identified at the physical machine level. The sampling command utilized the perf event-related commands to directly sample the PID of the GVM. The PID of the GVM was sampled 5 times at the same time intervals as the virtualization level method, and a total of 20 hardware feature data points were collected in 5 batches. Finally, these features were consolidated into a feature dataset called , which contained 1100 normal hardware feature samples and 2200 abnormal hardware feature samples. Each sample in the dataset consisted of 20 hardware features.
The method of obtaining syscalls was similar to obtaining the hardware features at the physical machine level. Since the obtained syscalls were considered as software events in a strict sense, the three syscalls were collected separately in one batch. Finally, a feature dataset called was obtained, which contained 1100 normal software feature samples and 2200 abnormal software feature samples. Each sample in the dataset consisted of 3 syscalls.
Finally, we combined the feature sets
,
, and
using the feature fusion technique. Detailed information about the feature datasets is shown in
Table 3.
6. Results and Evaluation
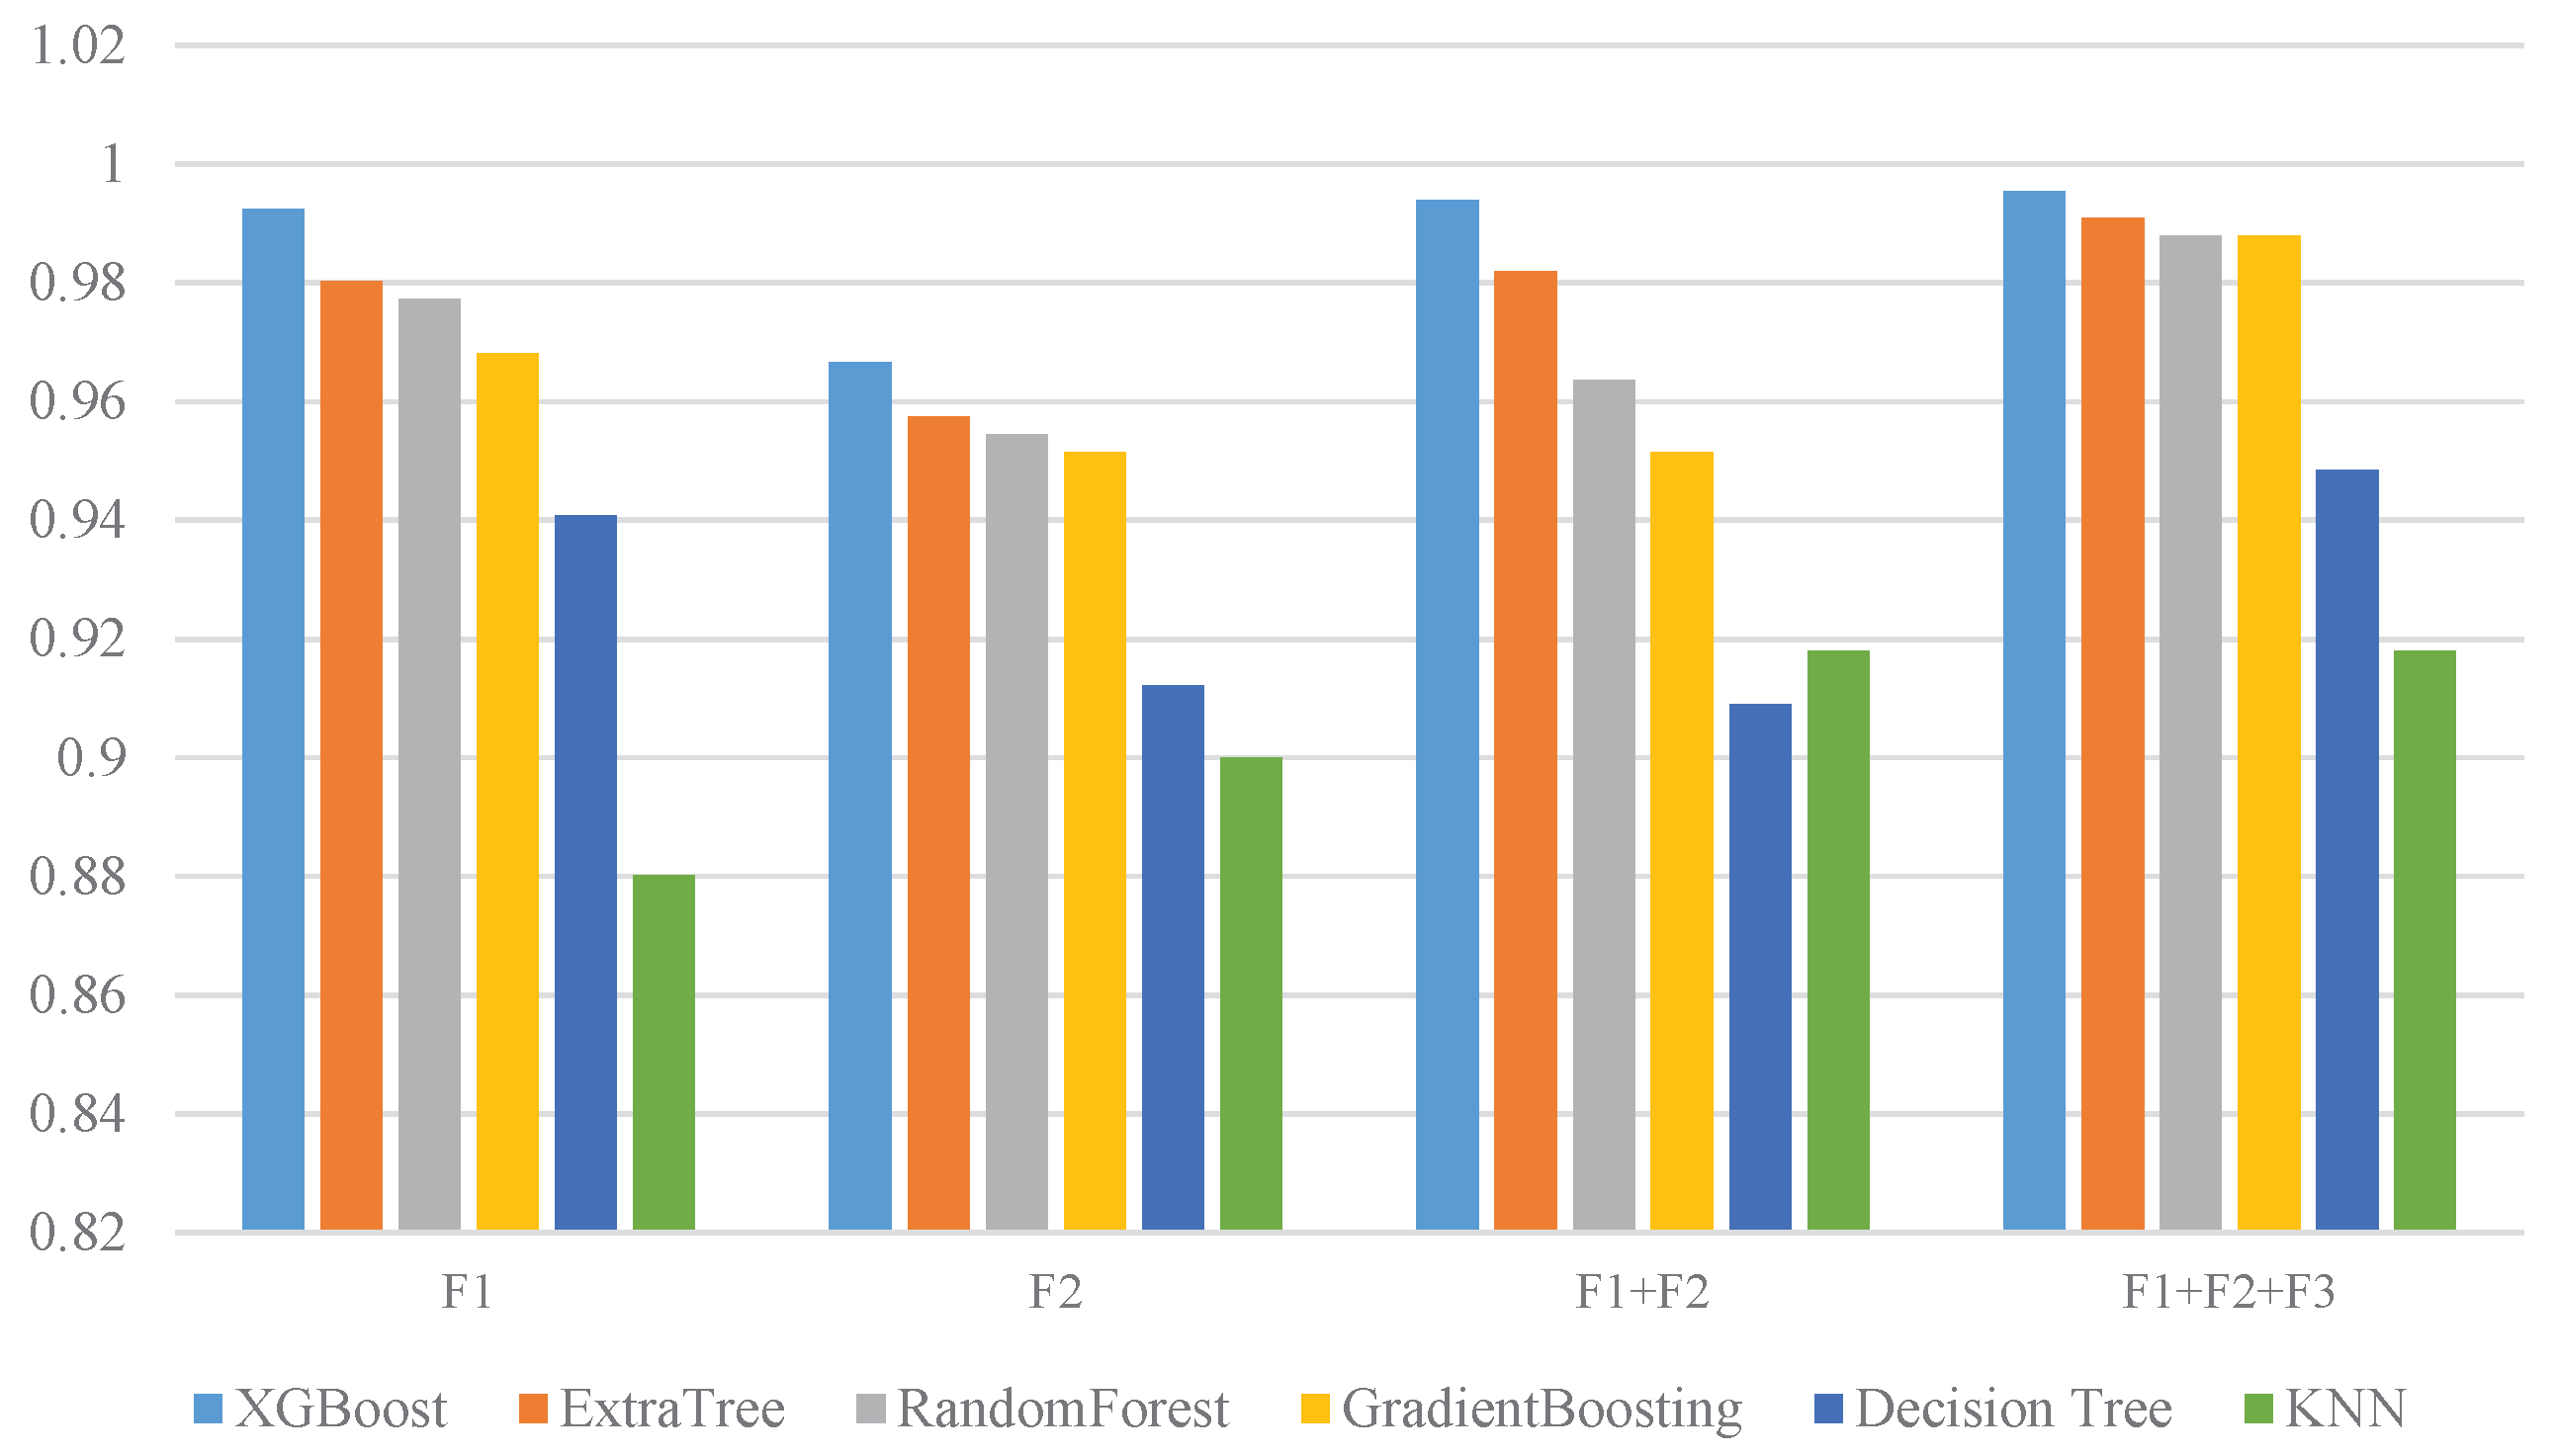
We used Accuracy, the True Positive Rate (TPR), and the False Positive Rate (FPR) to evaluate the classification performance of the classifier. Accuracy was also used to assess the classification performance. In this paper, we adopted 10-fold cross-validation to test the Accuracy of the algorithm. The test method divided the dataset into ten parts. We split the dataset into a training set and a test set at a ratio of 9:1. Each test yielded corresponding evaluation results. Finally, the average of the ten accuracies was used as an estimation of the algorithm’s Accuracy. We adjusted each classifier through cross-validation techniques. After multiple experiments, the final results are shown in
Figure 5.
Figure 5 shows that the XGBoost model achieved the highest Accuracy on the F1, F2, F1 + F2, and F1 + F2 + F3 datasets, with Accuracies of 99.24%, 96.67%, 99.39%, and 99.55%, respectively. This experiment demonstrated that the Accuracy of the data features obtained at the virtualization level was higher than that obtained at the physical machine level. As the features were progressively fused, the Accuracy increased.
Furthermore, the classifiers ExtraTree and RandomForest also exhibited excellent classification performance on the aforementioned datasets, closely following the XGBoost model. Therefore, this paper selected the top-performing classifiers, namely XGBoost, ExtraTree, and RandomForest, for ensemble learning. By combining them using a voting ensemble strategy, the final result is shown in
Figure 6.
Figure 6 displays the Accuracy, Precision, Recall, and F1-Score obtained by the proposed ensemble learning method based on multi-level features among all datasets. The Accuracy of each dataset was 99.39%, 96.97%, 99.55%, and 99.70%, respectively. The result obtained by ensemble learning outperformed the other machine learning models on all datasets.
7. Discussion
In this section, we will provide explainable insight into the experimental results mentioned above. The first conclusion drawn from
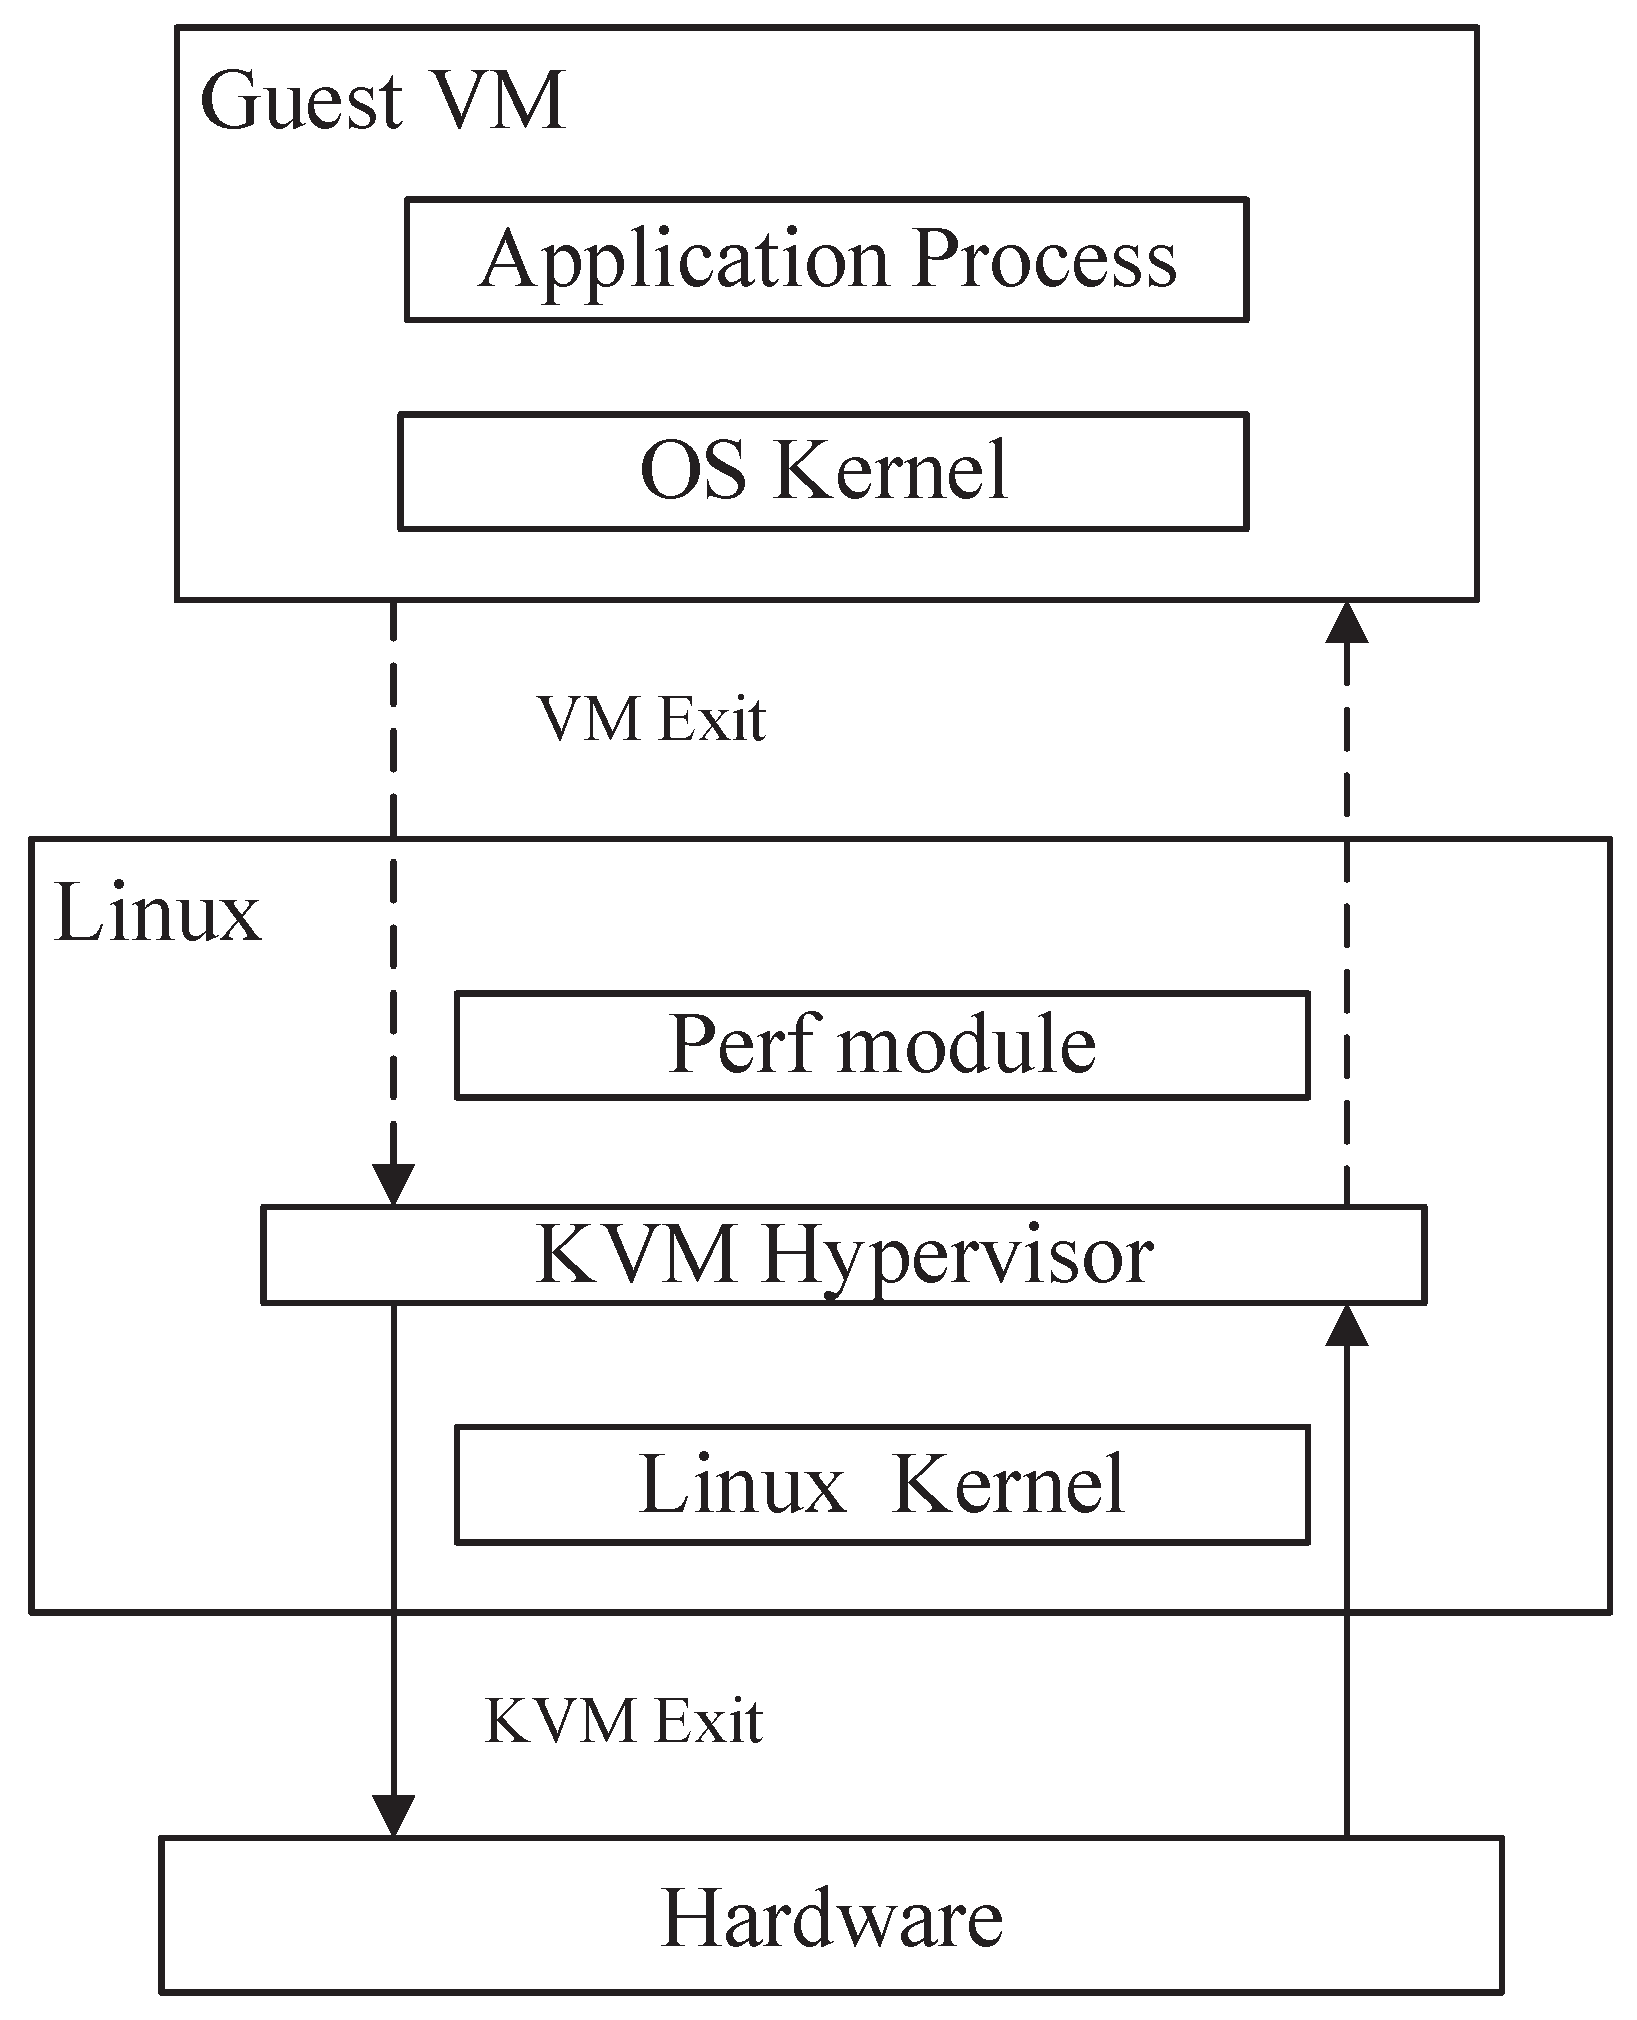
Figure 5 is that the Accuracy of the feature data obtained in the virtualization environment was higher than that obtained in the physical machine. The main reason behind this was that, in the virtualization environment, perf captured the feature data of the guest virtual machine (GVM) with finer granularity through KVM-related commands. This was because the vHPC of the GVM was virtualized by QEMU, and the data obtained at the virtualization level directly monitored the events of the vHPC. However, in the physical machine environment, the monitoring was performed on the overall hardware events of the GVM process running on the physical machine. Therefore, the events monitored at the virtualization level were more detailed and accurate.
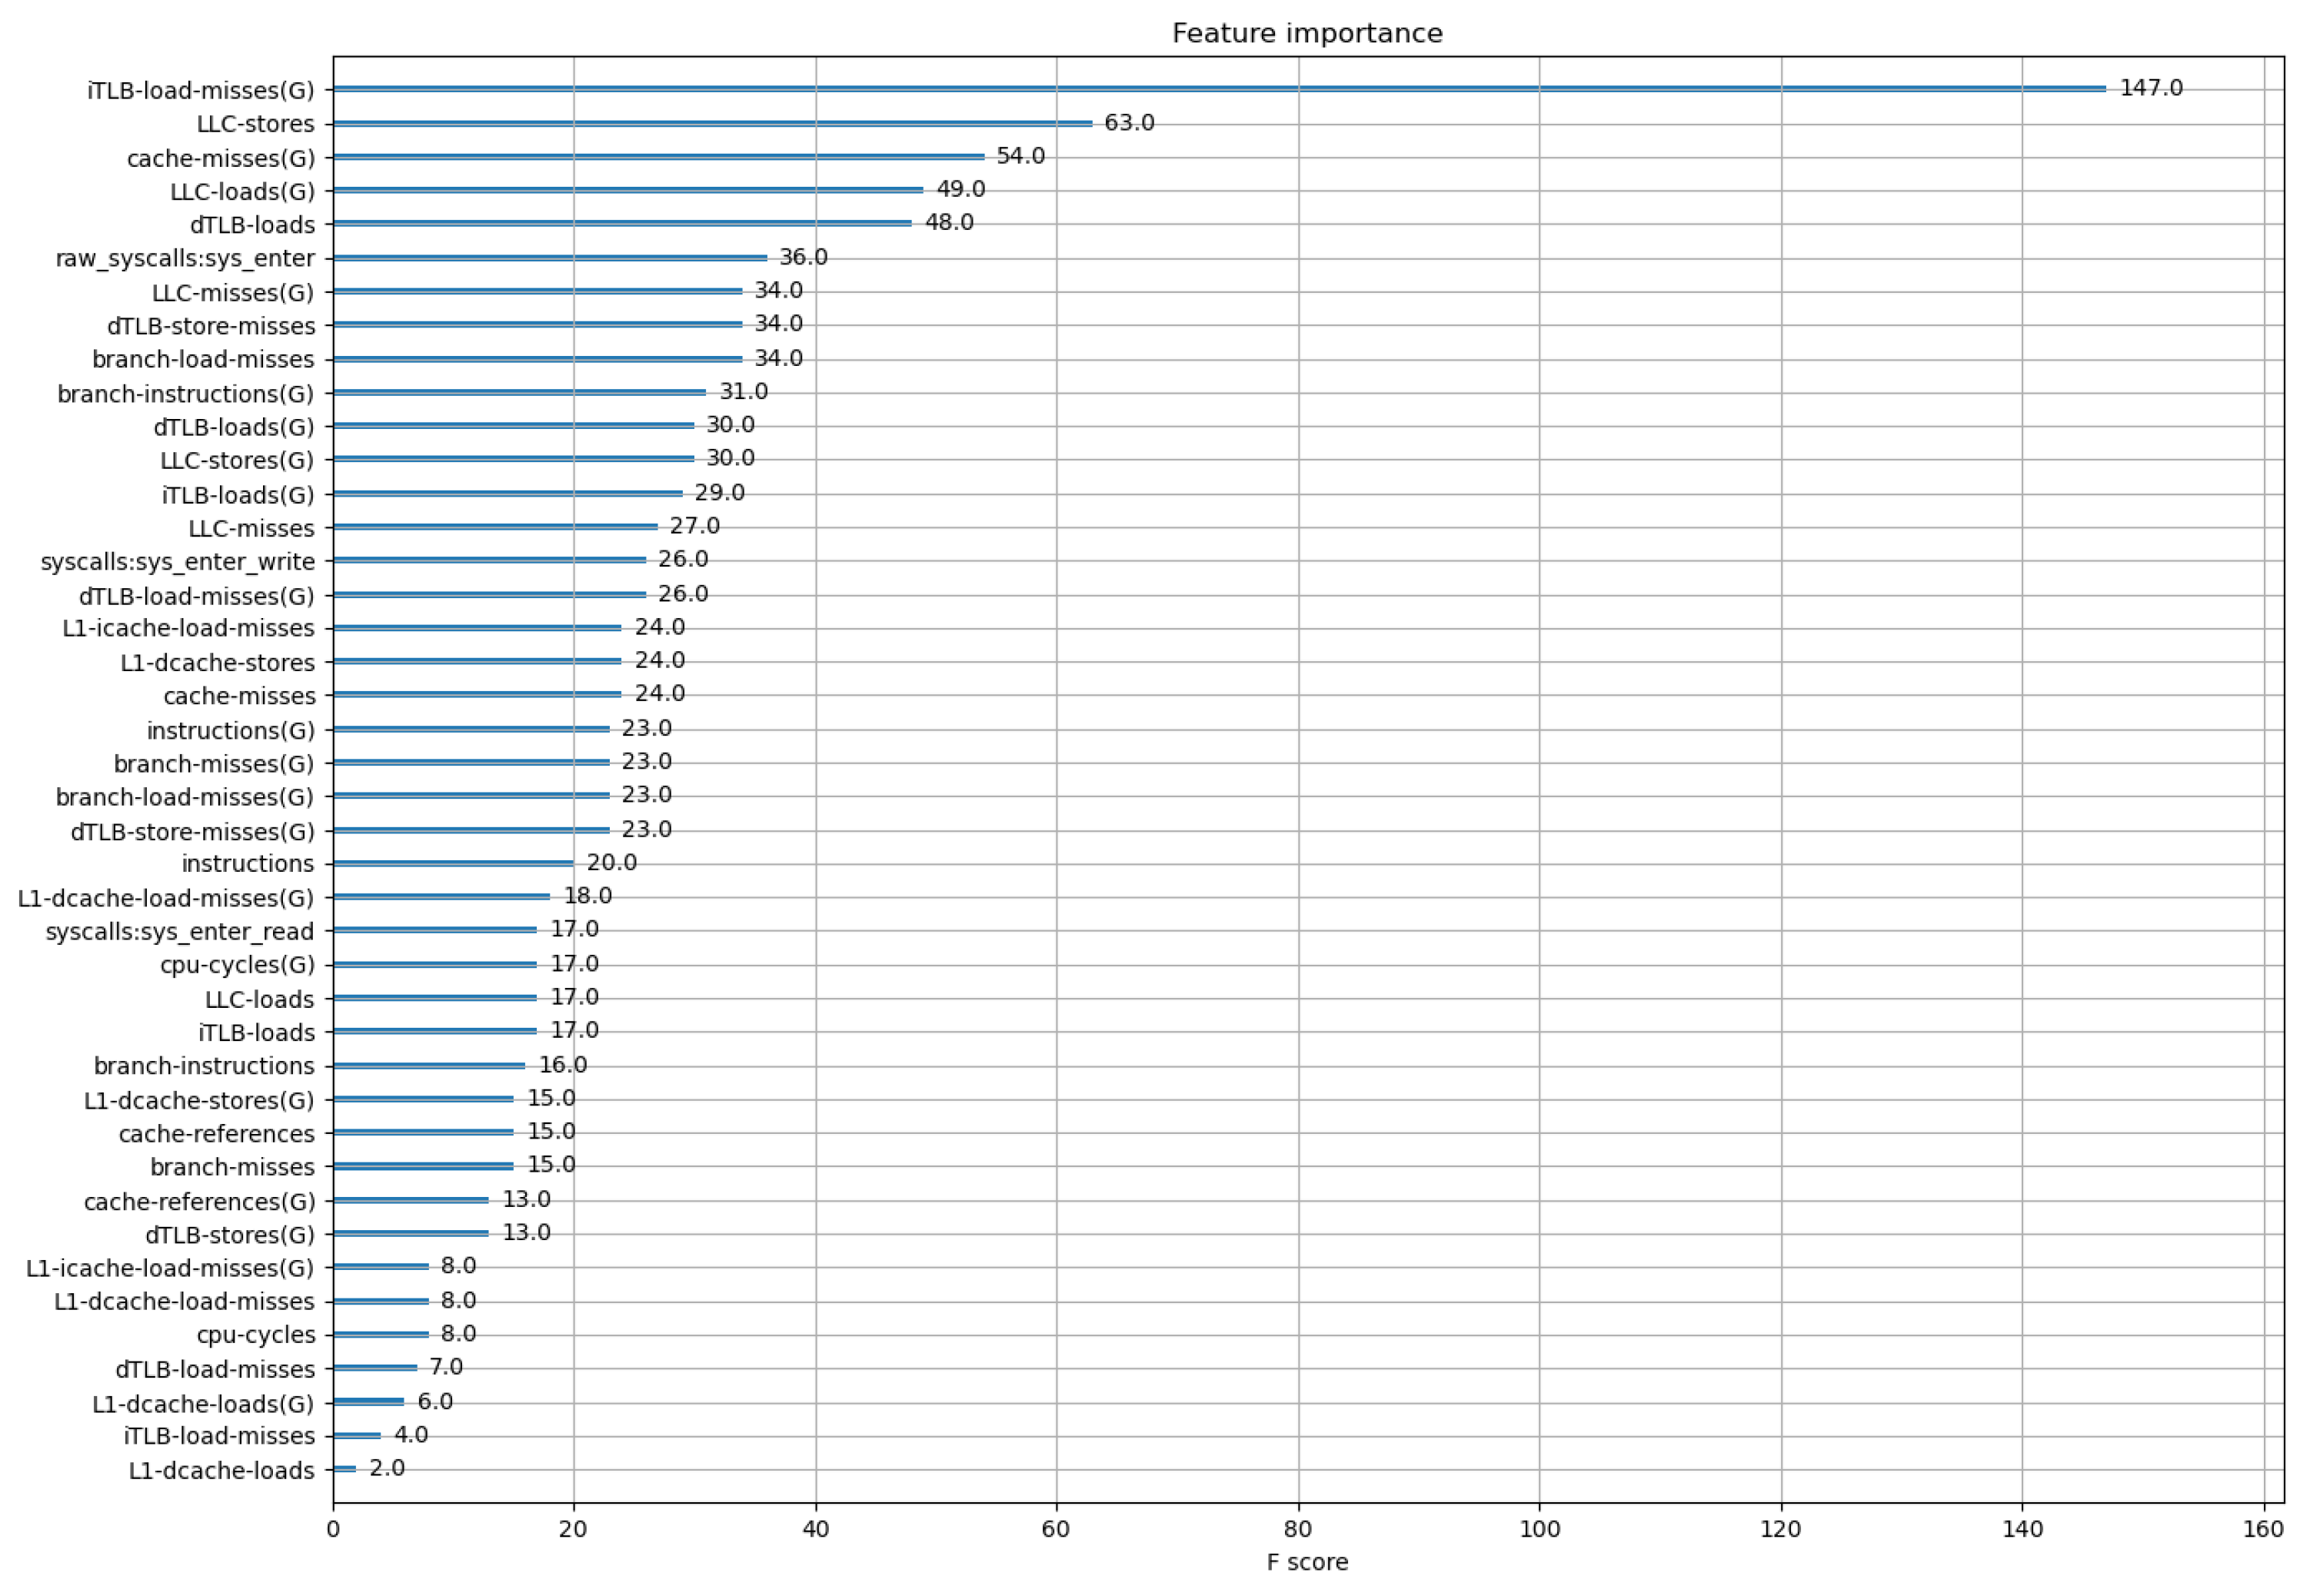
To provide a better explanation of the experimental results, this paper takes a feature-centric approach and explains results based on the ranking of feature importance. The top-ranked features contributing to high Accuracy in each dataset are shown in
Table 4. The feature importance ranking for the F1+F2+F3 dataset is illustrated in
Figure 7.
From
Table 4, it can be observed that the performance of the guest virtual machine (GVM) differed between the physical machine level and the virtualization level. In the native environment, when the physical machine performs memory accesses, the processor searches the translation lookaside buffer (TLB) to find the corresponding physical address. If the search fails (TLB miss), the processor retrieves the page table entry (PTE) from the CPU cache, which had multiple levels. If the search is successful, the processor can directly access the memory.
However, in the virtualization environment, two-level address translation is required. Firstly, the virtual address of VM is translated into the VM physical address, and then, the VM’s physical address is translated into the host physical address. Compared to the physical machine, the virtualization environment incurs higher address translation overhead because the TLB entries need to be fully flushed. In the scenario involving two-level address translation, the number of TLB misses, including data translation lookaside buffer (DTLB) misses and instruction translation lookaside buffer (iTLB) misses, significantly increase. Abnormal system behavior due to an abnormal program is more likely to trigger complete flushing of all TLBs compared to regular software, because the address it accesses is not easily predictable and often not present in the current TLB.
During walking through the page table, the last level cache (LLC) caches recently accessed page table entries (PTEs) within the local host. As the traversal goes through two layers of page tables, the number of LLC misses increases. A virtualization system with two layers of PTEs requires refreshing all PTEs from the LLC, resulting in a higher LLC load. As the number of address translation increases, the number of LLC misses and the associated load also increase. Unexpected address accesses may potentially reveal malicious behavior through these features.
In summary, the virtualization environment incurs greater overhead in address translation compared to the physical host due to complete flushing of TLB entries. This presents an opportunity for the abnormal behavior of a VM to more easily trigger full TLB flushes. Furthermore, as the traversal of two-level page tables occurs, increased LLC misses and load indicate unexpected address accesses that may expose abnormal behavior.
Therefore, there is a difference in feature importance between the physical host level and virtualization level. It is precisely for this reason that higher Accuracy can be achieved by combining features obtained from different dimensions. Based on
Table 4 and
Figure 5,
Figure 6 and
Figure 7, it can be concluded that, as the number of features from different dimensions increases, Accuracy also improves.
8. Conclusions and Future Work
This paper presents FFABD for abnormal behavior detection. The method captures hardware features and syscalls at different levels and achieves high Accuracy through the ensemble learning algorithm. Additionally, the experimental result was explained for interpretability. The proposed method offers advantages such as low performance overhead and high Accuracy and bridges the semantic gap compared to traditional VMM-based detection methods.
8.1. Limitation
However, the method also has certain limitations. In order to reduce the interference of external factors, an experiment was conducted with only one VM running on the KVM platform. In the real cloud environment, multiple VMs are typically present. In such a real cloud environment, when multiple VMs run on a single platform, the vCPUs of multiple VMs may correspond to the CPUs of the same physical host, leading to time-sharing multiplexing of the physical host CPU. This will impact the Accuracy and reliability of the vHPC data obtained at the virtualization level, which presents an important challenge that we need to address.
8.2. Future Work
In future work, we will focus more on deploying the method in a complex cloud environment with multiple VMs and tenants. However, as the number of VMs increases, noise generated by other VMs may affect the feature data obtained at the physical machine level and the virtualization level. Overcoming these challenges will be a key focus of our future research. Additionally, we will further expand the available features for abnormal behavior in the virtualization environment and explore better methods and classification models for abnormal behavior detection.


