Article

Advanced Fuzzy Sets and Genetic Algorithm Optimizer for Mammographic Image Enhancement

by
Anastasios Dounis
*,
Andreas-Nestor Avramopoulos
and
Maria Kallergi
Department of Biomedical Engineering, Egaleo Park Campus, University of West Attica, 12243 Athens, Greece
*
Author to whom correspondence should be addressed.
Electronics 2023, 12(15), 3269; https://doi.org/10.3390/electronics12153269
Submission received: 5 July 2023 / Revised: 26 July 2023 / Accepted: 28 July 2023 / Published: 29 July 2023
(This article belongs to the Special Issue Advances in Fuzzy and Intelligent Systems)

Abstract

:
A well-researched field is the development of Computer Aided Diagnosis (CADx) Systems for the benign-malignant classification of abnormalities detected by mammography. Due to the nature of the breast parenchyma, there are significant uncertainties about the shape and geometry of the abnormalities that may lead to an inaccurate diagnosis. These same uncertainties give mammograms a fuzzy character that is essential to the application of fuzzy processing. Fuzzy set theory considers uncertainty in the form of a membership function, and therefore fuzzy sets can process imperfect data if this imperfection originates from vagueness and ambiguity rather than randomness. Fuzzy contrast enhancement can improve edge detection and, by extension, the quality of related classification features. In this paper, classical (Linguistic hedges and fuzzy enhancement functions), advanced fuzzy sets (Intuitionistic fuzzy set (ΙFS), Pythagorean fuzzy set (PFS), and Fermatean fuzzy sets (FFS)), and a Genetic Algorithm optimizer are proposed to enhance the contrast of mammographic features. The advanced fuzzy sets provide better information on the uncertainty of the membership function. As a result, the intuitionistic method had the best overall performance, but most of the techniques could be used efficiently, depending on the problem that needed to be solved. Linguistic methods could provide a more manageable way of spreading the histogram, revealing more extreme values than the conventional methods. A fusion technique of the enhanced mammography images with Ordered Weighted Average operators (OWA) achieves a good-quality final image.

1. Introduction

Breast cancer has preoccupied scientists for many years because of the worrisome statistics that arise. Globally, 1 in every 6 women, or 16%, who have breast cancer died in 2020 [1] (p. 15). In the United States, for the years 2017–2019, women have a lifetime probability of 12.9%, or 1 in every 8 women to develop invasive breast cancer [2] (p. 23). This creates the urge to develop and improve systems that can help physicians accurately and consistently identify features linked to invasive breast cancer at an initial stage. The importance of Decision Support Systems (DSS) in the health field has become crucial. Computer Aided Diagnosis (CADx) is part of the DSS and supports physicians in the accurate classification of mammographic findings, with promising results to date.
Medical images are inherently noisy and blurry due to the physical properties of the imaging devices. Edges and outlines of mammographic features have additional blurring due to the nature of the parenchyma [3,4,5,6,7]. Accurate diagnosis requires that physicians have a good knowledge of the diverse appearance of pathology on the images. Noise and blur distort the appearance of pathology and lead to misclassification. Contrast enhancement techniques could improve contrast, restore pathological features, and, hence, assist in accurate diagnostic decisions [4,5,7,8].
There are many contrast enhancement methods, and the most common is histogram equalization, which maps the spatial histogram of the image to a uniform distribution. Histogram equalization suffers from enhancing the image globally and not locally. Other methods include gray level and Fourier transform coefficient modification. Unfortunately, medical images have uncertainties and noise that prevent optimum application of these methods [3,5,6,7,9]. Mathematical tools such as fuzzy sets could provide a better approach to medical image enhancement since they take into consideration the already fuzzy character of the image. Fuzzy sets have attracted attention in image processing because they are non-linear and based on knowledge. There are fuzzy techniques that manage noisy and vague data and can perform better than the classic methods. They have as parameters a membership degree, a non-membership that is not the complement of the membership, and a hesitation degree. These degrees result in an enhancement method that is closer to aspects of human decision-making [5,6,7] (p. 88). The main purpose of enhancing the contrast of an image is to improve the contrast overall and locally, create an image more suitable for physician observation or computer processing, improve its visual effect, and avoid noise amplification. It creates an image that obtains better results in further processing [8].
Some related articles on contrast enhancement are going to be discussed. Sankar et al. [4] proposed a technique where they used three stages to reach the final enhanced image. It consisted of two enhancement stages and one smoothing stage. First, a linguistic hedge enhanced the image; after that, the enhanced image was smoothed by many techniques that they proposed; and finally, the image was enhanced again. Chaira [5] analyzed the ways of enhancing medical images with IFS and using Type II fuzzy sets. Furthermore, Chaira [6] proposed the enhancement of medical images using an alternative intuitionistic fuzzy generator. The parameters in the image were optimized by using fuzzy entropy and then an additional linguistic hedge to improve the enhancement. Deng et al. [7] suggested a method that first applies a membership function using the restricted equivalence function, divides the image into sub-objects and sub-backgrounds, and then implements a fuzzification, hyperbolization, and defuzzification operation on each sub-area, claiming that the visual quality of the region of interest is significantly improved. A general overview of basic fuzzy image enhancement was analyzed by Tizhoosh [3], where he presented minimization of fuzziness, rule-based contrast enhancement, and locally adaptive contrast improvement. Image fusion is a method that is widely applied in computer vision and medical science [10]. Medical image fusion is a high-level research topic in the field of mammography [11]. Image fusion has been applied in the papers [12,13,14], and they have studied image segmentation, colored and grayscaled medical images, and multimodal medical images. Tang et al. [15] proposed an image enhancement technique that is based on the wavelet domain and tested it objectively with a performance indicator and subjectively using the opinions of medical experts. Da Silva et al. [16] developed methods for improving ultrasound images and classified them as benign, malignant, and normal. The performance of the techniques was measured by multiple performance indicators.
Mass pathology detection at mammograms refers to detecting whether a breast mass is malignant or benign. Mammograms are images with different shades of gray. Each pixel gives the perspective of the X-ray absorption from the tissue. The bigger the absorption is, proportionally, the bigger the index of the pixel. The intention is to enhance the pixels that have a high index, which means the tissue with components that absorb the X-rays the most. This happens because the information about a mass can be found in the high pixels. This area of pixel values is interesting even if a DSS is specialized in detecting malignant and benign micro-calcifications. Micro-calcifications also have interesting information at high pixel levels. In the case of this article, it is a challenge to identify a mass in cases of dense breasts because it blends in with the tissue that surrounds it. Dense masses have higher density tissue than a usual breast, and because of that, the absorption is bigger, so, consequently, the index of the pixel will be bigger. The identification of a mass in a dense breast is more difficult, and the values of the pixels cannot be separated easily. This is why ultrasound is used in dense breasts in order to find masses that are not at an early stage [17].
Techniques for image enhancement can be focused on the spatial and frequency domains of the image [18]. In this work, contrast enhancement in the spatial domain is based on advanced fuzzy sets, OWA operators, and genetic algorithms (GA). The sequence of applied methods is:
  • Linguistic hedges (LH)
  • Fuzzy enhancement function [19] (LH-XWW)
  • Advanced fuzzy sets (IFS, PFS, and FFS)
  • OWA aggregation for image fusion
  • GA to optimize parameters.
LH are classical membership functions that can be adjusted by changing the constants of the functions. The LH-XWW with parameters α, β, γ, is based on an initial linguistic hedge and then on a function that contains the three parameters. These two methods can provide a plethora of images by changing their constants.
Image enhancement employs a variety of membership and non-membership functions, such as IFS, PFS, and FFS.
The different contrast enhancement images are combined using multi-fuzzy sets and the OWA aggregation function for a final fused image.
This paper is organized as follows. Section 2 outlines the preliminaries of the lowpass filter, fuzzy sets, linguistic hedges, linguistic function, intuitionistic, pythagorean, and fermatean fuzzy sets, GA optimizer, and OWA operators. It also contains the mathematical formulas for them, the evaluation indicators, and the origin of the mammography images. Section 3 discusses the experimental results. Finally, the discussion of this paper is given in Section 4.

2. Materials and Methods

2.1. Preliminaries

2.1.1. Low-Pass Filter

A preprocessing step is necessary for creating a smoother image than the original that will be used as input to the enhancement algorithm. A lowpass filter is often used for preprocessing. The most common low-pass filter in the spatial domain is the median filter, where a pixel is replaced by the median of the neighboring pixels and itself. This is an effective non-linear filter that allows denoising while preventing edge blurriness that a linear low-pass filter would create [20,21,22,23]. In this paper, a median filter is used for preprocessing that gathers the pixels from a 5 × 5 window and replaces the central pixel with the median.

2.1.2. Fuzzy Sets

According to Zadeh [24,25], fuzzy Logic aims at fuzzifying an initial state into another region of numbers. Having a non-empty set S = { s 1 , s 2 , , s n   } and defining a fuzzy set:
A = s , μ A s s S
where μ A s : S [ 0,1 ] is the degree of membership of s in S.

2.1.3. Linguistic Hedges

Fuzzy sets start with the fuzzification of the initial image. In our case, the fuzzified image is the one that has been through the low-pass filter. The fuzzification is being completed by the following function:
μ A g i , j = g ( i , j ) g m i n g m a x g m i n
where g is an element from the gray scale image A at the i row and j column. g m i n and g m a x are the minimum and maximum elements of the image A [3].
The linguistic hedges are applied to the fuzzified output of the low-pass filter. There are three types of linguistic hedges that are going to be discussed. CON from concentration, DIL from dilation, and INT from intensification [4,26,27]. Their mathematical representations are as follows:
μ C O N X u = μ X u 2
μ D I L X u = μ X u 0.5
μ I N T X u = 2 μ X u 2 i f   0 μ X u 0.5 1 2 1 μ X u 2 i f   0.5 < μ X u 1
We can also use different exponents for CON and DIL so we can achieve a more intense result. For example:
μ C O N X u = μ X u 1.5
μ D I L X u = μ X u 0.25
Generally, DIL makes an image brighter, concentrating the higher values of the pixels and spreading the lower values. On the other hand, CON concentrates the lower values and spreads the higher values.

2.1.4. Linguistic Hedge Xie, Wang, Wu

Xie et al. [19] proposed an additional function that is going to be applied to the already fuzzified and processed image. The crucial part is the additional formula that we are going to use on the CON linguistic hedge.
Firstly, the image is fuzzified and then processed with CON. Furthermore, the following linguistic hedge proposed by Xie, Wang, and Wu (LH-XWW) is applied:
μ X W W u = μ X u α γ α 1 i f   0 μ X u γ 1 1 μ X u β 1 γ β 1 i f   γ < μ X u 1
where α 1 and β 1 indicate the magnitude of enhancing pixel values in the edge area and reducing those in the smooth are respectively, and 0 < γ < 1 .

2.1.5. Intuitionistic Fuzzy Sets

Atanassov introduced a new way of expressing fuzzy sets called intuitionistic fuzzy sets [28]. The base of this theory is to create member and non-member functions that relate to each other. An IFS of A in S is:
A = s , μ A s ,   v A s s S
where μ A s [ 0,1 ] , v A s [ 0,1 ] is the belongingness and non-belongingness degrees of an s in the set of A. The condition 0 μ A s + v A s 1 where non-belongingness is v A s = 1 μ A s β 1 β according to Yager, for every s in A.
Another parameter is the degree of indeterminacy: π A s = 1 μ A s v A s .

2.1.6. Pythagorean Fuzzy Sets

As IFS, Yager proposed the PFS, where they also have membership, non-membership, and a different indeterminacy. Membership μ expresses the foreground of the grayscale image, non-membership ν the background, and indeterminacy π the edges. These expressions have to be obtained by executing the functions μ, ν, and π. μ P s [ 0,1 ] and v P s [ 0,1 ] are the membership and non-membership, respectively [26,29]. The PFS is:
P = s , μ P s ,   v P s s S
Indeterminacy at PFS is defined as π P = 1 μ P s 2 v P s 2 .

2.1.7. Fermatean Fuzzy Sets

An FFS can be defined as IFS and PFS but with a different indeterminacy. μ F ( s ) [ 0,1 ] and v F s [ 0,1 ] are the membership and non-membership respectively [29]. The indeterminacy is π F = 1 μ F s 3 v F s 3 3 .

2.1.8. Multi-Fuzzy Sets

A multi-fuzzy set of dimension n > 2 over a finite universe U is defined by a mapping A : U 0,1 n given by A u = A 1 u , A 2 u , , A n ( u ) where each of the A j   f o r   j 1,2 , , n is a mapping A j : U 0,1 .

2.1.9. GA Optimizer

According to Shabani et al. [30], GA has many successful applications in many fields. The ability to optimize a problem makes them useful in fuzzy logic, neural networks, expert systems, and problems that lack certainty. To solve a nontrivial problem using a GA, we transform the problem into an appropriate form. At the start of the algorithm, chromosomes are chosen randomly from the search space, representing the initial population’s potential solutions. Each solution is evaluated in terms of its fitness function. Genetic operators are also used to adjust the competition between the chromosomes. The operators are selection, mutation, and crossover, which are applied one after the other and create a new generation of the initial population. The quality of the new generation of chromosomes is expected to be better than the previous. The process of using the new generation as the next initial generation is repeated until a termination criterion is met. The last generation is the one that indicates the final solution.

2.1.10. OWA Operators

The OWA operators were introduced by Yager [31] and compromise a parameterized family of idempotent averaging aggregation functions. They fill the gap between the operators min and max. An OWA operator of dimension n can be defined as a mapping: F : 0,1 n 0.1 if there exists a weighting vector W = w 1 , w 2 , , w n with i = 1 n w i = 1 such that F a 1 , a 2 , , a n = j = 1 n w j b j with b j the j -th largest of the a i . Out of the five new images that we have created, we get a set of the same dimensions for all five fuzzy images and apply the operators. Furthermore, we aggregate the values and do the same procedure for every pixel of the images. In order to find the right weight operators that fulfill the conditions, GA is being used. The result is a set of weight operators that are on ascent or descent allocation, depending on a parameter named orness α [31,32,33].

2.1.11. OWA-GA

The aim of this algorithm is to find the weights that satisfy the conditions [31,32,33]:
c o n d i t i o n s = o r n e s s w = α = i = 1 n n i w i n 1 , 0 α 1 i w i = 1 0 w i 1
To find the optimal weights “w” we have to maximize the following:
M a x i m i z e : D i s p w = w i ln ( w i )
To do that we use GA and use as an objective function the Formula (12).

2.1.12. OWA-HK

Hong and Kim [34] presented a new analytical solution for determination of optimal weights satisfying of (11) and (12), knowing that that they are not unstable when compared with the OWA GA [34]. The function is:
f x = n 1 α x n + 1 n 1 α + 1 x n + n n 1 α x + 1 n + n 1 α
The Equation (13) has exactly one real root x u over the interval 1 , 1 n .
The weights are found by:
w j = x u j i = 1 n x u i
where i and j takes values from 1 to the amount of weights that we want to extract.

2.2. Image Contrast Enhancement

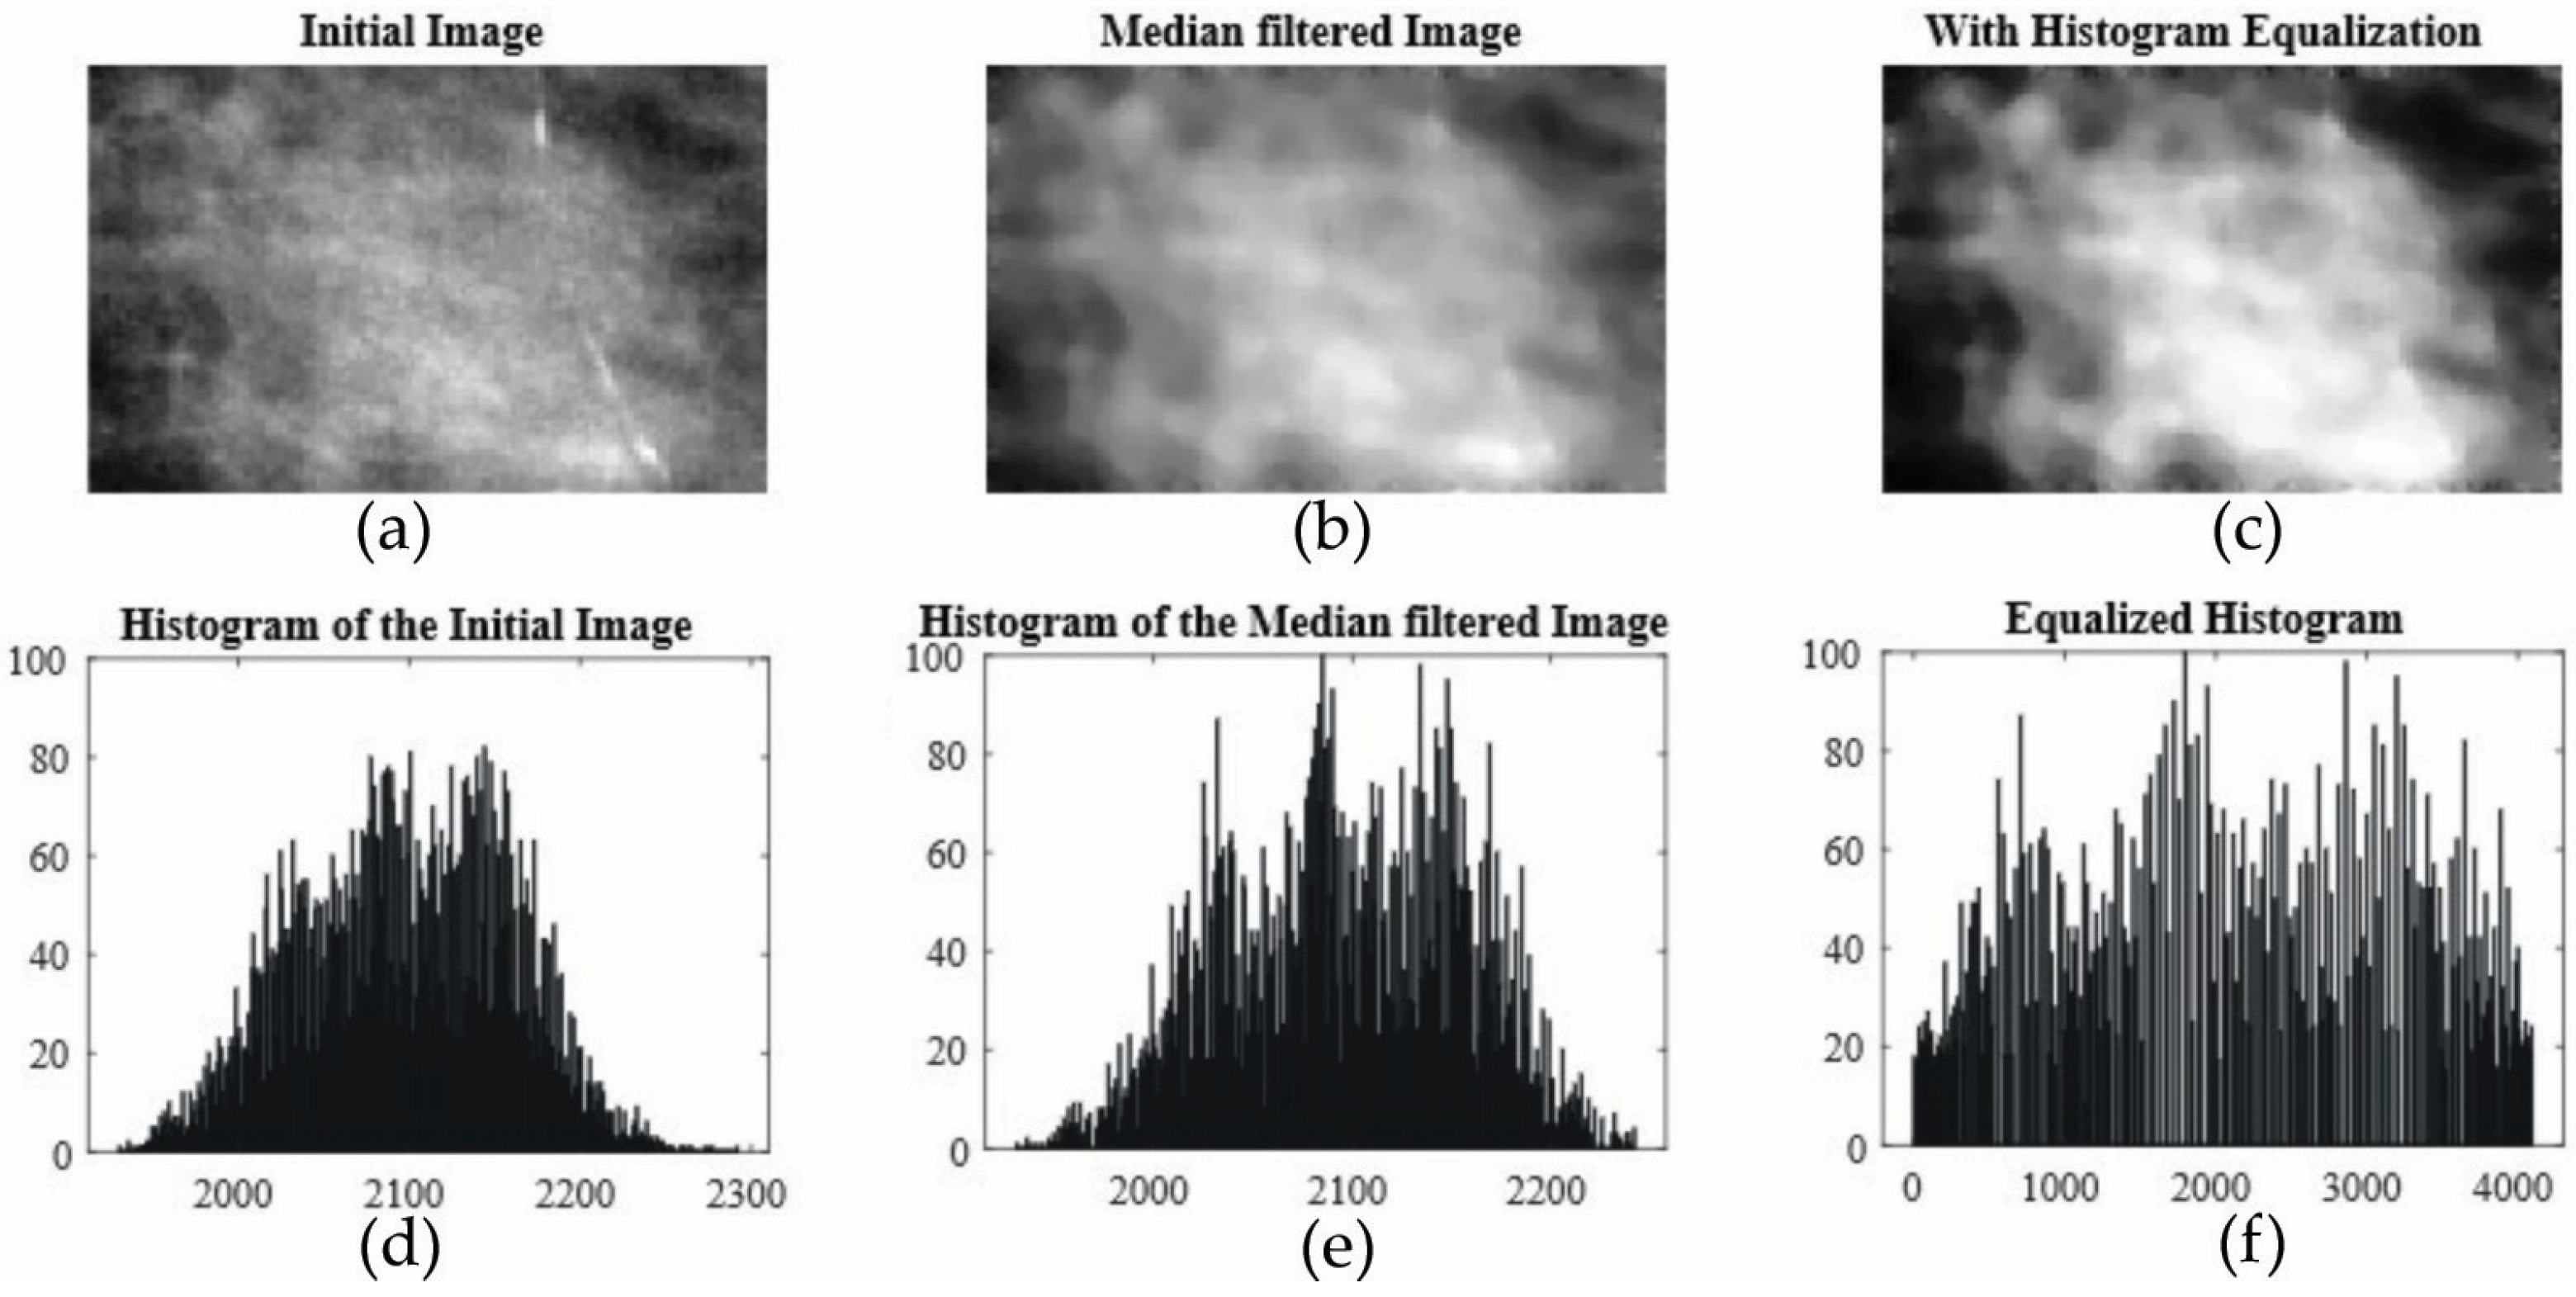
2.2.1. Histogram Equalization

Histogram equalization is an effective contrast enhancement method for images. It is a technique that increases the dynamic range of the histogram. The output of this method contains pixels with an intensity that follows a uniform distribution. It utilizes the cumulative distribution function (CDF) of the input so it can map the input intensity levels. The method can be used on the whole image or just a region of interest. The intensities of a histogram are redistributed, having lower peaks and a wider spread [35,36].
An input image has L numbers of discrete intensity levels. The probability distribution function for the kth intensity level is:
p ( k ) = n ( k ) k = 0 L 1 n ( k ) = n ( k ) N
where k [ 0 , L 1 ] , n k is the number of pixels having the kth intensity level, and N is the total number of pixels of the image.
The CDF for the kth intensity level is:
c k = q = 0 k p q           k [ 0 , L 1 ]
c ( L 1 ) is always a unity. The CDF value is used as a transformation function which maps the input intensity level to new intensity level. The following T is a transformation function which maps the input intensity level k into new output intensity level T ( k ) :
T k = ( L 1 ) × c ( k )  
where x is the nearest integer function value of x. The output image O ( i , j ) is a transformed version of input I ( i , j ) :
O i , j = T I i , j         ( i , j ) I
Histogram equalization presents undesirable visual artifacts because of an excessive brightness shift, because of enhancing noisy regions of the image, or because of saturating intensities [35].

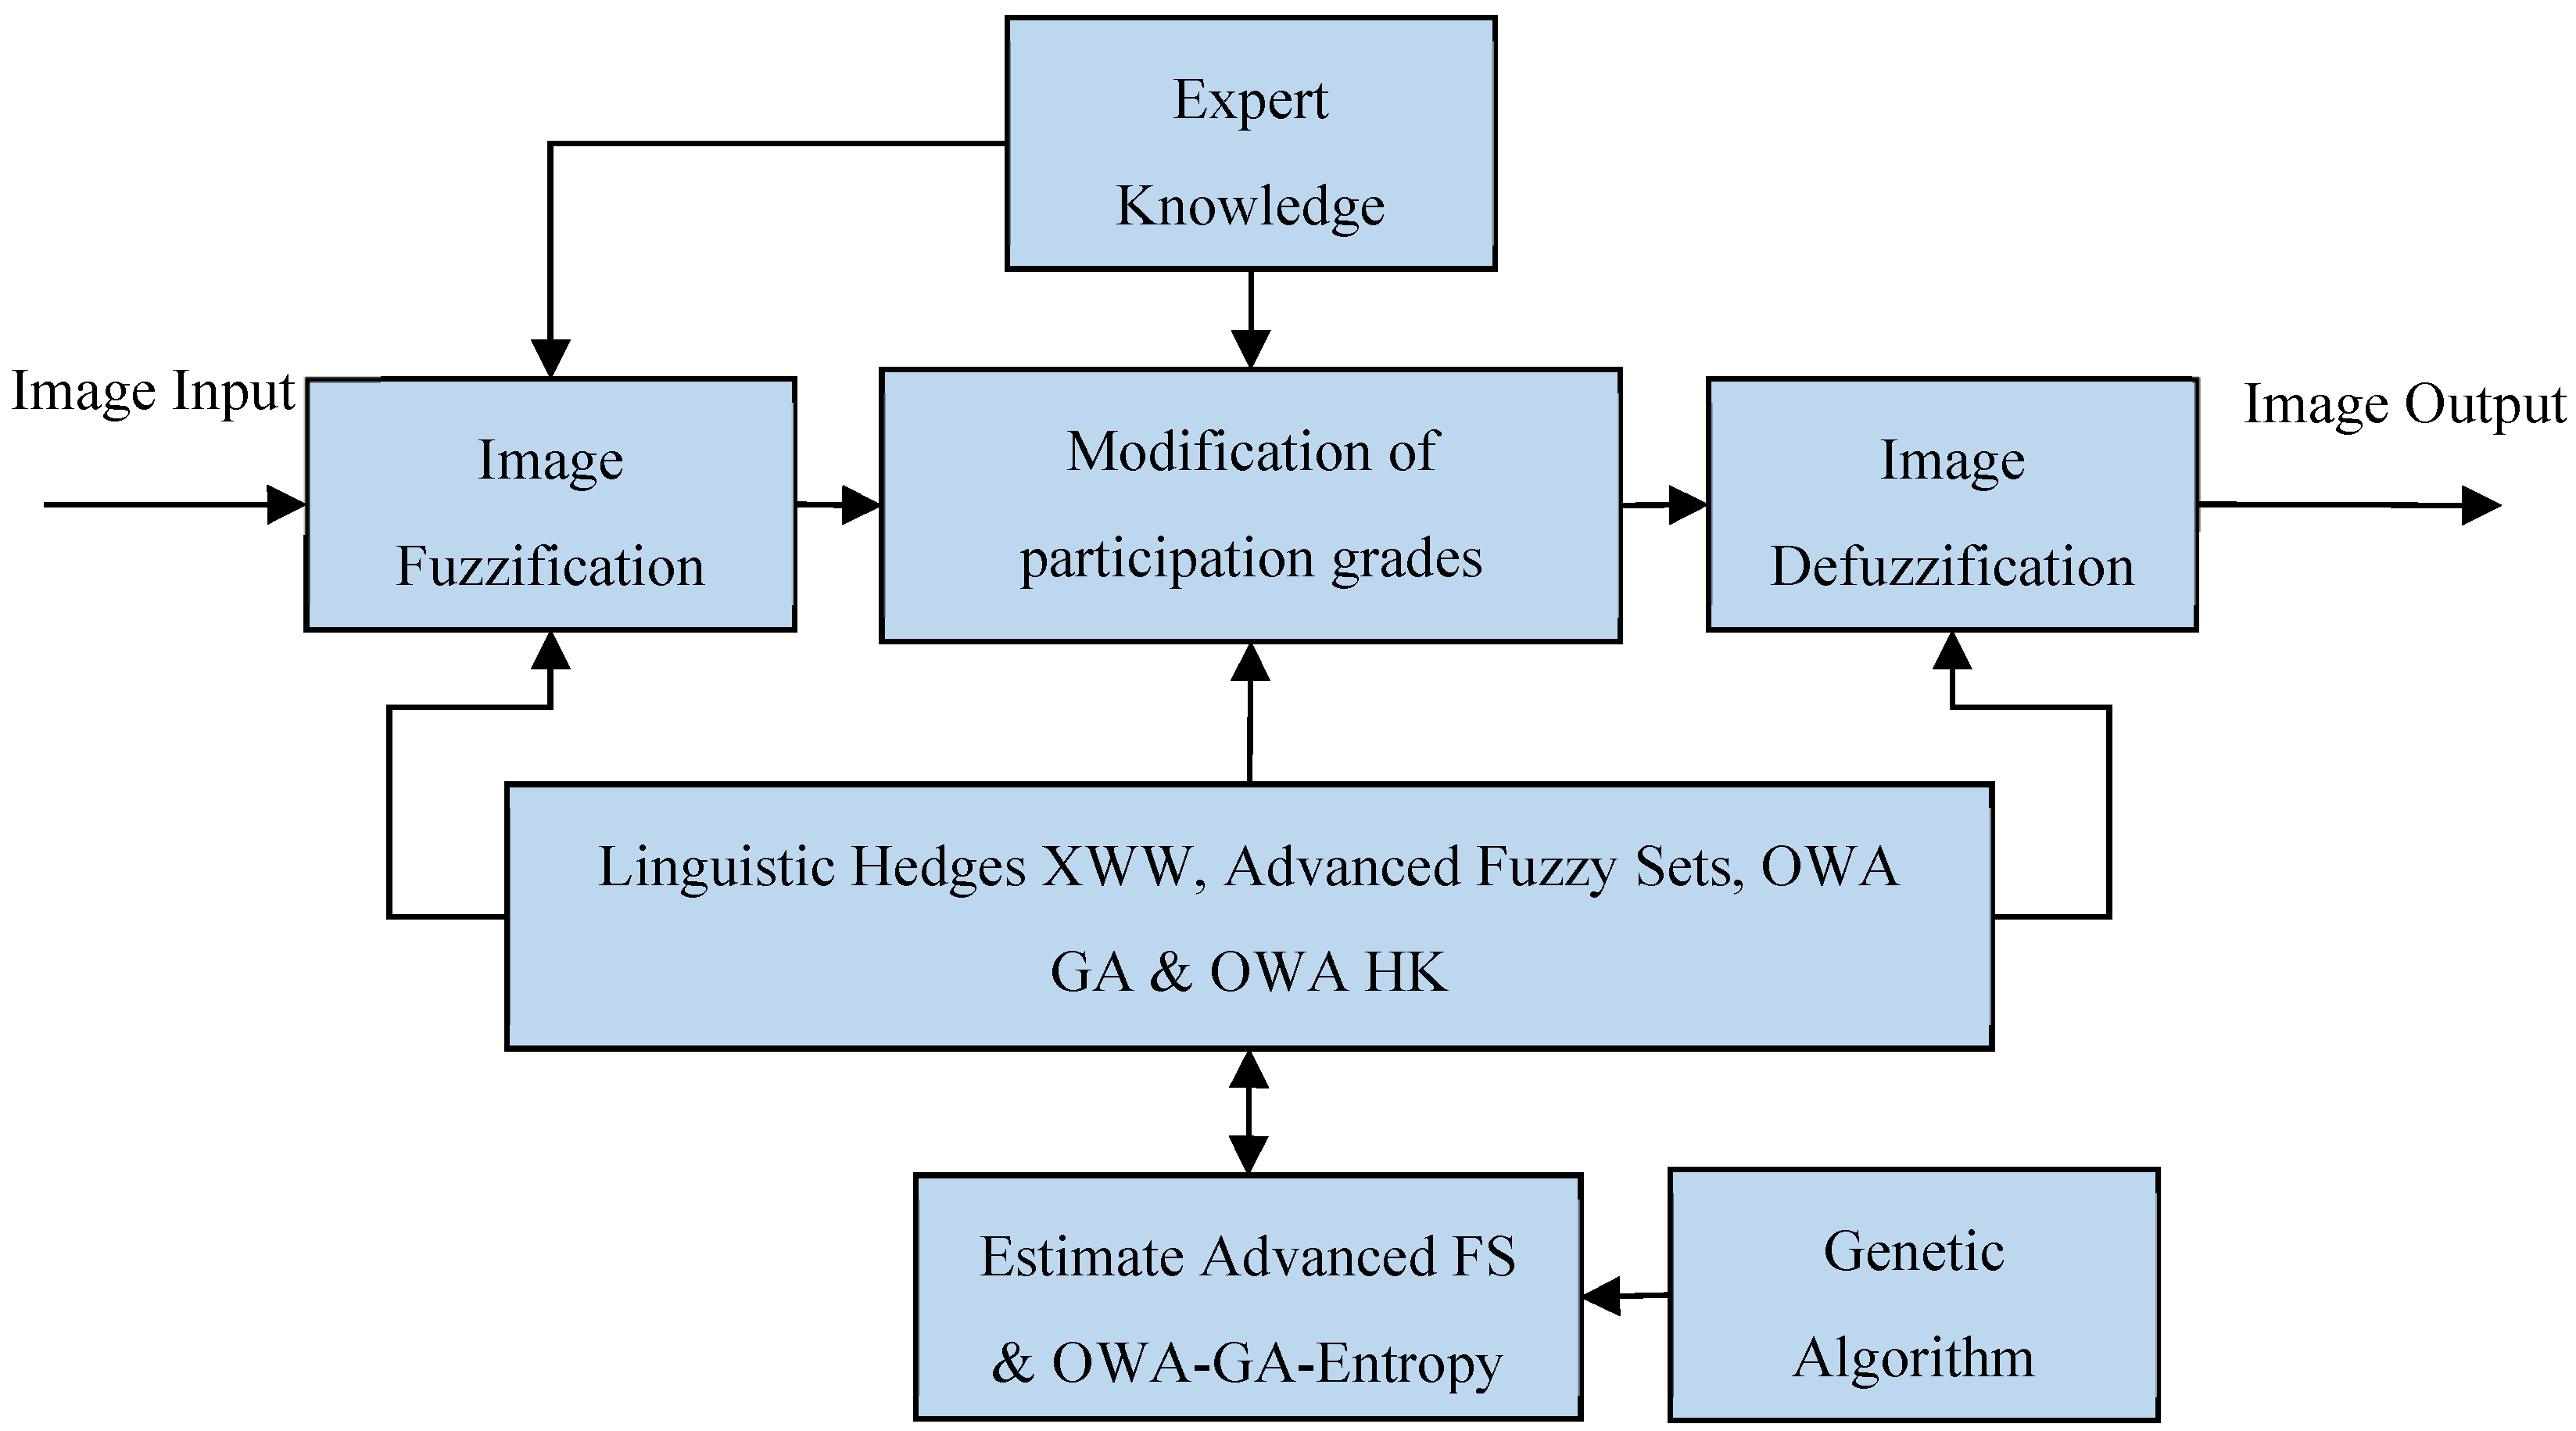
2.2.2. Structure of the Fuzzy Image Processing Algorithm

The general model of processing images with fuzzy sets can be depicted in Figure 1 [8] (p. 53). The enhancement system is split into three phases: image fuzzification, image defuzzification, and membership value modification. The image that we want to process gets into the system and gets fuzzified with a membership function. Furthermore, we use specific methods to enhance the contrast of the image. These methods are functions that modify the values of the image. Finally, the fuzzified image gets defuzzified and returns to its original values.

2.2.3. Advanced Fuzzy Sets for Image Enhancement

Linguistic Hedge XWW

LH-XWW has the parameters α, β, and γ that are not determined. For this reason, GA was used in order to find the optimized values of α and β. The γ was found with the technique trial and error. Changing the value of γ and observing the different images that the algorithm would extract, we found that γ = 0.3 is a near optimum value. α and β were found by using as objective functions the entropy and ambiguity of the image.
The objective functions of entropy:
H X = 1 M · N · l n 2 · m = 1 M n = 1 N μ m n · ln μ m n 1 μ m n · ln 1 μ m n
and ambiguity:
γ X = 2 M · N · m = 1 M n = 1 N min ( μ m n , 1 μ m n )
where M and N are the dimensions of the image and μ m n is the participation degree of the pixel of the processed by the LH-XWW image [37,38,39,40].
Entropy and ambiguity were used as multiple objective functions for the GA, and the algorithm tried to achieve a value of 0.4 for both of them, a value that was decided after trying and observing the results.

Intuitionistic, Pythagorean, and Fermatean Fuzzy Image

IFS, PFS, and FFS have the same process structure, following the same path but changing the theory. To create an Intuitionistic fuzzy image (IFI) membership, non-membership, and indeterminacy formulas have to be found [5,6,26]. For the beginning, the initial gray scale image A, which has been through the lowpass filter, is fuzzified by the function (2).
Following this, the membership is found by the next formula:
μ A I F S μ A i , j = 1 1 μ A i , j 1 + e λ 1 μ A i , j ,   λ > 0
This model is implementing the fuzzy negation Ψ x = 1 x 1 + e λ 1 x were λ > 0. The non-membership is found by:
ν A I F S = Ψ ( μ A I F S ) ν A I F S μ A I F S i , j = 1 μ A I F S ( i , j ) 1 + e λ + 1 1 μ A I F S ( i , j ) , λ > 0
The indeterminacy is found by:
π A I F S μ A i , j = 1 μ A I F S ( μ A i , j ν A I F S ( μ A ( i , j )
having the condition of 0 μ A I F S ( μ A ( i , j ) + ν A I F S ( μ A ( i , j ) 1 [41].
The parameter λ is not constant and connotes the trial of finding its optimal value. Using the entropy as an objective function that we want to maximize or minimize, it is possible to find the optimal value of λ so the enhancement can be maximized. The Intuitionistic Fuzzy Entropy (IFE) is:
I F E = i = 0 W j = 0 H π A I F S μ A i , j · e 1 π A I F S μ A i , j  
In our case, maximizing the Equation (24) corresponds to the optimum λ value.
λ o p t = max ( I F E )
and finding the optimal λ value it can be used to Equation (21):
μ A I F S ( μ A ( i , j ) ) = 1 1 μ A ( i , j ) 1 + e λ o p t 1 μ A ( i , j )
Equation (26) is the Intuitionistic Fuzzy Image that is going to be used for the enhancement formula [5,26] (5, p. 75).
The steps to create the Pythagorean Fuzzy Image (PFI) are similar with the IFI. This is because the PFI formula is created by a different degree of indeterminacy [42]. Therefore, the membership for PFS is:
μ A P F S μ A i , j = 1 1 μ A i , j 1 + e λ 1 μ A i , j , λ > 0
The non-membership is found by:
ν A P F S ( μ A P F S ( i , j ) ) = 1 μ A P F S ( i , j ) 1 + e λ + 1 1 μ A P F S ( i , j ) , λ > 0
The indeterminacy is found by:
π A P F S μ A i , j = 1 ( μ A P F S ( μ A ( i , j ) ) ) 2 ( ν A P F S ( μ A ( i , j ) ) ) 2
having the condition of 0 ( μ A P F S ( μ A ( i , j ) ) ) 2 + ( ν A P F S ( μ A ( i , j ) ) ) 2 1 [42] (p. 58).
The parameter λ is optimized using, as an objective function, the entropy of the PFS. The formula for the entropy is recommended by De Luca and Termini and is one of numerous entropies that they have tested. The Pythagorean Fuzzy Entropy (PFE) is:
P F E = 1 W · H i = 0 W j = 0 H ( π A P F S ( μ A ( i , j ) ) ) 2 + 1 ( μ A P F S ( μ A ( i , j ) ) ) 2 ( ν A P F S ( μ A P F S ( i , j ) ) ) 2 ( π A P F S ( μ A ( i , j ) ) ) 2 + 1 + ( μ A P F S ( μ A ( i , j ) ) ) 2 ( ν A P F S ( μ A P F S ( i , j ) ) ) 2
In our case, maximizing the Equation (30) corresponds to the optimum λ value.
λ o p t = max ( P F E )
and finding the optimal λ value it can be used to Equation (27):
μ A P F S ( μ A ( i , j ) ) = 1 1 μ A ( i , j ) 1 + e λ o p t 1 μ A ( i , j )
Equation (32) is the Pythagorean Fuzzy Image that is going to be used for the enhancement formula [26].
The Fermatean fuzzy image (FFI) has the same path as IFI and PFI [29]. The membership is found by the next formula:
μ A F F S μ A i , j = 1 1 μ A i , j 1 + e λ 1 μ A i , j , λ > 0
And the non-membership is found from:
ν A F F S μ A F F S i , j = 1 μ A F F S i , j 1 + e λ + 1 1 μ A F F S i , j , λ > 0
The indeterminacy for the FFS is:
π A F F S ( μ A ( i , j ) ) = 1 ( μ A F F S ( μ A ( i , j ) ) ) 3 ( ν A F F S ( μ A ( i , j ) ) ) 3 3
having the condition of 0 ( μ A F F S ( μ A ( i , j ) ) ) 3 + ( ν A F F S ( μ A ( i , j ) ) ) 3 1 .
FFS also has the λ parameter, which is undetermined. Once again, GA is used so we can find the optimal value for λ. According to He et al. [43] (p.10), the objective function that the GA needs to solve is the Fermatean Fuzzy Entropy (FFE):
F F E = 1 W · H i = 0 W j = 0 H μ A F F S ( i , j ) + 1 ν A F F S ( i , j ) 2 log μ A F F S ( i , j ) + 1 ν A F F S ( i , j ) 2 + ν A F F S ( i , j ) + 1 μ A F F S ( i , j ) 2 log ν A F F S ( i , j ) + 1 μ A F F S ( i , j ) 2
This time, to minimize the Equation (36) corresponds to the optimum λ value.
λ o p t = min ( F F E )
and finding the optimal λ value it can be used to Equation (33):
μ A F F S ( μ A ( i , j ) ) = 1 1 μ A ( i , j ) 1 + e λ o p t 1 μ A ( i , j )
The last equation is the Fermatean Fuzzy Image that is going to be used as an enhancement formula.

Enhancement

The next step, and the one that needs to be completed so we can create the enhanced image, is the equation of enhancement [26]. The mathematical term for IFS is written as:
A e n h μ A A F S i , j = 2 μ A A F S μ A i , j 2 i f   0     μ A A F S μ A i , j 0.5   1 2 1 μ A A F S μ A i , j 2 i f   0.5 < μ A A F S μ A i , j 1
similarly for PFS:
A e n h μ A P F S i , j = 2 μ A P F S μ A i , j 2 i f   0     μ A P F S μ A i , j 0.5   1 2 1 μ A P F S μ A i , j 2 i f   0.5 < μ A P F S μ A i , j 1
and FFS:
A e n h ( μ A F F S i , j ) = 2 μ A F F S μ A i , j 2 i f   0     μ A F F S μ A i , j 0.5   1 2 1 μ A F F S μ A i , j 2 i f   0.5 < μ A F F S μ A i , j 1

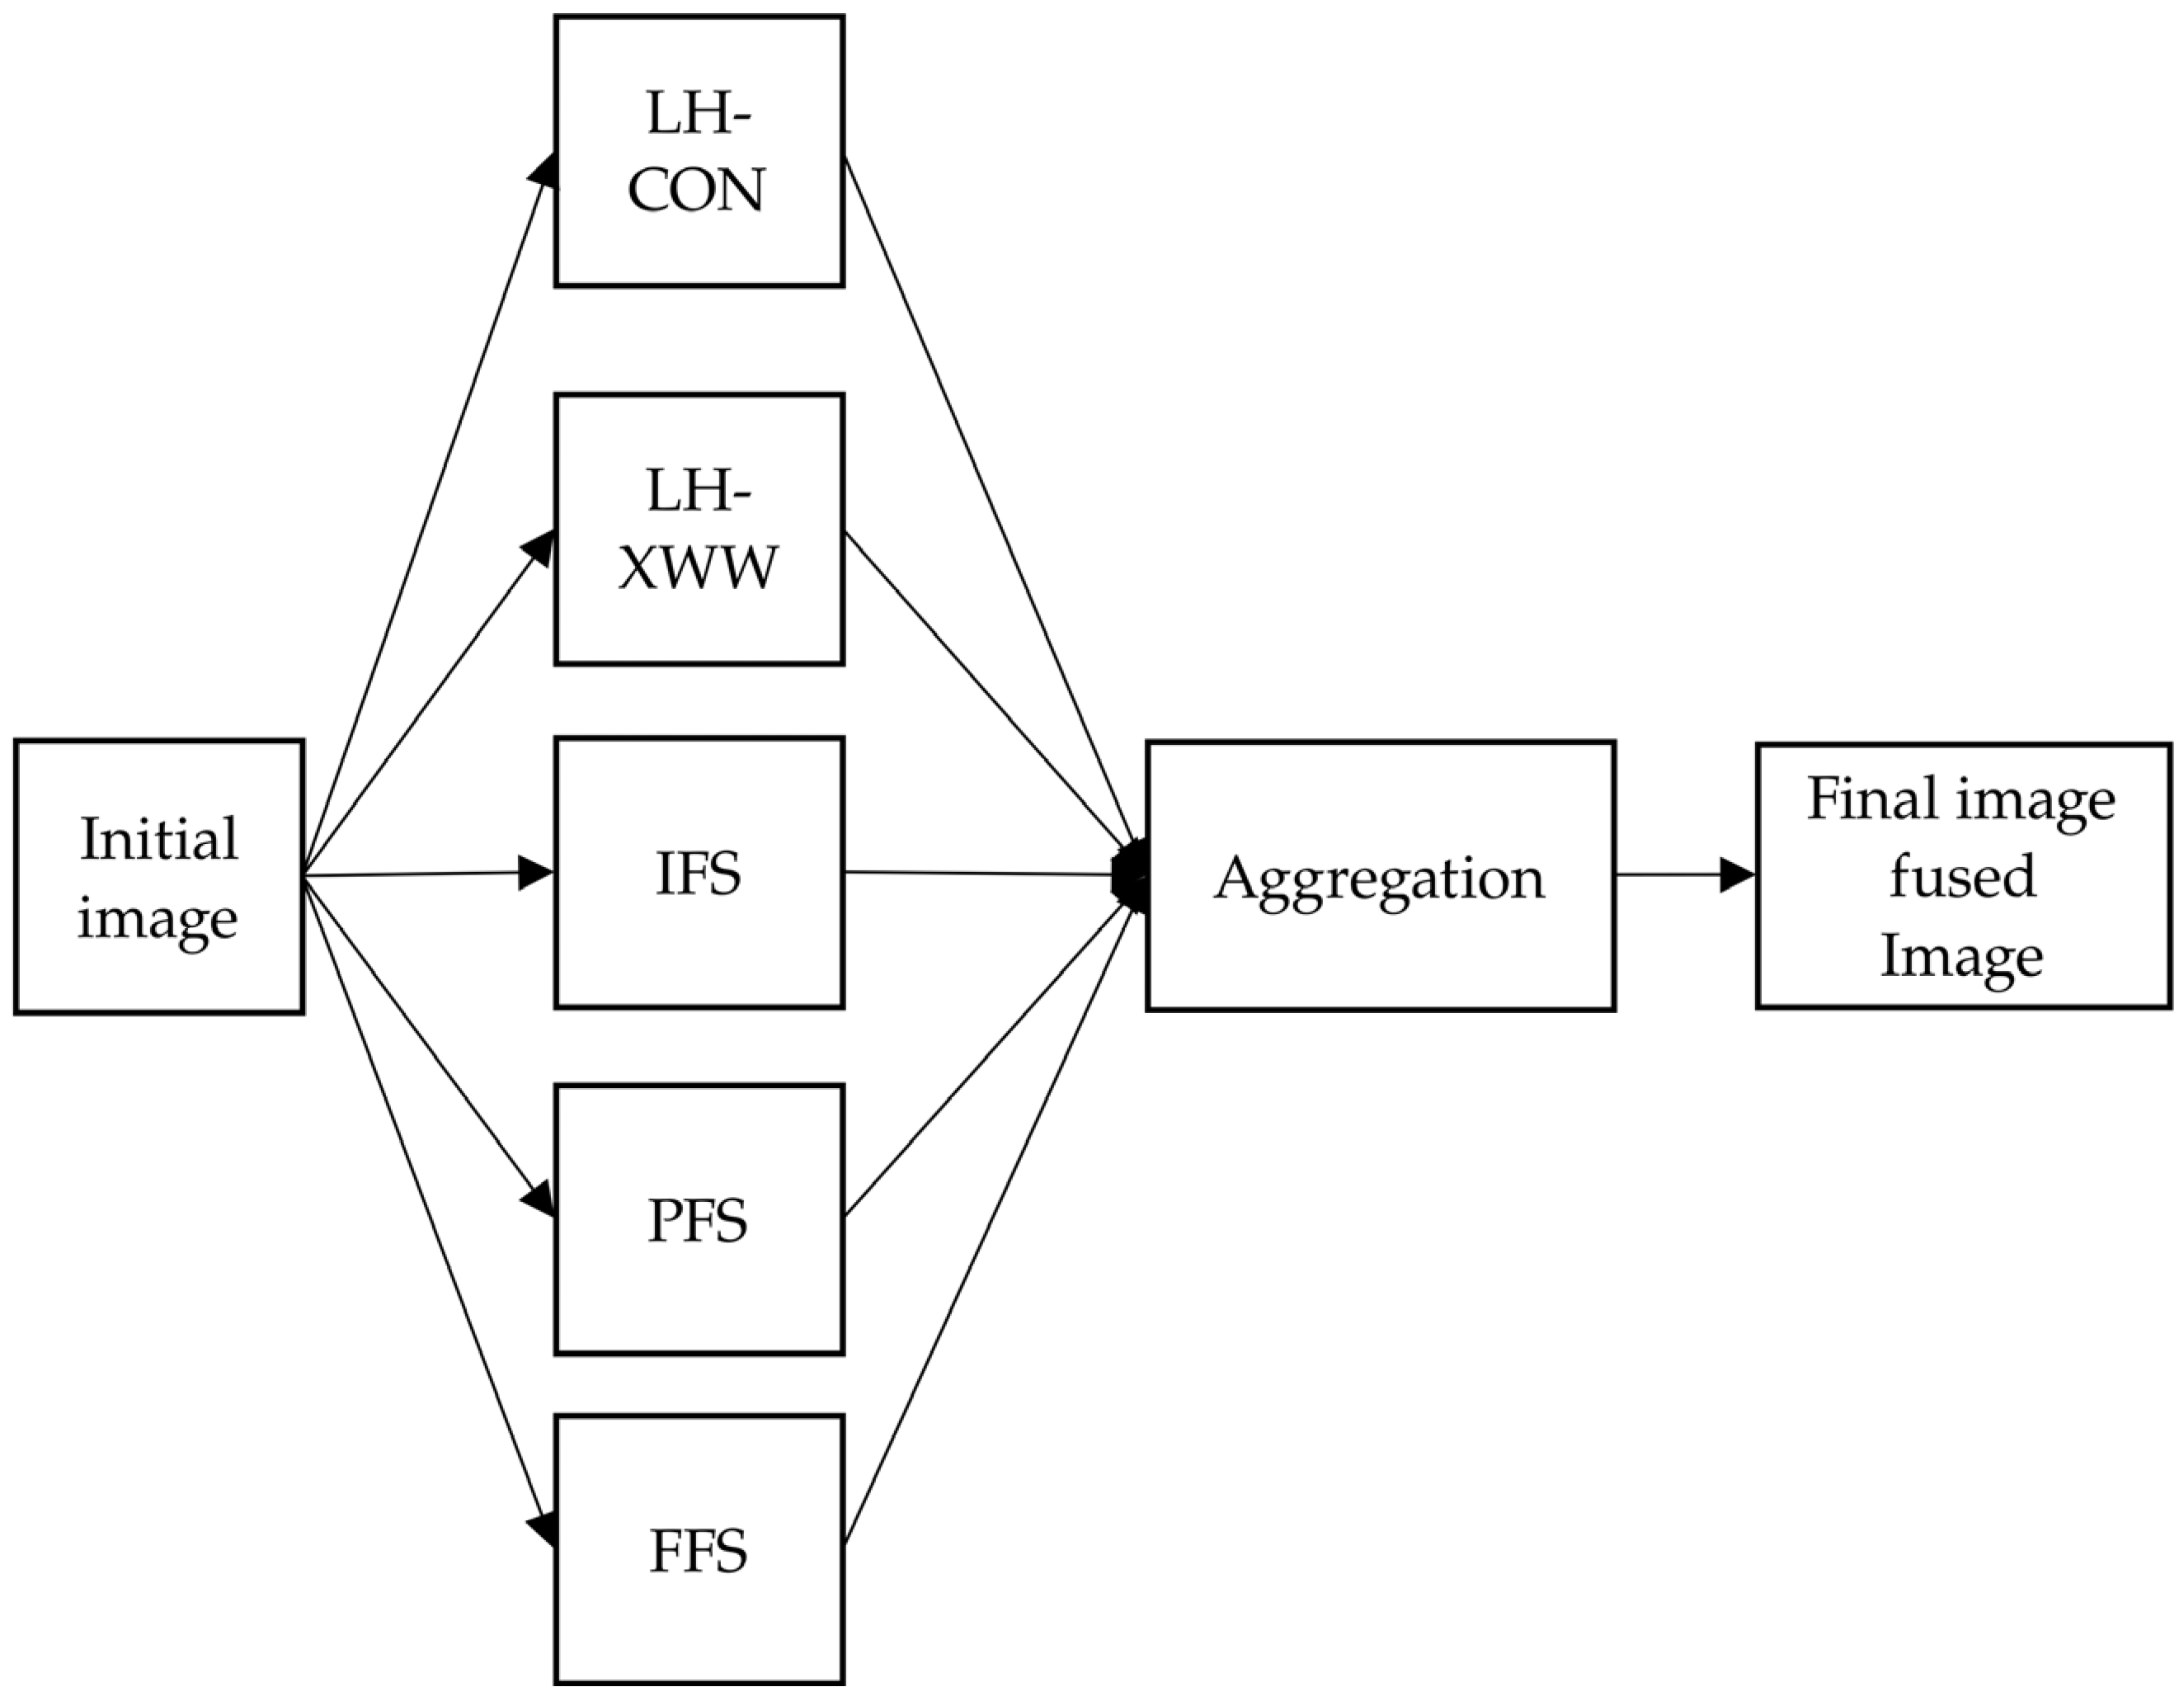
2.2.4. OWA Aggregation for Image Fusion

Figure 2 shows graphically the proposed aggregation schema. Starting from the original image, the first step is to build contrast enhancement images (LH-CON, LH-XWW, IFS, PFS, and FFS). In the second step, we obtain a fused image with an aggregated value for each pixel. Each new pixel ( i , j ) u is obtained by the OWA operator applied to five-pixel values corresponds to pixel u of each enhancement image.
Let U be the set of all pixels in the image A. For any pixel u   i n   U the membership function is μ A ( u ) . The enhancement images are called: A L H , A X W W , A I F S , A P F S , A F F S and the image fusion A I F . The multi-fuzzy membership function of the multi-fuzzy set A I F for each pixel is defined as:
μ A I F u = μ A I F L H u , μ A I F X W W u , μ A I F I F S u , μ A I F P F S u , μ A I F F F S u
To obtain the value of μ A I F u for each pixel we select OWA-GA and OWA-HK operators.

2.3. Performance Indicators

Enhancement performance was evaluated by estimating different indicators, including RMSE, PSNR, SNR, entropy, ambiguity, AME, and AMEE.

2.3.1. RMSE

Root Mean Square Error (RMSE) is an indicator that takes into account the original image (in our paper, the median filtered image) and the processed image (the enhanced) [44]. It is the average squared error value between the images, and it compares the pixel values that are at the same pixel position. The smallest the score, the better the quality of the enhanced image. Mathematically RMSE:
R M S E = 1 M N x = 0 M 1 y = 0 N 1 g x , y g x , y 2
where g′ is the image after the enhancement, g the initial image, M number of rows of the image, N number of columns if the image.

2.3.2. PSNR

Peak Signal to Noise Ratio (PSNR) is an indicator that calculates the ratio between the maximum value that the image can take and the amount of noise that affects the image. Usually, PSNR is expressed as a logarithmic function using the decibel scale [44,45]. The higher the score, the better the quality of the enhanced image. Function of PSNR:
P S N R = 10 log 10 m a x I 2 M S E
where m a x I is the maximum value of the image.

2.3.3. SNR

The Signal-to-Noise Ratio (SNR) calculates an indicator that contains the initial (detain filtered) and enhanced images. The higher the score, the better the quality of the enhanced image [45]. Function of SNR:
S N R = x = 0 M 1 y = 0 N 1 f x , y 2 x = 0 M 1 y = 0 N 1 f f x , y f ^ x , y 2
where f is the median filtered image and f ^ is the enhanced image.

2.3.4. Entropy

The entropy indicator measures the ambiguity of an image based on the Shannon function [40]. The smallest the score, the better the enhancement performance. Function of entropy:
E n t r o p y = 1 M N ln 2 m = 1 M n = 1 N μ m n · ln μ m n 1 μ m n · ln 1 μ m n S h a n n o n   f u n c t i o n
where X is the image that we apply the function and μ m n is the degree of participation of the fuzzified image [37,39].

2.3.5. Ambiguity

Ambiguity determines the quality of the image. We apply the formula to the median-filtered image and to the enhanced image at the point that they are fuzzified. The smallest the score, the better the enhancement performance. Function of ambiguity:
γ ( X ) = 2 M N m = 1 M n = 1 N min μ m n , 1 μ m n
where X is the image to which we apply the function and μ m n is the degree of participation of the fuzzified image [38,39].

2.3.6. AME

Michelson’s law measure of enhancement (AME) divides an image into blocks with size m × n and then calculates from the whole image the average values of the measured results. The higher the score, the better the enhancement performance [7,46,47]. The function for AME is:
A M E = 1 m n s = 1 m t = 1 n 20 ln F m a x F m i n F m a x + F m i n
where m is the number of blocks that the lines are divided in, n is the number of blocks that the columns are divided in, F m a x is the maximum value of the current block, and F m i n is the minimum value of the current block.

2.3.7. AMEE

Michelson’s law measure of enhancement by entropy (AMEE) has the same procedure as AME but a different function. The higher the score, the better the enhancement performance [7,9,46,47,48]. Function of AMEE:
A M E E = 1 m n s = 1 m t = 1 n α F m a x F m i n F m a x + F m i n α ln F m a x F m i n F m a x + F m i n
where α is a constant that scales the indicator. At our paper α = 0.7 .

2.3.8. Region Contrast

A performance measure for contrast based on the Laplacean operator in a region of an image is the indicator region contrast. The higher the score, the better the enhancement performance. This indicator is characterized by its superior robustness to noise [15]. Region contrast is defined as follows:
R e g i o n   c o n t r a s t = 1 m w c ( i , j ) log ( 1 + c ( i , j ) )
where c ( i , j ) is the local contrast at a pixel ( i , j ) of the region and is defined as:
c i , j = 4 I i , j I i 1 , j + I i , j 1 + I i + 1 , j + I i , j + 1
where I i , j is the intensity value of a pixel at the location ( i , j ) , w is the region of the image and m is the total number of pixels in the region.

2.3.9. Jaccard

Jaccard is a similarity index. The higher the score on this index, the better the enhancement performance [49,50]. Jaccard index:
J a c c a r d = i = 1 M j = 1 N ( μ i , j μ i , j ) i = 1 M j = 1 N ( μ i , j μ i , j ) or J a c c a r d = i = 1 M j = 1 N min ( μ i , j , μ i , j ) i = 1 M j = 1 N max ( μ i , j , μ i , j )
where M are the rows N the columns of the image, μ i , j is the membership degree of the pixel of the initial image, and μ i , j is the membership degree of the pixel of the enhanced image.

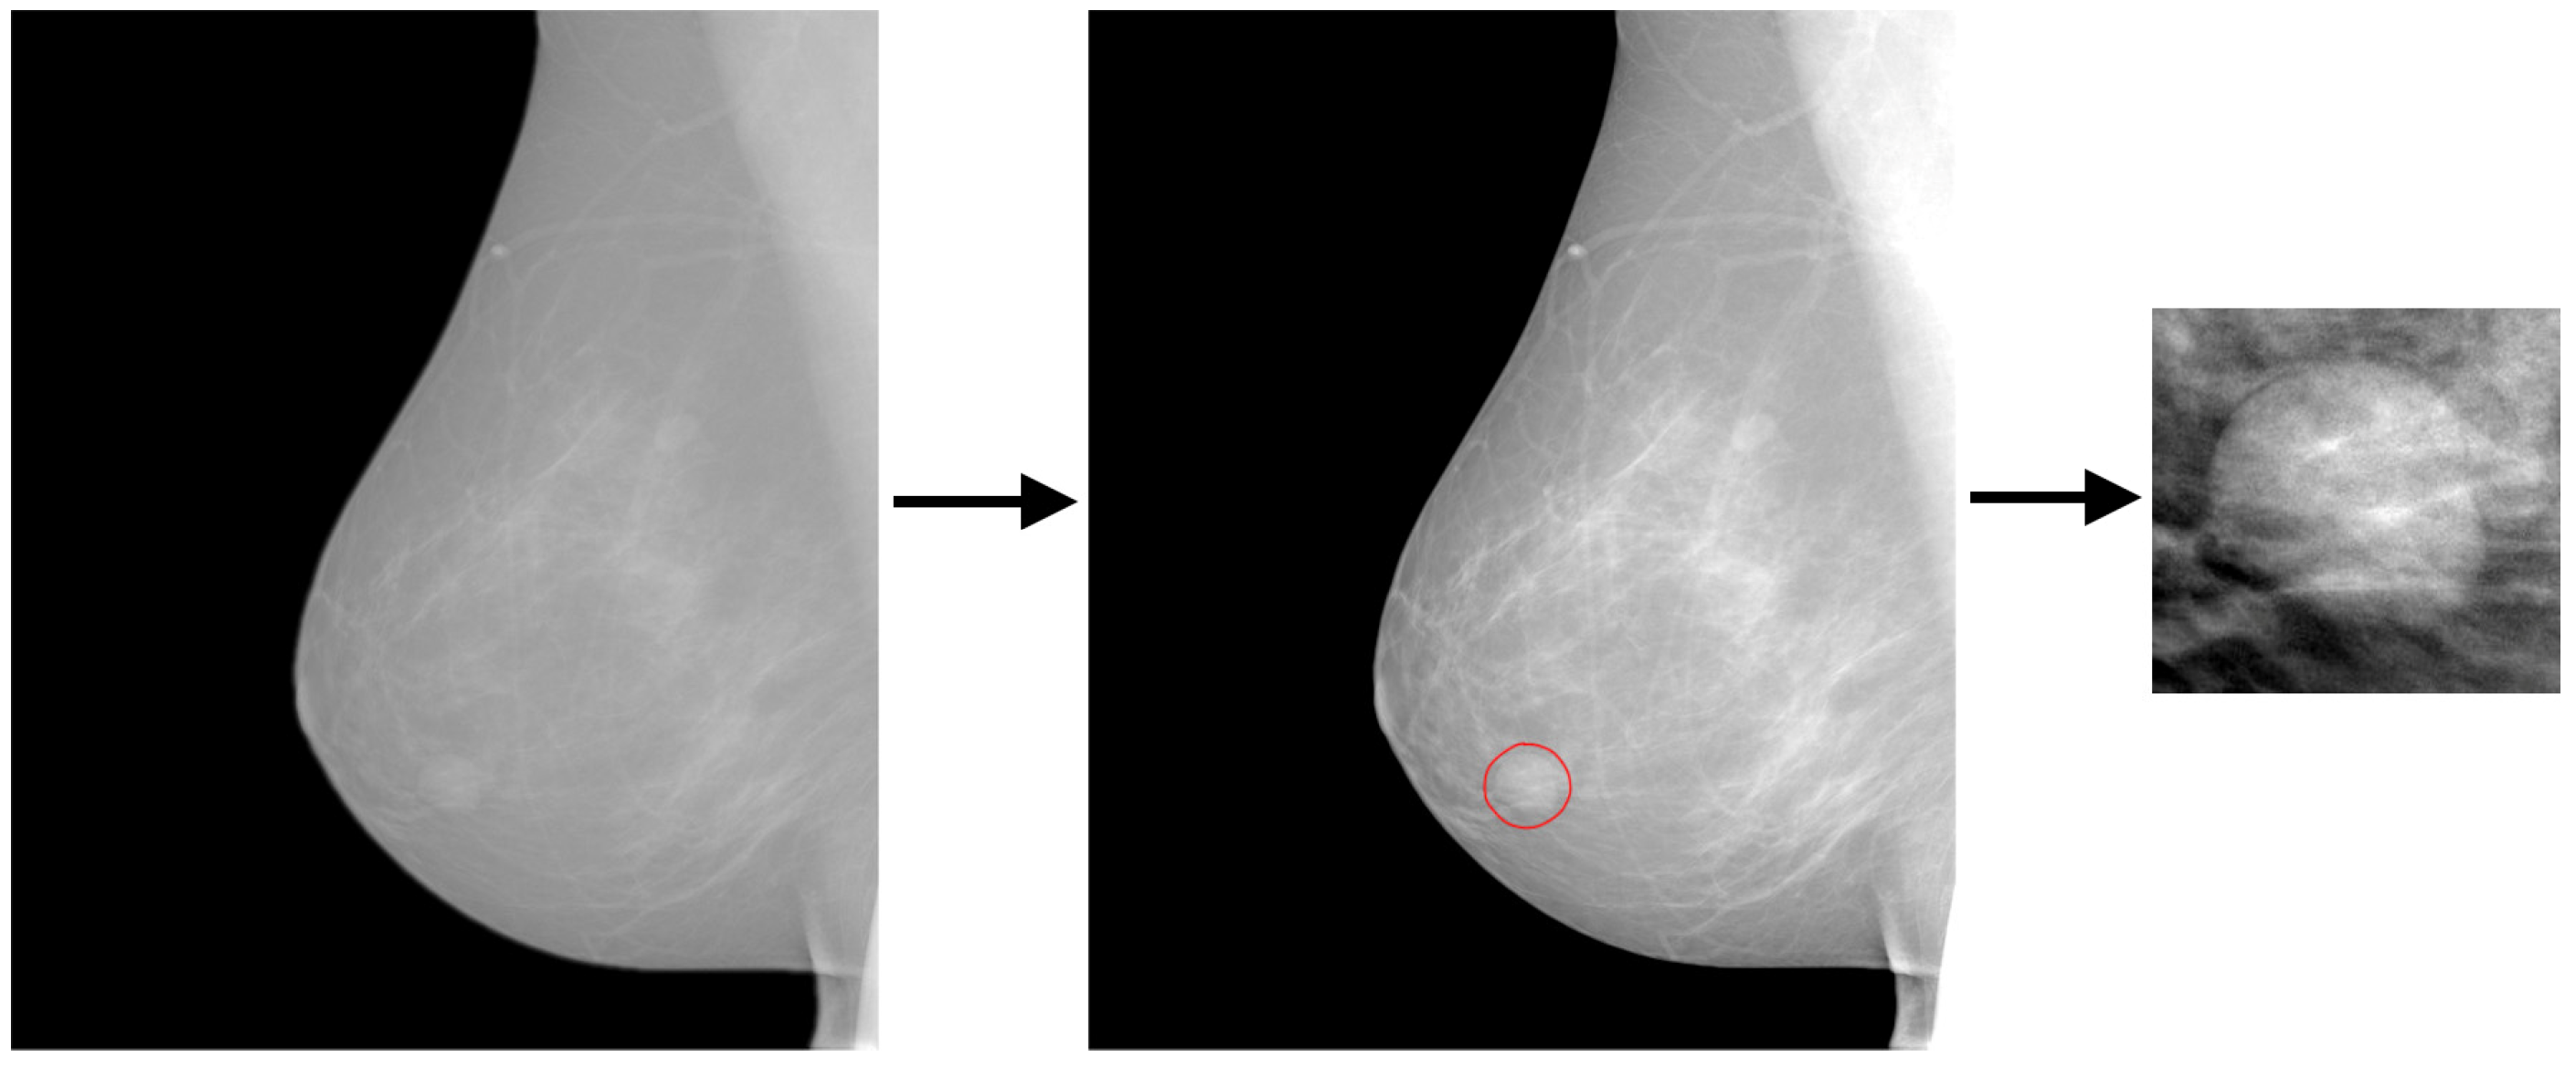
2.4. Mammography Images (Data)

In this work, 97 direct digital mammograms of 65 benign and 32 malignant masses were used for testing the proposed algorithm. Regions of Interest (ROIs) were extracted from the full mammograms that encompassed the masses (with red circle at Figure 3) and local background, as visualized in Figure 3. Figure 4 shows a sample of ten masses that were used, of which one is characterized as a round mass and two as spiculated masses. Mass (d) is the round mass, and masses (h) and (j) are spiculated masses. All the other images contain uncharacterized masses. The data base has spiculated, circumscribed, lobulated, round masses, nodules, and densities.
The anonymous digital dataset was provided by Dr. Maria Kallergi and the Smart Hospital Research Laboratory of the Department of Biomedical Engineering of the University of West Attica. All cases are confirmed by biopsy or annual follow-up for at least three years.

3. Results

Breast masses frequently blend in with the surrounding normal parenchymal tissue, making it difficult to distinguish and diagnose them. As will be shown below, the proposed algorithm results in a significant improvement of the contrast, aiding in the identification of the mass characteristics.
For comparison purposes, ROIs were first processed by a median filter, Figure 5b, and then by a classical Histogram Equalization algorithm, Figure 5c. The results of this process are shown in Figure 5.
Advanced enhancement was performed by first processing ROIs with the median filter, then by the fuzzy function of Equation (2), and finally by the proposed enhancing methods.
Using the linguistic hedges, we tried the Formulas (3)–(7), and we ended up using the μ C O N X u with the exponent “2” which is the function (3), because the higher values of the pixels that a breast tissue has were enhanced, leaving the background darker. The initial and processed images can be seen in Figure 6c.
The next technique used the linguistic hedge CON as its pre-function. Linguistic hedger Xie Wang Wu created an enhanced image where very bright pixels are made white while the rest are spread throughout the entire histogram range. The results can be seen in Figure 6g and the histogram of the image (j). The pixels that were made whiter were adjusted by the parameter “γ” of the function (8).
The next three techniques were based on similar functions that differed slightly according to their theories. IFS, PFS, and FFS were found with the help of GA, trying to maximize or minimize the formulas of the entropies (24), (30), and (36). Figure 6h,i,m, respectively, show the new images.
The final two enhanced images were created with the help of OWA operators. They used all five previous enhanced images as inputs and created a new one using weights on the inputs. Each pixel of the new one was created from the weighted pixels of the inputs. The difference between OWA GA and OWA HK is the procedure for finding the “w” weights. OWA GA used GA to maximize function (12), and OWA HK used a proposed formula from Hong and Kim (13) and found the weight with (14). The new images are Figure 6n,o respectively.
The methods were tested on the ninety-seven ROIs. The results are presented in Figure 7 and Figure 8 for a sample of ten ROIs. Figure 7 presents the masses with Histogram Equalization, and Figure 8 presents the rest of the methods. Some of the ROIs have a mass that is easily distinguished, and others blend with the background and cannot be detected. Each enhancement method gives a different perspective on the mass that may suit different applications.
The enhancement results were evaluated by calculating the RMSE, PSNR, SNR, entropy, ambiguity, AME, AMEE, Region contrast, and Jaccard indicator. For entropy, ambiguity, AME, and AMEE, the indicators are for the median filtered and for the enhanced image. To comprehend the results, the average values for all ninety-seven images for each indicator are presented in Table 1.
Based on Table 1 and focusing on all the methods, the IFS technique was the best at the average scores of RMSE, PSNR, SNR, and AME, with average values 1126, 11.31, 5, and 45.68, respectively. LH-XWW technique was the best at the average scores of entropy, ambiguity, and region contrast, with average scores of 0.417, 0.234, and 418.51, respectively. LH-CON was the best for the average score of AMEE with an average value of 0.353, and PFS was for Jaccard with an average score of 0.839. At all the other indicators, Histogram Equalization was competitive but was not able to get the best score.

4. Discussion

All presented techniques may be used to improve the contrast enhancement of an image. Based on the RMSE, PSNR, SNR, and AME, the best technique overall is the IFS, but each method may be used for different problems depending on the task at hand. The OWA techniques could provide good image fusion for threshold methods and feature extraction. LH-XWW is able to extract an image that can help in the identification of masses that do not have dense background tissue. The conventional histogram equalization method has been suggested as a simple technique for enhancing the contrast of digital images. Although the histogram equalization method yields interesting results, some of the proposed fuzzy techniques surpass the conventional methods. Using the RMSE indicator as a measure of comparison, histogram equalization extracts decent results. IFS, OWA-HK, and OWA-GA surpass the histogram equalization. In addition, based on the PSNR indicator, once again, IFS, OWA-HK, and OWA-GA do a better job at increasing the signal or reducing the noise of the image when compared with the histogram equalization technique. Advanced fuzzy sets create an image more suitable for visual assessment or computer processing, improve mass outline, and avoid noise amplification because of the membership, non-membership, and hesitation degrees. Moreover, a new challenge arises when different aggregation functions can be combined on a multifuzzy set. The chosen best aggregation function for each pixel presents a new tool for handling uncertainty. Different kinds of enhancement techniques may be used in order to create a DSS. Combining them with threshold and classification methods could provide a more accurate decision-making system for real-life data.

5. Conclusions

Most medical imaging systems, including mammography systems, require contrast enhancement for improved detection and diagnosis. A visually optimal image could assist physicians in the classification of mammographic findings and in decision-making. In this research, several contrast enhancement techniques were evaluated for the enhancement of mammographic masses with different lesion-to-background contrasts. We proposed advanced fuzzy sets as a way of enhancing the contrast of an image and used the OWA operators to create images that fused all the fuzzy enhancement methods. In addition, images were enhanced with Hist-Eq and two different linguistic hedges (CON and XWW). The comparison of the results showed that IFS surpasses the other methods in almost all metrics. FFS had similar results with IFS. In general, fuzzy image processing performed better than standard histogram equalization.
Future work mainly consists of three parts. First, we plan on using the IFS method on well-known databases so the results can be compared with other studies. Following this, we aim to use the enhancement methods as part of decision-making systems in order to classify images. Finally, we intend on thoroughly studyingimage fusion with multi-fuzzy sets so we can create new methods for medical image processing.

Author Contributions

Conceptualization, A.D. and A.-N.A.; methodology, A.D. and A.-N.A.; software, A.-N.A.; validation, A.D. and A.-N.A.; formal analysis, A.D. and A.-N.A.; investigation, A.D. and A.-N.A.; resources, A.D.; data curation, A.D., A.-N.A. and M.K.; writing—original draft preparation, A.D., A.-N.A. and M.K.; writing—review and editing, A.D., A.-N.A. and M.K.; visualization, A.D. and A.-N.A.; supervision, A.D.; project administration, A.D. All authors have read and agreed to the published version of the manuscript.

Funding

This research received no external funding.

Conflicts of Interest

The authors declare no conflict of interest.

References

  1. Arnold, M.; Morgan, E.; Rumgay, H.; Mafra, A.; Singh, D.; Laversanne, M.; Vignat, J.; Gralow, J.R.; Cardoso, F.; Siesling, S.; et al. Current and Future Burden of Breast Cancer: Global Statistics for 2020 and 2040. Breast 2022, 66, 15–23. [Google Scholar] [CrossRef] [PubMed]
  2. Siegel, R.L.; Miller, K.D.; Wagle, N.S.; Jemal, A. Cancer Statistics, 2023. CA Cancer J. Clin. 2023, 73, 17–48. [Google Scholar] [CrossRef]
  3. Tizhoosh, H.R. Fuzzy Image Enhancement: An Overview. In Fuzzy Techniques in Image Processing; Kerre, E.E., Nachtegael, M., Eds.; Studies in Fuzziness and Soft Computing; Physica-Verlag HD: Heidelberg, Germany, 2000; Volume 52, pp. 137–171. ISBN 978-3-7908-2475-9. [Google Scholar]
  4. Pal, S.K.; King, R.A. Image Enhancement Using Smoothing with Fuzzy Sets. IEEE Trans. Syst. Man Cybern. 1981, 11, 494–501. [Google Scholar]
  5. Chaira, T. Medical Image Processing: Advanced Fuzzy Set Theoretic Techniques; CRC Press, Taylor & Francis Group: Boca Raton, FL, USA, 2015; ISBN 978-1-4987-0045-0. [Google Scholar]
  6. Chaira, T. Enhancement of Medical Images in an Atanassov’s’t Intuitionistic Fuzzy Domain Using an Alternative Intuitionistic Fuzzy Generator with Application to Image Segmentation. J. Intell. Fuzzy Syst. 2014, 27, 1347–1359. [Google Scholar] [CrossRef]
  7. Deng, H.; Sun, X.; Liu, M.; Ye, C.; Zhou, X. Image Enhancement Based on Intuitionistic Fuzzy Sets Theory. IET Image Process. 2016, 10, 701–709. [Google Scholar] [CrossRef] [Green Version]
  8. Lepcha, D.C.; Goyal, B.; Dogra, A.; Sharma, K.P.; Gupta, D.N. A Deep Journey into Image Enhancement: A Survey of Current and Emerging Trends. Inf. Fusion 2023, 93, 36–76. [Google Scholar] [CrossRef]
  9. Agaian, S.S.; Silver, B.; Panetta, K.A. Transform Coefficient Histogram-Based Image Enhancement Algorithms Using Contrast Entropy. IEEE Trans. Image Process 2007, 16, 741–758. [Google Scholar] [CrossRef]
  10. James, A.P.; Dasarathy, B.V. Medical Image Fusion: A Survey of the State of the Art. Inf. Fusion 2014, 19, 4–19. [Google Scholar] [CrossRef] [Green Version]
  11. Kumar, P.M.; Kumar, R.P. Enhancing Bio-Medical Mammography Image Fusion Using Optimized Genetic Algorithm. J. Med. Imaging Health Inf. 2019, 9, 502–507. [Google Scholar] [CrossRef]
  12. Chin, C.-L.; Lin, J.-C.; Li, C.-Y.; Sun, T.-Y.; Chen, T.; Lai, Y.-M.; Huang, P.-C.; Chang, S.-W.; Sharma, A.K. A Novel Fuzzy DBNet for Medical Image Segmentation. Electronics 2023, 12, 2658. [Google Scholar] [CrossRef]
  13. Kumar, M.; Kaur, A. Amita Improved Image Fusion of Colored and Grayscale Medical Images Based on Intuitionistic Fuzzy Sets. Fuzzy Inf. Eng. 2018, 10, 295–306. [Google Scholar] [CrossRef] [Green Version]
  14. Tirupal, T.; Mohan, B.C.; Kumar, S.S. Multimodal Medical Image Fusion Based on Sugeno’s Intuitionistic Fuzzy Sets. ETRI J. 2017, 39, 173–180. [Google Scholar] [CrossRef]
  15. Tang, J.; Liu, X.; Sun, Q. A Direct Image Contrast Enhancement Algorithm in the Wavelet Domain for Screening Mammograms. IEEE J. Sel. Top. Signal Process. 2009, 3, 74–80. [Google Scholar] [CrossRef]
  16. Da Silva, D.S.; Nascimento, C.S.; Jagatheesaperumal, S.K.; Albuquerque, V.H.C.D. Mammogram Image Enhancement Techniques for Online Breast Cancer Detection and Diagnosis. Sensors 2022, 22, 8818. [Google Scholar] [CrossRef] [PubMed]
  17. Rebolj, M.; Assi, V.; Brentnall, A.; Parmar, D.; Duffy, S.W. Addition of Ultrasound to Mammography in the Case of Dense Breast Tissue: Systematic Review and Meta-Analysis. Br. J. Cancer 2018, 118, 1559–1570. [Google Scholar] [CrossRef] [PubMed]
  18. Maini, R.; Aggarwal, H. A Comprehensive Review of Image Enhancement Techniques. arXiv 2010, arXiv:1003.4053. [Google Scholar]
  19. Xie, J.; Wang, H.; Wu, D. Adaptive Image Steganography Using Fuzzy Enhancement and Grey Wolf Optimizer. IEEE Trans. Fuzzy Syst. 2022, 30, 4953–4964. [Google Scholar] [CrossRef]
  20. Ramani, R.; Vanitha, N.S.; Valarmathy, S. The Pre-Processing Techniques for Breast Cancer Detection in Mammography Images. Int. J. Image Graph. Signal Process. 2013, 5, 47–54. [Google Scholar] [CrossRef]
  21. Sheba, K.U.; Gladston, R.S. Objective Quality Assessment of Image Enhancement Methods in Digital Mammography—A Comparative Study. Signal Image Process. Int. J. 2016, 7, 1–13. [Google Scholar] [CrossRef]
  22. Langarizadeh, M.; Mahmud, R.; Ramli, A.R.; Napis, S.; Beikzadeh, M.R.; Rahman, W.E.Z.W.A. Improvement of Digital Mammogram Images Using Histogram Equalization, Histogram Stretching and Median Filter. J. Med. Eng. Technol. 2011, 35, 103–108. [Google Scholar] [CrossRef]
  23. Wang, Z.; Yu, G.; Kang, Y.; Zhao, Y.; Qu, Q. Breast Tumor Detection in Digital Mammography Based on Extreme Learning Machine. Neurocomputing 2014, 128, 175–184. [Google Scholar] [CrossRef]
  24. Zadeh, L.A. Fuzzy Sets. Inf. Control 1965, 8, 338–353. [Google Scholar] [CrossRef] [Green Version]
  25. Zadeh, L.A. Fuzzy Algorithms. Inf. Control 1968, 12, 94–102. [Google Scholar] [CrossRef] [Green Version]
  26. Premalatha, R.; Dhanalakshmi, P. Enhancement and Segmentation of Medical Images through Pythagorean Fuzzy Sets—An Innovative Approach. Neural Comput. Appl. 2022, 34, 11553–11569. [Google Scholar] [CrossRef] [PubMed]
  27. Huynh, V.N.; Ho, T.B.; Nakamori, Y. A Parametric Representation of Linguistic Hedges in Zadeh’s Fuzzy Logic. Int. J. Approx. Reason. 2002, 30, 203–223. [Google Scholar] [CrossRef]
  28. Jebadass, J.R.; Balasubramaniam, P. Low Light Enhancement Algorithm for Color Images Using Intuitionistic Fuzzy Sets with Histogram Equalization. Multimed. Tools Appl. 2022, 81, 8093–8106. [Google Scholar] [CrossRef]
  29. Senapati, T.; Yager, R.R. Fermatean Fuzzy Sets. J. Ambient. Intell. Hum. Comput. 2020, 11, 663–674. [Google Scholar] [CrossRef]
  30. Shabani, M.O.; Mazahery, A. Application of GA to Optimize the Process Conditions of Al Matrix Nano-Composites. Compos. Part B Eng. 2013, 45, 185–191. [Google Scholar] [CrossRef]
  31. Yager, R.R. On Ordered Weighted Averaging Aggregation Operators in Multicriteria Decisionmaking. IEEE Trans. Syst. Man Cybern. 1988, 18, 183–190. [Google Scholar] [CrossRef]
  32. Medina, J.; Yager, R.R. OWA Operators with Functional Weights. Fuzzy Sets Syst. 2021, 414, 38–56. [Google Scholar] [CrossRef]
  33. Emrouznejad, A.; Marra, M. Ordered Weighted Averaging Operators 1988-2014: A Citation-Based Literature Survey: Ordered Weighted Averaging Operators. Int. J. Intell. Syst. 2014, 29, 994–1014. [Google Scholar] [CrossRef] [Green Version]
  34. Harmati, I.Á.; Fullér, R.; Felde, I. On Stability of Maximal Entropy OWA Operator Weights. Fuzzy Sets Syst. 2022, 448, 145–156. [Google Scholar] [CrossRef]
  35. Khan, M.F.; Ren, X.; Khan, E. Semi Dynamic Fuzzy Histogram Equalization. Optik 2015, 126, 2848–2853. [Google Scholar] [CrossRef]
  36. Bagade, S.S.; Shandilya, V.K. Use of Histogram Equalization in Image Processing for Image Enhancement. Int. J. Softw. Eng. Res. Pract. 2011, 1, 6–10. [Google Scholar]
  37. Termini, A.; Luca, S. A Definition of Non Probabilistic Entropy in the Setting of Fuzzy Set Theory. Inf. Control 1972, 20, 301–312. [Google Scholar]
  38. Kaufmann, A.; Gupta, M. Introduction to Fuzzy Arithmetic: Theory and Applications. Electrical; Computer Science and Engineering Series; Van Nostrand Reinhold Company: New York, NY, USA, 1985. [Google Scholar]
  39. Hassanien, A.E.; Ali, J.M. A Fuzzy-Rule Based Algorithm for Contrast Enhancement of Mammograms Breast Masses; Kuwait University: Safat, Kuwait, 2004. [Google Scholar]
  40. Cheng, H.D.; Xu, H. A Novel Fuzzy Logic Approach to Mammogram Contrast Enhancement. Inf. Sci. 2002, 148, 167–184. [Google Scholar] [CrossRef]
  41. Atanassov, K.T. Intuitionistic Fuzzy Sets; Elsevier: Amsterdam, The Netherlands, 1986; Volume 20, pp. 87–96. [Google Scholar]
  42. Yager, R.R. Pythagorean Fuzzy Subsets. In Proceedings of the 2013 Joint IFSA World Congress and NAFIPS Annual Meeting (IFSA/NAFIPS), Edmonton, AB, Canada, 24–28 June 2013; IEEE: Piscataway, NJ, USA, 2013; pp. 57–61. [Google Scholar]
  43. He, Y.; Deng, Y. New Ordinal Relative Fuzzy Entropy. Iran. J. Fuzzy Syst. 2021, 19, 171–186. [Google Scholar]
  44. Hapsari, R.K.; Utoyo, M.I.; Rulaningtyas, R.; Suprajitno, H. Comparison of Histogram Based Image Enhancement Methods on Iris Images. J. Phys. Conf. Ser. 2020, 1569, 022002. [Google Scholar] [CrossRef]
  45. Saruchi, M. Comparative Study of Different Image Enhancement Techniques. Int. J. Comput. Technol. 2012, 2, 131–133. [Google Scholar]
  46. Prajapati, P.; Narmawala, Z.; Darji, N.P.; Moorthi, S.M.; Ramakrishnan, R. Evaluation of Perceptual Contrast and Sharpness Measures for Meteorological Satellite Images. Procedia Comput. Sci. 2015, 57, 17–24. [Google Scholar] [CrossRef] [Green Version]
  47. Panetta, K.; Samani, A.; Agaian, S. Choosing the Optimal Spatial Domain Measure of Enhancement for Mammogram Images. Int. J. Biomed. Imaging 2014, 2014, 401819. [Google Scholar] [CrossRef] [PubMed]
  48. Singh, B.; Kaur, M. An Approach for Enhancement of Microcalcifications in Mammograms. J. Med. Biol. Eng. 2017, 37, 567–579. [Google Scholar] [CrossRef]
  49. Costa, L.d.F. Further Generalizations of the Jaccard Index. arXiv 2021, arXiv:2110.09619. [Google Scholar]
  50. Amirkhani, D.; Bastanfard, A. An Objective Method to Evaluate Exemplar-based Inpainted Images Quality Using Jaccard Index. Multimed. Tools Appl. 2021, 80, 26199–26212. [Google Scholar] [CrossRef]
Figure 1. Fuzzy image enhancement system.
Electronics 12 03269 g001
Figure 2. Schema aggregation.
Electronics 12 03269 g002
Figure 3. Extraction of ROIs.
Electronics 12 03269 g003
Figure 4. Sample of ROIs from the full mammograms. (a) Mass; (b) Mass; (c) Mass; (d) Round mass; (e) Mass; (f) Mass; (g) Mass; (h) Spiculated mass; (i) Mass; (j) Spiculated mass.
Electronics 12 03269 g004
Figure 5. Initial image (a), Image with median lowpass filter (b) and Histogram Equalization enhancement (c) having the histogram of the images (df) respectively.
Electronics 12 03269 g005
Figure 6. Initial image (a), Image with median lowpass filter (b), LH-CON enhancement (c), LH-XWW enhancement (g), IFS enhancement (h), PFS enhancement (i), FFS enhancement (m), OWA with GA enhancement (n) and OWA-HK enhancement (o). The histograms are (df,jl,pr) respectively.
Electronics 12 03269 g006
Figure 7. From left to right the initial image, median filtered image, histogram equalization enhanced image and from top to bottom sample of ROIs of different masses from digital mammograms.
Electronics 12 03269 g007
Figure 8. From left to right the different techniques of enhancement and from top to bottom ROIs of different masses from digital mammograms.
Electronics 12 03269 g008
Table 1. Average values of 9 indicators for the various enhancement techniques.
IndicatorsMedianHist-EqLH-CONLH-XWWIFSPFSFFSOWA-GAOWA-HK
RMSE-11761411164011261184126011461142
PSNR (db)-10.899.5811.3110.8610.4311.1611.19
SNR-4.163.142.1554.294.434.814.82
Entropy0.8490.7210.6920.4170.6540.6950.6150.6830.686
Ambiguity0.6320.50.4680.2340.4320.4670.3980.4650.467
AME91.5632.1428.2529.7945.6836.4744.9742.242.15
AMEE0.1490.3320.3530.2610.310.330.3030.320.321
Region contrast8.54287.51164.59418.51232.15238.38213.02239.73238.85
Jaccard-0.8020.5860.6280.750.8390.770.8140.816
Disclaimer/Publisher’s Note: The statements, opinions and data contained in all publications are solely those of the individual author(s) and contributor(s) and not of MDPI and/or the editor(s). MDPI and/or the editor(s) disclaim responsibility for any injury to people or property resulting from any ideas, methods, instructions or products referred to in the content.

