Article

A Model for EEG-Based Emotion Recognition: CNN-Bi-LSTM with Attention Mechanism

School of Electronic Information, Xijing University, Xi’an 710123, China
*
Author to whom correspondence should be addressed.
Electronics 2023, 12(14), 3188; https://doi.org/10.3390/electronics12143188
Submission received: 3 July 2023 / Revised: 20 July 2023 / Accepted: 21 July 2023 / Published: 22 July 2023

Abstract

:
Emotion analysis is the key technology in human–computer emotional interaction and has gradually become a research hotspot in the field of artificial intelligence. The key problems of emotion analysis based on EEG are feature extraction and classifier design. The existing methods of emotion analysis mainly use machine learning and rely on manually extracted features. As an end-to-end method, deep learning can automatically extract EEG features and classify them. However, most of the deep learning models of emotion recognition based on EEG still need manual screening and data pre-processing, and the accuracy and convenience are not high enough. Therefore, this paper proposes a CNN-Bi-LSTM-Attention model to automatically extract the features and classify emotions based on EEG signals. The original EEG data are used as input, a CNN and a Bi-LSTM network are used for feature extraction and fusion, and then the electrode channel weights are balanced through the attention mechanism layer. Finally, the EEG signals are classified to different kinds of emotions. An emotion classification experiment based on EEG is conducted on the SEED dataset to evaluate the performance of the proposed model. The experimental results show that the method proposed in this paper can effectively classify EEG emotions. The method was assessed on two distinctive classification tasks, one with three and one with four target classes. The average ten-fold cross-validation classification accuracy of this method is 99.55% and 99.79%, respectively, corresponding to three and four classification tasks, which is significantly better than the other methods. It can be concluded that our method is superior to the existing methods in emotion recognition, which can be widely used in many fields, including modern neuroscience, psychology, neural engineering, and computer science as well.

1. Introduction

Brain–computer interface (BCI) technology makes it possible for the brain to connect directly to peripheral devices and has a huge impact on people’s daily lives. Emotional recognition is an important research topic in human–computer interaction and the key technology of computer intelligence [1]. EEG emotion recognition, as an important BCI method, has been widely used in interpersonal communication, decision making, and mental illness diagnosis. In practical projects, it helps human–machine interaction become more friendly [2], and machines can understand emotions and interact with humans [3,4]. In medical research, it contributes to the diagnosis and treatment of various psychiatric disorders, such as depression and autism spectrum disorders [5,6]. In the field of education, it helps to track and improve the learning efficiency of students [7,8]. As a result, emotional recognition has become an integral part of our daily lives.
In recent years, researchers in the fields of machine learning and emotional computing have been working on emotional expression analysis based on visual and physical signals. The most common signs include facial expressions [9], speech [10], posture [11], magnetoencephalography (MEG) [12], electroencephalogram (EEG) [13], and electrocardiogram (ECG) [14,15], which are used to identify human emotions. The first three signals are highly subjective, and information can be artificially hidden from accurate judgment. Physical signals can provide more accurate and objective emotional recognition. EEG signals are real-time responses and more sensitive to changes in mood than peripheral neurophysiological signals. In some cases, EEG signals can be a clear indicator of certain important mood changes in humans. Therefore, emotional recognition based on EEG signals has been a hot topic of research. EEG, with its easy collection, simple cost, and high time resolution, has been used in many fields and performed well, such as cognitive load classification tasks [16], brain injury diagnosis [17], and brain–computer interface systems [18,19]. EEG signals can be used as an effective internal bioelectrical signal to convey human emotional information. EEG-based methods have higher accuracy and objective evaluation than other visual cues, such as facial expressions and gestures, and are, therefore, more reliable in a variety of emotion recognition methods. However, the collected EEG signal is often mixed with a large amount of noise, resulting in a low signal-to-noise ratio [20]. At the same time, an EEG signal is non-stationary. Therefore, emotional recognition based on EEG signal has some difficulties.
Traditional emotion recognition BCI system architecture-based EEG includes signal acquisition, preprocessing, feature extraction, feature selection, emotion classification, and performance evaluation. There are two models of human emotion, the taxonomic model and the continuum model [21,22]. The most important thing for a successful emotional classification system is to find the best classifier for accurate classification, which has an important impact on the accuracy of emotional recognition [23]. Classifiers typically include traditional machine learning algorithms, such as support vector machines (SVM), naive Bayes (NB), k-nearest neighbor (K-NN), decision trees (DTs), random forest (RF), and artificial neural networks (ANNs) and advanced deep learning algorithms, such as deep neural network (DNN), recurrent neural networks (RNNs), and long short-term memory (LSTM) [24]. For example, George et al. [25] used an overall SVM result accuracy rate of 92% in a DEAP dataset of 32 participants, better than that used by Seeja et al. [26]. Seeja et al. found that emotional recognition models using deep neural network classifiers achieved better performance compared to SVM classifiers. Researchers used the SVM classifier to achieve an accuracy of 79% for the DEAP dataset and 76% for the SEED-IV dataset [27]. Deep learning has obvious advantages in raw data processing, automatic extraction, and feature selection. Therefore, deep learning is now often used to analyze EEG signals. Alhadry et al. used end-to-end LSTM-RNN to extract features and classify them with more than 85% accuracy [28]. Yin et al. also used the DEAP dataset to compartmentalize the data and extract differential entropy features, and they then constructed emotional recognition GCNN-LSTM models based on EEG. The potency, wakefulness, and independent assays of the GCNN-LSTM model were 90.45%, 90.60%, and 85.04%, respectively [29]. The end-to-end CNN model was used on DEAP, LUMED, and SEED datasets with an accuracy of 72.81%, 81.8%, 86.56%, and 78.3% [30], respectively. The study of [31] also confirmed the accuracy of CNN and analyzed 32 EEG signals to measure emotional states in humans, with a validity rate of 95.96% and an awakening rate of 96.09%. Tzirakis et al. [32] used end-to-end multimodal emotional recognition using deep neural networks, and Kansizoglou et al. [33] used cyclic neural networks to achieve continuous emotional recognition, which is also a huge innovation.
There has been a lot of research into the use of deep learning to process EEG signals for emotional recognition. However, there are still some outstanding issues to be resolved. For example, RNN makes it difficult for networks to learn long sequences due to the presence of multiple recursive layers, gradient explosion, or disappearance. Many studies based on deep learning consider only one characteristic of frequency, such as [34,35,36,37]. In addition, the electrode channels used in related research are mostly not uniform, which directly affects the accuracy and practical application of classification. In order to solve these problems, we propose a CNN-Bi-LSTM emotional recognition model with attention mechanisms based on EEG in this paper. In our model, the EEG data are first extracted through convolution, then Bi-LSTM, and, finally, an attention mechanism layer to automatically capture the most important features of the entire EEG record. Note that the mechanism layer can set the weight coefficients of each channel to distinguish the differences between them. This kind of weighted operation can lead to better use of important information and improve the performance of model recognition.
The innovations of this study, compared to previous studies, are that: (1) It uses raw EEG signals without any preprocessing to facilitate their application in brain interfaces. (2) It introduces a Bi-LSTM with better performance than LSTM to solve gradient explosion and gradient disappearance. (3) It introduces attention mechanisms into deep learning frameworks to solve the problem of manual selection of electrode channel characteristics. (4) The model is applied to SEED and SEED-IV datasets, and the results show that it has a very good generalization performance.

2. Materials and Methods

2.1. SEED Dataset

SJTU emotion EEG dataset (SEED) was provided by Professor Lu of Shanghai Jiaotong University BCMI laboratory. SEED was made from EEG recordings of 15 subjects [38,39]. During the experiment, 15 Chinese film clips, including positive, neutral, and negative emotions, were selected as the stimuli and used in the experiment. The selection criteria for the movie clips are as follows:
(1)
The length of the whole experiment should not be too long, so as not to cause fatigue in the subject.
(2)
The video can be understood without explanation.
(3)
The video should cause a single target emotion.
The duration of each film clip is about 4 min. Each film clip is carefully edited to create coherent emotional triggers and maximize emotional meaning. There were 15 trials per experiment in total. Each clip was preceded by a 5 s cue, 45 s was used for self-assessment, and 15 s was rested after each clip in a session. The order is arranged in a way that two film clips for the same emotion do not show continuously. For feedback, participants were told to report their emotional responses to each movie clip by completing the questionnaire immediately after watching each clip.
SEED-IV [40] contained data from EEG recordings of 15 subjects, and 72 movie clips were carefully selected for three experiments that tended to induce feelings of happiness, sadness, fear, or neutrality. To test the stability and portability of the model for emotional recognition, we conducted the experiment on SEED and SEED-IV datasets, respectively.
SEED and SEED-IV EEG data were collected using channel 62 subsampling frequency of 200 Hz. In order to filter noise and remove artifacts, a band pass frequency filter of 0–75 Hz was applied. The film clips used in the SEED and SEED-IV experiments are shown in Table 1 and Table 2. Due to the sheer volume of data, we extracted 1000 consecutive datasets from each person in the experiment in the middle of each video segment, so SEED and SEED-IV extracted 15 people × 15 videos × 1000 EEG data = 225,000 and 15 people × 24 videos × 1000 EEG data = 360,000, respectively. The EEG acquisition process is shown in Figure 1. EEG signals and eye movements were collected using the 62-channel ESI NeuroScan system and SMI eye-tracking glasses.

2.2. Data Pre-Processing

The SEED has some files containing the differential entropy (DE) features of the extracted EEG signal that are ideal for those who want to quickly test the classification methods without preprocessing the raw EEG data. SEED-IV filtered out noise and artifacts independent of EEG features with linear dynamic systems (LDSs) and moving averages. SJTU Emotion EEG dataset officially pre-processed and reconstructed the original dataset. But, to test the superiority of our model, the raw EEG data were used to perform experiments without any preprocessing. Data preprocessing in this study only normalized the officially provided EEG signal data, and the aim was to reduce the computational amount while increasing the convergence rate of the model.
Normalization was performed by dividing the raw EEG signal by the maximum of each channel to ensure the same distribution of data across the input layers. Converting data labels into unique hot encoding can transform categorical data into a unified digital format for facilitating the processing and computation of machine learning algorithms. The pre-processed data are divided into the training and test sets as input to the deep learning model.

2.3. CNN-Bi-LSTM-Attention Model

There are significant correlations in temporal dimensions of EEG signals. Bi-LSTM is just right for extending temporal features and processing data with sequential features but cannot extract spatial features, so CNN was also introduced. In this paper, the CNN-Bi-LSTM model is proposed to improve the prediction accuracy by introducing attention mechanisms widely used in the field of computer vision and taking into account spatial characteristics and temporal dimensions as well as electrode channel selection. The presented model in this paper consists of an input layer, a convolution layer, a Bi-LSTM layer, an attention mechanism layer, two fully connected layers, and an output layer. The pooling layer can reduce dimensions, but some features may be lost and reduce the accuracy of the model classification, so it was not induced to the proposed model. The normalized data are regarded as input to CNN, which extracts spatial features, and then the output of CNN was put into Bi-LSTM to extract temporal features. The extracted features were put into the attention mechanism layer, which calculates and assigns weight values of each feature, then further extracts features and lowers dimensions through two fully connected networks, and finally classifies the final result using Softmax function. The network structure of the CNN-Bi-LSTM-Attention model is shown in Figure 2.

2.3.1. Convolutional Neural Network

Convolutional neural network (CNN) is a kind of deep neural network, mainly used in image classification, object detection, segmentation, and so on. Usually, CNN consists of several types of layers, including a convolutional layer, rectifier linear unit (ReLU), pooling layer, dropout layer, and fully connected layer (FC). The convolutional layer is the basis of the CNN. In this layer, the signals or features of the previous layer are convolved with the sliding kernel to extract new features. The ReLU layer introduces nonlinearity in the feature mapping by applying the activation function f(x) = max(0, x). The pooling layer reduces the dimension of the feature map by sliding the window and calculates the mean, maximum, or sum of the values within the window. The dropout layer sets the input element to zero with a given probability to reduce over-fitting. The fully connected layer is a single sample column vector, commonly used in the later layers of a convolutional neural network for classification tasks. The fully connected layer is that each junction is connected to all the nodes in the previous layer, which is used to synthesize the features extracted from the front layer. Due to its fully connected characteristics, the parameters of the general fully connected layer are also the highest. The fully connected layer can also achieve dimension reduction by mapping the high-dimensional features to the low-dimensional space.

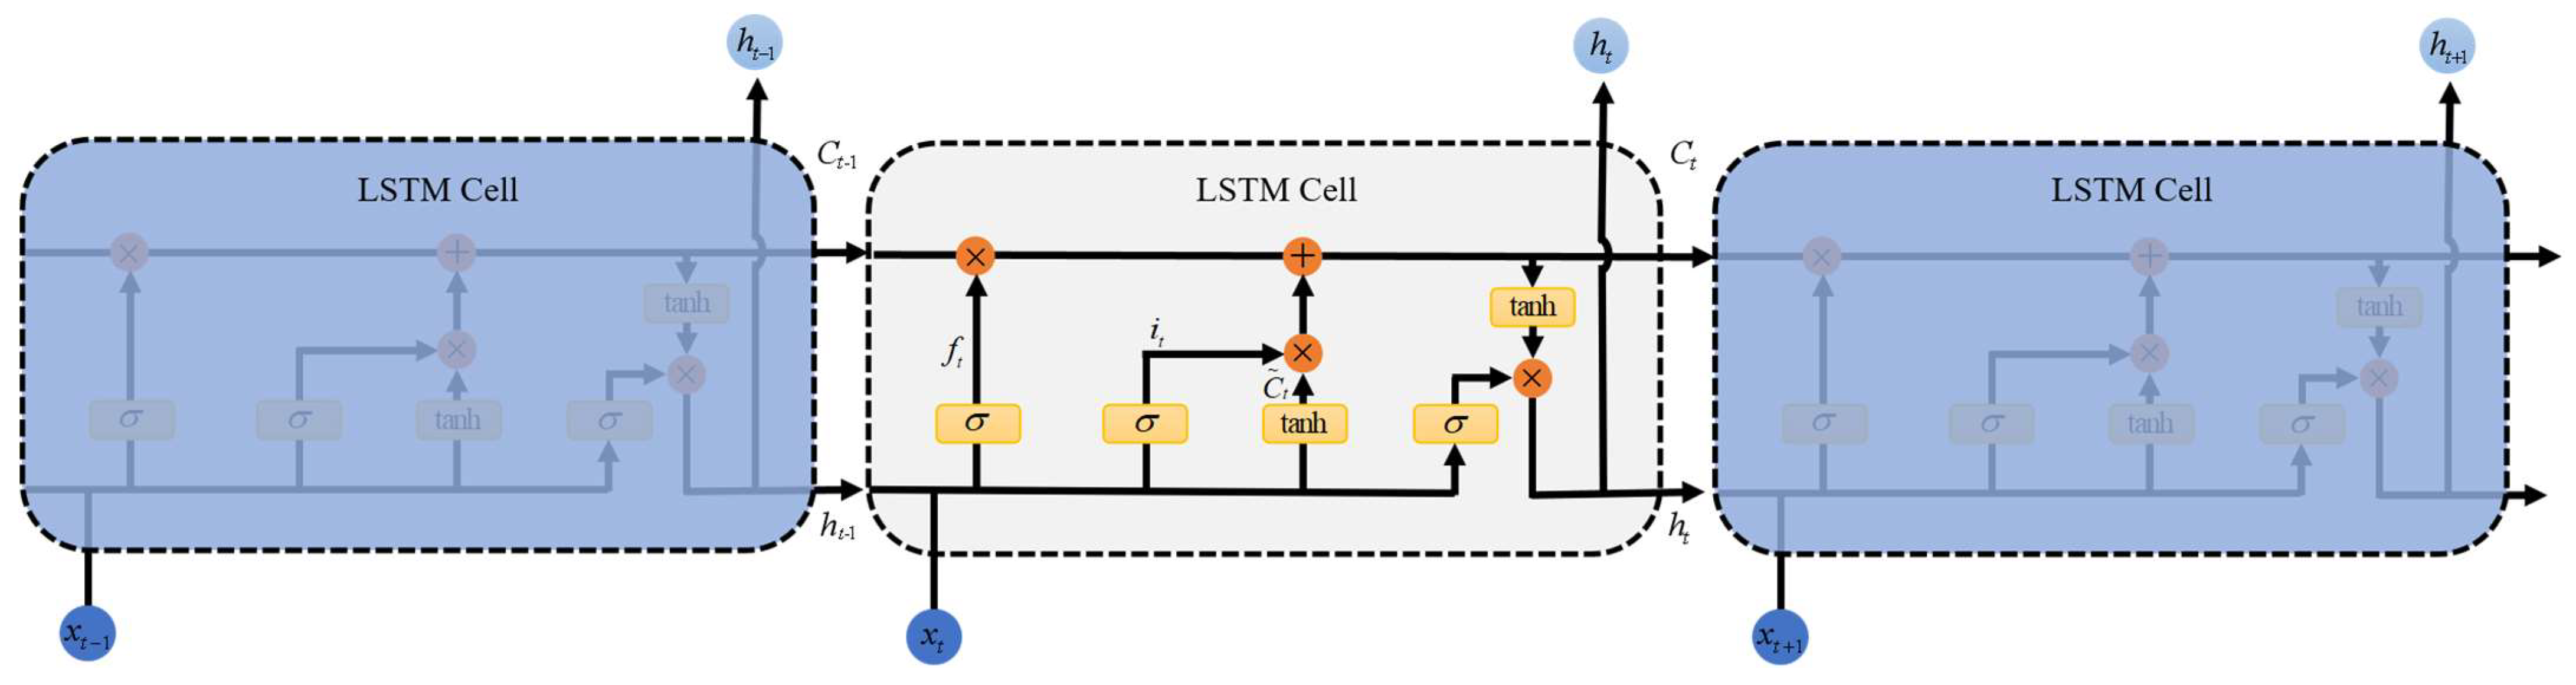
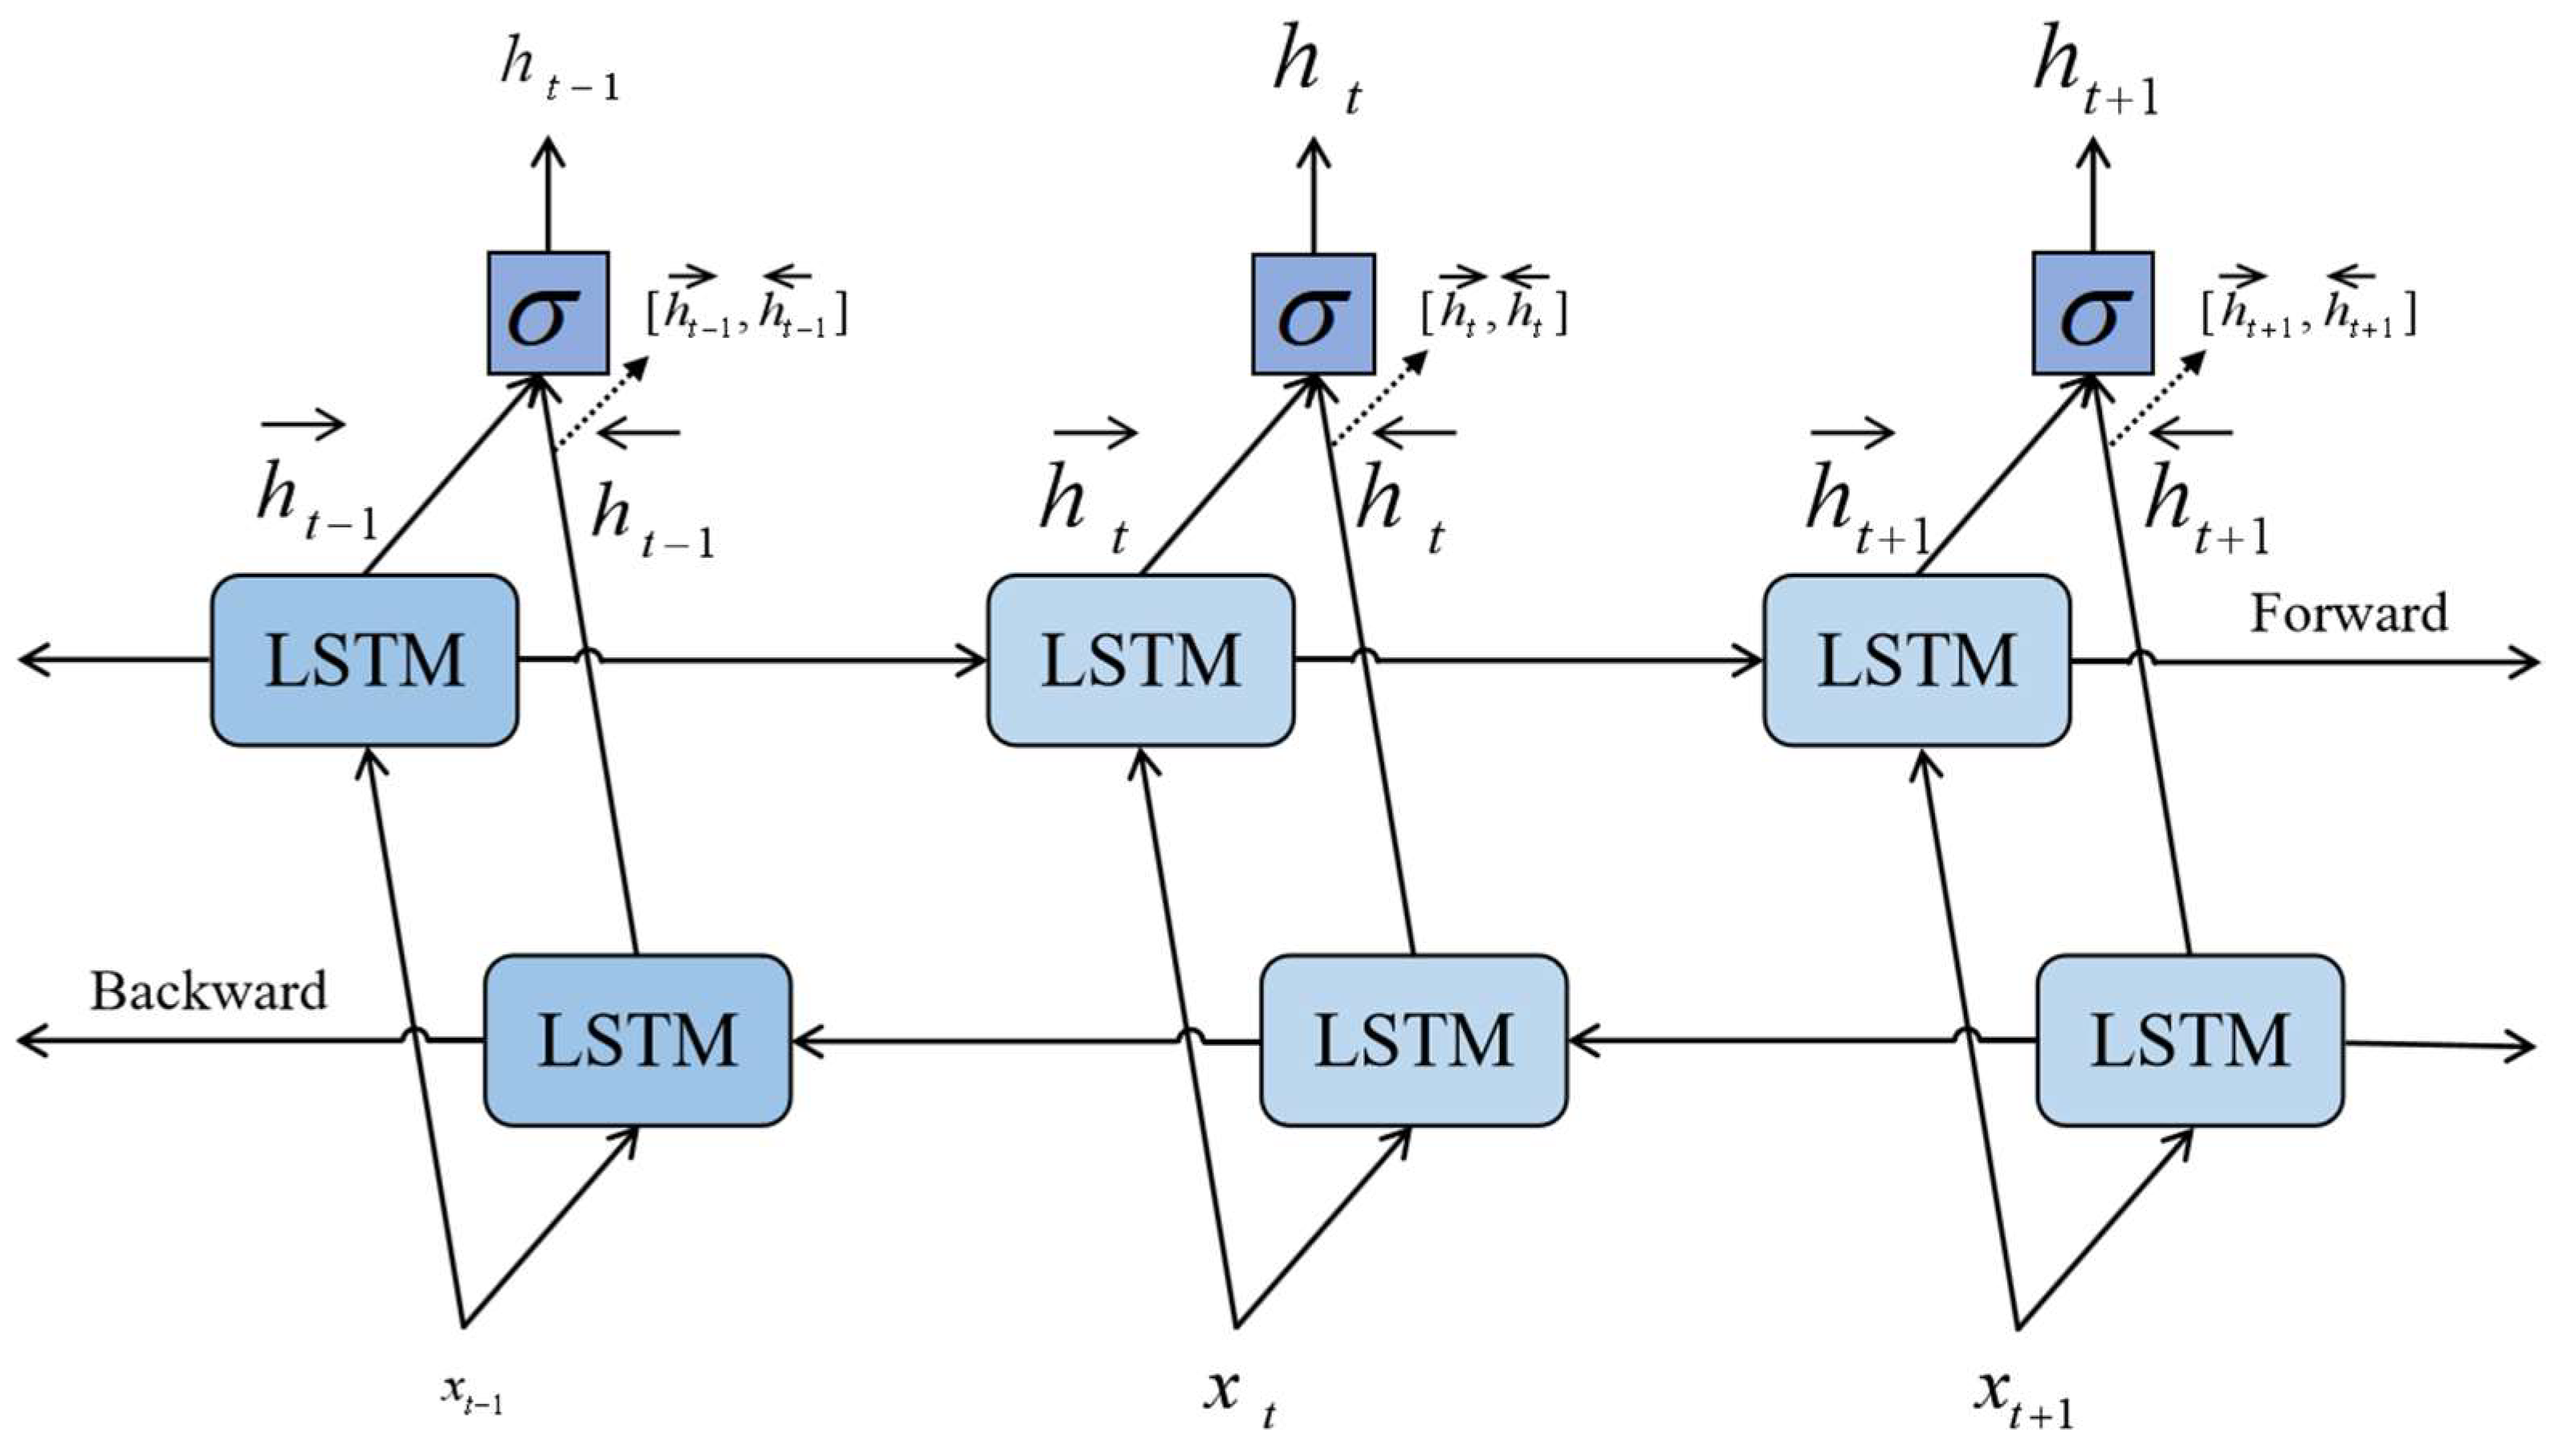
2.3.2. Bi-Directional Long Short-Term Memory

EEG signals are typical time-series data that usually have a significant pre-posterior correlation in the temporal dimension; that is, the output at some point in the future is closely related to the past state. To model this sequence structure, an RNN was introduced. The RNN introduces recurrent connections in the temporal dimension and adds new hidden layers between different time points so that the entire neural network has the ability to model the anterior–posterior relationships between the sequences. The RNN model has a long-time dependence problem due to gradient disappearance or gradient explosion. LSTM can solve these problems.
The key idea of LSTM model is the “cellular state”, which resembles a conveyor belt. Along the conveyor belt, there are only a few linear interactions. LSTM introduces an internal mechanism called a “gate” that regulates the flow of information. These portal structures can learn which data in a sequence are important information to retain and which to delete. LSTM has three gates to protect and control cellular states. The forgotten gate is responsible for determining the amount of previous storage cell states passing through the current LSTM unit. The input gate updates the state of the storage unit using information from the current input and the previously hidden state. The output gate controls the selective output of the current storage unit state. These functions enable LSTM to learn about time relationships in long-term sequences.
The LSTM model is shown in Figure 3. In the LSTM model, the first step is to decide what information to discard from the “cell”, which is performed using a forgotten gate. The layer reads the current input x and the foreneuron information h, and the ft decides to discard the information. Output 1 means “fully retained” and 0 means “completely abandoned”. The second step, which consists of two layers, is to determine the new information stored in the cell’s state. The sigmoid layer acts as the “input gate”, determining the value i to update. Tanh layer is used to create a new candidate value vector C ˜ t to join the state. The third step is to update the state of the old cells by updating Ct−1 to Ct. We multiply the old state with ft, discarding the information that is not needed. Then, it × C ˜ is added. These are the new candidate values, which vary according to the degree to which we decide to update each state. The final step is to determine the output, which is based on cell state, but also a filtered version. First, we run a sigmoid layer to determine which parts of the cell state will be exported. Then, we process the state of the cell through tanh (to obtain a value between −1 and 1) and multiply it with the output of the sigmoid gate, and in the end, we only export the portion of the output. The mathematical expression of the LSTM unit is defined as shown in Equations (1)–(6).
f t = σ ( w f × [ h t 1 , x t ] + b f )
i t = σ ( w i × [ h t - 1 , x t ] + b i )
C ~ t = tanh ( w c × [ h t 1 , x t ] + b c )
C t = f t × C t 1 + i t × C ~ t
o t = σ ( w o × [ h t 1 , x t ] + b o )
h t = o t × tanh ( C t )
But, both traditional RNN and LSTM messages are sent from the back of the conveyor belt, which has limitations in many tasks, such as lexical tagging, in which a word is related not only to the first word but also to the second. To solve this problem, two LSTM networks are used in this paper, which are also known as bi-directional long- and short-term memory networks (Bi-LSTMs), which are forward and directional. The Bi-LSTM neural network structure model is divided into two independent LSTMs, and the input sequence is represented by two LSTM neural networks (one positive order and one negative order). So, the arrows of ht represent the LSTM in both the anterior and posterior directions. The Bi-LSTM network structure is shown in Figure 4.
The entire output of ht of Bi-LSTM can be calculated using Equation (7). In Bi-LSTM, the feature data obtained at t moment have both past and future information. Compared with the single LSTM structure, the Bi-LSTM is more efficient in extracting EEG signal features. Bi-LSTM can make use of early and late sequence information, which helps to explore deep brain information from long EEG sequence signals.
h t = σ ( W h × [ h t , h t ] + b h )

2.3.3. Attention Mechanism

The attention mechanism is a kind of resource allocation mechanism that simulates the human brain. When the human brain processes things, it tends to focus more on what is important and pay less or no attention to other areas, thus obtaining more detailed information that needs attention, suppressing other useless information, ignoring irrelevant information, and amplifying information that needs attention. The attention mechanism breaks the limitation that the traditional encoder–decoder structure relies on a fixed-length vector in the code. In order to improve model accuracy, we used the attention mechanism to focus on properties that have a significant impact on output variables to leverage the most decisive information in EEG sequences.
In this paper, a point multiplication attention mechanism is used to weight sum the expressions of hidden layer vectors of Bi-LSTM output. By applying the attention mechanism to the back of the feature extraction model, we can focus on the features that affect the output variables and improve the accuracy of the method. Dot-product attention consists of three parts, that is, a learned key matrix K, a value matrix V, and a query vector q [41]. The key matrix K is obtained via Equation (8).
K = tanh ( V W a )
where Wa is a randomly initialized weight matrix. After that, determine the current key matrix, and similarities between each query value and the current key value are calculated to obtain a normalized probability vector d, that is, weight vector, as shown in Equation (9).
d = s o f t max ( q K T )
Finally, the attention vector can be obtained using Equation (10).
a = d V

2.3.4. Fully Connected Layer (FC)

The full connection layer is a column vector, which is used in the back layers of deep neural networks for image classification tasks. Each node in FC is connected to all the nodes of the upper layer, which is used to synthesize features extracted from the front. Because of its fully connected characteristics, the FC also has the most parameters. The whole connecting layer can also be mapped to the lower dimension to reduce the dimension.

2.3.5. Classifying

Softmax is a very common function in machine learning, especially deep learning, particularly in multiple-category scenarios. It maps the input to a real number between 0 and 1. In a multi-classification problem, we need the classifier to output the probability of each classification. Meanwhile, to compare the size of probabilities, the sum of probabilities should be set to 1. Therefore, the Softmax function is used in this paper.

2.4. Evaluation Indexes

In this paper, we evaluated the validity and robustness of our model from different perspectives using common indicators in the classification of EEG emotions, including five parameters: accuracy, precision, recall rate, F1-score, and Matthews correlation coefficient (MCC). Of these, true positive, false negative, true negative, and false positive were expressed by TP, FN, TN, and FP, respectively [42].
Accuracy: Predicting the correct number as a percentage of totals in positive and negative cases. Precision: The proportion of samples in which the prediction is correct is based on the result of the prediction. Recall rate: The proportion of samples that are predicted to be correct to the total number of actual samples is based on actual samples. F1-score: Neutralized accuracy and recall metrics. MCC is essentially a coefficient describing the correlation between the actual classification and the predicted classification, with a range of values ranging from a perfect prediction of subjects at a value of 1 to a prediction of less than a stochastic prediction at a value of 0, with -1 being a complete discrepancy between the predicted classification and the actual classification. These assessment parameters are calculated as in Equations (11)–(15).
a c c u r a c y = T P + T N T P + F P + T N + F N
p r e c i s i o n = T P T P + F P
r e c a l l = T P T P + F N
F 1 - s c o r e = 2 1 p r e c i s i o n + 1 r e c a l l
M C C = T P × T N F P × F N ( T P + F P ) ( T P + F N ) ( T N + F P ) ( T N + F N )

3. Experimental Results and Analysis

3.1. Experimental Setup

In this experiment, the dataset was split into 80% and 20% for training and testing, respectively. Because the number of datasets is large enough, the stability of the test set accuracy is maintained. The amount of training is 200 times, the batch size is 1024, the Adam optimizer is used, and categorical_crossentropy is used as the loss function. To ensure the consistency of the data used in the training set and the test set, all the data of the pre-training model are set as the same random seeds, which are randomly scrambled and sent to the network model. CNN-Bi-LSTM-Attention and other comparison network models were implemented and trained using Python 3.7 and TensorFlow2.3 on GeForce RTX 2080Ti. Table 3 shows the CNN-Bi-LSTM-Attention model parameter settings in this paper.

3.2. Recognition Results of Three and Four Classification Task

To validate the classification performance of the CNN-Bi-LSTM-Attention model presented here in EEG detection, we compared it to a combination of DNN, CNN, deep separable convolution neural networks (DSCNNs), LSTM, and Bi-LSTMs. Further, 1D CAE is a two-layer convoluted self-encoder, and 1D InceptionV1 is a model for replacing two-dimensional convolution nuclei with one-dimensional convolution nuclei. We also compared them to six traditional machine learning models, Adaboost, Bayes, Decision Tree, KNN, Random Forest, and XGBoost, all using the same random seeds to ensure consistent use of training and test datasets in training models. Because EEG signals are highly correlated, we divided the dataset, with 80% as a training set and 20% as a test set, meaning EEG data from the first 12 subjects and the last 3 made up a test set. The experimental results of the three and four classification tasks are shown in Table 4 and Table 5.
It can be seen from Table 4 that the CNN-Bi-LSTM-Attention model performed best in the three classification tasks, with 99.44% accuracy, 99.45% precision, 99.44% recall, 99.44% F1-score, and 99.16% MCC. It can be seen from Table 5 that the CNN-Bi-LSTM-Attention model also performed the best in four classification tasks, with 99.99% accuracy, 99.99% precision, 99.99% recall, 99.99% F1-score, and 99.99% MCC. Further, 1D CAE and Random Forest were second only to the CNN-Bi-LSTM-Attention model in the three and four classification tasks. Bayes classifiers performed the worst of the two types of classification tasks. The results show that the proposed model is more suitable for emotion recognition based on EEG signal.
As shown in Figure 5, we drew the confusion matrices of the CNN-Bi-LSTM-Attention model for the three and four classification tasks. In machine learning, a confusion matrix is an error matrix that is often used to intuitively evaluate the performance of supervised learning algorithms. The size of a confusion matrix is a square matrix in which the values represent the number of classes. Each row of this matrix represents an instance in a real class, and each column represents an instance in a predictive class. Figure 5 shows that the CNN-Bi-LSTM-Attention model is highly accurate for emotional recognition classification.

3.3. The Results of Ten-Fold Cross-Validation

A single test result is not enough to ensure the superiority of our model because deep learning results differ with each training session. So, we further validated the performance of the proposed model with 10-fold cross-validation. The 10-fold cross-validation is an average split of all samples into 10 equal parts, any of which are considered test data, and it is used to obtain reliable and stable models. We also used fixed random seeds to determine the accuracy of the prediction algorithm by taking the average of 10 results. Figure 6 and Figure 7 show the results of the proposed model based on 10-fold cross-validation of test sets for three and four classification tasks. Ten-fold cross-validation of three and four classification tasks showed an average accuracy of 99.55% and 99.79%, respectively, for the proposed model.
Furthermore, we compared it with other models, as shown in Table 6 and Table 7. It can be seen from Table 6 that the proposed model performed best in ten-fold cross-validation for three classification tasks, with 99.55% accuracy, 99.55% precision, 99.55% recall, 99.54% F1-score, and 99.32% MCC. It can be seen from Table 7 that the proposed model also performed the best on ten-fold cross-validation for four classification tasks, with 99.79% accuracy, 99.79% precision, 99.79% recall, 99.79% F1-score, and 99.72% MCC. Random Forest had an accuracy rate of 97.26% and 95.98%, respectively, second only to the proposed model.

4. Discussion

The CNN-Bi-LSTM-Attention model performed well on three and four classification tasks, whether a single test or 10-fold cross-validation, and further validated the superiority of the model by comparing it with other models. In this paper, the spatial features were extracted via one-dimensional convolution, and the temporal features were extracted through bi-directional LSTM. These two models can extract the temporal–spatial features of EEG data sufficiently. Finally, the weighted EEG signal channels were further extracted using an attention mechanism module, and the final classification results were obtained using the Softmax classifier. Numerous experimental results show that the proposed method has obvious advantages over other methods. This may be due to the fact that machine learning models are unable in extracting deeper features, while other deep learning models do not use attention mechanisms. Thus, the CNN-Bi-LSTM-Attention model presented in this paper has higher classification precision and can dynamically learn the relationship between the pathways of EEG emotion signals.

5. Conclusions

In this paper, we proposed a deep learning framework that integrates CNN, Bi-LSTM, and attention mechanism networks to automatically extract and classify time-series characteristics of EEG emotional signals. The method normalized the raw data and then fed the data into the CNN-Bi-LSTM-Attention network. The average ten-fold cross-validation accuracy of the method was 99.55% for three classification tasks and 99.79% for four classification tasks. This model is superior to other models in predicting EEG mood signals and has high accuracy and reliability. The experimental results show that deep learning is more advantageous to automatic feature extraction of EEG signals than artificial feature extraction, and electrode channels are automatically screened using an attention mechanism. Thus, our deep learning model can be extended to applications such as epilepsy diagnosis through EEG classification and can be further refined by combining EEG with ECG, EMG, and facial expressions through multi-model deep learning training. In the future, we can graft models into machine learning system-based applications [43,44], such as brain–interface devices, to make human–machine interaction more friendly.

Author Contributions

Conceptualization, data curation, investigation, methodology, validation, visualization, writing—original draft, Z.H.; data curation, project administration, resources, supervision Y.M.; supervision, writing—review and editing Y.M. and R.W.; investigation, W.L. and Y.D. All authors have read and agreed to the published version of the manuscript.

Funding

This work is supported by the General Projects of Shaanxi Science and Technology Plan (No.2023-JC-YB-504 to Y.M.) and the Shaanxi province innovation capacity support program (No.2018KJXX-095 to Y.M.).

Data Availability Statement

This study is an experimental analysis of a publicly available dataset. The data can be found at this web page: https://bcmi.sjtu.edu.cn/~seed (accessed on 3 July 2023).

Conflicts of Interest

The authors declare no conflict of interest.

References

  1. Gabriels, K. Response to “uncertainty in emotion recognition”. J. Inf. Commun. Ethics Soc. 2019, 17, 295–298. [Google Scholar] [CrossRef]
  2. Kansizoglou, I.; Bampis, L.; Gasteratos, A. An active learning paradigm for online audio-visual emotion recognition. IEEE Trans. Affect. Comput. 2019, 13, 756–768. [Google Scholar] [CrossRef]
  3. Cowie, R.; Douglas-Cowie, E.; Tsapatsoulis, N.; Votsis, G.; Kollias, S.; Fellenz, W.; Taylor, J. Emotion recognition in human-computer interaction. IEEE Signal Process. Mag. 2001, 18, 32–80. [Google Scholar] [CrossRef]
  4. Swangnetr, M.; Kaber, D.B. Emotional state classification in patient–robot interaction using wavelet analysis and statistics-based feature selection. IEEE Trans. Human-Mach. Syst. 2012, 43, 63–75. [Google Scholar] [CrossRef]
  5. Qureshi, S.A.; Dias, G.; Hasanuzzaman, M.; Saha, S. Improving depression level estimation by concurrently learning emotion intensity. IEEE Comput. Intell. Mag. 2020, 15, 47–59. [Google Scholar] [CrossRef]
  6. Hu, B.; Rao, J.; Li, X.; Cao, T.; Li, J.; Majoe, D.; Gutknecht, J. Emotion regulating attentional control abnormalities in major depressive disorder: An event-related potential study. Sci. Rep. 2017, 7, 13530. [Google Scholar] [CrossRef] [PubMed] [Green Version]
  7. Yang, D.; Alsadoon, A.; Prasad, P.; Singh, A.; Elchouemi, A. An emotion recognition model based on facial recognition in virtual learning environment. Procedia Comput. Sci. 2018, 125, 2–10. [Google Scholar] [CrossRef]
  8. Li, T.M.; Shen, W.X.; Chao, H.C.; Zeadally, S. Analysis of students’ learning emotions using EEG. In Proceedings of the Innovative Technologies and Learning: Second International Conference, ICITL 2019, Tromsø, Norway, 2–5 December 2019; Proceedings 2. Springer International Publishing: Berlin/Heidelberg, Germany, 2019; pp. 498–504. [Google Scholar]
  9. Huang, X.; Wang, S.-J.; Liu, X.; Zhao, G.; Feng, X.; Pietikainen, M. Discriminative spatiotemporal local binary pattern with revisited integral projection for spontaneous facial micro-expression recognition. IEEE Trans. Affect. Comput. 2017, 10, 32–47. [Google Scholar] [CrossRef] [Green Version]
  10. Petrushin, V. Emotion in speech: Recognition and application to call centers. Artif. Neural Netw. Eng. 1999, 710, 22. [Google Scholar]
  11. Yan, J.; Zheng, W.; Xin, M.; Yan, J. Integrating facial expression and body gesture in videos for emotion recognition. IEICE Trans. Inf. Syst. 2014, 97, 610–613. [Google Scholar] [CrossRef] [Green Version]
  12. Guo, Y.; Nejati, H.; Cheung, N.M. Deep neural networks on graph signals for brain imaging analysis. In Proceedings of the 2017 IEEE International Conference on Image Processing (ICIP), Beijing, China, 17–20 September 2017; pp. 3295–3299. [Google Scholar]
  13. Wang, X.-W.; Nie, D.; Lu, B.-L. Emotional state classification from EEG data using machine learning approach. Neurocomputing 2014, 129, 94–106. [Google Scholar] [CrossRef]
  14. Katsigiannis, S.; Ramzan, N. DREAMER: A database for emotion recognition through EEG and ECG signals from wireless low-cost off-the-shelf devices. IEEE J. Biomed. Health Inform. 2017, 22, 98–107. [Google Scholar] [CrossRef] [PubMed] [Green Version]
  15. Hsu, Y.-L.; Wang, J.-S.; Chiang, W.-C.; Hung, C.-H. Automatic ECG-based emotion recognition in music listening. IEEE Trans. Affect. Comput. 2017, 11, 85–99. [Google Scholar] [CrossRef]
  16. Liu, Z.-T.; Xie, Q.; Wu, M.; Cao, W.-H.; Mei, Y.; Mao, J.-W. Speech emotion recognition based on an improved brain emotion learning model. Neurocomputing 2018, 309, 145–156. [Google Scholar] [CrossRef]
  17. Bashivan, P.; Rish, I.; Yeasin, M.; Codella, N. Learning representations from EEG with deep recurrent-convolutional neural networks. arXiv 2015, arXiv:1511.06448. [Google Scholar]
  18. Gajic, D.; Djurovic, Z.; Gligorijevic, J.; Di Gennaro, S.; Savic-Gajic, I. Detection of epileptiform activity in EEG signals based on time-frequency and non-linear analysis. Front. Comput. Neurosci. 2015, 9, 38. [Google Scholar] [CrossRef] [PubMed] [Green Version]
  19. Gaur, P.; McCreadie, K.; Pachori, R.B.; Wang, H.; Prasad, G. Tangent space features-based transfer learning classification model for two-class motor imagery brain–computer interface. Int. J. Neural Syst. 2019, 29, 1950025. [Google Scholar] [CrossRef]
  20. Choi, H.; Park, J.; Yang, Y.-M. A Novel Quick-Response Eigenface Analysis Scheme for Brain–Computer Interfaces. Sensors 2022, 22, 5860. [Google Scholar] [CrossRef]
  21. Ekman, P.; Friesen, W.V.; O’Sullivan, M.; Chan, A.; Diacoyanni-Tarlatzis, I.; Heider, K.; Krause, R.; LeCompte, W.A.; Pitcairn, T.; Ricci-Bitti, P.E.; et al. Universals and cultural differences in the judgments of facial expressions of emotion. J. Pers. Soc. Psychol. 1987, 53, 712–717. [Google Scholar] [CrossRef]
  22. Russell, J.A.; Barrett, L.F. Core affect, prototypical emotional episodes, and other things called emotion: Dissecting the elephant. J. Personal. Soc. Psychol. 1999, 76, 805. [Google Scholar] [CrossRef]
  23. Kim, K.H.; Bang, S.W.; Kim, S.R. Emotion recognition system using short-term monitoring of physiological signals. Med Biol. Eng. Comput. 2004, 42, 419–427. [Google Scholar] [CrossRef] [PubMed]
  24. Houssein, E.H.; Hammad, A.; Ali, A.A. Human emotion recognition from EEG-based brain–computer interface using machine learning: A comprehensive review. Neural Comput. Appl. 2022, 34, 12527–12557. [Google Scholar] [CrossRef]
  25. George, F.P.; Shaikat, I.M.; Hossain, P.S.F.; Parvez, M.Z.; Uddin, J. Recognition of emotional states using EEG signals based on time-frequency analysis and SVM classifier. Int. J. Electr. Comput. Eng. 2019, 9, 1012–1020. [Google Scholar] [CrossRef]
  26. Pandey, P.; Seeja, K. Subject independent emotion recognition from EEG using VMD and deep learning. J. King Saud Univ-Comput. Inf. Sci. 2022, 34, 1730–1738. [Google Scholar] [CrossRef]
  27. Thejaswini, S.; Ravikumar, K.M.; Jhenkar, L.; Natraj, A.; Abhay, K.K. Analysis of EEG based emotion detection for DEAP and SEED-IV databases using SVM 208 II. Lit. Rev. 2019, 1, 207–211. [Google Scholar]
  28. Alhagry, S.; Fahmy, A.A.; El-Khoribi, R.A. Emotion recognition based on EEG using LSTM recurrent neural network. Int. J. Adv. Comput. Sci. Appl. 2017, 8. [Google Scholar] [CrossRef] [Green Version]
  29. Yin, Y.; Zheng, X.; Hu, B.; Zhang, Y.; Cui, X. EEG emotion recognition using fusion model of graph convolutional neural networks and LSTM. Appl. Soft Comput. 2021, 100, 106954. [Google Scholar] [CrossRef]
  30. Cimtay, Y.; Ekmekcioglu, E. Investigating the use of pretrained convolutional neural network on cross-subject and cross-dataset EEG emotion recognition. Sensors 2020, 20, 2034. [Google Scholar] [CrossRef] [Green Version]
  31. Ozdemir, M.A.; Degirmenci, M.; Guren, O.; Akan, A. EEG based emotional state estimation using 2-D deep learning technique. In Proceedings of the 2019 Medical Technologies Congress (TIPTEKNO), Izmir, Turkey, 3–5 October 2019; pp. 1–4. [Google Scholar]
  32. Tzirakis, P.; Trigeorgis, G.; Nicolaou, M.A.; Schuller, B.W.; Zafeiriou, S. End-to-end multimodal emotion recognition using deep neural networks. IEEE J. Sel. Top. Signal Process. 2017, 11, 1301–1309. [Google Scholar] [CrossRef] [Green Version]
  33. Kansizoglou, I.; Misirlis, E.; Tsintotas, K.; Gasteratos, A. Continuous emotion recognition for long-term behavior modeling through recurrent neural networks. Technologies 2022, 10, 59. [Google Scholar] [CrossRef]
  34. Kwon, Y.-H.; Shin, S.-B.; Kim, S.-D. Electroencephalography based fusion two-dimensional (2D)-convolution neural networks (CNN) model for emotion recognition system. Sensors 2018, 18, 1383. [Google Scholar] [CrossRef] [Green Version]
  35. Thammasan, N.; Moriyama, K.; Fukui, K.-I.; Numao, M. Familiarity effects in EEG-based emotion recognition. Brain Informatics 2017, 4, 39–50. [Google Scholar] [CrossRef]
  36. Zhu, Y.; Zhong, Q. Differential entropy feature signal extraction based on activation mode and its recognition in convolutional gated recurrent unit network. Front. Phys. 2021, 8, 629620. [Google Scholar] [CrossRef]
  37. Yang, Y.; Wu, Q.; Fu, Y.; Chen, X. Continuous convolutional neural network with 3D input for EEG-based emotion recognition. In Neural Information Processing: 25th International Conference, ICONIP 2018, Siem Reap, Cambodia, 13–16 December 2018; Proceedings, Part VII 25; Springer International Publishing: Berlin/Heidelberg, Germany, 2018; pp. 433–443. [Google Scholar]
  38. Zheng, W.-L.; Lu, B.-L. Investigating critical frequency bands and channels for EEG-based emotion recognition with deep neural networks. IEEE Trans. Auton. Ment. Dev. 2015, 7, 162–175. [Google Scholar] [CrossRef]
  39. Duan, R.N.; Zhu, J.Y.; Lu, B.L. Differential entropy feature for EEG-based emotion classification. In Proceedings of the 2013 6th International IEEE/EMBS Conference on Neural Engineering (NER), San Diego, CA, USA, 6–8 November 2013; pp. 81–84. [Google Scholar]
  40. Zheng, W.-L.; Liu, W.; Lu, Y.; Lu, B.-L.; Cichocki, A. EmotionMeter: A multimodal framework for recognizing human emotions. IEEE Trans. Cybern. 2018, 49, 1110–1122. [Google Scholar] [CrossRef]
  41. Liu, C.; Liu, Y.; Yan, Y.; Wang, J. An intrusion detection model with hierarchical attention mechanism. IEEE Access 2020, 8, 67542–67554. [Google Scholar] [CrossRef]
  42. Huang, Z.; Ma, Y.; Wang, R.; Yuan, B.; Jiang, R.; Yang, Q.; Li, W.; Sun, J. DSCNN-LSTMs: A Lightweight and Efficient Model for Epilepsy Recognition. Brain Sci. 2022, 12, 1672. [Google Scholar] [CrossRef] [PubMed]
  43. Krichen, M.; Mihoub, A.; Alzahrani, M.Y.; Adoni, W.Y.H.; Nahhal, T. Are Formal Methods Applicable to Machine Learning And Artificial Intelligence? In Proceedings of the 2022 2nd International Conference of Smart Systems and Emerging Technologies (SMARTTECH), Riyadh, Saudi Arabia, 9–11 May 2022; pp. 48–53. [Google Scholar]
  44. Raman, R.; Gupta, N.; Jeppu, Y. Framework for Formal Verification of Machine Learning Based Complex System-of-Systems. Insight 2013, 26, 91–102. [Google Scholar] [CrossRef]
Figure 1. EEG acquisition experimental process.
Electronics 12 03188 g001
Figure 2. Network structure of CNN-Bi-LSTM-Attention model.
Electronics 12 03188 g002
Figure 3. LSTM model.
Electronics 12 03188 g003
Figure 4. Bi-LSTM model.
Electronics 12 03188 g004
Figure 5. Confusion matrices of three- and four-class classification tasks.
Electronics 12 03188 g005
Figure 6. The accuracy of CNN-Bi-LSTM-Attention model based on ten-fold cross-validation for three category tasks.
Electronics 12 03188 g006
Figure 7. The accuracy of CNN-Bi-LSTM-Attention model based on ten-fold cross-validation for four category tasks.
Electronics 12 03188 g007
Table 1. SEED dataset movie snippets.
Serial NO.Emotion LabelFilm Clips’ SourcesStart Time PointEnd Time Point
01Lost in Thailandhappy0:06:130:10:11
02World Heritage in Chinaneutral0:00:500:04:36
03Aftershocksad0:20:100:23:35
04Back to 1942sad0:49:580:54:00
05World Heritage in Chinaneutral0:10:400:13:44
06Lost in Thailandhappy1:05:101:08:29
07Back to 1942sad2:01:212:05:21
08World Heritage in Chinaneutral2:556:35
09Flirting Scholarhappy1:18:571:23:23
10Just Another Pandora’s Boxhappy11:3215:33
11World Heritage in Chinaneutral10:4114:38
12Back to 1942sad2:16:372:20:37
13World Heritage in Chinaneutral5:369:36
14Just Another Pandora’s Boxhappy35:0039:02
15Aftershocksad1:48:531:52:18
Table 2. SEED-IV dataset movie snippets.
Serial NO.Emotion LabelFilm Clips’ SourcesStart Time PointEnd Time Point
01Black Keyssad42:3245:41
02The Eye 3fear49:25:0051:00:00
03Rob-B-Hoodhappy41:07:0045:06
04A Bite of Chinaneutral30:2932:48
05The Child’s Eyefear41:0042:37
06A Bite of Chinaneutral5:198:05
07A Bite of Chinaneutral24:4226:41
08Very Happysad17:0921:13
09A Bite of Chinaneutral31:1833:44
10A Wedding Invitationsad1:34:041:38:50
11Bunshinsaba IIfear42:2443:33
12Dearestsad1:31:081:33:29
13Aftershocksad20:1324:14
14Foster Fathersad24:2927:10
15Bunshinsaba IIIfear1:04:521:09:49
16Promo for applying the Olympic Winter Gameshappy0:002:54
17Hungry Ghost Ritualfear45:0746:48
18Hungry Ghost Ritualfear1:10:211:13:33
19Very Happyhappy34:3037:15
20You are my life more completehappy39:3240:44
21A Bite of China neutral18:5920:56
22Hear Mehappy1:33:2796:10
23A Bite of Chinaneutral16:2819:24
24Very Happyhappy12:4815:31
Table 3. Parameters of the CNN-Bi-LSTM-Attention model.
ParameterValue
epoch number200
learning rate0.001
batch size1024
optimizerAdam
loss functioncategorical_crossentropy
convolution kerne32
activation functionReLU
Bi-LSTM16
FC132
FC216
classifierSoftmax
Random seed42
Table 4. The performance of different models on three classification tasks of test sets.
MethodsAccuracy (%)Precision (%)Recall (%)F1-Score (%)MCC (%)
CNN-RNN77.6277.6677.6277.5666.49
CNN-LSTM94.6994.7094.6994.6992.04
CNN-Bi-LSTM93.1093.1693.1093.0989.69
DSCNN-RNN72.4373.0972.4372.2359.09
DSCNN-LSTM94.0394.0494.0394.0391.05
DSCNN-Bi-LSTM91.1091.3091.1091.0886.76
1D CAE95.9295.9295.9295.9193.88
1D InceptionV187.7287.8987.7287.7081.68
Adaboost54.2955.0354.2953.9931.86
Bayes40.9542.9740.9535.8813.77
Decision Tree79.3881.0679.3879.4769.78
KNN54.2955.0354.2953.9931.86
Random Forest94.7395.2094.7394.7692.30
XGBoost95.1295.2195.1295.1292.73
CNN-Bi-
LSTM-Attention
99.4499.4599.4499.4499.16
Table 5. The performance of different models on four classification tasks of test sets.
MethodsAccuracy (%)Precision (%)Recall (%)F1-Score (%)MCC (%)
CNN-RNN56.8757.7256.8756.9142.72
CNN-LSTM87.6887.7187.6887.6883.59
CNN-Bi-LSTM85.4385.5285.4385.4580.59
DSCNN-RNN55.3555.4855.3554.7540.78
DSCNN-LSTM88.8788.8788.8788.8785.17
DSCNN-Bi-LSTM84.0884.0884.0884.0878.78
1D CAE87.2987.2987.2987.2983.06
1D InceptionV178.0678.1778.0678.0770.77
Adaboost37.4937.5237.4937.4116.69
Bayes26.1030.4426.1017.3924.6
Decision Tree88.4688.6388.4688.5084.65
KNN37.4937.5237.4937.4116.69
Random Forest96.6596.7596.6596.6695.56
XGBoost87.2387.3487.2387.2482.99
CNN-Bi-
LSTM-Attention
99.9999.9999.9999.9999.99
Table 6. The performance of different models based on ten-fold cross-validation (three classification tasks).
MethodsAccuracy (%)Precision (%)Recall (%)F1-Score (%)MCC (%)
CNN-RNN73.0373.3173.0272.9859.70
CNN-LSTM93.2893.2993.2793.2889.92
CNN-Bi-LSTM92.1792.1992.1792.1788.28
DSCNN-RNN70.5770.9370.5870.4956.07
DSCNN-LSTM92.9692.9892.9692.9689.46
DSCNN-Bi-LSTM89.7489.7789.7589.7484.64
1D CAE92.07921292.0682.8888.13
1D InceptionV182.2782.6082.2782.2573.58
Adaboost52.6353.3852.6452.3529.35
Bayes41.7942.2341.7938.8213.75
Decision Tree81.0881.0881.0881.0871.62
KNN92.2492.2792.2492.2488.38
Random Forest97.2697.2797.2697.2595.90
XGBoost90.6990.9190.6990.6986.14
CNN-Bi-
LSTM-Attention
99.5599.5599.5599.5499.32
Table 7. The performance of different models based on ten-fold cross-validation (four classification tasks).
MethodsAccuracy (%)Precision (%)Recall (%)F1-Score (%)MCC (%)
CNN-RNN54.9955.7454.9954.7340.29
CNN-LSTM83.6583.7083.6483.6578.21
CNN-Bi-LSTM82.2082.2582.2082.2076.29
DSCNN-RNN54.9955.7454.9954.7340.29
DSCNN-LSTM81.1581.1881.1581.1474.88
DSCNN-Bi-LSTM79.9880.0879.9779.9773.34
1D CAE83.2083.2683.2083.2077.63
1D InceptionV173.3173.9673.3073.2464.64
Adaboost35.9336.0035.9335.8214.61
Bayes25.7728.8425.7717.3416.60
Decision Tree74.1074.1174.1074.1065.47
KNN96.1696.1696.1696.1694.88
Random Forest95.9895.9995.9895.9894.64
XGBoost80.5780.8180.5780.6174.15
CNN-Bi-
LSTM-Attention
99.7999.7999.7999.7999.72
Disclaimer/Publisher’s Note: The statements, opinions and data contained in all publications are solely those of the individual author(s) and contributor(s) and not of MDPI and/or the editor(s). MDPI and/or the editor(s) disclaim responsibility for any injury to people or property resulting from any ideas, methods, instructions or products referred to in the content.

