Article

Multi-Objective Real-Time Optimal Energy Management Strategy Considering Energy Efficiency and Flexible Torque Response for a Dual-Motor Four-Drive Powertrain

by
Qingxing Zheng
1,2,3,4,* and
Shaopeng Tian
1,2,3,4
1
School of Automotive Engineering, Wuhan University of Technology, Wuhan 430070, China
2
Hubei Key Laboratory of Advanced Technology for Automotive Components, Wuhan University of Technology, Wuhan 430070, China
3
Hubei Collaborative Innovation Center for Automotive Components Technology, Wuhan 430070, China
4
Hubei Research Center for New Energy & Intelligent Connected Vehicle, Wuhan University of Technology, Wuhan 430070, China
*
Author to whom correspondence should be addressed.
Electronics 2023, 12(13), 2903; https://doi.org/10.3390/electronics12132903
Submission received: 28 May 2023 / Revised: 22 June 2023 / Accepted: 29 June 2023 / Published: 1 July 2023
(This article belongs to the Topic Electric Vehicles Energy Management)

Abstract

:
To exhaust the potential of energy efficiency and dynamic performance of the dual-motor four-drive powertrain, this study developed a multi-objective real-time optimal energy management strategy considering energy efficiency and flexible torque response. First, a theoretical analysis of energy loss and operating characteristics was performed to elucidate the energy-saving advantages and control challenges of the dual-motor four-drive powertrain. Second, an economic strategy based on the adaptive nonlinear particle swarm optimization (ANLPSO) and optimization freezing tolerance mechanism was devised to realize real-time optimal power distribution. Then, the pre-shifting recognition schedule and gradient torque recovery strategy were developed to achieve flexible torque response during gear shifting. Finally, smooth switching logic was created to assure a seamless transition between the two strategies. Numerous simulation results indicate that compared with the single-motor drive strategy, the proposed strategy can increase energy efficiency by 8.1%, 4.02%, and 9.49% under NEDC, WLTC, and CLTC, respectively. During shifting, the longitudinal acceleration and jerk of the proposed strategy are significantly superior to those of the original strategy, thereby enhancing the vehicle’s dynamic performance and ride comfort. The results of the drum experiment validate the efficacy of the proposed method for energy consumption optimization and torque coordination control in the actual vehicle environment.

1. Introduction

The issues of global energy crisis and greenhouse gas emissions have accelerated the transportation sector’s low-carbon development [1,2]. Facing the overall goal of carbon peak and neutrality, vehicle electrification and decarbonization are becoming significant trends for the automobile industry in China [3,4]. In recent years, dual-motor four-drive electric vehicles (DMFDEVs) have gained tremendous attention due to their superior energy efficiency and drivability [5]. The most challenging aspect of devising DMFDEVs is realizing optimal power distribution and torque coordination control between two motors. The creation of an effective energy management strategy is widely acknowledged as the solution to these problems [6,7].

1.1. Literature Review

Currently, two basic categories can be used to distinguish DMEV energy management strategies: rule-based and optimization-based. The latter can further be subdivided into single-objective and multi-objective strategies based on different optimization objectives such as energy efficiency, dynamic performance, motor operation stability, and mode-switching smoothness [8,9].
Rule-based strategies are the most widely used and relatively mature due to their simple design, convenient implementation, and excellent real-time performance [10,11]. Ruan et al. developed a rule-based shifting schedule and power split strategy for a dual-motor powertrain. This strategy enables smooth switching of operation mode and gear shifting through active torque coordination control. Simulation results demonstrate that it can significantly improve the motors’ working efficiency and realize gear shifting with minimal impact, resulting in a substantial economic advantage over a single-motor powertrain [12]. To maximize the driving efficiency of the proposed novel dual-motor coupling powertrain, Hu et al. optimized the working mode-switching threshold and the motor operation points in different modes and determined the optimal rule-based mode-switching strategy and power split algorithm. Simulation results indicate that this strategy can reduce vehicle impact during mode switching and increase energy efficiency by 3–5% compared with a single-motor powertrain [13]. Vinoth et al. developed a fuzzy logic-based dual-motor working mode-switching rule that realizes flexible mode switching and optimal power split based on the vehicular power demand to prolong the electric driving range of PHEVs. Simulation results verify that this strategy can reduce energy consumption and increase driving range [14]. To enhance the driving cycle adaptability of the strategy, Hou et al. employed the multi-island genetic algorithm to determine the optimal mode-switching principles for various driving cycles. A rule-based torque split strategy based on driving pattern recognition was further developed. Simulation results prove that this strategy can precisely identify driving cycles and adjust control parameters based on driving cycles, thereby achieving an improvement in energy efficiency under real driving conditions [15].
Although the rule-based strategy is simple and practicable, the determination of its control rules and switching threshold relies on engineering expertise, and its adaptability to various working conditions is inadequate. Consequently, it is incapable of achieving global optimization of energy management [16,17]. As a benchmark, the global optimization-based strategy using dynamic programming (DP) can realize global optimal control given the prior knowledge of the driving cycle [18]. Zhang et al. created the mathematical model of a power-coupling dual-motor pure electric bus and a dual-motor power distribution optimization problem to maximize energy efficiency. The optimal power distribution and gear shifting control laws were determined using DP. Simulation results indicate that it can decrease energy loss by 14.9% without increasing mode-switching frequency [19]. Wu et al. designed an integrated electric propulsion system with a two-speed dual-motor configuration. The working mode-switching threshold of the powertrain was optimized offline using DP, and the optimal control rules were implemented online using the rule-based strategy. It has a significant energy-saving effect in US06 and CLTC [20]. Xie et al. conducted a comparative analysis of DP, even-distributed strategy, and rule-based strategy with the powertrain’s energy consumption as the optimization objective. Simulation results indicate that, compared with the other two strategies, DP could reduce energy consumption by 5.07 kWh and 2.29 kWh per 100 km, respectively [21]. Although DP can obtain optimal results for energy management, the computation process is complex and time-consuming, and the optimization results cannot be implemented in real-time [22,23]. Even if the artificial neural network (ANN)-based strategies [24] or rule-based strategies [25] can be devised based on optimal results and implemented in vehicle controllers, the design of such strategies is still highly dependent on driving cycle information.
The instantaneous optimization-based strategy has superior real-time performance and dynamic adaptability compared to the global optimization-based strategy, and it outperforms the rule-based strategy in terms of optimization performance. Through optimization design, it can achieve approximate global optimal performance, which has the application potential of real vehicle controllers [26]. To improve the energy consumption and speed-following capability of unmanned dual-motor pure electric vehicles, He et al. established a vehicle dynamics model incorporating dynamic response based on MPC for speed prediction, and the global off-line optimization of torque split strategy and shifting schedule was conducted. Experiments demonstrate that compared to the original model and PI controller, it can reduce speed following errors by 58.93% and 83.19%, respectively, and improve energy efficiency by 9.29% under C-WTVC [27]. Lin et al. proposed a real-time MPC-DP-based power split strategy for a dual-motor coupling-drive powertrain. Based on an analysis of power characteristics and acceleration trend prediction, two state transition matrices were devised for speed prediction by the Markov chain. DP was also utilized as an online rolling optimization algorithm to achieve the power split of dual motors. Results show that, compared with the rule-based strategy, it can reduce speed prediction error and improve energy efficiency by 21.4% [28]. Although the MPC-based instantaneous optimization strategy can foresee the optimal control law based on historical data, its control performance is overly dependent on the prediction model’s accuracy. In contrast, the instantaneous optimization strategy based on the heuristic algorithm optimizes the torque distribution among the various motors based on the driver’s demand power, exhibiting high real-time performance and robustness. Yang et al. devised a time-efficient torque distribution strategy using the PSO algorithm for a dual-motor four-drive powertrain. It can achieve optimal torque distribution when the vehicle is traveling in a straight line and turning. Compared to DP, the PSO algorithm can only obtain approximate global optimal energy consumption, but its real-time performance is significantly improved [29]. Shangguan et al. proposed a real-time optimization framework for the torque split ratio of the dual-motor electric bus. Taking the mean and standard deviation of battery energy consumption as optimization objectives, the multi-objective PSO was employed to optimize the control parameters for various bus routes. Results indicate that it can reduce energy consumption by 4.03% and is robust under real-world conditions [30].

1.2. Motivation and Contribution

As discussed above, the aforementioned approaches have a great control effect on the energy consumption improvement of dual-motor electric vehicles. However, there are some pivotal control issues in the process of engineering implementation to be solved urgently, such as energy efficiency optimization and coordination control of the dual-motor four-drive powertrain, the balance between optimization performance and computational cost, and engineering application and validation of instantaneous optimization-based strategies.
To address this deficiency, this research aims to develop an advanced control algorithm with great control effect and mass production application capability for a dual-motor four-drive electric powertrain. A multi-objective real-time optimal energy management strategy is proposed to optimize energy efficiency and realize flexible torque response. The main contributions are summarized as follows:
  • First, a quantitative analysis of energy loss is performed to determine the direction of energy efficiency improvement for a single-motor electric powertrain. The theoretical operating efficiency of different powertrains is investigated to reveal the energy-saving mechanisms and control challenges of the dual-motor four-drive powertrain.
  • Second, to improve overall energy efficiency and motor output stability, an ANLPSO is proposed to enhance the optimization performance of PSO by improving the initialization process, inertial weight updating formula, and learning mechanism. In addition, optimization freezing tolerance constraints are introduced to resolve the issue of actual motor response and the balance between optimization performance and real-time performance for the first time, which is crucial to the online implementation of the real-time optimal power distribution for two motors.
  • Finally, to enhance the dynamic performance and ride comfort during gear shifting, a pre-shifting recognition mechanism based on the two-parameter shifting schedule and rear-motor response capacity is devised to predict shifting time and realize torque coordination control before shifting. A gradient torque recovery strategy based on different gears and the impact limit of humans is further developed to achieve smooth torque recovery for two motors after shifting. Moreover, the smooth switching process is designed to accomplish real-time optimal energy management and seamless torque transition.

1.3. Outline

The remaining sections of the paper are structured as follows: The dual-motor four-drive powertrain is described and modeled in Section 2. In Section 3, the energy-saving mechanism and theoretical operating efficiency of this powertrain are analyzed. In Section 4, the multi-objective real-time optimal energy management strategy considering energy efficiency and flexible torque response is described. Section 5 compares and discusses numerous simulation results for economic and dynamic energy management strategies. In Section 6, the actual vehicle experiment is conducted to validate the control performance of the proposed strategy. Section 7 concludes this paper.

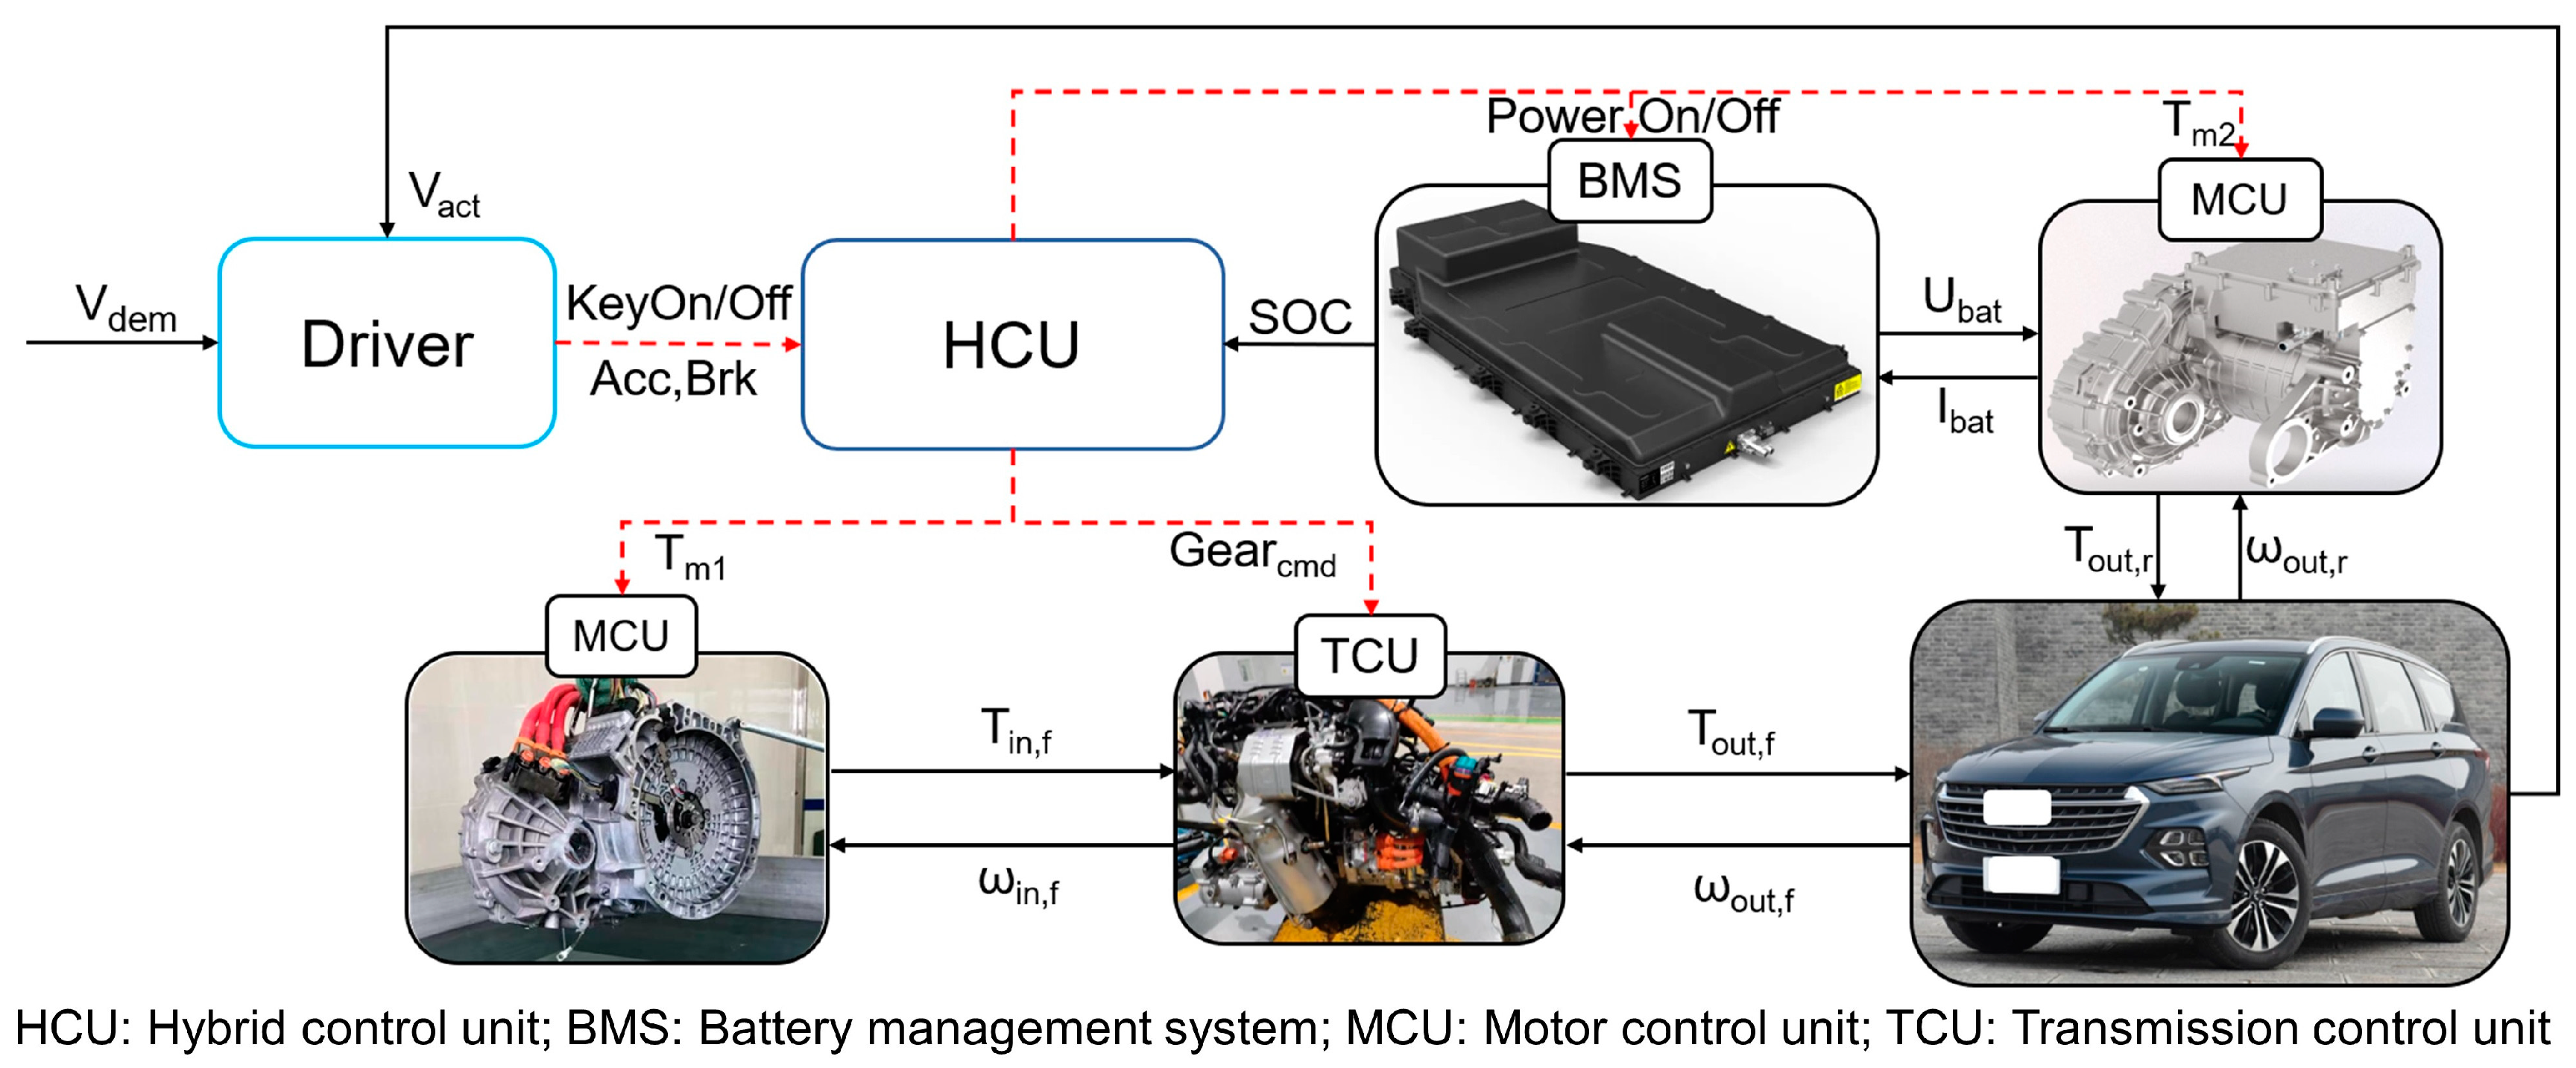
2. Vehicle Powertrain Description and Modeling

2.1. Powertrain Configuration

A dual-motor four-drive electric powertrain is studied in this paper, and its architecture is shown in Figure 1. The key components consist of the front motor, a 6-speed automated mechanical transmission, the front-axle main reducer and differential, the power battery and plug-in charging port, a power distribution unit (PDU), two motor control units (MCUs), the rear motor, and the rear-axle main reducer and differential. In detail, the front motor is a permanent magnet synchronous motor (PMSM) with a peak power of 105.4 kW, and its power is transmitted to the vehicle via the transmission, main reducer, and differential. Another PMSM with a peak power of 45 kW is mounted on the rear axle and can propel the vehicle via the main reducer and differential. The power battery can be charged from the external energy supply through the charging port, and its power is distributed to two MCUs by the PDU.

2.2. Vehicle Modeling

As shown in Figure 2, this section establishes a forward vehicle simulation model using quasi-static and dynamic modeling techniques. To construct this high-fidelity simulation platform, actual vehicle parameters, laboratory experiment data of power components, and the operation mechanism of HCU are all considered. The primary vehicle parameters are listed in Table 1.
(1)
Driver model
The driver model mainly simulates the driver to step down or loosen the acceleration pedal (brake pedal) to achieve velocity following. Thus, a widely-used PID model [31] is adopted to provide the control command according to the deviation between the demand velocity v d e m and the actual velocity v a c t , as presented in Equations (1)–(3):
Δ v = v a c t v d e m
A c c = K p Δ v + K i 0 t Δ v d t + K d d Δ v d t ,   Δ v < 0
B r k = K p Δ v + K i 0 t Δ v d t + K d d Δ v d t ,   Δ v 0
where A c c and B r k are acceleration pedal and brake pedal commands, respectively, and K p , K i , K d are PID parameters.
(2)
Motor model
To ascertain the relationship between motor torque and battery power, the motor output characteristics are modeled based on the motor efficiency data [32], as shown in Figure 3. The motor efficiency data are obtained through a motor experiment bench, which is provided by Zhejiang Founder Motor Co., Ltd. (Lishui, China). Thus, a function of motor speed, torque command, and efficiency is presented in Equation (5). In addition, the dynamic output characteristics of the actual motor torque are simulated using the first-order inertia element shown in Equation (6):
P b a t = T m , a c t ω m η m 9550 ,   T m , a c t 0 T m , a c t ω m 9550 η m ,   T m , a c t > 0
η m = f ( T m , ω m )
T m , a c t = T m 1 1 + τ m s
where ω m is the motor speed, T m and T m , a c t are the motor torque command and actual output torque, respectively, η m is the motor efficiency, P b a t is the battery power, and τ m is the time lag coefficient.
(3)
Battery model
The actual working process of the power battery is a complex coupling conversion process of electric energy, heat energy, and chemical energy. For simplicity, the equivalent circuit model [33] is utilized to reflect the relationship between battery SOC, open-circuit voltage U o c , and inner resistance R b a t , as shown in Equations (7)–(9):
U b a t = U o c ( S O C ( t ) ) I b a t ( t ) R b a t ( S O C ( t ) )
I b a t ( t ) = U o c ( S O C ( t ) ) U o c 2 ( S O C ( t ) ) 4 P b a t ( t ) R b a t ( S O C ( t ) ) 2 R b a t ( S O C ( t ) )
S O C ( t ) = S O C 0 0 t I b a t ( t ) d t Q
where U b a t denotes the terminal voltage, I b a t denotes the battery current, S O C 0 denotes the initial battery SOC, and Q denotes the nominal capacity.
(4)
Transmission model
The transmission’s principal function is to transfer power through the gear sets. Considering the mechanical losses among the components, this paper mainly models the relationship between the speed, torque, and efficiency of the transmission system:
T o u t , f = T i n , f i g η g
ω o u t , f = ω i n , f i g
T o u t , r = T i n , r i f , r η f , r
ω o u t , r = ω i n , r i f , r
where T o u t and T i n are the transmission output torque and input torque, respectively, ω o u t and ω i n are the angular velocity of the output shaft and input shaft, respectively, and η g and η f , r are the transmission efficiency of the front and rear axles, respectively.
(5)
Longitudinal vehicle dynamics model
Vertical and lateral motion characteristics of the vehicle are disregarded, and only longitudinal dynamics are modeled. The power balance equation on a flat road is given as follows:
δ m a = T o u t , f + T o u t , r r w m g C r C d A f v a c t 2 21.15
V a c t = 0 t a d t
where a is the longitudinal acceleration.

3. Energy-Saving Mechanism Analysis

In this section, the distribution of energy loss and theoretical operation efficiency are analyzed to disclose the energy-saving mechanism and control challenges of the dual-motor four-drive powertrain.

3.1. Energy Loss Analysis of Pure Electric Powertrain

During vehicle operation, battery internal resistance loss E B a t , c , accessory energy loss E A c c , drive energy consumption E D r v , transmission system energy loss E T r a n s , and motor energy loss E E l e , c account for the majority of the power battery’s energy consumption E b a t . The following formula can be used to calculate energy consumption:
E b a t = E B a t , c + E A c c + E E l e , c + E T r a n s + E D r v
The energy loss analysis is based on the pure electric range experiment data of a “single-motor + transmission” powertrain. The pure electric range experiment was performed according to GB/T 18352.6-2016 in China. As shown in Figure 4, 3.3% of battery energy is lost due to battery internal resistance; 4.32% of battery energy is consumed by low-voltage accessories; approximately 64.51% of the energy is used to propel the vehicle; 6.52% of the battery energy is lost in the transmission; and motor and controller losses account for 21.35%.
The powertrain energy efficiency during vehicle driving can be expressed as:
η d r v = E D r v E B a t = 1 E B a t , c + E A c c + E E l e , c + E T r a n s E B a t
To improve energy efficiency, it is necessary to reduce energy losses. Among them, the motor and controller losses are the largest of all non-essential energy losses, and there is considerable room for improvement. From this perspective, it is practicable to increase the energy efficiency of pure electric powertrains through research.

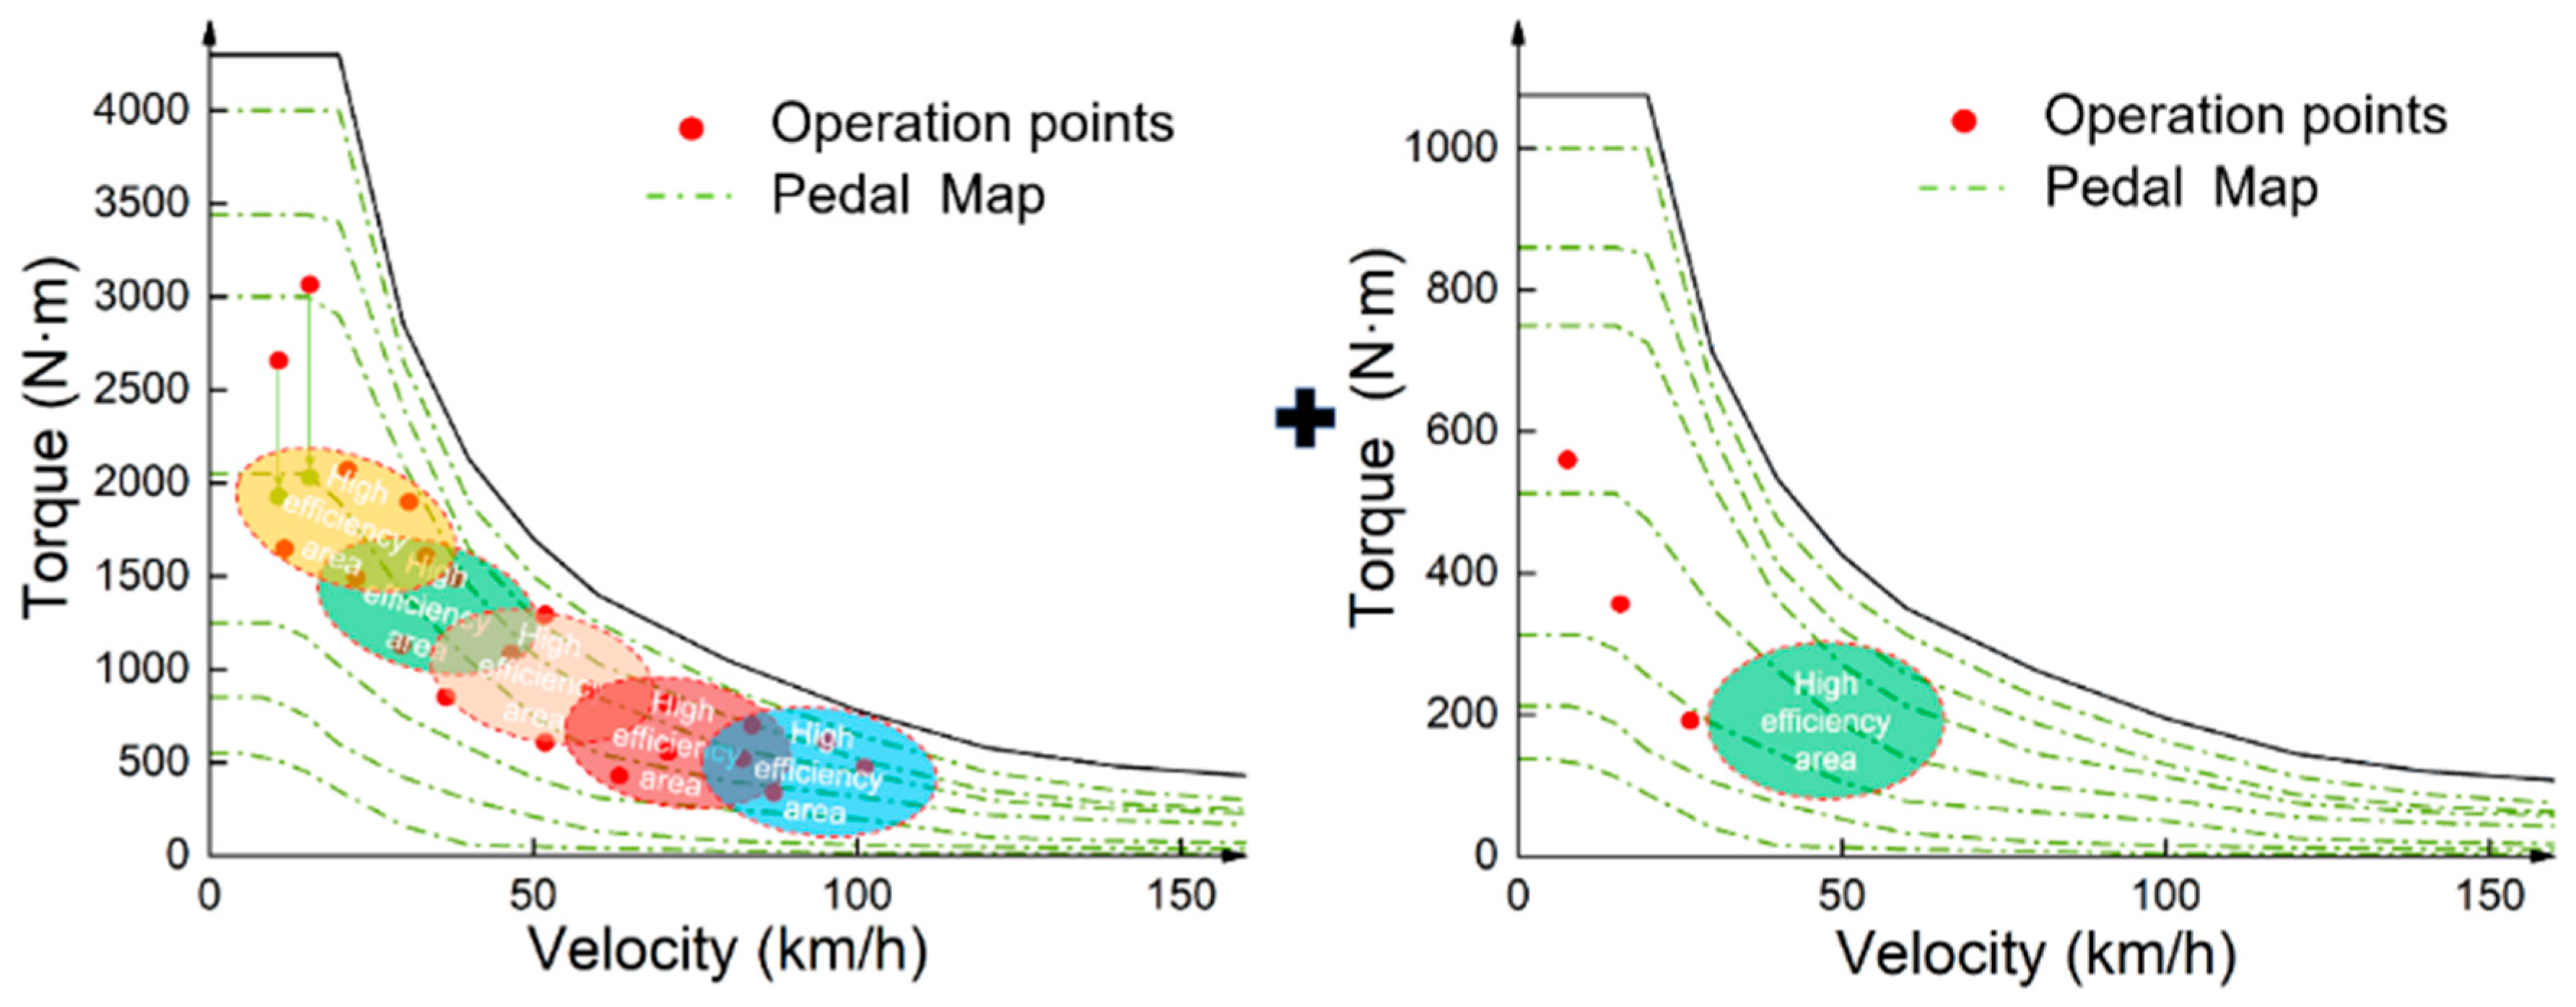
3.2. Theoretical Operation Characteristics Analysis of Different Powertrains

Currently, motor and controller optimization design, electric powertrain topology optimization design, multi-motor electric powertrain, and multi-motor drive system energy management optimization are significant methods to improve the energy efficiency of pure electric powertrains. In this paper, a 6-speed transmission is added to the front-axle single-motor direct drive powertrain, and a rear-axle single-motor direct drive powertrain is added to form a novel dual-motor four-drive configuration. The energy-saving advantages of this configuration compared with the single-motor powertrain are analyzed below.
As for the “single motor + main reducer powertrain”, the type and primary parameters of the driving motor are devised based on the vehicle’s dynamic performance index. Therefore, the motor with a high rated power is chosen to satisfy the vehicle’s power requirements, even though it will have a low working efficiency under most conditions. Even if the operation point distribution can be improved through motor economic selection and gear ratio optimization, it is only appropriate for certain working conditions and difficult to adapt to the complex actual working conditions, as shown in Figure 5a.
The “single motor + transmission” configuration can adjust motor speed and improve motor operation points through the gear sets. Through the optimization of the gear ratio, more operation points are located in the high-efficiency zone. Its merit is that the freedom of speed control is introduced to change the high-efficiency range of the powertrain, thereby expanding the motor’s high-efficiency operation zone. Nonetheless, this configuration is incapable of adjusting the operation region of the motor torque, and some operation points cannot be located in the high-efficiency zone, as shown in Figure 5b.
To remedy the aforementioned issue, another “single motor + main reducer” powertrain is mounted on the rear axle to form a double-motor four-drive configuration. The energy-saving mechanism of this configuration is shown in Figure 6. The torque operation region of the front-axle powertrain can be adjusted by the low-power rear-axle powertrain. On the one hand, the operation points of the low-speed low-torque condition are directly transferred from the front motor to the rear motor. Due to the relatively small power, the low-efficiency operation points can be transferred to the high-efficiency zone of the rear motor. On the other hand, the low-speed high-torque operation points can be transferred to the high-efficiency zone through torque compensation, thus further improving energy efficiency.
The preceding analysis demonstrates that the dual-motor four-drive powertrain has significant energy-saving advantages over the single-motor one in terms of configuration, but some challenging control problems arise due to the complexity of configuration: (1) How can the power split ratio of two motors be solved under complex driving conditions and variable driving demands? (2) When the transmission shifts, the front-axle powertrain will lose power. How can the problem of loss of power and poor comfort during shifting be resolved via torque coordination control?

4. Multi-Objective Real-Time Optimal Energy Management Strategy

In this section, a multi-objective real-time optimal energy management framework considering energy efficiency and torque response is proposed. First, the multi-objective problem of energy efficiency and motor output stability is formulated. The economic strategy is devised to achieve optimal power allocation based on ANLPSO and the optimization freezing tolerance mechanism. Second, the pre-shifting recognition mechanism and gradient torque recovery strategy are proposed to accomplish torque coordination control and improve dynamic performance and comfort during transmission shifting. Finally, smooth switching logic is developed to assure a seamless transition between the two strategies.

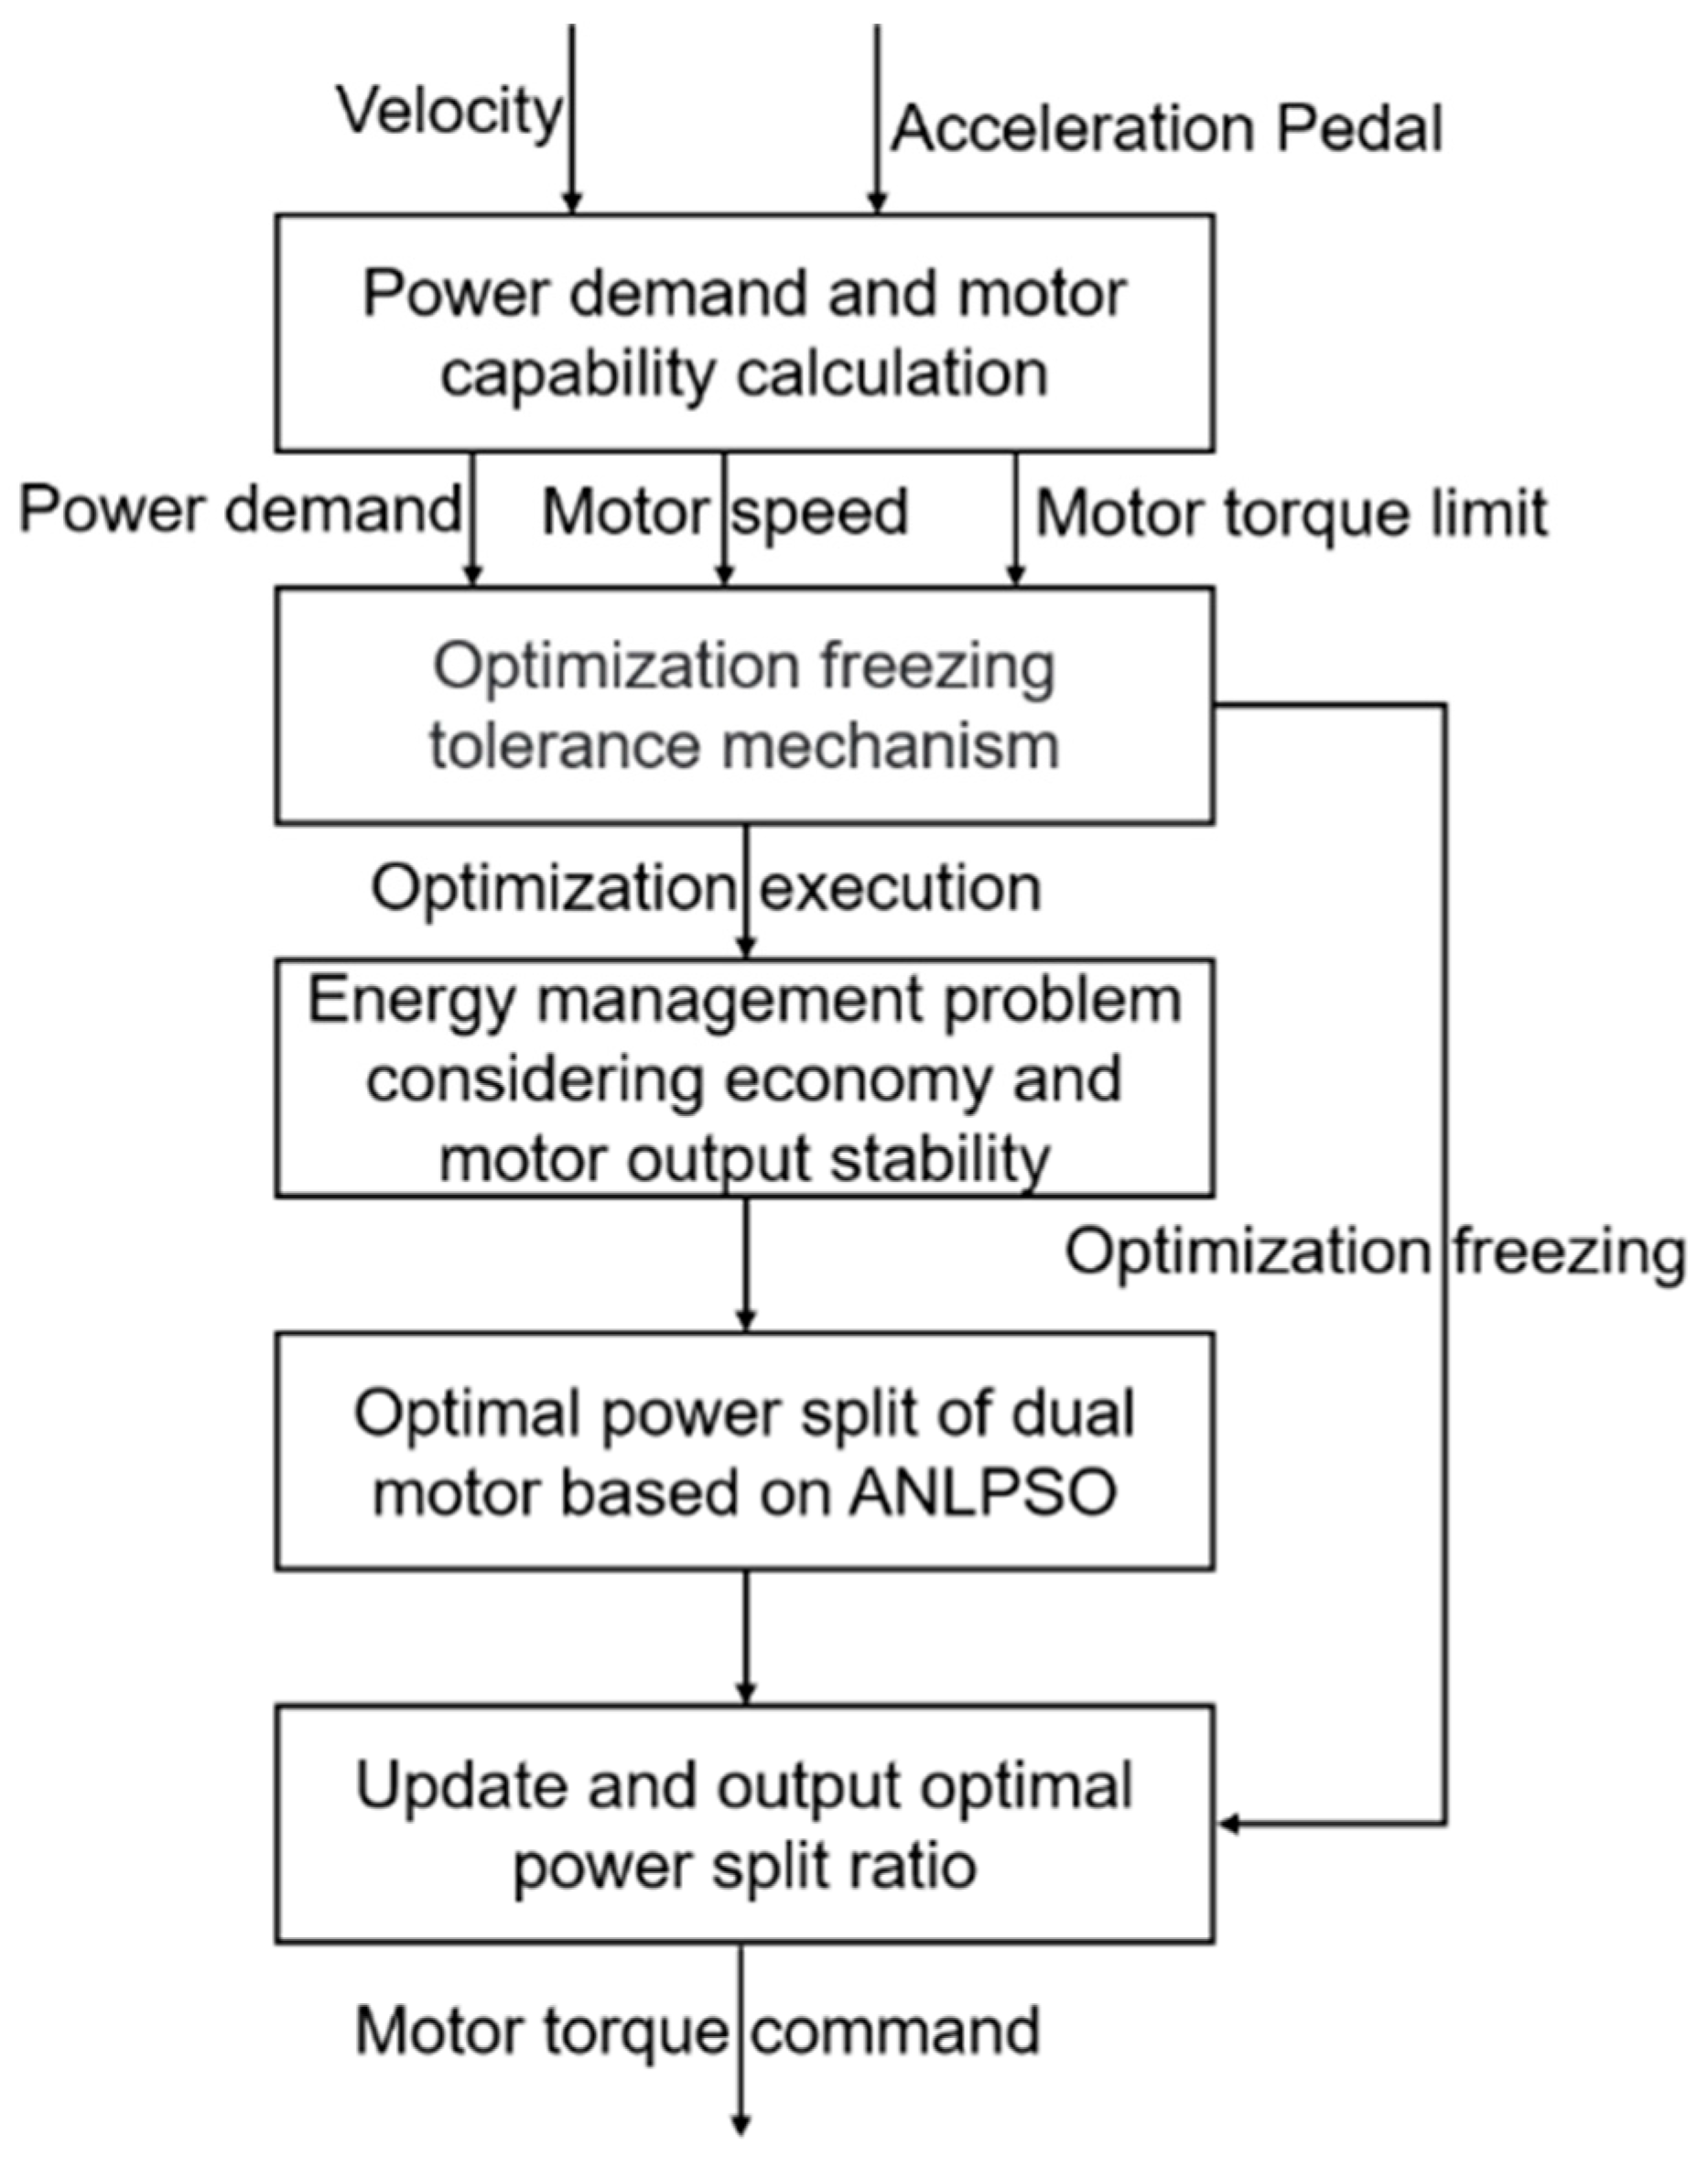
4.1. Economic Energy Management Strategy Based on ANLPSO and Optimization Freezing Tolerance Mechanism

(I)
Multi-objective energy management optimization problem
During vehicle driving, the power balance equation of the powertrain is as follows:
P d r v = P m 1 + P m 2 P t r a n s = P r e q P t r a n s
where P d r v is the required driving power, P m 1 and P m 2 are the mechanical power of two motors, respectively, P r e q is the total output power, and P t r a n s is the transmission power loss. According to Equation (4), the battery power is formulated as:
P b a t = P m 1 η m 1 + P m 2 η m 2
The overall energy efficiency can be calculated as follows:
η = P r e q P b a t = P m 1 + P m 2 P m 1 η m 1 + P m 2 η m 2 = ( P m 1 + P m 2 ) η m 1 η m 2 P m 1 η m 2 + P m 2 η m 1
The power split ratio λ between two motors is defined as the optimization variable. The mechanical power of two motors can be presented as:
P m 1 = λ P r e q P m 2 = ( 1 λ ) P r e q
To maximize the overall energy efficiency, by substituting Equation (21) into Equation (20), the optimization objective is established as follows:
max J η = η m 1 η m 2 λ η m 2 + ( 1 λ ) η m 1
The following constraints are imposed on the energy management problem based on the mechanical structure and power limit of the motors:
0 ω m 1 ω m 1 , max 0 ω m 2 ω m 2 , max 0 P m 1 = λ P r e q P m 1 , max 0 P m 2 = ( 1 λ ) P r e q P m 2 , max
To assure output stability, the motor’s actual response capability is considered:
min J p = Δ 1 P r a t e , 1 + Δ 2 P r a t e , 2 ,   Δ P r a t e 10 ,   Δ > P r a t e Δ 1 = P m 1 * P m 1 Δ 2 = P m 2 * P m 2
where Δ 1 and Δ 2 are the power fluctuation of two motors, respectively, and P r a t e , 1 and P r a t e , 2 are the power response capability of two motors, respectively.
By combining Equations (22) and (24), the optimization problem is formulated as:
min J = 1 J η + J p = λ η m 2 + ( 1 λ ) η m 1 η m 1 η m 2 + Δ 1 P r a t e , 1 + Δ 2 P r a t e , 2 ,   Δ P r a t e 10 ,   Δ > P r a t e
(II)
Optimal power split strategy based on ANLPSO
To resolve the aforementioned optimization problem, the algorithm must have rapid convergence and excellent optimization performance. PSO is a straightforward, effective, and robust stochastic algorithm that mimics the social behavior of birds and fish to guide individuals to the optimal foraging location through information sharing and learning. It is appropriate for solving nonlinear optimization problems. However, the traditional PSO has a simple optimization mechanism and is prone to falling into local optima [34].
An ANLPSO is proposed to enhance the optimization performance of PSO by improving the initialization process, inertial weight updating formula, and learning mechanism [35]. The procedure for ANLPSO is as follows:
(1)
Adaptive initialization. To avoid local concentration, the initial position of particles is generated according to Equation (26). The position of each particle represents λ :
p i = p min + ( i 1 + r ) ( p max p min ) n
where p i is the position of the ith particle, n is the population size, p min and p max are lower and upper boundaries of λ , respectively, and r is a random number between 0 and 1.
(2)
Update inertia weight. At the beginning of the optimization process, a large inertia weight is assigned to accelerate convergence. In the final optimization phase, a small inertia weight is advantageous for enhancing solution quality. Hence, the inertia weight ξ is calculated using the nonlinear decline formula:
ξ = ξ max + ( k 1 k max 1 ) 0.5 ( ξ min ξ max )
where ξ min and ξ max are lower and upper boundaries of inertia weight, respectively, k and k max are the current and maximum iterations, respectively.
(3)
Update learning factors. Particles whose fitness value F i t i is lower than the average value can obtain larger c 1 and smaller c 2 to improve global search ability; otherwise, particles can obtain smaller c 1 and larger c 2 to enhance solution quality:
c 1 = c 1 , max ( c 1 , max c 1 , min ) ( F i t i F i t min ) F i t a v g F i t min , c 2 = c c 1   F i t i < F i t a v g c 1 = c 1 , min , c 2 = c c 1   F i t i F i t a v g
where c 1 and c 2 are individual and global learning factors, respectively, c 1 , min and c 1 , max are lower and upper boundaries of c 1 , respectively, and F i t min and F i t a v g are minimum and average fitness values, respectively.
(4)
Fitness value calculation. The fitness value is calculated based on the power split ratio that each particle position represents:
F i t = 1 1 J η + J p
(5)
Update pBesti and gBest. Each particle should choose the optimal individual value pBesti according to its own experience. Then the particle with the largest fitness value is chosen as the global optimal value gBest.
(6)
Update velocity and position. The velocity v i and position of the particles are updated as follows:
v i ( k + 1 ) = ξ v i ( k ) + c 1 r ( p B e s t i p i ( k ) ) + c 2 r ( g B e s t p i ( k ) ) p i ( k + 1 ) = p i ( k ) + v i ( k + 1 )
(7)
Stopping rule. Steps (2)–(6) are repeated until the optimal power split ratio is obtained.
(III)
Economic strategy design based on optimization freezing tolerance mechanism
During vehicle operation, the external environment and sensor precision influence the power demand and motor speed. Even if the vehicle maintains a constant speed, as depicted in Figure 7, the speed of the two motors will fluctuate. However, power demand and motor speed are important input parameters for the energy management problem. A change in any parameter will lead to a change in the power split ratio.
Therefore, to reduce the burden of MCU and save the computational cost of HCU, the freezing tolerance mechanism is introduced into the optimization process. When the input parameters do not exceed the specified tolerance constraints, the optimization will be frozen and the previous optimal power split ratio will be output directly, assuming that a small deviation between the frozen optimal results and the ideal value is allowed. The tolerance constraints for input parameters can be defined as:
P r e q , f P t o l e r a n c e P r e q P r e q , f + P t o l e r a n c e
ω m 1 , f ω t o l e r a n c e ω m 1 ω m 1 , f + ω t o l e r a n c e ω m 2 , f ω t o l e r a n c e ω m 2 ω m 2 , f + ω t o l e r a n c e
where P r e q , f , ω m 1 , f , and ω m 2 , f are the input parameters corresponding to the frozen optimal power split ratio, and P t o l e r a n c e and ω t o l e r a n c e are the tolerance constraints of power demand and motor speed, respectively.
To sum up, the economic energy management strategy is developed to achieve optimal power distribution for two motors, as shown in Figure 8.

4.2. Dynamic Energy Management Strategy Based on Pre-Shifting Recognition and Gradient Torque Recovery

(1)
Pre-shifting recognition mechanism
The pre-shifting recognition mechanism is devised based on the shifting strategy. By setting the offset to the shifting velocity to predict shifting time, the front-axle torque is transferred to the rear axle before shifting to reduce vehicle impact and power loss.
As for the shifting curve under different gears, the higher the gear is while maintaining the same throttle opening, the bigger the shifting velocity will be. However, the torque demand decreases as velocity increases, so the pre-shifting velocity offset decreases as gear increases.
As for the shifting curve in the same gear, the shifting velocity between different throttle openings is very close, and the torque demand is relatively low when the throttle opening is small. Therefore, the pre-shifting schedule is designed using the fixed velocity offset. In the case of medium and large throttle openings, there is a large difference in shifting velocity between different throttle openings, and the torque demand corresponding to the throttle opening is large. Therefore, the velocity offset is calculated according to torque demand and rear motor response capacity. The torque demand T r e q is calculated based on the velocity and acceleration pedal as follows:
T r e q = f ( v ,   A c c )
Assume that the velocity and acceleration pedal do not change during the pre-shifting and torque coordination control processes and that the actual gear shifting occurs rapidly. The longitudinal acceleration can be calculated as:
a = T r e q m r w g C r C d A v 2 21.15 m
The required time for rear motor torque compensation is calculated as:
t o f f s e t = min ( T r e q i f r , T m 2 , max ) T m 2 , r a t e
The pre-shifting velocity offset should be set as follows:
V o f f s e t = 3.6 a t o f f s e t
In summary, the designed pre-shifting recognition schedule is shown in Figure 9.
(2)
Gradient torque recovery strategy
The gradient torque recovery strategy aims to recover the front-axle torque smoothly after shifting and reduce vehicle impact. This paper disregards the impact of rear-axle torque change because it is balanced by front-axle torque change. The jerk is adopted to assess vehicle impact, which is formulated as:
j = i g η g δ m r d T m 1 d t
The above formula can be rewritten after discretization as follows:
T m 1 ( k + 1 ) T m 1 ( k ) = j δ m r i g η g Δ t
where T m 1 ( k ) is the current front motor torque, T m 1 ( k + 1 ) is the torque after torque recovery at the next moment, and Δ t is the time interval of torque command. According to the above formula, under the same impact constraint condition, the torque recovery rate should be set according to different gears to ensure that the torque recovery time is as short as possible without compromising comfort.
In previous literature [36], the comfortable impact limit of humans is 10 m/s3, and the update time of motor torque command is set at 10 ms. The torque recovery command of the front motor can be calculated as follows:
T m 1 ( k + 1 ) = T m 1 ( k ) + 7   ( i = 2 ) T m 1 ( k ) + 12   ( i = 3 ) T m 1 ( k ) + 15   ( i = 4 ) T m 1 ( k ) + 19   ( i = 5 ) T m 1 ( k ) + 26   ( i = 6 )
As for the rear motor, the torque recovery command is designed based on its motor response capacity as follows:
T m 2 ( k + 1 ) = T m 2 ( k ) 4

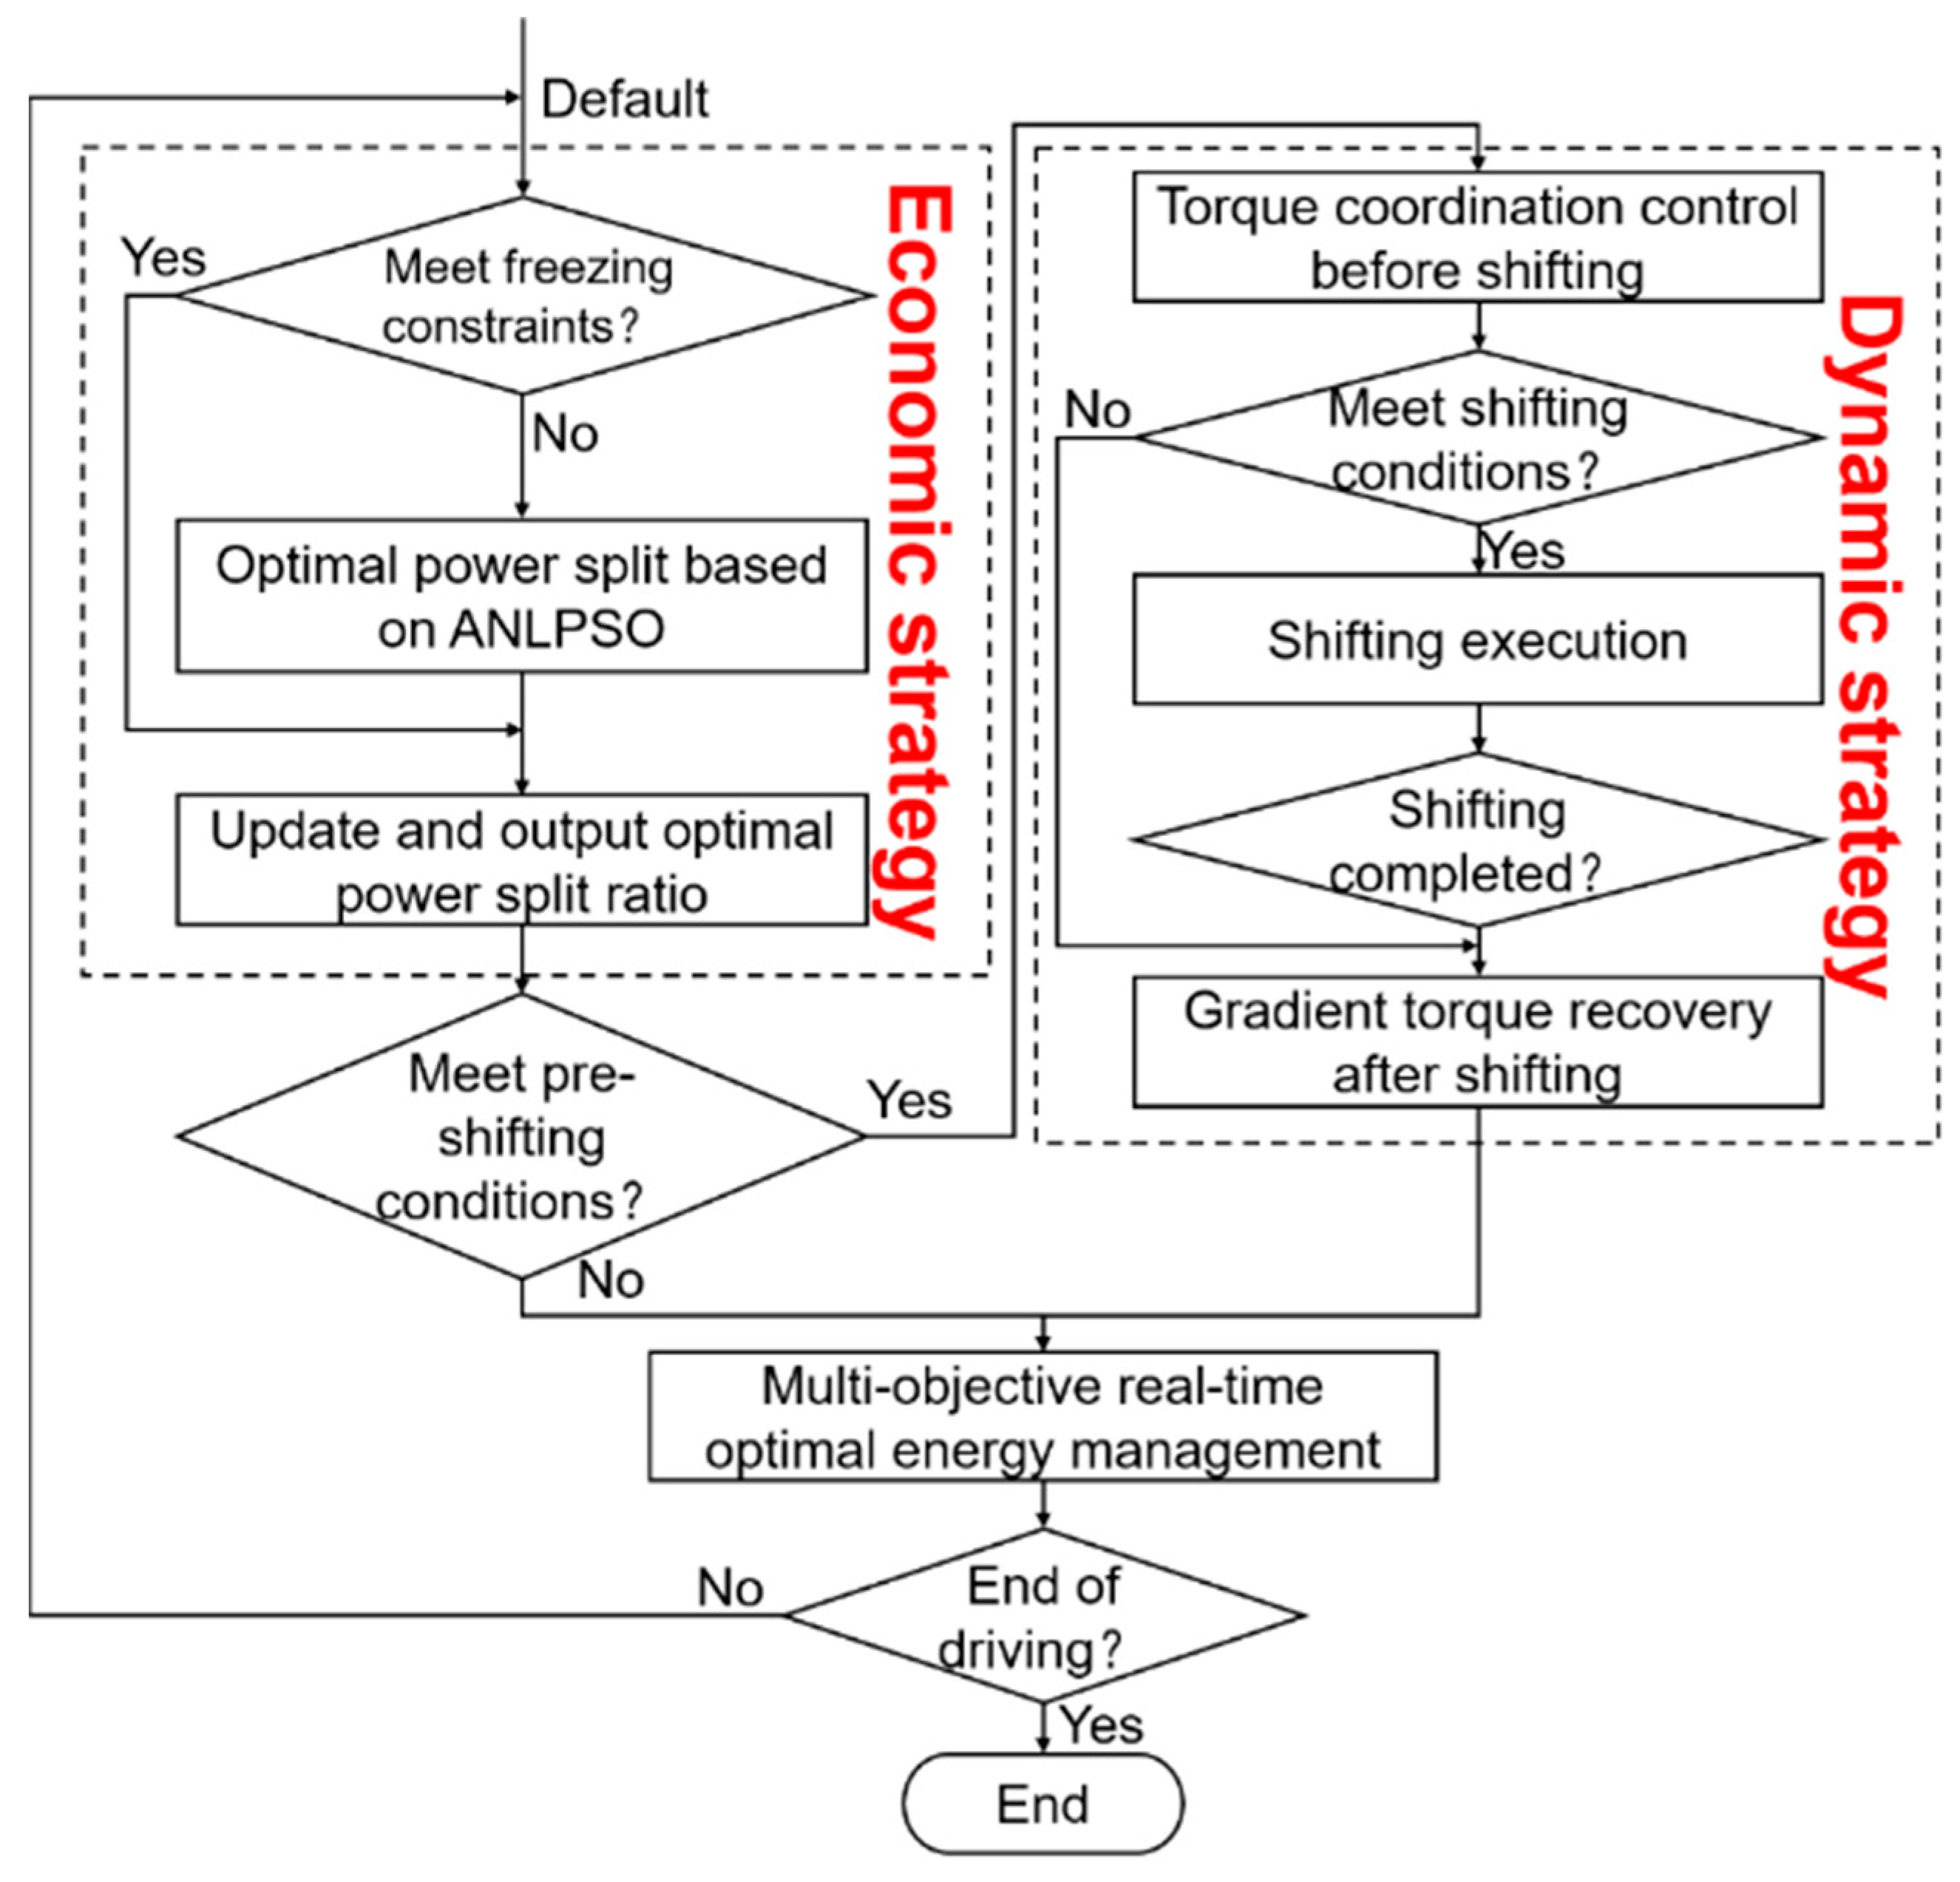
4.3. Smooth Switching Logic between Two Strategies

After the development of economic and dynamic strategies, this section formulates the smooth switching process between the two strategies to accomplish real-time optimal energy management and seamless torque transition before and after shifting, as illustrated in Figure 10. The precise procedure is as follows:
(1)
The default strategy is the economic strategy. The strategy determines whether optimization should be frozen based on speed and power demand. If freezing conditions are not met, the ANLPSO is performed to solve the power split ratio. Otherwise, the optimal power split ratio of the last optimization is output directly.
(2)
If the conditions for pre-shifting are met, the dynamic strategy is implemented to gradually transfer the torque from the front motor to the rear motor. The strategy then proceeds to Step 3. Otherwise, the output power of two motors is determined by the optimal power split ratio in Step 1.
(3)
Determine whether the conditions for shifting are met. If the conditions are satisfied, shifting will occur. Then, according to the torque recovery gradient strategy, the torque of two motors is recovered based on the optimal power split ratio after shifting. If not, the torque of the two motors will be recovered to its initial value before shifting.
(4)
Determine if the driving cycle is over. If not, repeat Steps 1–3.

5. Simulation and Discussion

To verify the control effect of the proposed strategy, simulations of the standard driving cycle and full load acceleration are conducted to evaluate energy efficiency and dynamic performance during gear shifting.

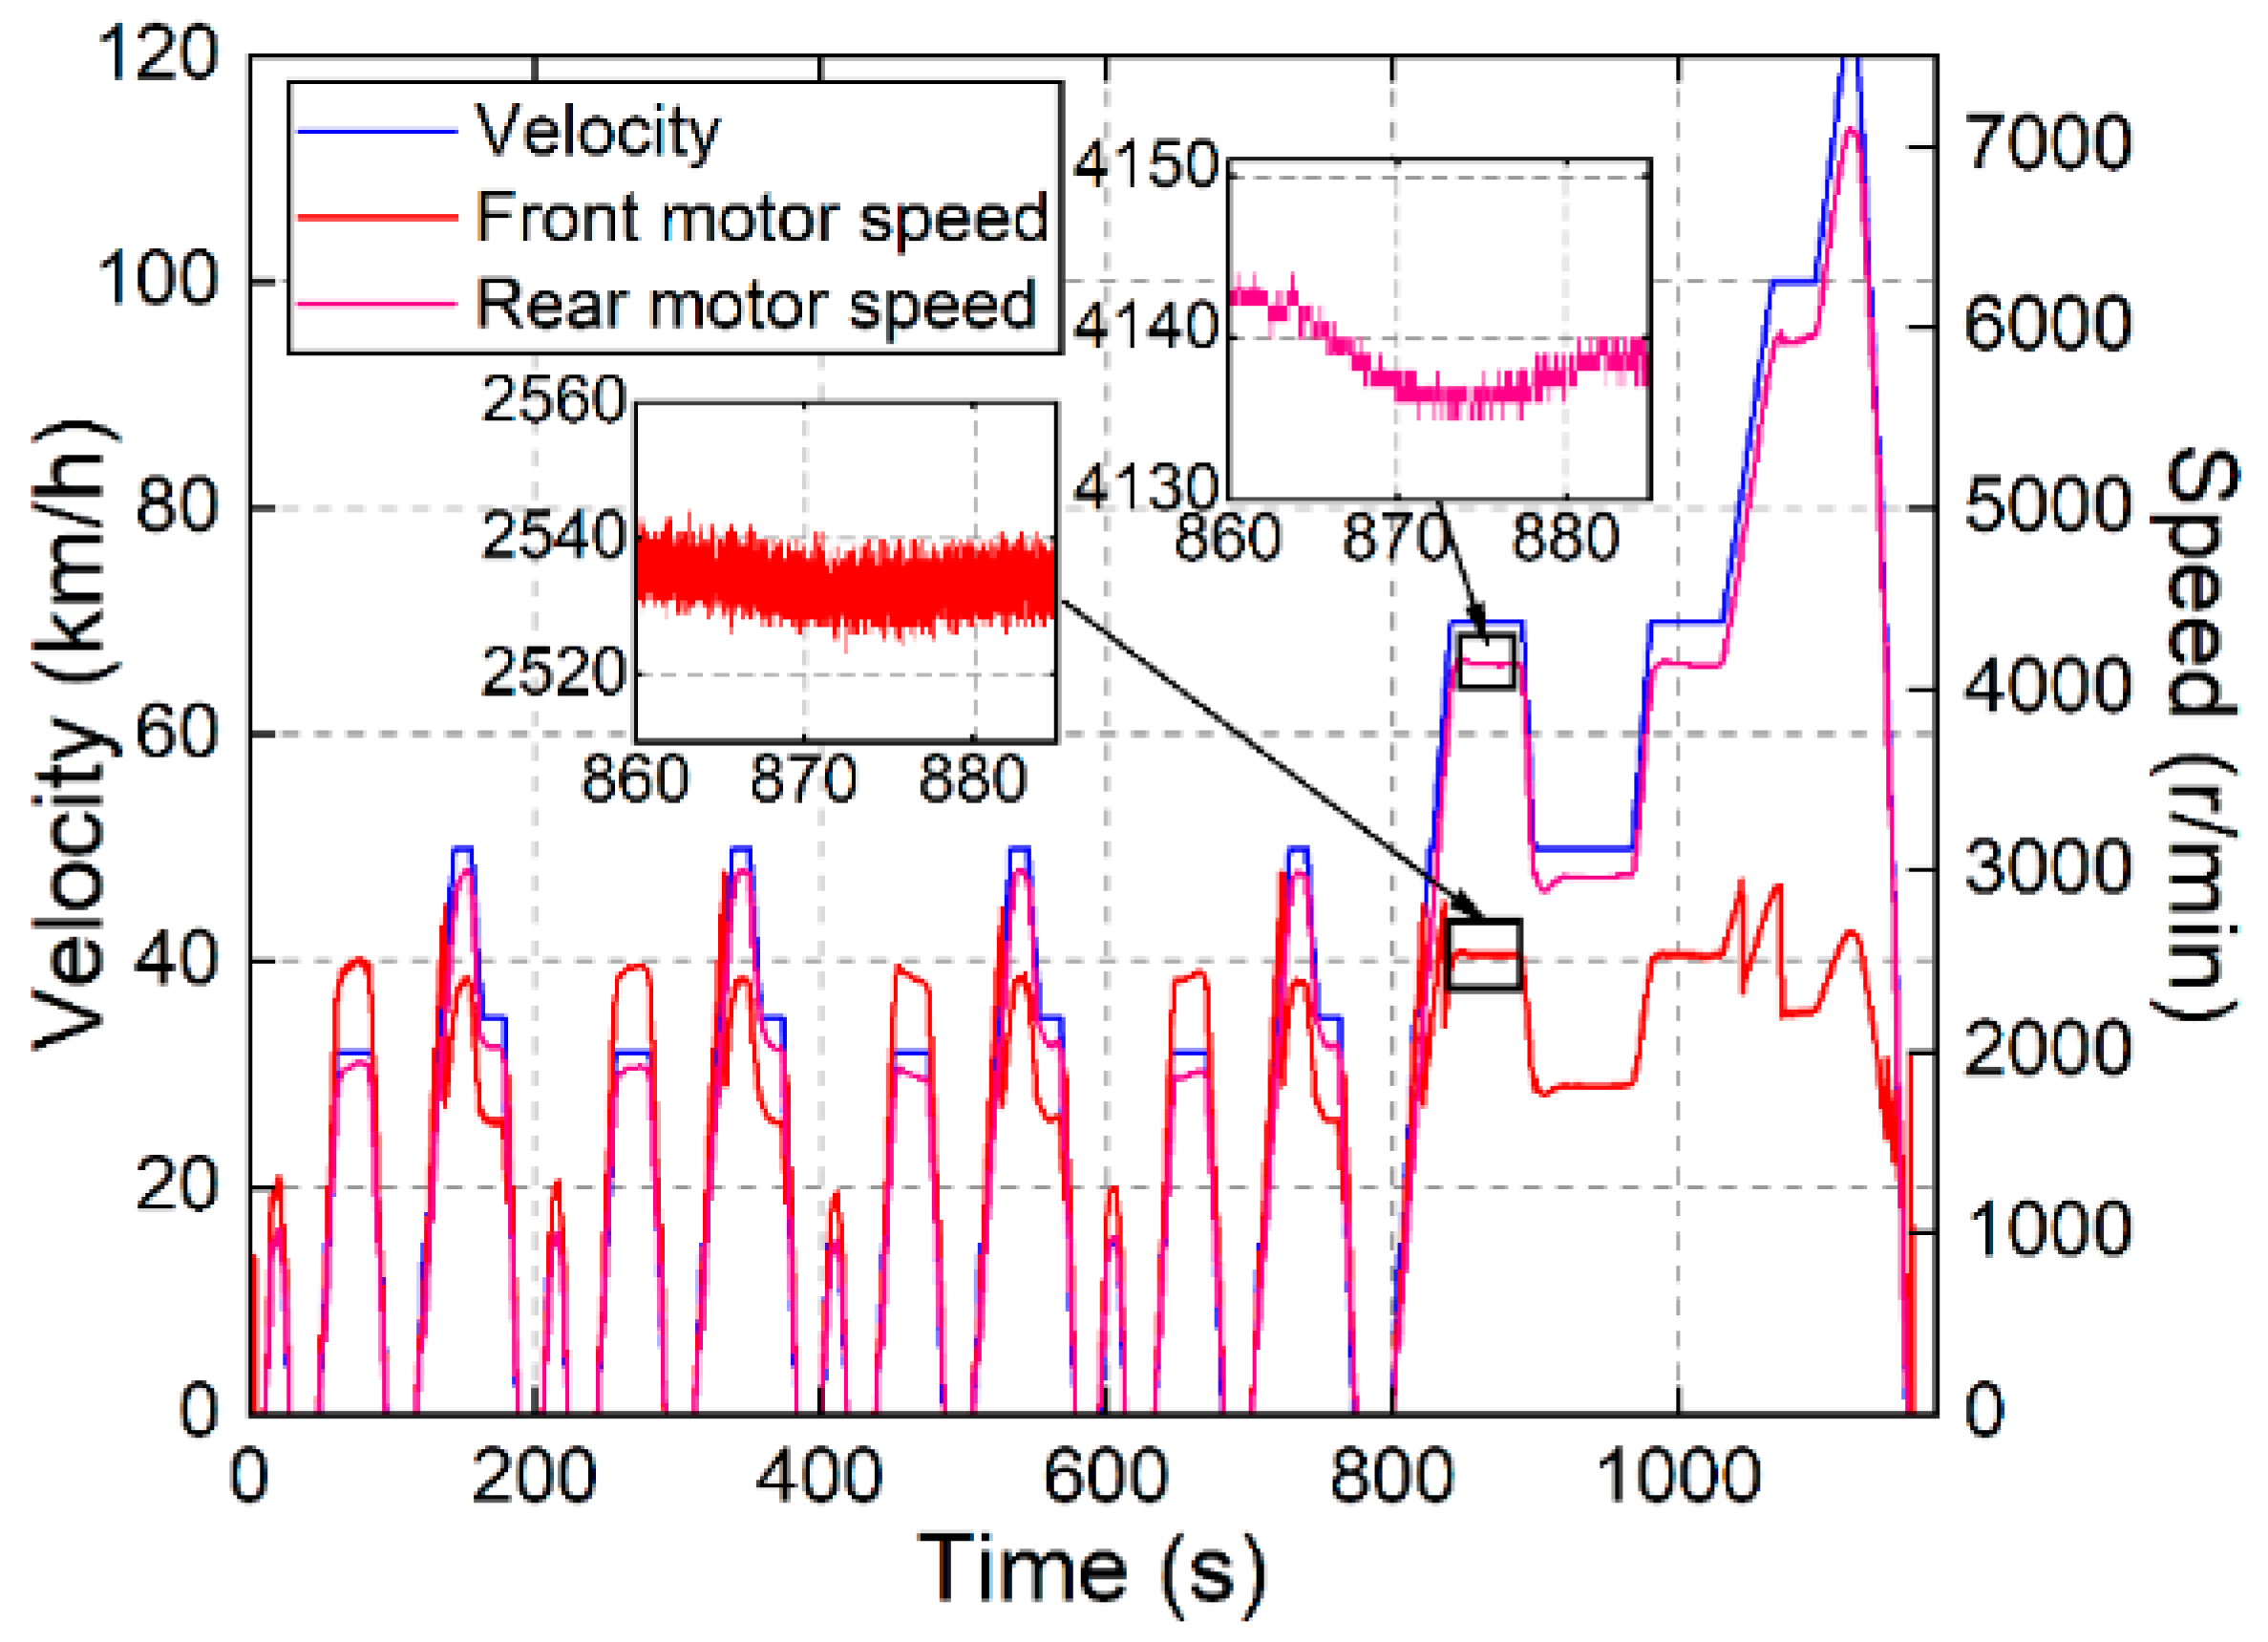
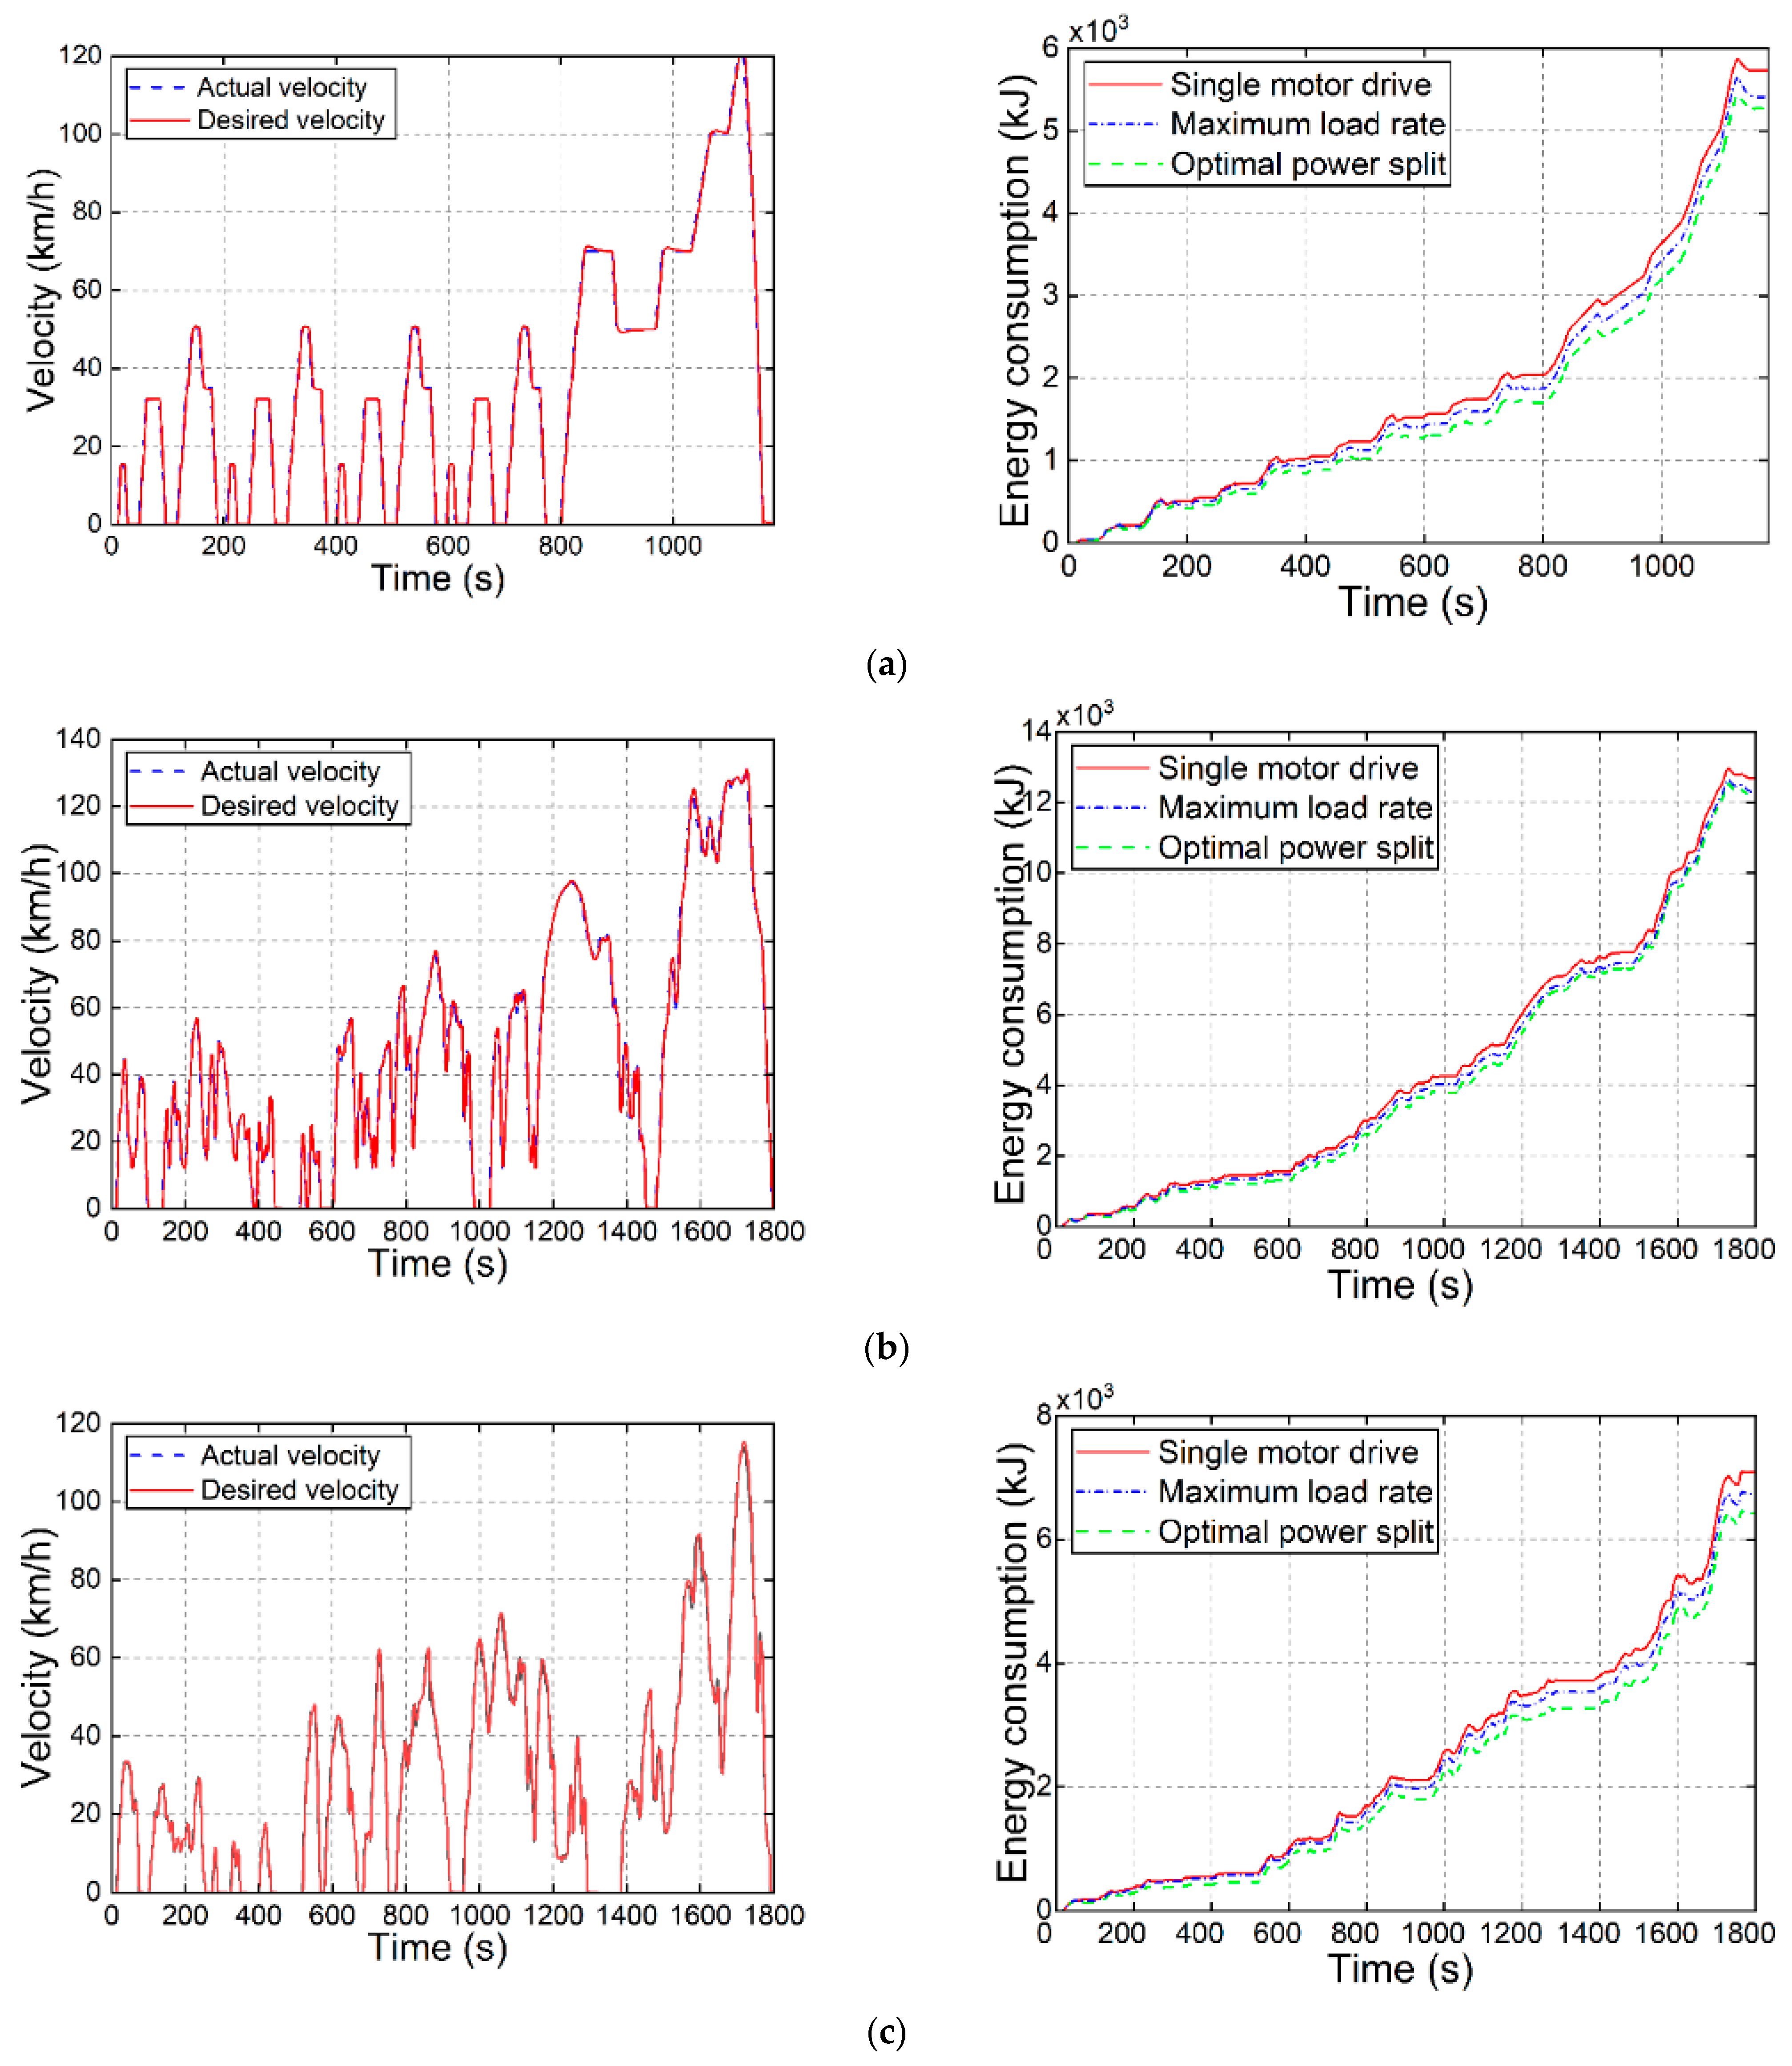
5.1. Simulation Results of Economic Energy Management Strategy

In this section, the power split and battery energy consumption results of the single-motor drive strategy, the maximum load rate strategy, the optimal power split strategy without tolerance mechanism, and the optimal power split strategy with tolerance mechanism are compared to exhibit the merits of the proposed strategy in improving energy efficiency and the actual motor response effect. The initial battery SOC is set at 80%, and the simulation step size is set at 0.01 s to ensure accuracy. For analysis, the NEDC, WLTC, and CLTC driving cycles are utilized.
Figure 11 and Table 2 illustrate the simulation results of different tolerance constraints under NEDC. As for the strategy without the freezing tolerance mechanism, the power split ratio is optimized at all times, resulting in the lowest energy consumption per 100 km, which is 13.26 kWh. However, the power split ratio fluctuation is large, and the actual motor torque cannot respond in real-time to the optimal torque command, resulting in a lengthy computation time of 804.77 s. As the tolerance constraints increase, the energy consumption rises, but the computation time decreases significantly. In addition, the power split ratio fluctuation is significantly reduced, and the motor can respond in real-time to the optimal torque command. In conclusion, the 1% tolerance with the greatest overall performance is chosen.
As shown in Figure 12 and Table 3, the energy consumption of the single-motor drive strategy under NEDC, WLTC, and CLTC is relatively high at 14.44 kWh/100 km, 15.18 kWh/100 km, and 13.59 kWh/100 km, respectively, due to the relatively low energy efficiency of the powertrain under low-speed and low-torque conditions. Regarding the maximum load rate strategy, the motor with a higher load rate is selected to drive based on power demand, thereby improving the overall energy efficiency of the powertrain. Compared with the single-motor drive strategy, the computation time marginally increases, but the energy consumption is decreased by 5.61%, 3.1%, and 7.06% under three driving cycles, respectively. Nonetheless, the proposed strategy can optimize the power split ratio in real-time and actualize the high-efficiency operation of the dual-motor powertrain, resulting in a significant improvement in energy efficiency. Consequently, the energy consumption in three driving cycles has been significantly reduced by 8.1%, 4.02%, and 9.49%, respectively. Even though the computation time of this strategy increases, the freezing mechanism can ensure that the torque command can be responded to in real-time.
In conclusion, the economic strategy based on ANLPSO and the optimization freezing tolerance mechanism can realize optimal real-time energy management and the dual-motor powertrain’s high-efficiency operation.

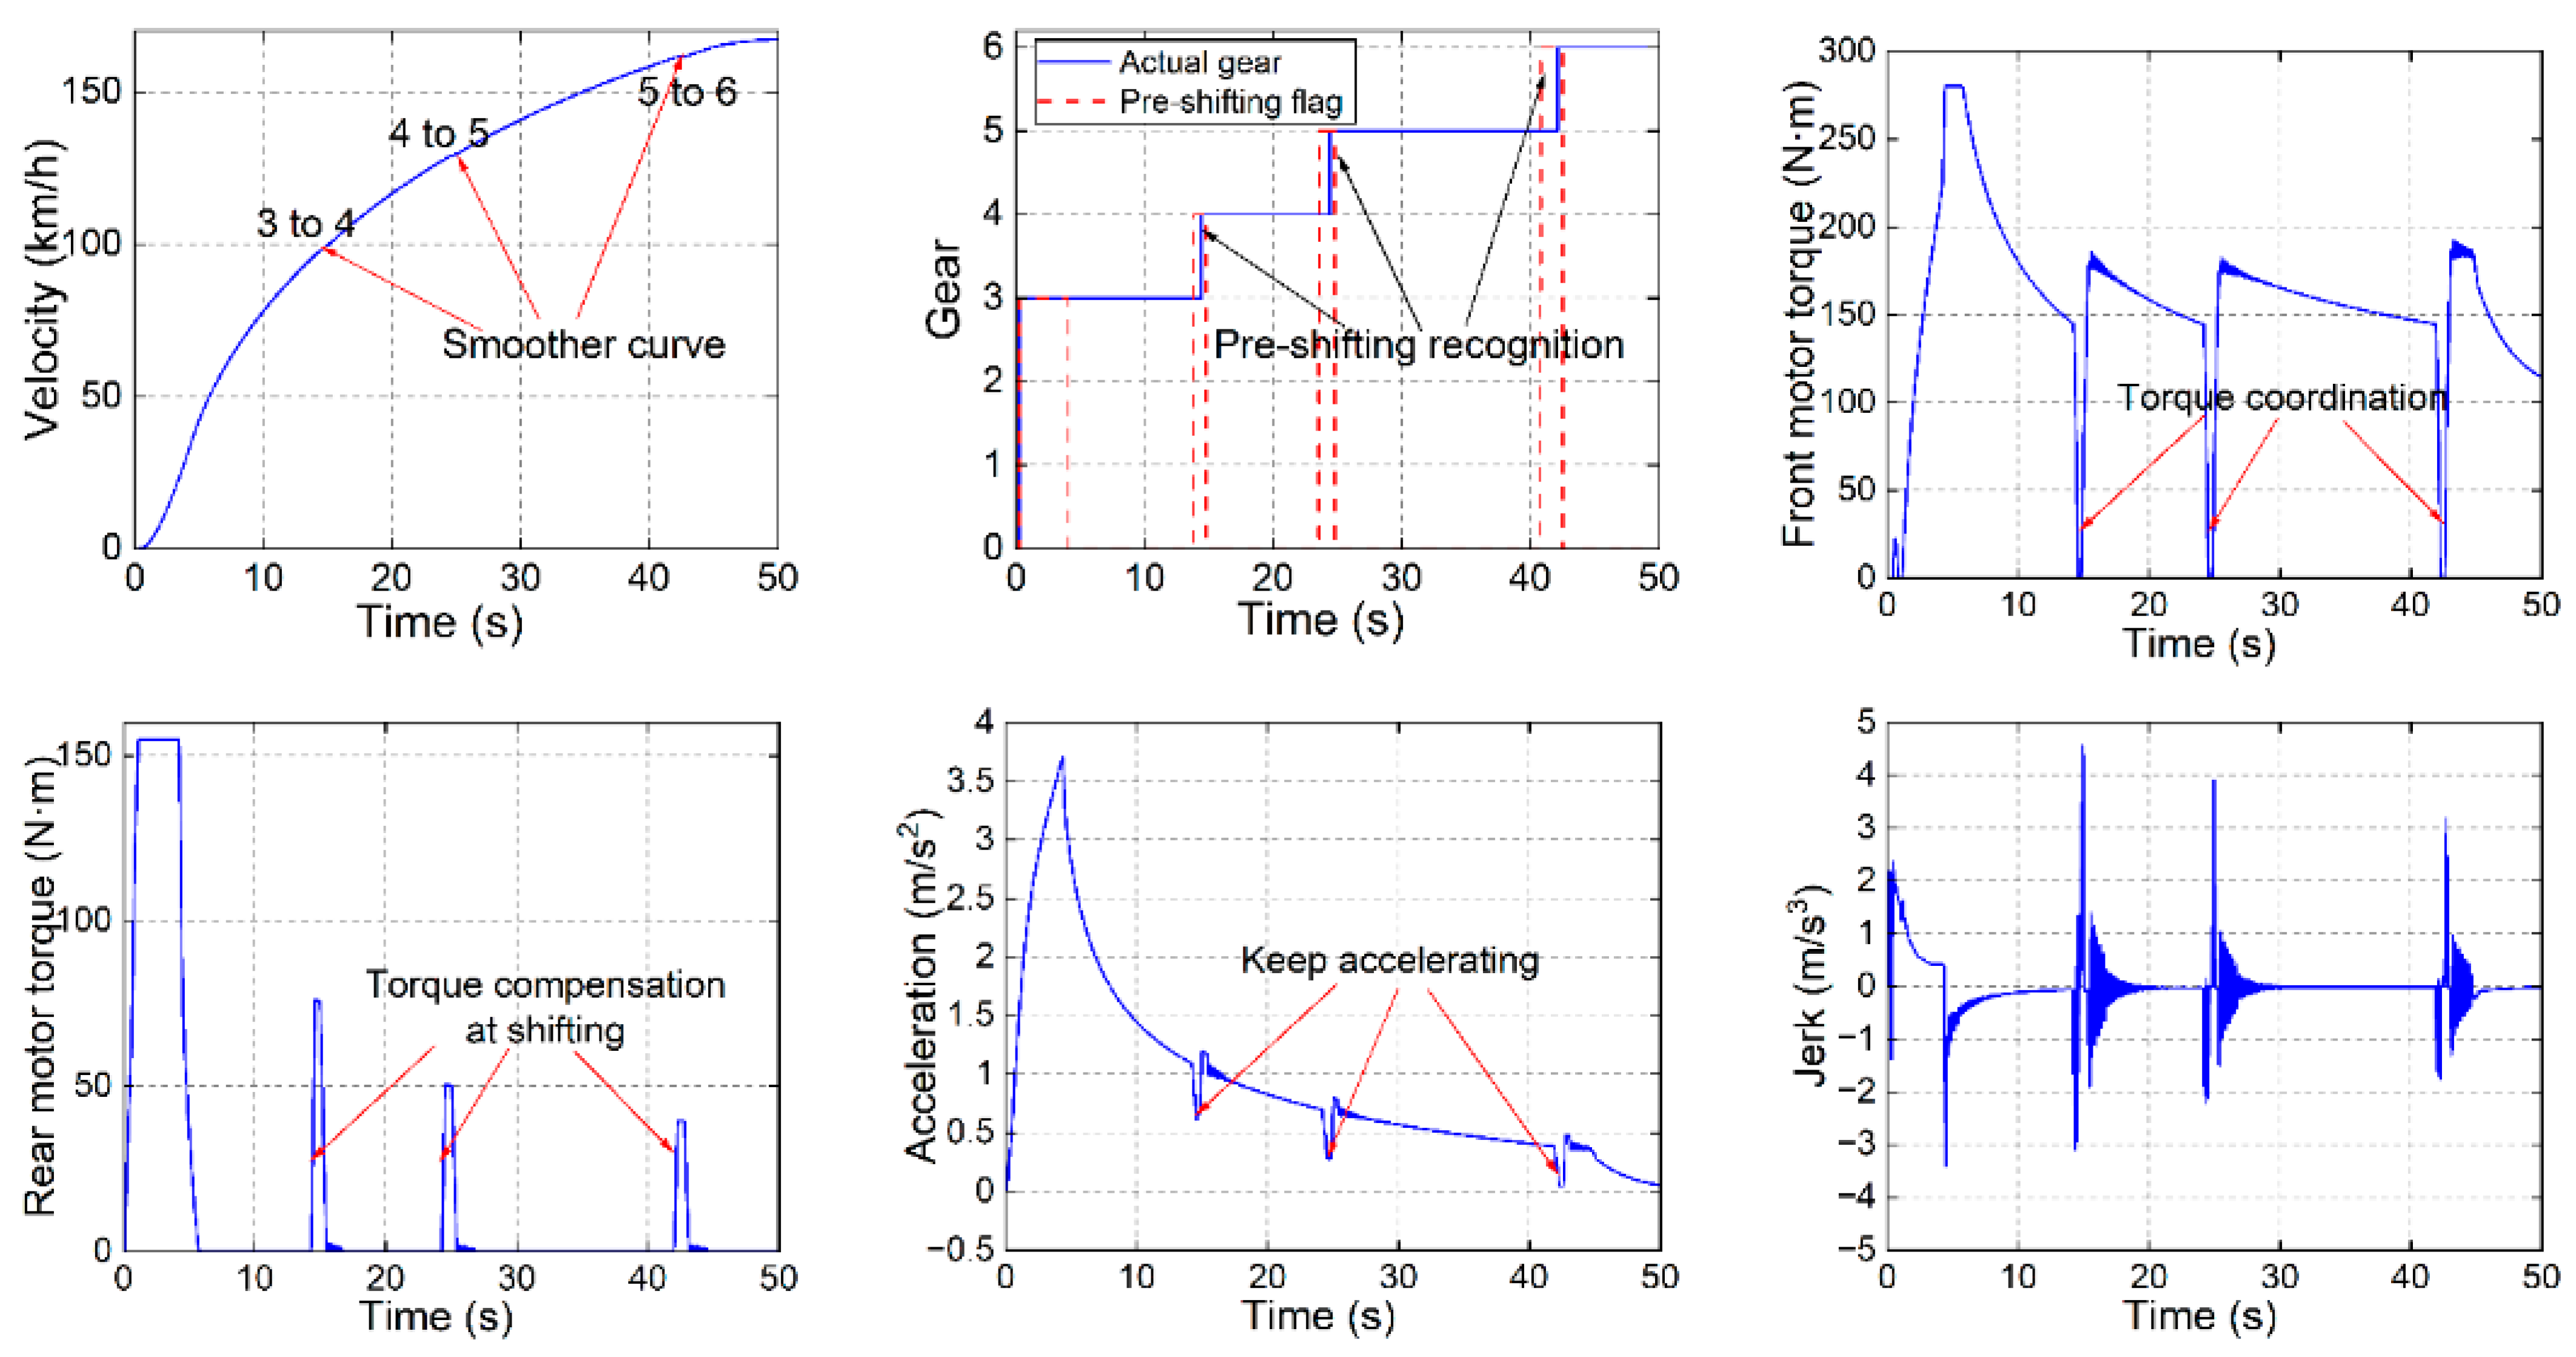
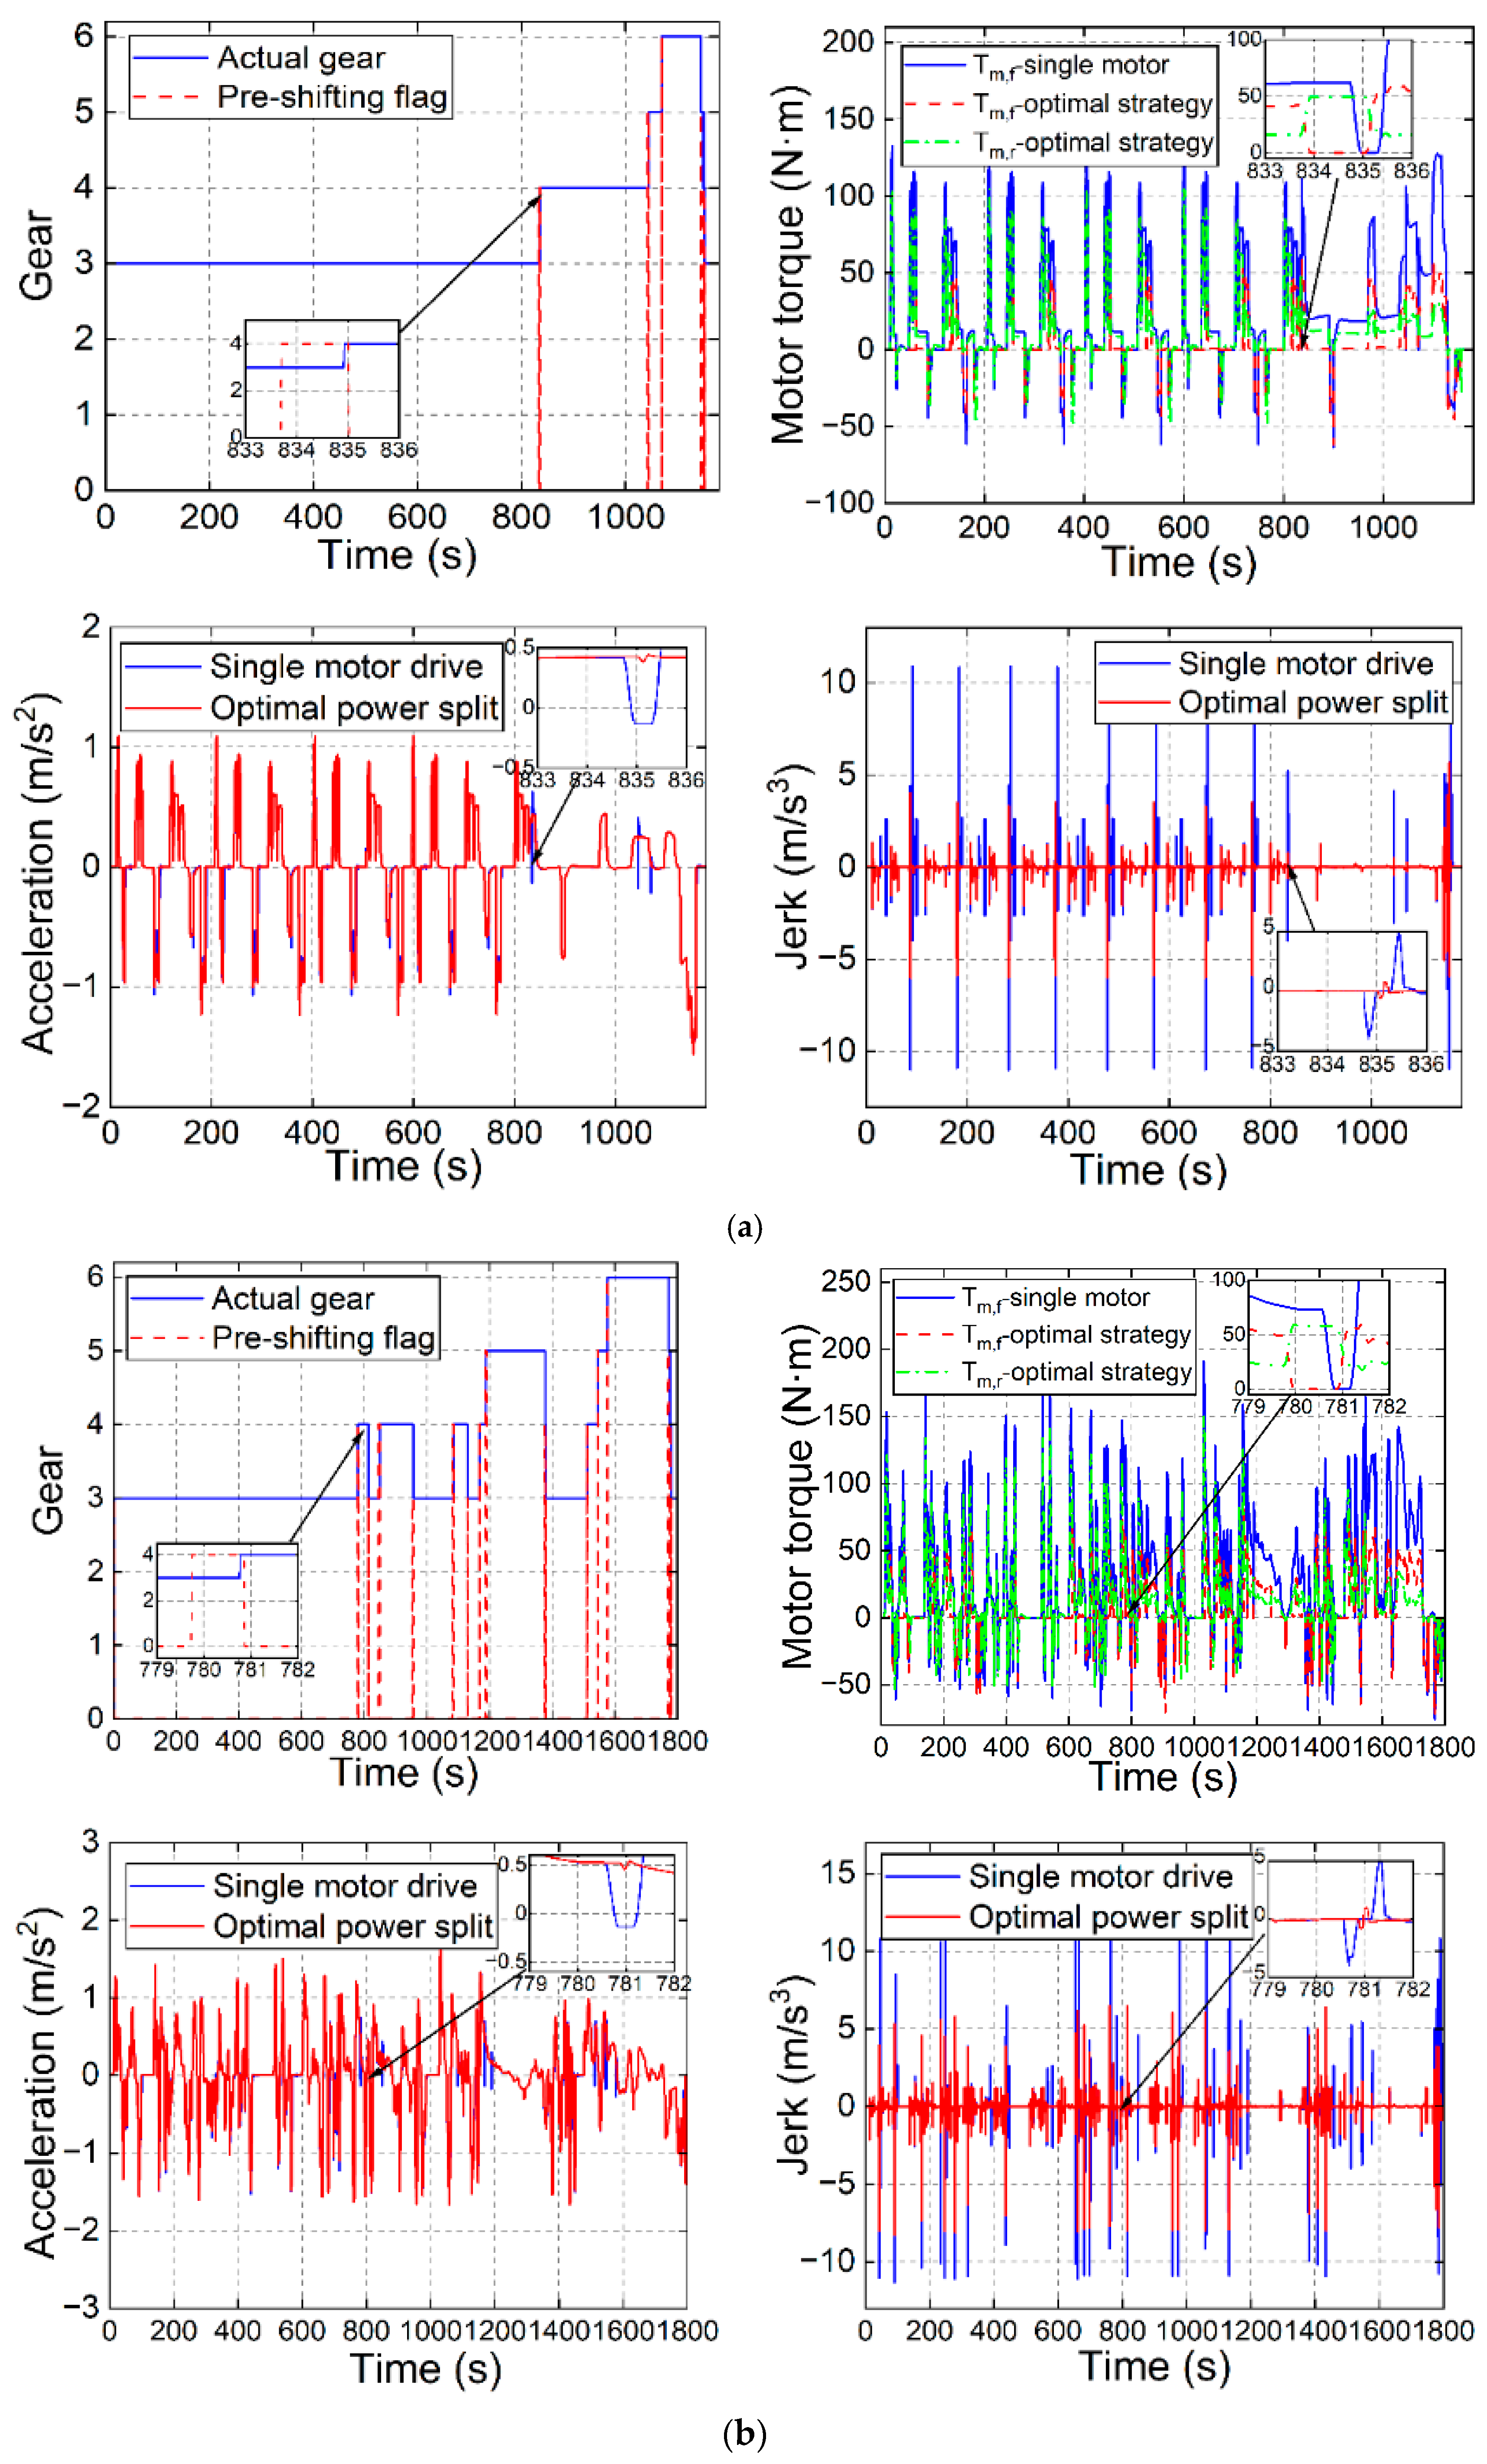
5.2. Simulation Results of Dynamic Energy Management Strategy

In this section, a simulation of full load acceleration is performed to validate the torque coordination control effect of the dynamic strategy in continuous gear shifting conditions. To highlight the efficacy of the proposed strategy in improving dynamic and comfort performances, comparative simulation results are analyzed.
Figure 13 depicts the velocity, gear, torque change, longitudinal acceleration, and jerk simulation results of full load acceleration without the dynamic strategy. Under full throttle pedal opening conditions, the vehicle accelerates to its maximum velocity, and the transmission shifts gear when the shifting condition is met. The average time for gear shifting is about 1.3 s. As the input torque of the transmission must be zero before shifting, the front motor’s torque is unloaded and the vehicle loses power, resulting in a velocity drop during shifting, thereby diminishing the vehicle’s dynamic performance. When shifting is complete, the front motor’s torque is directly recovered to its target value, resulting in a significant increase in vehicle impact. The maximum jerk reaches 13.03 m/s3, 9.9 m/s3, and 7.86 m/s3 in the shifting processes of 3 to 4, 4 to 5, and 5 to 6, respectively, which negatively impacts the comfort performance.
Figure 14 illustrates the simulation results of full load acceleration with the dynamic strategy. The pre-shifting recognition mechanism can reliably predict the actual gear shifting time and transfer torque gradually from the front motor to the rear motor before gear shifting. Due to the torque compensation of the rear motor, the powertrain retains a certain amount of output torque when shifting, allowing the vehicle to continue accelerating at a small acceleration. The velocity trajectory is therefore relatively smooth. When shifting is complete, the torque of the rear motor is transferred progressively to the front motor. The front motor’s torque is smoothly recovered to its target value based on the torque gradient of the respective gear. The vehicle impact during shifting is significantly reduced. The maximum jerk is reduced to 4.57 m/s3, 3.92 m/s3, and 3.18 m/s3 in the shifting processes of 3 to 4, 4 to 5, and 5 to 6, respectively, which are all within the acceptable impact limit for humans.
The evaluation index results without and with the dynamic strategy are displayed in Table 4. The longitudinal acceleration and jerk of the proposed strategy are substantially superior to those of the original strategy, which improves the vehicle’s dynamic performance and reduces its impact. In summary, the dynamic strategy can considerably enhance the dynamic performance and ride comfort of the vehicle.

6. Actual Vehicle Experiment

To further validate the effectiveness of the multi-objective real-time strategy in energy efficiency optimization and torque coordination, actual vehicle experiments of energy consumption under NEDC and WLTC are conducted on a four-wheel drum bench.

6.1. Experimental Process Introduction

As shown in Figure 15, the four-wheel drum bench primarily consists of a chassis dynamometer, circulating fan, environmental bin, and fixed device. The chassis dynamometer simulates road driving resistance through the drum, and the circulating fan simulates road conditions. The experiment procedures refer to GB/T 18352.6-2016, GB/T 19753-2013, and GB/T 19753-2021 in China. During the experiment, the vehicle is attached to the drum bench, and a power analyzer is used to measure and calculate the vehicle’s energy consumption. The vehicle has been powered up at high voltage. The initial battery SOC is 80%, and the shifting lever is in forward gear. The experiment environment setting is displayed in Table 5. The setting of pressure, ambient temperature, and relative humidity strictly refers to GB/T 18352.6-2016 in China. The drag coefficients are obtained through a coast-down test based on GB/T 12536-2017. And the driving resistance of the dynamometer can be described as follows:
F = A + B v + C v 2
where F denotes the driving resistance, A, B, and C denote the drag coefficient, and v denotes the velocity.

6.2. Experimental Results Analysis

Figure 16 and Table 6 display the experimental results for pure electric energy consumption under NEDC and WLTC. Under the single-motor drive strategy, the load rate of the front motor is relatively low when the demand torque is low, resulting in an increase in driving energy loss. The battery energy consumption is 5815.64 kJ and 12,831.33 kJ, and the energy consumption per 100 km is 14.65 kWh and 15.36 kWh under NEDC and WLTC, respectively. However, the proposed strategy can realize the real-time optimal power distribution of two motors based on driving demand, and its battery SOC is always greater than that of the single-motor strategy. The battery energy consumption is 5305.51 kJ and 12,196.84 kJ, and the energy consumption per 100 km is 13.37 kWh and 14.61 kWh, respectively. Compared with the single-motor drive strategy, the energy consumption is reduced by 8.74% and 4.88%, respectively.
Figure 17 illustrates the comparative results of the torque coordination effect for different strategies under NEDC and WLTC. Under the two strategies, the transmission can shift gear based on the shifting schedule as the velocity changes. Regarding the single-motor drive strategy, the vehicle loses its power, and the vehicle’s impact soars due to the torque unloading of the front motor during shifting. After shifting, the front motor immediately restores its target torque, resulting in a sharp increase in vehicle impact. The maximum jerk reaches 10.87 m/s3 and 11.3 m/s3 under NEDC and WLTC, respectively, which seriously affects the driving quality. As depicted in the zoomed-in areas of Figure 17a,b, the pre-shifting recognition mechanism proposed can accurately predict the shift time. Compared with the single-motor drive strategy, this strategy can transmit the torque of the front motor to the rear motor in advance. Even though the acceleration fluctuates during the shifting process, the vehicle is still able to accelerate with sufficient power, and the influence caused by the torque change of the front motor has been significantly reduced. The maximum jerk is reduced to 5.99 m/s3 and 8.29 m/s3, which are all within the comfort limit of humans.

7. Conclusions

In this study, a multi-objective real-time optimal energy management strategy considering energy efficiency and flexible torque response for a dual-motor four-drive powertrain was proposed. The specific work can be summarized as follows:
(1)
The quantitative analysis of energy loss and theoretical operation characteristics analysis of different powertrains indicate that the dual-motor four-drive powertrain has significant energy-saving advantages over the single-motor powertrain in terms of configuration.
(2)
From the perspective of improving energy efficiency, an economic strategy based on ANLPSO and the freezing tolerance mechanism was designed to achieve optimal power distribution of two motors and reduce the frequent fluctuation of power split ratio. To realize flexible torque response, a dynamic strategy based on the pre-shifting recognition mechanism and gradient torque recovery strategy was proposed. Besides, smooth switching logic was created to guarantee a seamless transition between the two strategies.
(3)
Simulation results of the standard driving cycle indicate that the setting of a 1% freezing tolerance constraint can greatly reduce the fluctuation of power split ratio and computation time, with a slight sacrifice in energy efficiency. Compared with the single-motor drive strategy and maximum load rate strategy, the proposed strategy can reduce energy consumption by 8.1% and 2.49%, 4.02% and 0.92%, and 9.49% and 2.43% under NEDC, WLTC, and CLTC, respectively.
(4)
Simulation results of the full load acceleration demonstrate that compared with the original strategy, the proposed strategy can improve the longitudinal acceleration from −0.21 m/s2 to 0.65 m/s2, from −0.29 m/s2 to 0.28 m/s2, and from −0.4 m/s2 to 0.04 m/s2, and the maximum jerk can be reduced from 13.03 m/s3 to 4.57 m/s3, from 9.9 m/s3 to 3.92 m/s3, and from 7.86 m/s3 to 3.18 m/s3, in the shifting processes of 3 to 4, 4 to 5, and 5 to 6, respectively, thereby enhancing the vehicle’s dynamic performance and ride comfort.
(5)
The experimental results confirm that compared with the single-motor drive strategy, the multi-objective real-time optimal strategy can effectively improve energy efficiency by 8.74% and 4.88% under NEDC and WLTC, respectively, as well as provide excellent dynamic performance and comfort.
(6)
In the future, with the rapid development of V2I and V2V, long-term prediction of the driving cycle and traffic environment will be possible. Thus, a more intelligent energy management framework considering velocity planning and optimal shifting will be the focus of our research work.

Author Contributions

Conceptualization, Investigation, Formal analysis, S.T.; Methodology, Software, Data Curation, Original draft preparation, Q.Z. All authors have read and agreed to the published version of the manuscript.

Funding

This research received no external funding.

Data Availability Statement

Data is available on request due to restrictions.

Acknowledgments

The authors wish to appreciate the Chinese government for its support through the 111 Project (B17034) and Innovative Research Team Development Program of the Ministry of Education of China (IRT_17R83).

Conflicts of Interest

The authors declare no conflict of interest.

Nomenclature

SOCstate of charge
DPdynamic programming
MPCmodel predictive control
PSOparticle swarm optimization
HCUhybrid control unit
PIDproportion integration differentiation

References

  1. Rayavarapu, S.S.; Rajasekar, N. Energy management techniques and topologies suitable for hybrid energy storage system powered electric vehicles: An overview. Int. Trans. Electr. Energy Syst. 2021, 31, e12819. [Google Scholar]
  2. Tran, D.-D.; Vafaeipour, M.; El Baghdadi, M.; Barrero, R.; Van Mierlo, J.; Hegazy, O. Thorough state-of-the-art analysis of electric and hybrid vehicle powertrains: Topologies and integrated energy management strategies. Renew. Sustain. Energy Rev. 2020, 119, 109596. [Google Scholar] [CrossRef]
  3. Zhao, F.; Liu, X.; Zhang, H.; Liu, Z. Automobile Industry under China’s Carbon Peaking and Carbon Neutrality Goals: Challenges, Opportunities, and Coping Strategies. J. Adv. Transp. 2022, 2022, 5834707. [Google Scholar] [CrossRef]
  4. Sheldon, T.L.; Deshazo, J.R.; Carson, R.T. Electric and Plug-in Hybrid Vehicle Demand: Lessons for an Emerging Market. Econ. Inq. 2017, 55, 695–713. [Google Scholar] [CrossRef]
  5. Zhang, S.; Xiong, R.; Zhang, C.; Sun, F. An optimal structure selection and parameter design approach for a dual-motor-driven system used in an electric bus. Energy 2016, 96, 437–448. [Google Scholar] [CrossRef]
  6. Tian, Y.; Zhang, Y.H.; Li, H.M.; Gao, J.W.; Swen, A.; Wen, G.L. Optimal sizing and energy management of a novel dual-motor powertrain for electric vehicles. Energy 2023, 275,, 127315. [Google Scholar] [CrossRef]
  7. Zhang, F.; Hu, X.; Langari, R.; Wang, L.; Cui, Y.; Pang, H. Adaptive energy management in automated hybrid electric vehicles with flexible torque request. Energy 2021, 214, 118873. [Google Scholar] [CrossRef]
  8. Tie, S.F.; Tan, C.W. A review of energy sources and energy management system in electric vehicles. Renew. Sustain. Energy Rev. 2013, 20, 82–102. [Google Scholar] [CrossRef]
  9. Wang, Z.Z.; Zhou, J.; Rizzoni, G. A review of architectures and control strategies of dual-motor coupling powertrain systems for battery electric vehicles. Renew. Sustain. Energy Rev. 2022, 162, 112455. [Google Scholar] [CrossRef]
  10. Wisdom, E.; Chris, B. Modeling, and control of hybrid electric vehicles (A comprehensive review). Renew. Sustain. Energy Rev. 2017, 74, 1433–1442. [Google Scholar]
  11. Hao, J.N.; Ruan, S.M.; Wang, W. Model Predictive Control Based Energy Management Strategy of Series Hybrid Electric Vehicles Considering Driving Pattern Recognition. Electronics 2023, 12, 1418. [Google Scholar] [CrossRef]
  12. Ruan, J.G.; Song, Q. A Novel Dual-Motor Two-Speed Direct Drive Battery Electric Vehicle Drivetrain. IEEE Access 2019, 7, 54330–54342. [Google Scholar] [CrossRef]
  13. Hu, J.; Zheng, L.; Jia, M.; Zhang, Y.; Pang, T. Optimization and Model Validation of Operation Control Strategies for a Novel Dual-Motor Coupling-Propulsion Pure Electric Vehicle. Energies 2018, 11, 754. [Google Scholar] [CrossRef] [Green Version]
  14. Vinoth, K.B.; Avirajama, P. Dual Motor Power Management Strategy for Plug-in Hybrid Electric Vehicle. In Proceedings of the International Conference on Power Electronics and Renewable Energy Systems, Tamilnadu, India, 21–29 April 2021; Volume 795, pp. 491–498. [Google Scholar]
  15. Hou, X.Y. Research on Control Strategy of Dual Motor Driving System Based on Driving Cycle Recognition. Master’s Thesis, Wuhan University of Technology, Wuhan, China, 2019. [Google Scholar]
  16. Duan, B.M.; Wang, Q.N.; Wang, J.N.; Li, X.N.; Ba, T. Calibration efficiency improvement of rule-based energy management system for a plug-in hybrid electric vehicle. Int. J. Automot. Technol. 2017, 18, 335–344. [Google Scholar] [CrossRef]
  17. Zhang, S.; Xiong, R. Adaptive energy management of a plug-in hybrid electric vehicle based on driving pattern recognition and dynamic programming. Appl. Energy 2015, 155, 68–78. [Google Scholar] [CrossRef]
  18. Lim, H.; Su, W. Hierarchical Energy Management for Power-Split Plug-In HEVs Using Distance-Based Optimized Speed and SOC Profiles. IEEE Trans. Veh. Technol. 2018, 67, 9312–9323. [Google Scholar] [CrossRef]
  19. Zhang, S.; Zhang, C.N.; Han, G.W.; Wang, Q.H. Optimal Control Strategy Design Based on Dynamic Programming for a Dual-Motor Coupling-Propulsion System. Sci. World J. 2014, 2014, 958329. [Google Scholar] [CrossRef] [Green Version]
  20. Wu, B.; Zhang, S.X. Energy Management Strategy for Dual-Motor Two-Speed Transmission Electric Vehicles Based on Dynamic Programming Algorithm Optimization. SAE Int. J. Electrified Veh. 2021, 10, 19–31. [Google Scholar] [CrossRef]
  21. Xie, S.; Liu, T.; Li, H.; Wei, L. Optimization on Power Distribution Strategy for a Dual-motor Integrated Battery Electric Bus. Automot. Eng. 2018, 40, 749–756. [Google Scholar]
  22. Fu, J.; Song, S.; Fu, Z.; Ma, J. Real-time implementation of optimal control considering gear shifting and engine starting for parallel hybrid electric vehicle based on dynamic programming. Optim. Control Appl. Methods 2018, 39, 757–773. [Google Scholar] [CrossRef]
  23. Asher, Z.D.; Trinko, D.A.; Payne, J.D.; Geller, B.M.; Bradley, T.H. Real-Time Implementation of Optimal Energy Management in Hybrid Electric Vehicles: Globally Optimal Control of Acceleration Events. J. Dyn. Syst. Meas. Control Trans. ASME 2020, 142, 081002. [Google Scholar] [CrossRef]
  24. Zhao, M.; Shi, J.; Lin, C. Energy management strategy design for dual-motor coaxial coupling propulsion electric city-buses. Energy Procedia 2018, 152, 568–573. [Google Scholar] [CrossRef]
  25. Hu, J.J.; Niu, X.Y.; Jiang, X.Y.; Zu, G.Q. Energy management strategy based on driving pattern recognition for a dual-motor battery electric vehicle. Int. J. Energy Res. 2019, 43, 3346–3364. [Google Scholar] [CrossRef]
  26. Zhang, C.N.; Zhang, S.; Han, G.W.; Liu, H.P. Power Management Comparison for a Dual-Motor-Propulsion System Used in a Battery Electric Bus. IEEE Trans. Ind. Electron. 2017, 64, 3873–3882. [Google Scholar] [CrossRef]
  27. He, H.W.; Han, M.; Liu, W.; Cao, J.F.; Shi, M.; Zhou, N. MPC-based longitudinal control strategy considering energy consumption for a dual-motor electric vehicle. Energy 2022, 253, 124004. [Google Scholar] [CrossRef]
  28. Lin, C.; Zhao, M.J.; Pan, H.; Shao, S. Energy management for a dual-motor coupling propulsion electric bus based on model predictive control. Energy Procedia 2019, 158, 2744–2749. [Google Scholar] [CrossRef]
  29. Yang, Y.P.; Shih, Y.C.; Chen, J.M. Real-time torque-distribution strategy for a pure electric vehicle with multiple traction motors by particle swarm optimization. IET Electr. Syst. Transp. 2016, 6, 76–87. [Google Scholar] [CrossRef]
  30. Shangguan, J.Y.; Li, H.; Fang, C.; Yue, M. Robust Torque Split Ratio Design Method for Rule-based Control Strategy of Dual-Motor Drive Electric Buses. In Proceedings of the 2021 5th CAA International Conference on Vehicular Control and Intelligence, Tianjin, China, 29–31 October 2021. [Google Scholar]
  31. Zhang, F.Q.; Xi, J.Q.; Reza, L. Real-Time Energy Management Strategy Based on velocity forecasts Using V2V and V2I Communications. IEEE Trans. Intell. Transp. Syst. 2015, 18, 416–430. [Google Scholar] [CrossRef]
  32. Shen, P.H.; Zhao, Z.G.; Zhan, X.W.; Li, J.W. Particle Swarm Optimization of Driving Torque Demand Decision Based on Fuel Economy for Plug-In Hybrid Electric Vehicle. Energy 2017, 123, 89–107. [Google Scholar] [CrossRef]
  33. Lu, J.X.; Lin, C.T.; Chen, Q.S. Comparison Study of 3 Types of Battery Models for Electrical Vehicle. Chin. J. Power Sources 2006, 30, 535–538. [Google Scholar]
  34. Ramadan, H.S.; Bendary, A.F.; Nagy, S. Particle swarm optimization algorithm for capacitor allocation problem in distribution systems with wind turbine generators. Int. J. Electr. Power Energy Syst. 2017, 84, 143–152. [Google Scholar] [CrossRef]
  35. Zheng, Q.X.; Tian, S.P.; Zhang, Q. Optimal Torque Split Strategy of Dual-Motor Electric Vehicle Using Adaptive Nonlinear Particle Swarm Optimization. Math. Probl. Eng. 2020, 2020, 1204260. [Google Scholar] [CrossRef]
  36. Gao, S.; Sun, B.B.; Wang, P.W.; Li, J.W.; Li, Y.Q. An Experimental Analysis on Mode-Switch Jerk of Front and Rear Motor Drive Electric Vehicle. Automot. Eng. 2017, 39, 561–568. [Google Scholar]
Figure 1. Dual-motor four-drive powertrain.
Electronics 12 02903 g001
Figure 2. A high-fidelity forward vehicle simulation model.
Electronics 12 02903 g002
Figure 3. Motor efficiency map. (a) Front motor. (b) Rear motor.
Electronics 12 02903 g003
Figure 4. Energy consumption distribution of pure electric powertrain.
Electronics 12 02903 g004
Figure 5. Operation efficiency analysis of single-motor powertrain. (a) Single motor + main reducer powertrain. (b) Single motor + transmission powertrain.
Electronics 12 02903 g005
Figure 6. Operation efficiency analysis of dual-motor four-drive powertrain.
Electronics 12 02903 g006
Figure 7. Motor speed fluctuation problem in driving.
Electronics 12 02903 g007
Figure 8. Procedure for economic energy management strategy.
Electronics 12 02903 g008
Figure 9. Pre-shifting recognition schedule.
Electronics 12 02903 g009
Figure 10. Procedure for multi-objective real-time optimal strategy.
Electronics 12 02903 g010
Figure 11. Power split ratio and torque response under different tolerances. (a) Power split ratio. (b) Torque response under 0% tolerance. (c) Torque response under 1% tolerance. (d) Torque response under 2% tolerance.
Electronics 12 02903 g011
Figure 12. Energy consumption results of different strategies. (a) NEDC. (b) WLTC. (c) CLTC.
Electronics 12 02903 g012
Figure 13. Continuous shifting results without coordination control.
Electronics 12 02903 g013
Figure 14. Continuous shifting results with coordination control.
Electronics 12 02903 g014
Figure 15. Vehicle drum experiment bench.
Electronics 12 02903 g015
Figure 16. Energy consumption experimental results. (a) NEDC. (b) WLTC.
Electronics 12 02903 g016
Figure 17. Torque coordination effect of different strategies. (a) NEDC. (b) WLTC.
Electronics 12 02903 g017
Table 1. Vehicle primary parameters.
ParametersValueUnit
Vehicle mass m1943kg
Radius of wheels rw0.342m
Frontal area Af2.659m2
Rolling resistance coefficient Cr0.01-
Air resistance coefficient Cd0.379-
Rotary mass coefficient δ1.12-
Gear ratio of transmission ig[17.477, 9.917, 6.133, 4.689, 3.743, 2.858]-
Final drive ratio (rear axle) if,r7.7-
Peak power of the front motor Pm1,max105.4kW
Peak torque of the front motor Tm1,max309N · m
Peak speed of the front motor ωm1,max7000r/min
Peak power of the rear motor Pm2,max45kW
Peak torque of the rear motor Tm2,max170N · m
Peak speed of the rear motor ωm2,max11,000r/min
Type of power batteryNMC-
Nominal voltage of battery module350V
Nominal capacity of battery module37Ah
Connection approach of battery module1S6P-
Table 2. Simulation results under different tolerances.
Driving CycleTolerance (%)Power Split Ratio FluctuationComputation Time (s)Energy Consumption (kWh/100 km)
NEDC0Big804.7713.26
1Small120.5713.27
2Small81.2913.45
Table 3. Comparative results of different strategies.
Driving CycleStrategyComputation
Time (s)
Energy Consumption
(kWh/100 km)
Improvement (%)
NEDCSingle-motor drive47.4314.44-
Maximum load rate71.1013.635.61
Optimal power split120.5713.278.10
WLTCSingle-motor drive86.1815.18-
Maximum load rate141.7114.713.10
Optimal power split249.4614.574.02
CLTCSingle-motor drive81.3113.59-
Maximum load rate128.3312.937.06
Optimal power split224.8712.309.49
Table 4. Continuous shifting simulation results.
StrategyGearMax Acceleration (m/s2)Max Jerk (m/s3)
Single-motor drive3 to 4−0.2113.03
4 to 5−0.299.90
5 to 6−0.407.86
Dynamic strategy3 to 40.654.57
4 to 50.283.92
5 to 60.043.18
Table 5. Experiment environment setting.
ParameterValue
Pressure (kPa)100.06
Ambient temperature (°C)23.75
Relative humidity (%)49.60
Drag coefficient settingA: 154.396; B: 0.093; C: 0.0418
Chassis dynamometer typeROADSIM48 MIN4 2 LIGHT
Table 6. Comparison of energy consumption experimental results.
Driving CycleStrategyEnergy Consumption (kJ)Energy Consumption (kWh/100 km)Improvement (%)
NEDCSingle-motor drive5815.6414.65-
Optimal power split5305.5113.378.74
WLTCSingle-motor drive12,831.3315.36-
Optimal power split12,196.8414.614.88
Disclaimer/Publisher’s Note: The statements, opinions and data contained in all publications are solely those of the individual author(s) and contributor(s) and not of MDPI and/or the editor(s). MDPI and/or the editor(s) disclaim responsibility for any injury to people or property resulting from any ideas, methods, instructions or products referred to in the content.

