Article

Parkinson’s Disease Detection Using Hybrid LSTM-GRU Deep Learning Model

1
Artificial Intelligence & Data Analytics Lab CCIS, Prince Sultan University, Riyadh 11586, Saudi Arabia
2
Department of Computer Science, Khwaja Fareed University of Engineering and Information Technology, Rahim Yar Khan 64200, Pakistan
3
Department of Mathematical Sciences, College of Science, Princess Nourah bint Abdulrahman University, P.O. Box 84428, Riyadh 11671, Saudi Arabia
*
Author to whom correspondence should be addressed.
Electronics 2023, 12(13), 2856; https://doi.org/10.3390/electronics12132856
Submission received: 31 May 2023 / Revised: 23 June 2023 / Accepted: 26 June 2023 / Published: 28 June 2023
(This article belongs to the Topic Machine and Deep Learning)

Abstract

:
Parkinson’s disease is the second-most common cause of death and disability as well as the most prevalent neurological disorder. In the last 15 years, the number of cases of PD has doubled. The accurate detection of PD in the early stages is one of the most challenging tasks to ensure individuals can continue to live with as little interference as possible. Yet there are not enough trained neurologists around the world to detect Parkinson’s disease in its early stages. Machine learning methods based on Artificial intelligence have acquired a lot of popularity over the past few decades in medical disease detection. However, these methods do not provide an accurate and timely diagnosis. The overall detection accuracy of machine learning-related models is inadequate. This study collected data from 31 male and female patients, including 195 voices. Approximately six recordings were created per patient, with the length of each recording extending from 1 to 36 s. These voices were recorded in a soundproof studio using an Industrial Acoustics Company (IAC) AKG-C420 head-mounted microphone. The data set was collected to investigate the diagnostic significance of speech and voice abnormalities caused by Parkinson’s disease. An imbalanced dataset is the main contributor of model overfitting and generalization errors, and hence one class has the majority of samples and the other class has minority samples. This problem is addressed in this study by utilizing the three sampling techniques. After balancing the datasets, each class has the same number of samples, which has proven valuable in improving the model’s performance and reducing the overfitting problem. Four performance metrics such as accuracy, precision, recall and f1 score are used to evaluate the effectiveness of the proposed hybrid model. Experiments demonstrated that the proposed model achieved 100% accuracy, recall and f1 score using the balanced dataset with the random oversampling technique and 100% precision, 97% recall, 99% AUC score and 91% f1 score with the SMOTE technique.

1. Introduction

Parkinson’s disease (PD) is a neurodegenerative disorder that worsens over time, affected by the premature death of dopaminergic neurons in the substantia nigral region [1]. This degeneration initially occurs in the dorsal striatum and progresses toward the ventral region because of the disease spread. The putamen and caudate nucleus, which make up the striatum, is responsible for regulating various motor and cognitive functions. In PD, the dopamine metabolism produces a high level of reactive-oxygen species, leading to an increased iron content that can damage cell components and impair neuronal function [2]. The impairment of dopaminergic pathways is associated with PD symptoms, with the depletion of dopaminergic neurons causing a range of motor and non-motor symptoms. Motor symptoms include tremors, stiffness, slow movement, and difficulty walking, while depression, psychosis, accidents, genitourinary issues, and sleep disorders are examples of non-motor symptoms [3]. When 60% of dopaminergic neurons are present, these symptoms manifest [4], and they correlate with aging factors [5], contributing to a decreased quality of life.
According to records from the World Health Organization (WHO), approximately 10 million people worldwide have been affected by PD. Unfortunately, many patients are not diagnosed in the early stages of the disease, leading to an untreatable permanent neurological disorder. In later stages, PD becomes incurable and often results in death. In 2015, PD affected around 6.2 million people and caused 117,400 deaths globally. Compounding the issue is the fact that current tests for the disease are expensive and not highly accurate. These concerning facts highlight the urgent need for a low-cost, efficient and accurate diagnostic method for PD in its early stages, allowing for the timely treatment to potentially cure patients before the disease becomes incurable [6].
As of now, there is no definitive way to diagnose PD [7]. However, doctors use a combination of symptoms and diagnostic tests to identify the disease. Researchers have explored several biomarkers to detect PD early to slow down the disease’s progression. While current therapies for PD can improve symptoms, they do not slow or stop the progression of the disease. Studies have revealed that PD can begin earlier than motor symptoms develop, and about 90% of PD patients experience voice disorders [8]. Therefore, researchers are searching for better ways to identify non-motor symptoms that develop earlier and have the potential to delay the progression. However, diagnosing PD based solely on qualitative criteria can be challenging, as other diseases may present similar symptoms. Nevertheless, execution time and algorithm complexity are critical factors that require careful consideration in many medical applications and image analysis [9,10,11,12,13].
The field of medical image analysis has been revolutionized by the emergence of Deep Learning (DL) neural network techniques [14]. DL has been employed for a variety of tasks including segmentation, registration, lesion detection, disease classification, and shape modeling [15]. DL neural networks are particularly well-suited to extract high level-features that improve accuracy in disease classification due to their exceptional generalization capacity. The development of Convolutional Neural Networks (CNNs) has also been instrumental in advancing the field of medical image analysis. CNN has attained impressive results in numerous medical imaging applications [16].
The Parkinson’s disease dataset has class imbalance issues. These issues can be addressed through sampling techniques, including random oversampling, undersampling, and SMOTE, or by utilizing ensemble models. Due to insufficient instances of the minority class, the imbalanced classification has the issue that a model cannot learn the decision boundary efficiently. It is possible to oversample a minority group. This can be accomplished through the straightforward replication of minority-class samples in the data (training) prior to model fitting. Although this can equalize the class distribution, it does not add any new data to the model [17]. The undersampling technique equalized the number of instances in the minority class to those in the majority class. Some information is mismatched in the process, which may be problematic for the resultant DL models [18].
Traditionally, Parkinson’s disease can be detected by examining the patient’s neurological history and analyzing their movement in different scenarios. Parkinson’s disease (PD) is notoriously difficult to diagnose due to the absence of a reliable laboratory test, especially in its early stages, when motor symptoms are modest. Patients are required to attend the clinic on a regular basis in order to track the disease’s progression over time. Voice recordings are an effective non-invasive diagnostic tool because PD patients have distinct vocal features. Our proposed method is able to detect Parkinson’s disease with high accuracy and is cost-effective. Moreover, it provides early Parkinson’s disease detection, which is extremely beneficial for enhancing the individual’s quality-of-life. Existing methods relied primarily on machine learning models that could only analyze inputs from sensor devices. Some of these methods were used to detect the disease, even with low accuracy and an inefficient approach. However, our proposed model, which leverages preprocessing and oversampling techniques, is more accurate, efficient, and cost-effective than existing methods. The main contribution for this study are as follows:
  • To balance the highly imbalanced Parkinson’s disease dataset, this study adopted undersampling and oversampling techniques to accurately detect the disease in its early stages. Moreover, with these techniques, the problem of model overfitting is solved and performance increases.
  • A hybrid LSTM-GRU model is proposed that automatically detects the PD in time. In addition, the performance of single models and hybrid models is also investigated and compared to evaluate the proposed model results.
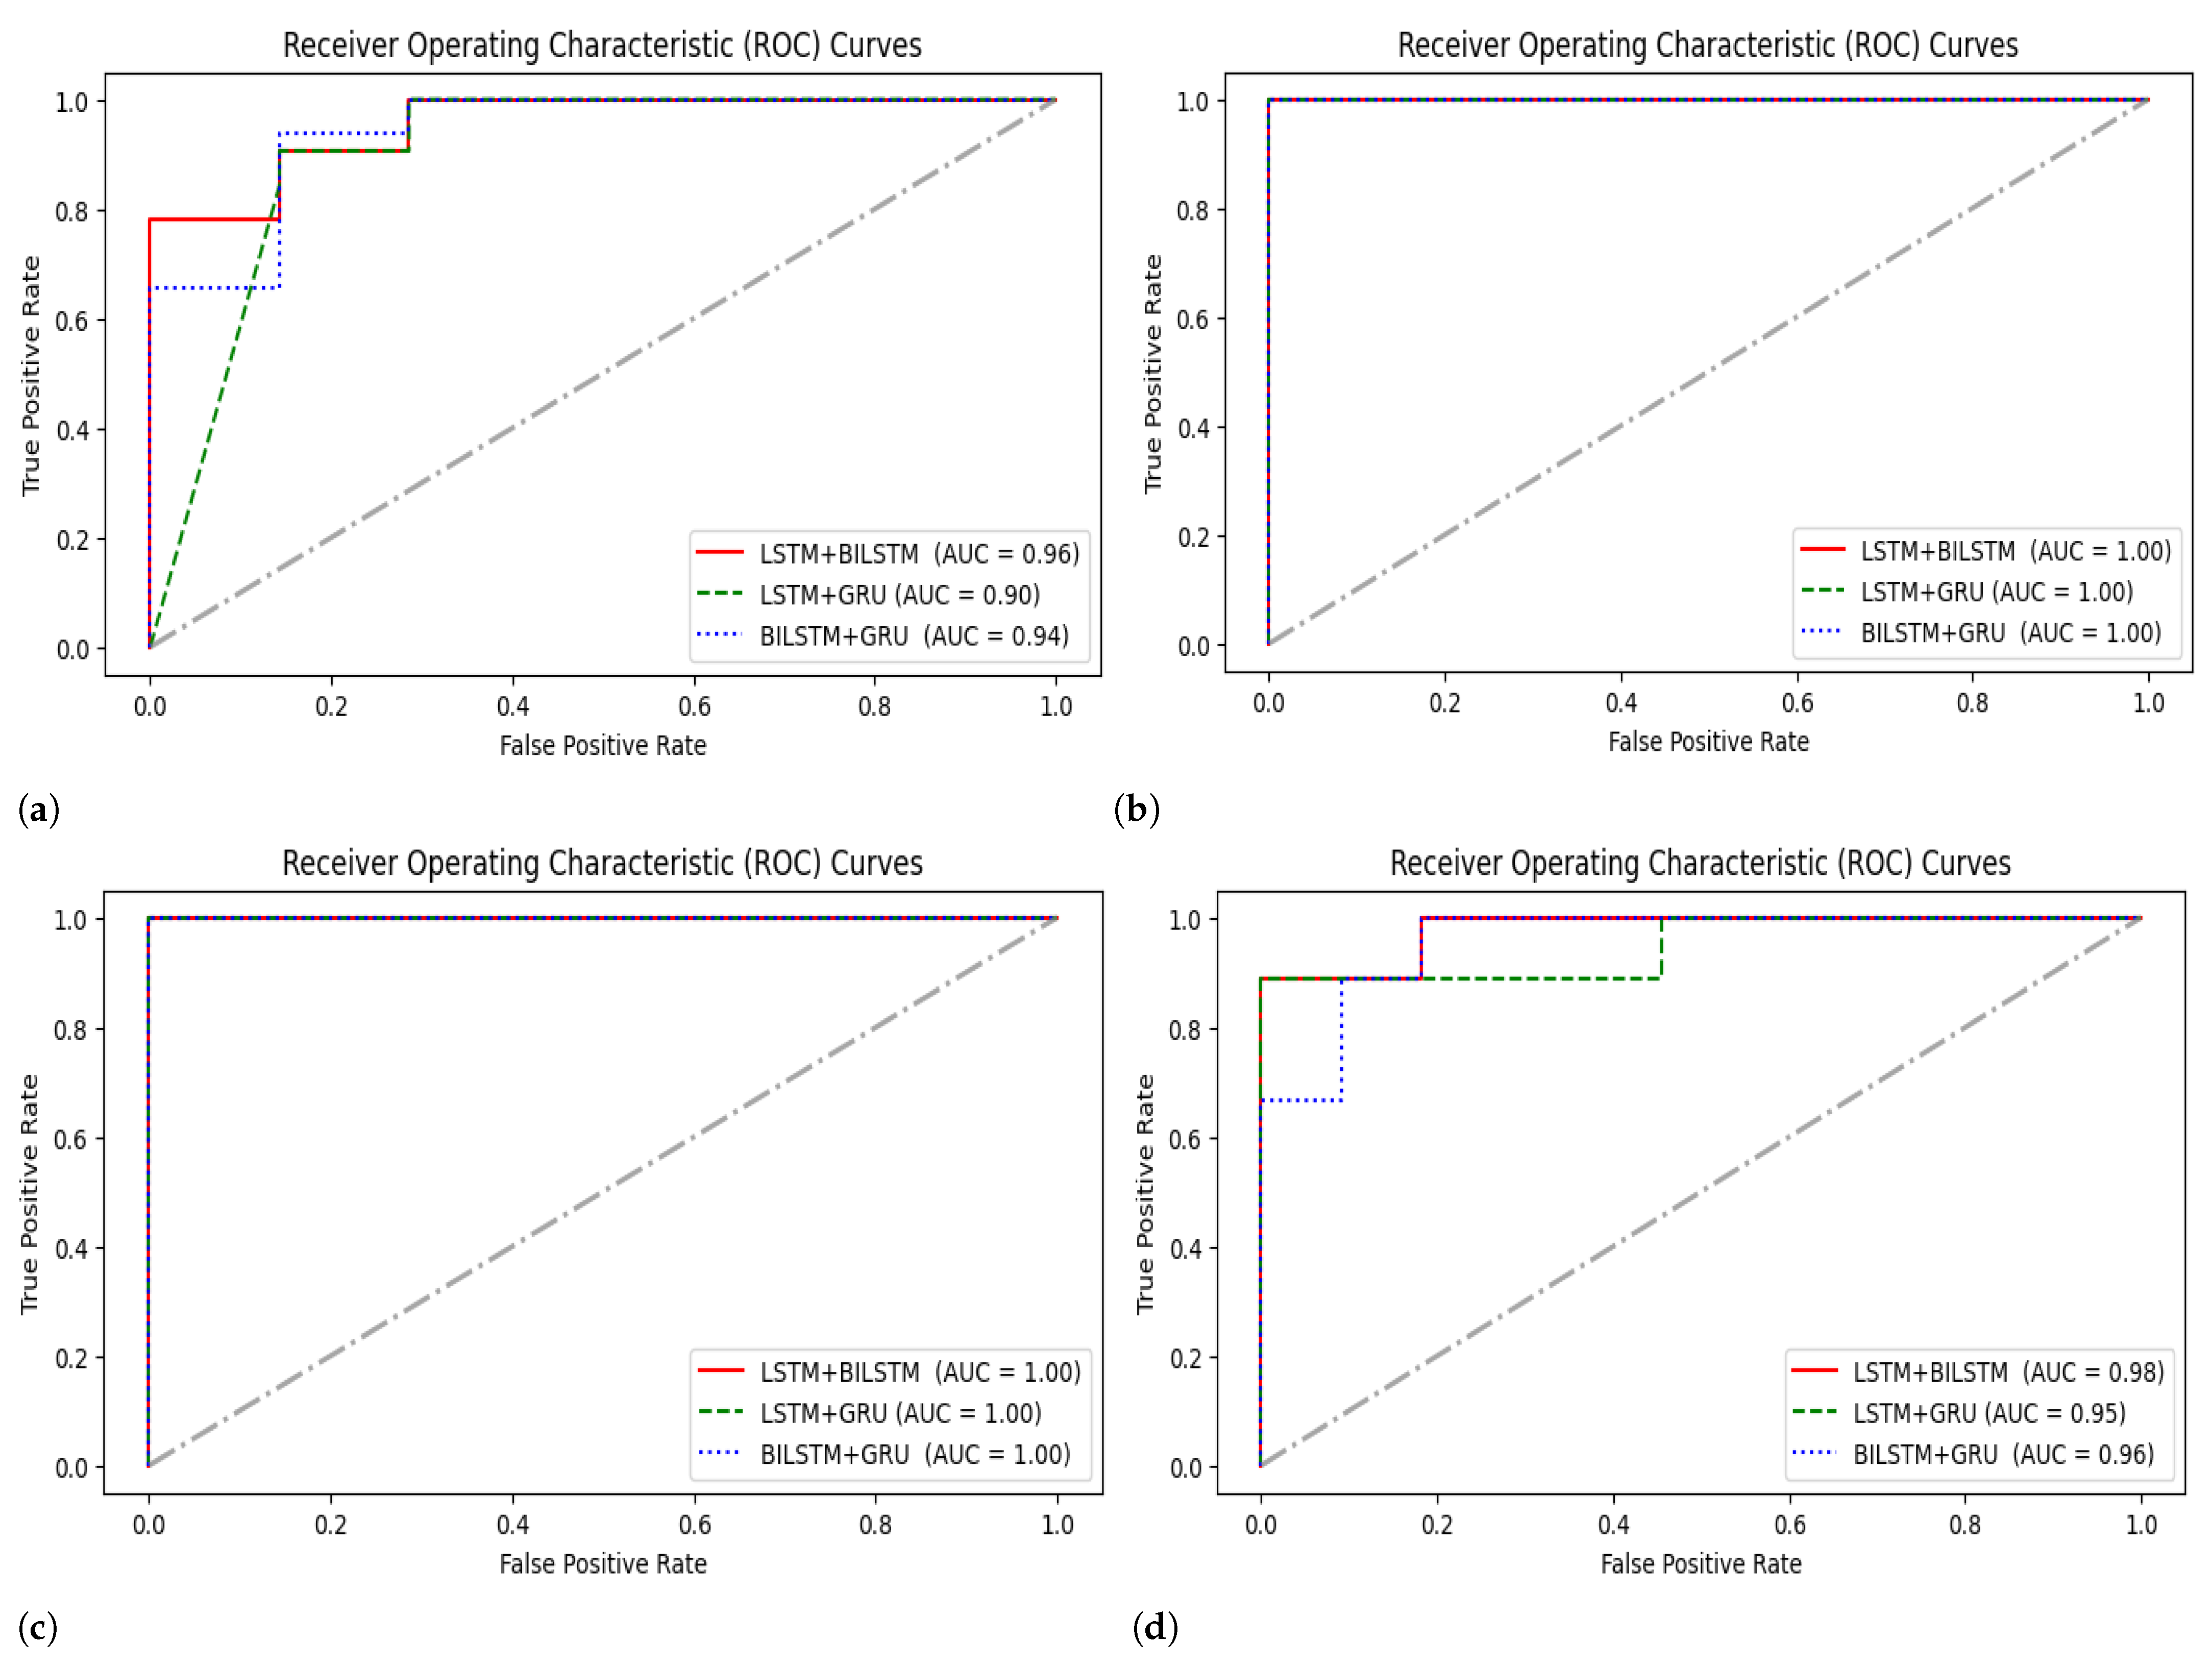
  • The true positive rate (TPR) and the false positive rate (FPR) are calculated and displayed against one another on the ROC curve for different threshold values to assess the performance of hybrid models.
  • The comparison of different sampling techniques with hybrid models and other state-of-the-art studies is explored.
This paper is divided into five sections to organize the content. Section 2 offers a thorough review of the relevant literature. Section 3 provides the proposed methodology. Section 4 demonstrates the expermental results of the proposed and other methods and their discussions. Section 5 provide the conclusion of this paper.

2. Literature Review

Multiple researchers used Deep Learning (DL) methods to diagnose Parkinson’s Disease (PD). Diagnosis techniques include analyzing voice and brain scan images, as well as drawings such as meander patterns, spirals, waves, etc. [19]. Due to its high accuracy in detecting PD in its early stages, DL is now commonly used for PD prediction in the medical imaging field.
A deep learning technique that uses CNN and LSTM models was used by Zhao et al. [20]. They used the gait data to identify Parkinson’s disease (PD) and modified the gait signals to correctly transmit them to CNN architecture. In their investigation, the proposed current approach was contrasted with other models and earlier research. In terms of accuracy and other measures, they attained outstanding results. Recently, vocal analysis techniques have attracted the attention of many researchers who seek to construct predictive telediagnosis and telemonitoring frameworks for identifying PD. A wealth of voice signal data sources were readily available, and were collected from conversational exercises involving healthy individuals and PD patients.
A study used the SMOTE technique on 195 voice recordings to artificially expand the size of the dataset. Their analysis utilized data sampling through SMOTE to create a balanced dataset by oversampling the minority class. The improved dataset was then used for classification purposes. The objective of oversampling was to generate a new dataset with a similar distribution of classes to the original, but with a greater proportion of samples from minority classes. LSTM improved disease classification into distinct classes [21]. Kemal Polat utilized the oversamling technique for the classification of Parkinson’s disease from voice signals. Sampling can produce noise in a dataset if the chosen neighbours do not closely reflect the true underlying distribution. They used 50% of the data for training and testing but achieved a low 94.8% accuracy [22].
The early detection of PD was crucial for its prevention or slowing its progression. Voice defects were a significant early symptom of PD, and various techniques have been used to detect PD early, such as computer vision and speech recognition [23]. There was no single unique symptom for PD, and the signs vary from person to person. Tremors, stiffness and slow movement are the primary signs of PD. There was no particular cure for PD, but the impact can be reduced through early detection and the right medication. Grover et al. [24] developed a deep neural network for the prediction of Parkinson’s disease from 42 preprocessed voice recordings. They proved that their approach attained better accuracy than previous accuracies, but in 2018, 81% accuracy is very low.
Quan et al. [25] employed a Deep learning bi-directional LSTM model that consists of two LSTM layers, units 20 and 200, respectively. Adagrad had a 0.1 learning rate and 58 input dimensions. The authors achieved 75% accuracy and an 80% F1 score. A 13-layer CNN deep model was utilized by Oh et al. [26] for Parkinson’s disease detection through voice signals. They used a 20-patient dataset for the experimentation. Their model made 361 mistakes in the prediction process and achieved 88% accuracy. Wodzinski et al. [27] used voice signals to predict PD using the LSTM model. The dataset was collected from a hundred patients (fifty healthy and fifty unhealthy). They processed the dataset, applied a deep model, and achieved 91% accuracy.
The authors of study [28] suggested a novel classification method for PD and control individuals based on dysphonia. They adopted pitch period entropy as a reliable tool of dysphonia and obtained data from 31 individuals, involving 23 with Parkinson’s disease and 8 healthy people that generated 195 sustained vowel-phonations. Their approach comprised three steps: Feature calculation, Preprocessing, Feature selection, and Classification with a linear kernel. The proposed model was accurate to an accuracy level of 91.4%. Quan et al. [29] employed DL-based algorithms for the detection of PD. The authors compared the algorithms with and without optimization approaches. They also used k-fold cross-validation and attained better accuracy. A study [30] utilized an artificial neural network to detect PD. The dataset used for the study was obtained from the UCI repository. The study used 45 input properties and one output for classification, with the MATLAB tool employed for implementation. The proposed model demonstrated high accuracy, achieving 94.93% in distinguishing healthy subjects from those with PD.
A hybrid CNN-LSTM model was used in a study [31] to predict Parkinson’s disease from voice signals. CNN was used to extract vital information from the data, while LSTM was employed to make predictions. Their proposed hybrid procedure outperformed single-model approaches. Ma et al. [32] published research with the primary objective of detecting Parkinson’s disease from the Parkinson’s disease dataset using DL, feature extraction, and balancing the dataset. The authors identified PD with an overall accuracy of 97%.
The performance of the aforementioned work suggests that single models do not provide accurate results in comparison to ensemble DL models for disease detection. Moreover, the mentioned results for Parkinson’s disease detection are low, and their efficacy entails further research. Therefore, we proposed a deep learning-based hybrid model with sampling techniques to balance the imbalanced dataset classes, increase generalization performance, and improve the overall performance for Parkinson’s disease detection. Table 1 shows the summary of the literature review.

State-of-the-Art DL Models

Long-short-term memory, also known as LSTM, is a type of artificial neural network (ANN) that is utilised in the domains of deep learning (DL) and artificial intelligence (AI). Because there may be gaps of an undetermined length between significant occurrences in a time-series, LSTM networks are ideally suited for the task of classification, and generating predictions based on time series data. The problem of vanishing gradients, which can arise during the training of conventional RNNs, was the impetus for the development of LSTMs. It is comprised of three gates: an “input gate”, a “forget gate” and an “output gate” [33].
The performance of gated recurrent unit (GRU) RNNs is comparable to that of LSTMs. Similar to the LSTM, the GRU consists of two gates: the reset gate and the update gate. The GRU architecture does not include an output gate. It employs a smaller set of parameters. This model is preferable to LSTM in terms of the efficiency and training speed. The reset gate determines ’how much of the previous hidden state’ is to be ignored, whereas the update gate determines ’how much of the current input is to be used’ to refresh the hidden state. Both gates have some connection to the hidden state [34].
BI-Directional LSTM is an advanced variant of LSTM that requires significantly more energy and training time. It is utilised most frequently for NLP tasks and prediction. The primary goal of BILSTM is that the input data moves in both directions, implying that this model utilises information from both directions. BILSTM is a combination of two LSTMs.
Table 1. A summary of Literature review (Advantages and Drawbacks).
MethodsSamplingAdvantagesDrawbacks
CNN+LSTM [20]-Early detection of Parkinson’s disease was essential for its prevention. DL techniques have been used to detect PD in limited time.There is no particular cure for PD, but the impact can be reduced through early detection and the right medication.
DNN [24]-A deep neural network with 42 preprocessed voice recordings was used for the prediction of Parkinson’s disease.Their approach attained only 81% accuracy and does not used any augmentation technique.
BiLSTM [25]-They utilized dynamic features of speech for Parkinson’s disease detection using BiLSTM model.The results achieved are not very accurate.
CNN [26]-CNN with a 13-layer architecture was developed by the authors to accurately predict the disease in 40 patients. Moreover, their approach was implemented for clinical practice.The results were not accurate, and the 13-layer design was very expensive.
RNN [21]SMOTEThe authors employed three DL methods for the prediction of Parkinson’s disease with extensive preprocessing techniques. An oversampling SMOTE technique was deployed to enhance the model results.They do not describe whether they used oversampling on the whole dataset or only for training.
CNN-LSTM [31]-They used CNN for feature extraction and LSTM for prediction. The main objective of this study is to detect Parkinson’s disease.Authors first used CNN model to extract relevant features from the voices and then employed LSTM for prediction that leads to high computation cost.
CNN [32]OversamplingThe authors utilised explainable DL architecture for disease detection in PD datasets. In order to improve the overall detection results, they also increased the number of data samples by utilising oversampling methods.Few features are selected from the entire dataset, resulting in an overfitting issue.
ResNet [27]AugmentationThis study used a modified version of the ResNet model to predict disease using the PD dataset. The authors used augmentation to balance the class samples because the dataset only comprises small samples of audio recordings.This study utilized augmentation on test set to increase the results but score is not good for the accurate detection of Parkinson’s disease.
Proposed MethodRandom oversampling and SMOTEThe authors employed various Dl models with extensive preprocessing, scaling and sampling techniques that enhanced the overall results. The proposed LSTM+GRU model attained superior results compared to previous models. It detected Parkinson’s disease in its early stage with the help of hybrid Dl models.This study has a limited dataset, which is a drawback and leaves space for others to do more research.

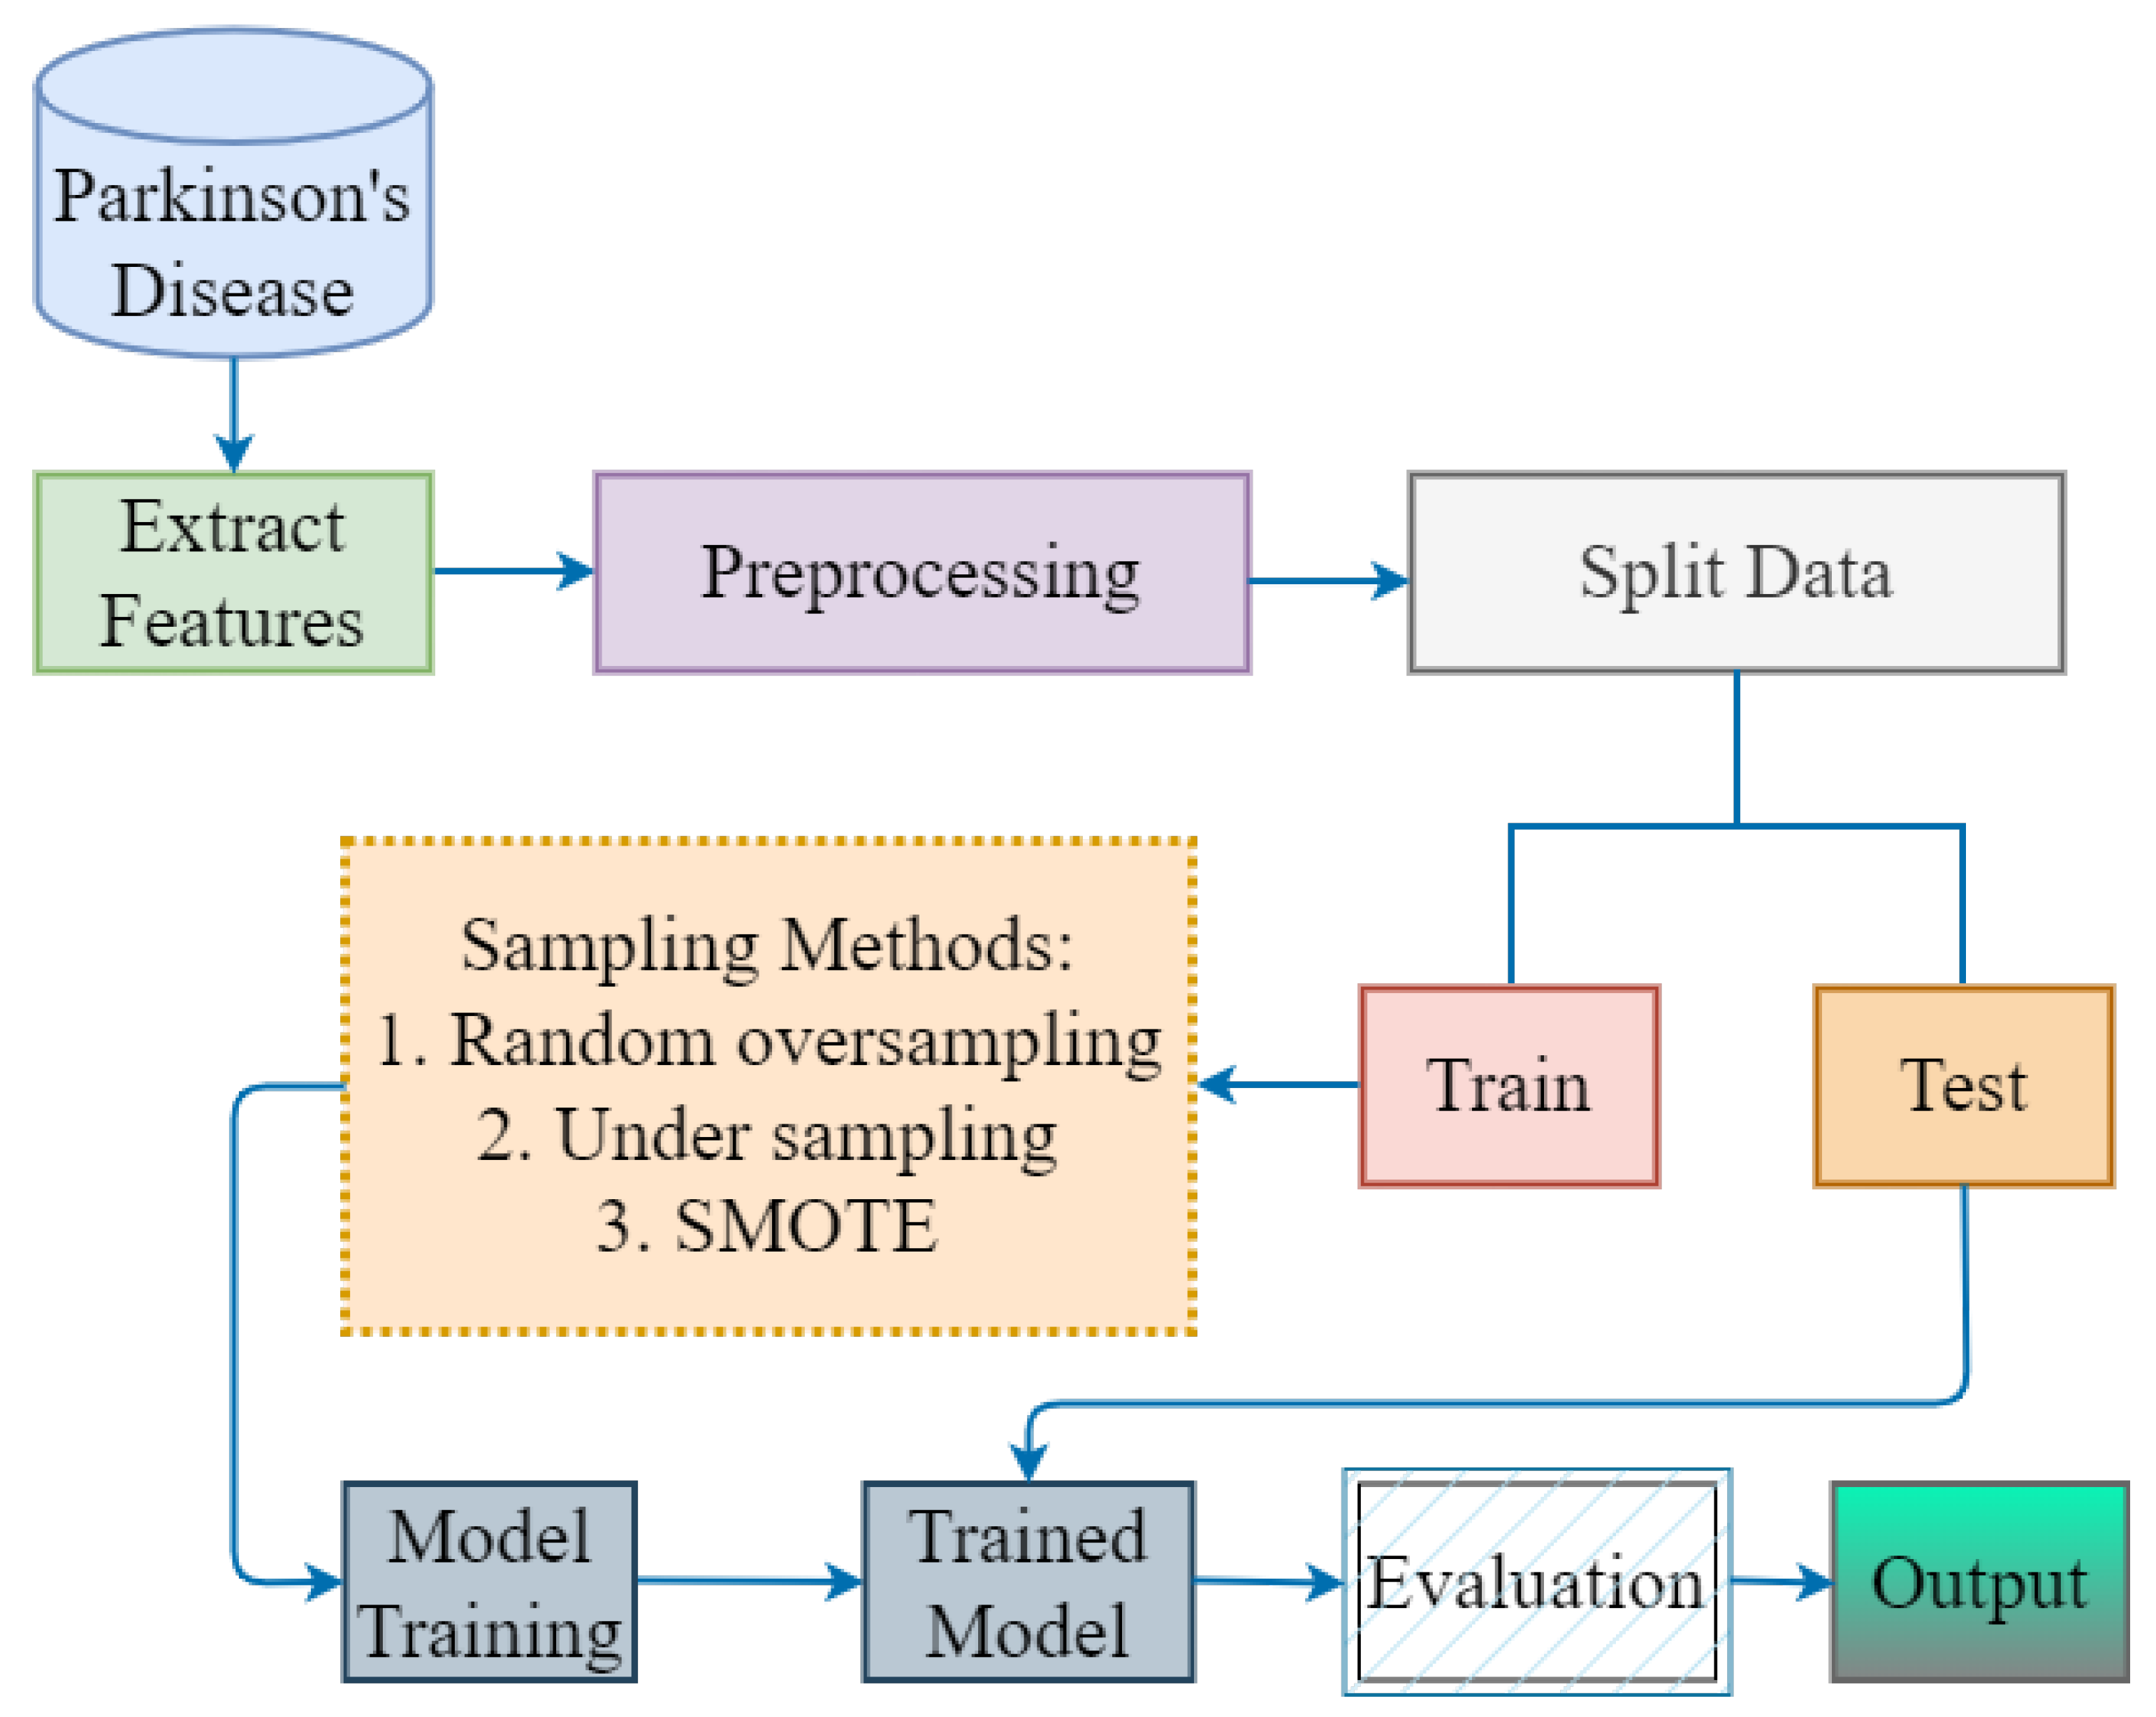
3. Proposed Methodology

The proposed methodology includes the dataset description, feature extraction, sampling methods, preprocessing and scaling, data splitting, proposed model and evaluation metrics. The proposed methodology for Parkinson’s disease detection from voice signals is presented in Figure 1.

3.1. Parkinson’s Disease Dataset

This study collected data from 31 male and female patients, including 195 voice signals (recordings) from these individuals. Out of 31, 23 patients were diagnosed with Parkinson’s disease, while 8 were declared healthy. Approximately six recordings was created per patient, with the length of each recording extending from 1 to 36 s. The main intention of utilizing these data is to differentiate between healthy individuals and PD. These voices were captured with an Industrial Acoustics Company (IAC) AKG-C420 Head-mounted Microphone in a sound-proof studio. In general, the microphone was eight centimeters away from the patient’s mouth. The data set was acquired to explore the diagnostic significance of the Parkinson’s disease effects on speech and voice abnormalities. The dataset may be utilized to explore the impacts of Parkinson’s disease (PD) on the voice and the diagnostic value of vocal symptoms (VS). A valid dataset for analysis is generated by utilizing a large number of patients at different stages of the disease. The first column in the dataset indicates the names of patients. Table 2 shows the dataset details.

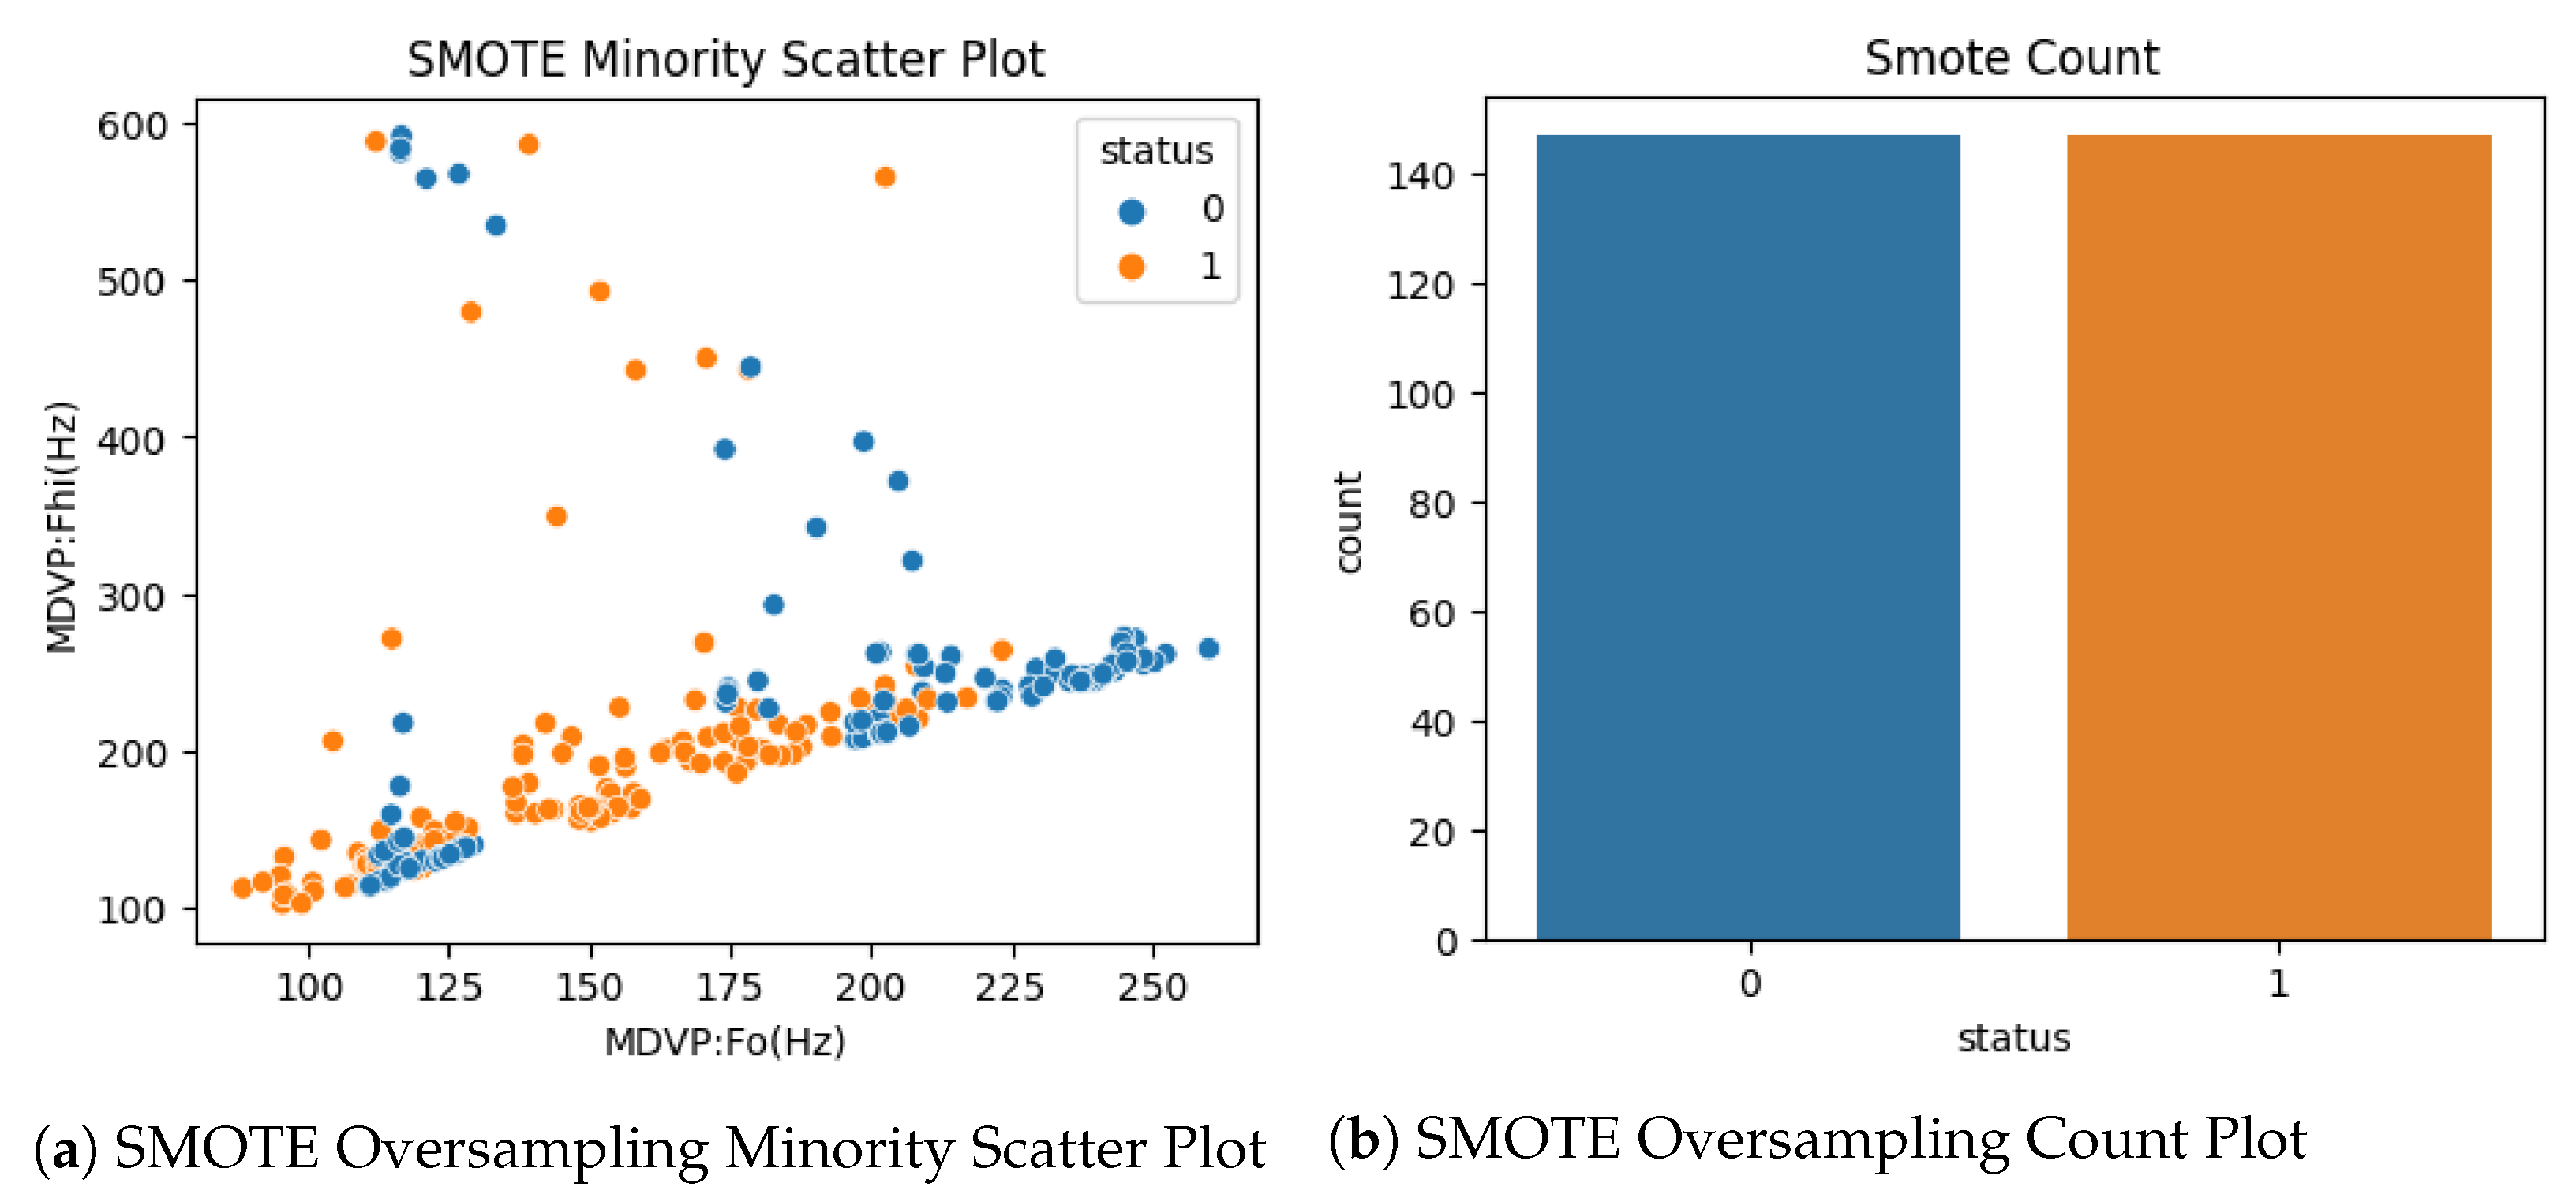
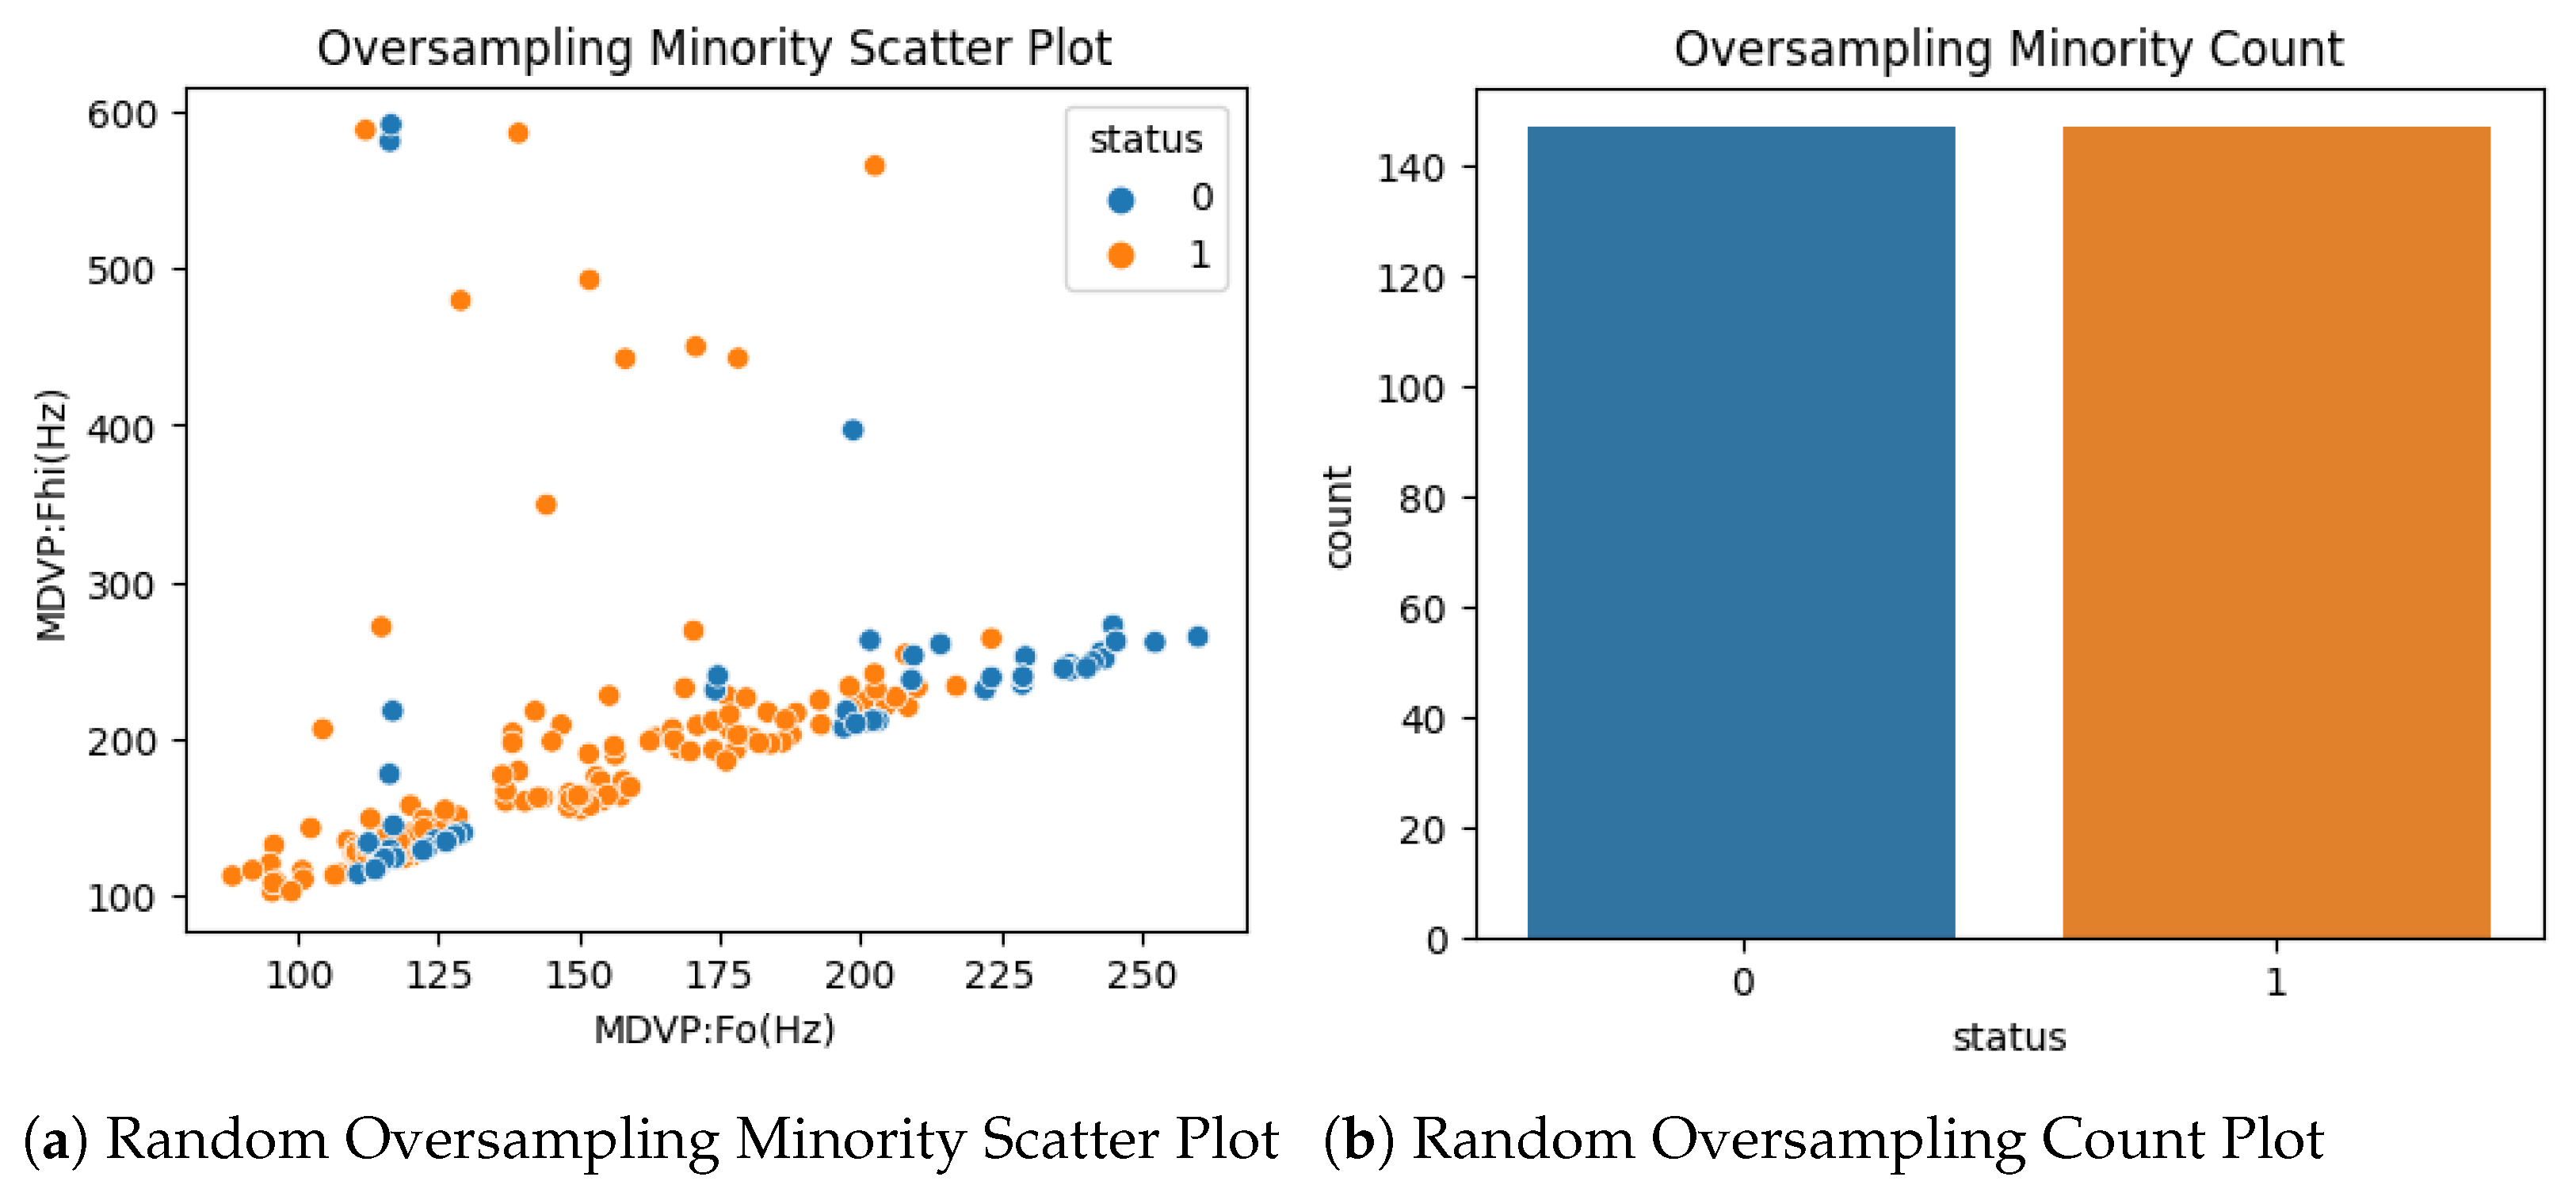
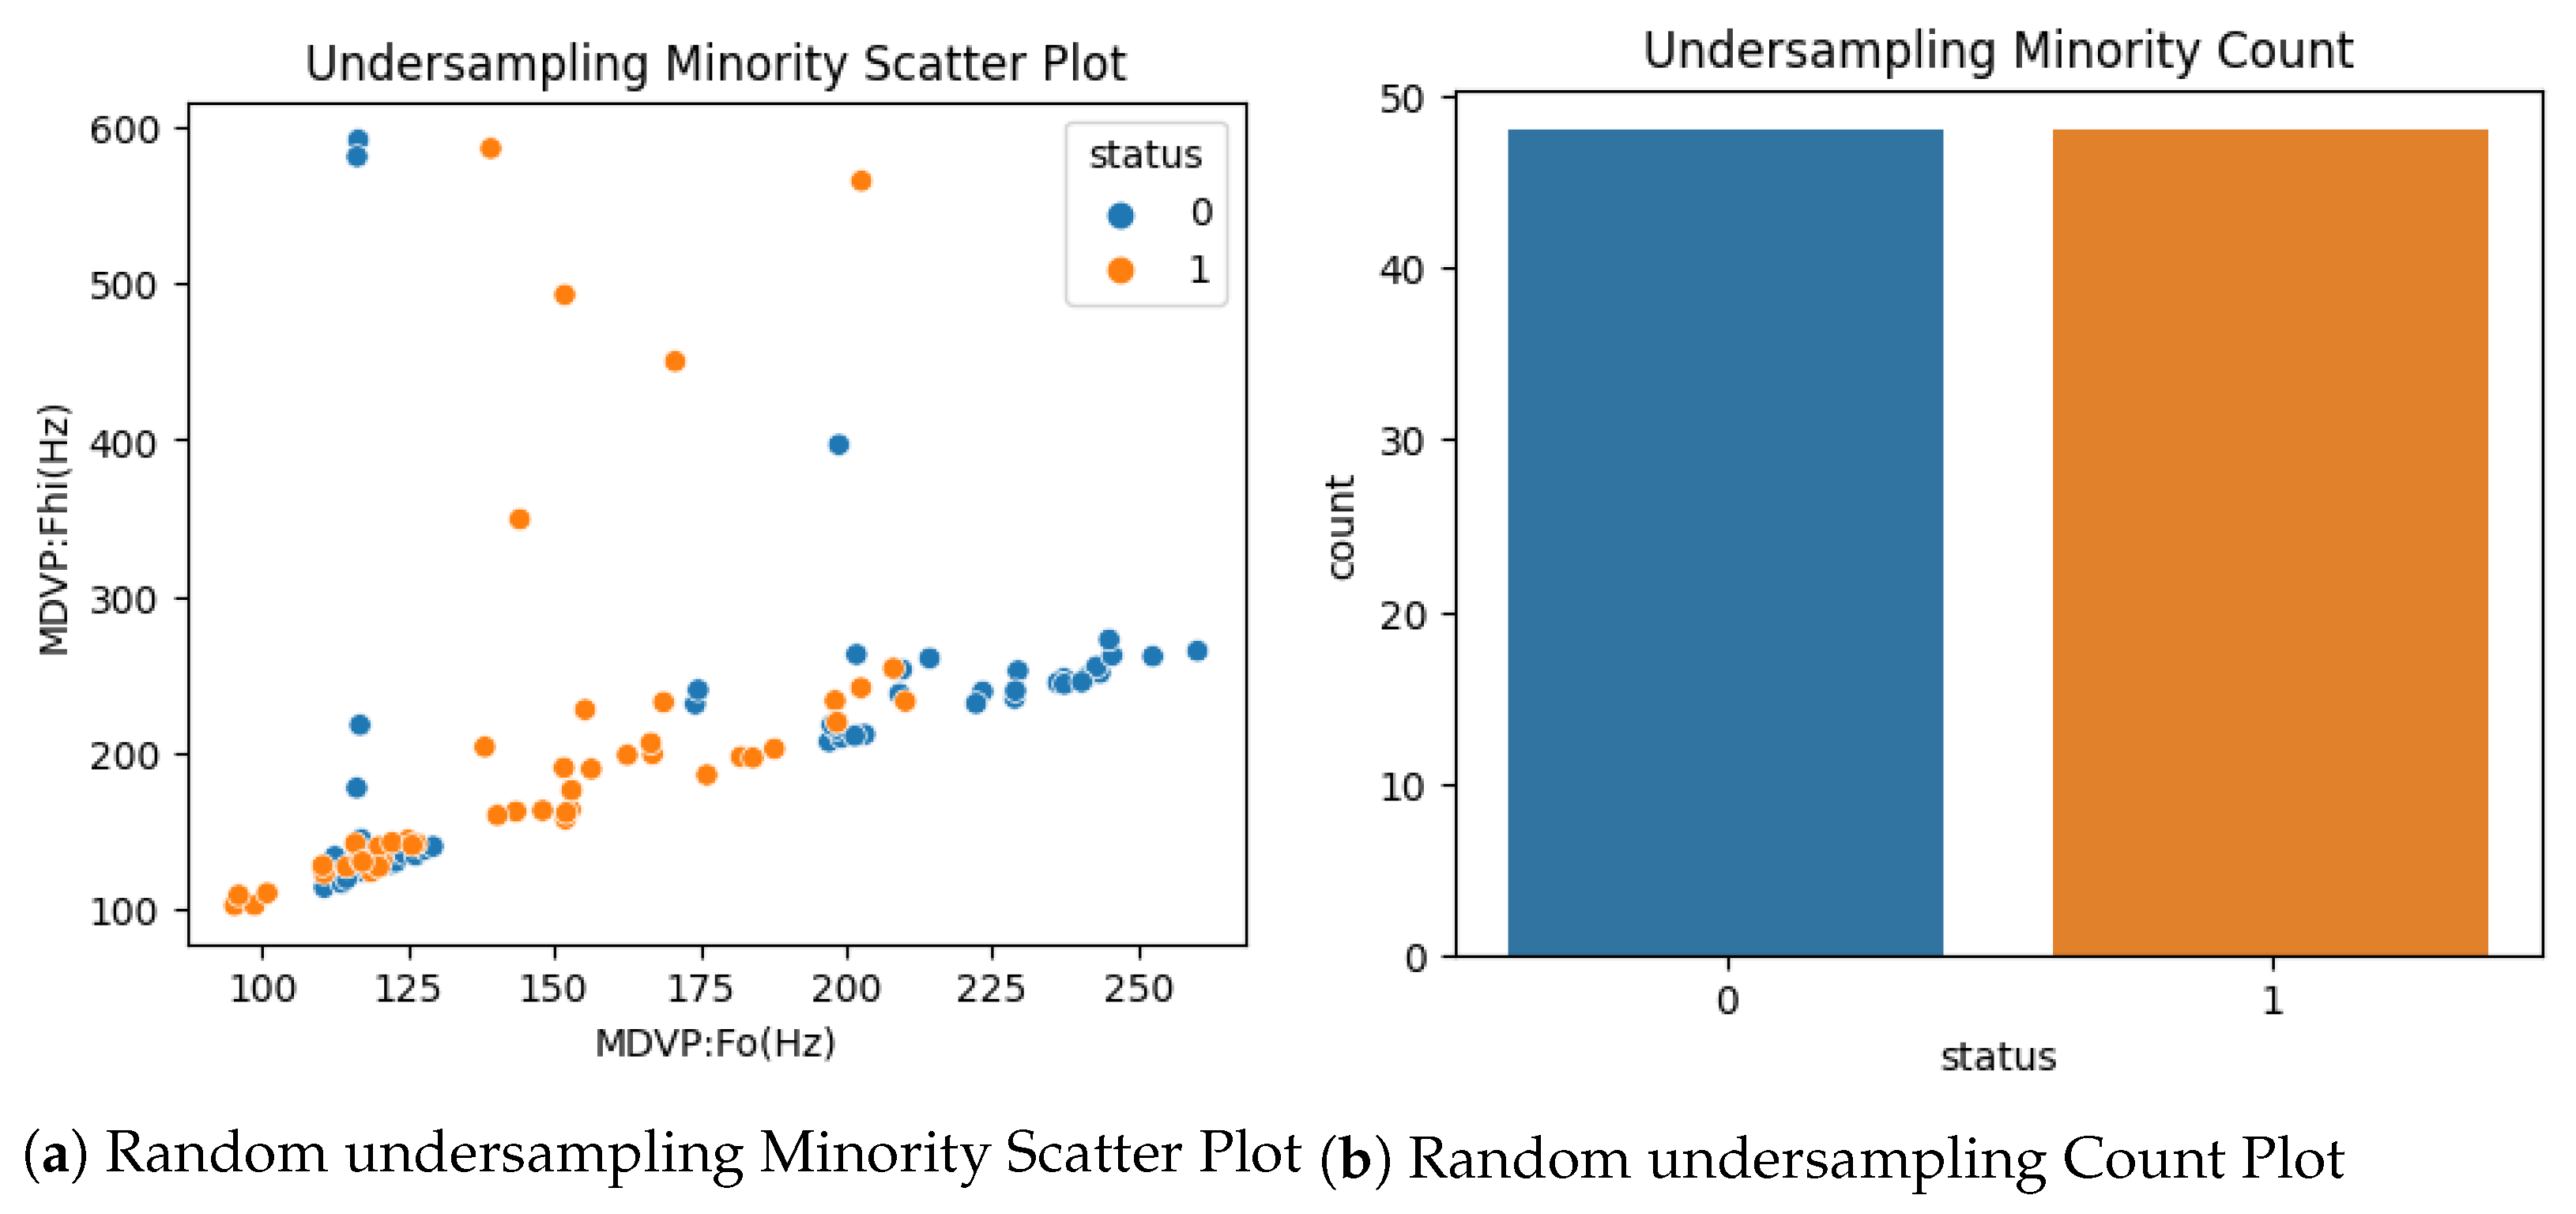
3.2. Extract Features and Sampling Methods

All features except “status” are selected for Parkinson’s disease detection; status is used to distinguish between healthy and PD-affected individuals. Supervised machine learning models are used to train the labeled datasets and identify the classes clearly. A dataset is imbalanced when one class has a higher number of samples than others. Traditional machine learning techniques, which presume a uniform distribution of classes, may struggle when the class imbalance is present. Training a model on a dataset with unequal class distributions may result in poor performance for the inadequate classes.
This is because the model favors the larger majority class because it has more information about them. This may result in a low recall rate for the majority class, as the model may incorrectly designate the majority of minority class cases as negative. Various techniques, including random oversampling, undersampling and SMOTE are used to address the class imbalance issue. Random oversampling [35] is a technique for producing more evenly distributed classes that involves randomly duplicating instances from the minority class.
The enhanced dataset is then utilized in the classification tasks. The aim of oversampling is to create a new dataset with a similar distribution of classes to the original but with a larger proportion of samples from minority classes. Based on existing minority-class instances, SMOTE creates new Synthetic instances. The method chooses a member of a minority class, then locates its k closest neighbors in the feature space. The feature vectors of the selected instance and one of its neighbors are then linearly combined to form a new instance. The linear combination quantity is chosen at random; however, it commonly ranges from 0 to 1. Up until equilibrium is reached, this process is repeated. By creating new minority class instances that are distinct from the existing minority class instances, popular oversampling techniques such as SMOTE prevent overfitting. SMOTE [36] may introduce noise into a dataset if the chosen neighbors do not closely reflect the true underlying distribution. SMOTE may also perform poorly if instances of the minority class are distributed over a broad area or if the feature space is highly dimensional. Figure 2a,b shows the Oversampling scatter and count plot using the SMOTE technique and Figure 3a,b shows the Random oversampling scatter and Count plots for healthy and PD cases.
The oversampling must be evenly distributed to avoid overfitting, and the generalizability of the model must be confirmed on a different test set. In order to achieve a more equal ratio of instances in the minority class to instances in the majority class, undersampling involves eliminating a random subset of instances from the majority class. A model that is more resistant to the class imbalance can then be trained using the resulting dataset.
The majority class instances are randomly chosen as a subset to be retained in the dataset via random undersampling. Figure 4a,b shows the Random undersampling scatter and Count plots. Undersampling can result in the loss of essential information which may be helpful in building an effective model. This information loss may reduce the model’s accuracy and ability to generalize new inputs. For small datasets, undersampling is ineffective.
Algorithm 1 demonstrates the proposed methodology for Parkinson’s disease detection from voice signals. The proposed method takes a PD dataset as an input and extracts relevant features, preprocesses them, splits the data, performs sampling on training, and then trains the model with corelative features and labels. Finally, authors check the performance of the model on test data.
Algorithm 1 Proposed Methodology for Parkinson’s disease detection
Input: Parkinson’s disease Dataset
Output: PD or Healthy
Start:
  1:
Load the Parkinson’s disease dataset
  2:
Extract relevant features and convert into relevant format
  3:
Preprocessing
R e m o v e   m i s s i n g   v a l u e s
F e a t u r e   s c a l i n g
  4:
Data splitting
T r a i n i n g ( 80 % ) and T e s t i n g ( 20 % )
  5:
Perform sampling on training
R a n d o m   o v e r s a m p l i n g
R a n d o m   u n d e r s a m p l i n g
S M O T E   o v e r s a m p l i n g
  6:
Model training using correlative features and labels
  7:
Performance evaluation on unseen data (test data)
End

3.3. Data Splitting

The standard approach of data splitting is to randomly split the data into two separate subsets: training and testing. The training set is used to train the model, while the test set evaluates its performance. In general, 80% of the data is used for training and 20% for evaluation.

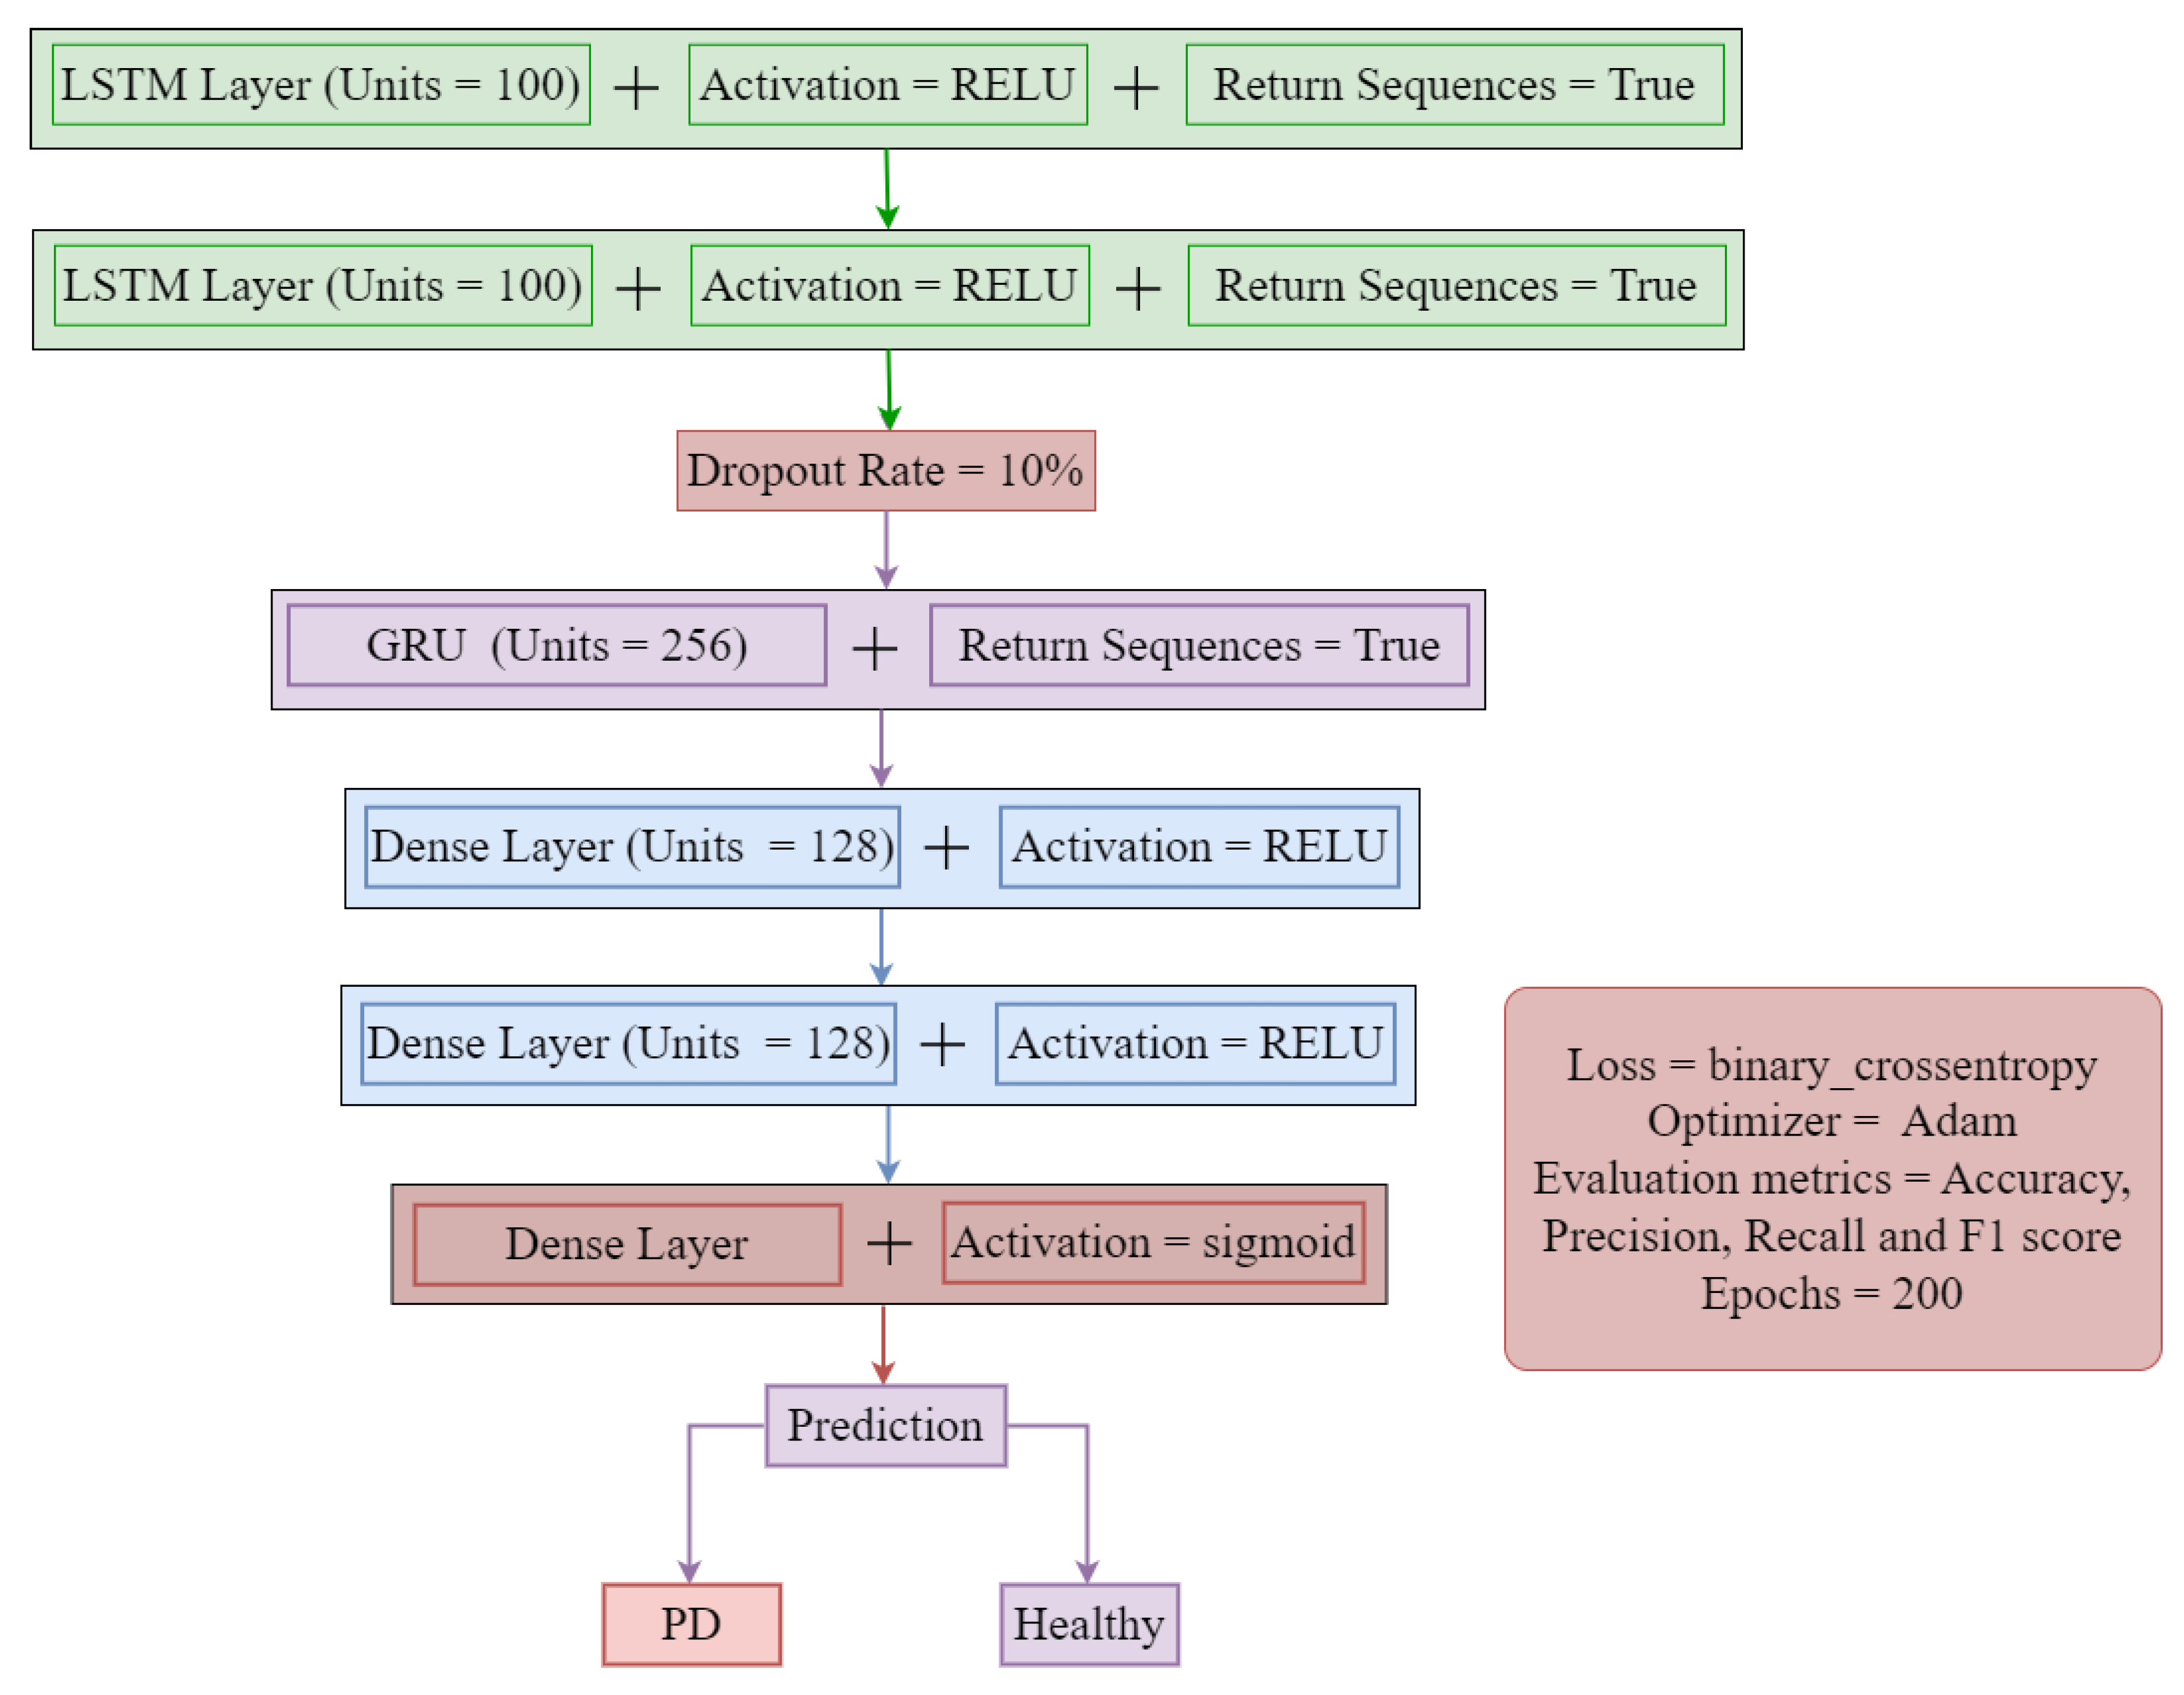
3.4. Proposed Hybrid Model

Figure 5 depicts the proposed hybrid model for detecting Parkinson’s disease, utilizing the LSTM and GRU models. Long Term short-term memory (LSTM) and Gated recurrent unit (GRU) are both neural network architectures used in deep learning. Neural networks face the problem of the vanishing gradients and find it very challenging to handle long term dependencies. To address the vanishing gradient problem, LSTM is used with the combination of the GRU model. GRU is fast and has fewer parameters than the LSTM model. LSTM and GRU handle data in different ways. The LSTM employed input, output and forget gates to regulate the flow of data through the network, while the GRU has a Reset and Update gate to control the flow of data through GRU networks. The input gate decides how much data will be fed into the memory cell, the forget gate decides how much data will be removed from the memory cell, and the output gate decides how much data will be output from the memory cell to the rest of the network.
In GRU, the Update gate in GRU decides how much data from the previous state will be retained, and the Reset gate dictates what proportion of the previous state will be removed and combined with the current input to generate the new concealed state. This enables the network to reset the previous state to a standard setting if the previous state is regarded as unnecessary for the current input.
We employed two LSTM layers with 1000 units plus the activation function “RELU” and set return sequences to True at each time-step. To avoid overfitting and reducing the model complexity, a 10% dropout is used after the LSTM layers. One GRU layer with 256 filter sizes and set return sequences to True for this layer. Two dense layers with same 128 units and activation function “RELU” is used, and the last dense layer is used for classification. A ’sigmoid’ function is used to predict binary labels. After that, the hybrid model is compiled with a binary-cross entropy loss-function and the Adam optimizer with 200 epochs.

3.5. Performance Metrics

Performance metrics [37] are utilized to assess the efficacy and precision of various models. Models use the accuracy, precision, recall and f1 score to make predictions based on given data. True Positive (TP), True Negative (TN), False Positive (FP) and False Negative (FN) are used to examine the performance of evaluation metrics.
  • True Positive (TP): positive cases, correctly identified.
  • True Negative (TN): negative cases, correctly identified.
  • False Negative (FN): cases in which a negative result is predicted incorrectly.
  • False Positive (FP):cases in which a positive result is predicted incorrectly.
Accuracy:
The ratio of accurately predicted cases to the overall number of predicted cases is known as accuracy.
Accuracy = ( TP + TN ) / ( TP + TN + FP + FN )
Precision: Precision is defined as the ratio of actual positives to the total number of positive predictions.
Precision = TP / ( TP + FP )
Recall: The fraction of actual positives to positive class cases is known as recall.
Recall = TP / ( TP + FN )
F1 score: The F1 score uses Harmonic Mean instead of Arithmetic Mean to calculate precision plus recall at almost the same rate.
F 1 Score = ( 2 × precision × recall ) / ( precision + recall )

4. Results and Discussion

The experiments were conducted using several oversampling techniques, including the random oversampling, random undersampling, and synthetic minority oversampling technique (SMOTE), on a Parkinson’s disease dataset to assess the efficacy of the proposed method. Furthermore, comparisons of the proposed method with previous studies or deep learning models are discussed.

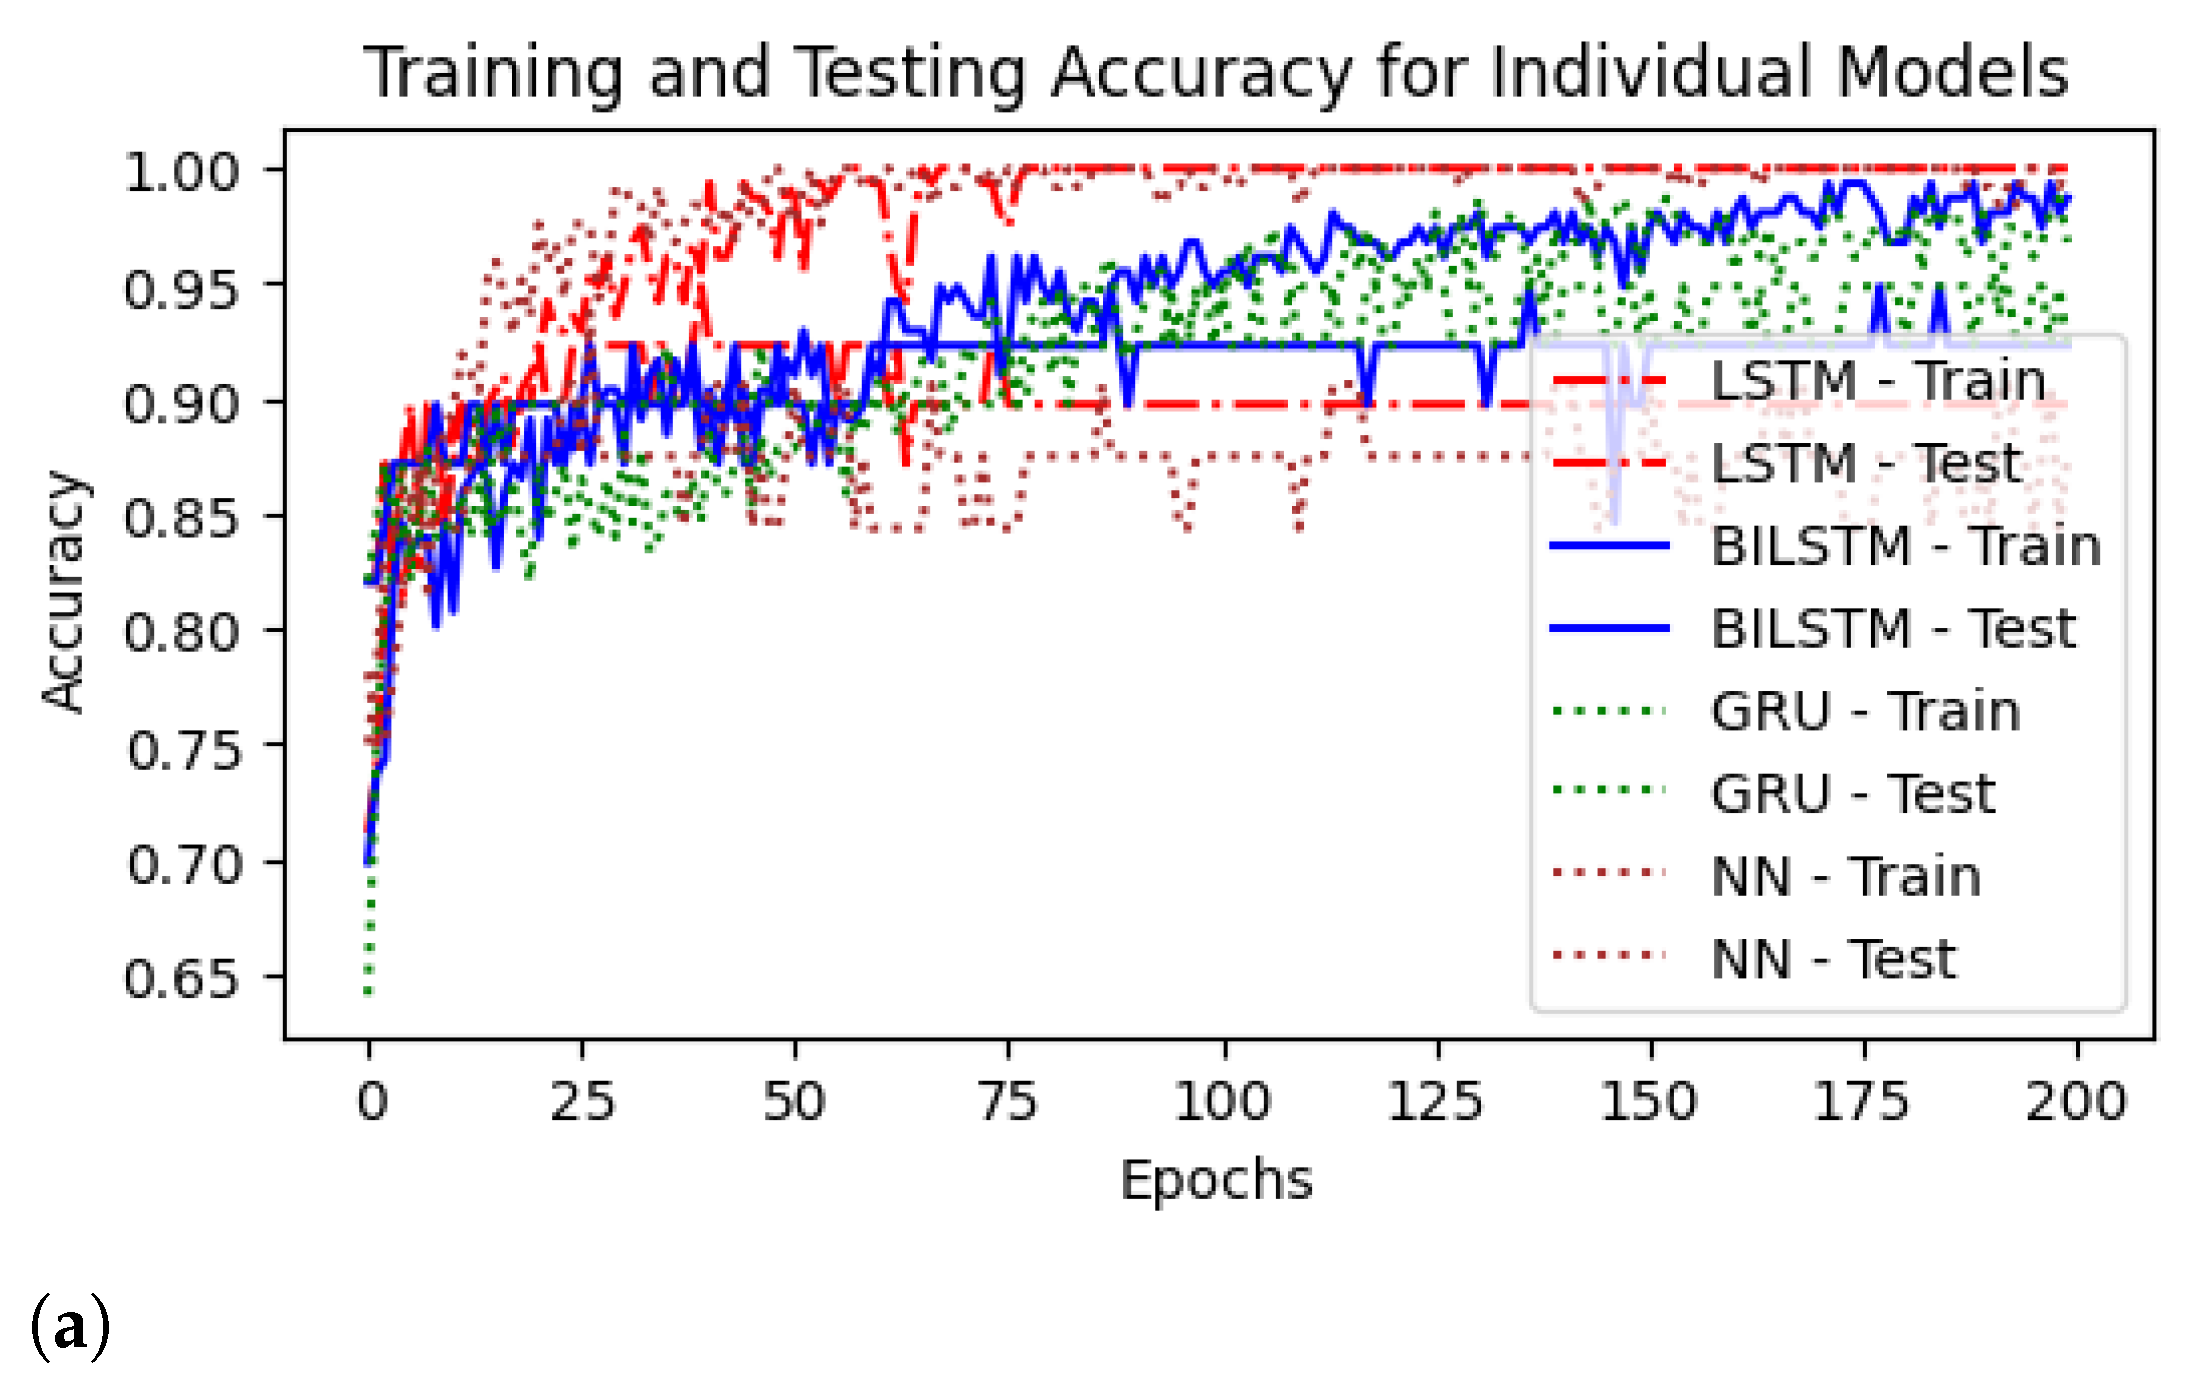
4.1. Performance of DL Models Using Different Sampling Techniques

Table 3 and Table 4 indicate the effectiveness of deep learning models. The findings show that DL models, especially BILSTM and GRU, achieved 92.3% accuracy, compared to the LSTM model with 89.7% accuracy. The results of deep learning using a balanced dataset with the random oversampling technique is shown in Table 4, which indicates that neural networks achieved an accuracy of 98%, LSTM of 97%, GRU of 93%, and BILSTM also of 97%. Table 5 shows the performance of deep learning models using the balanced dataset with the SMOTE technique. SMOTE DL models also performed better with a 98% accuracy of NN.

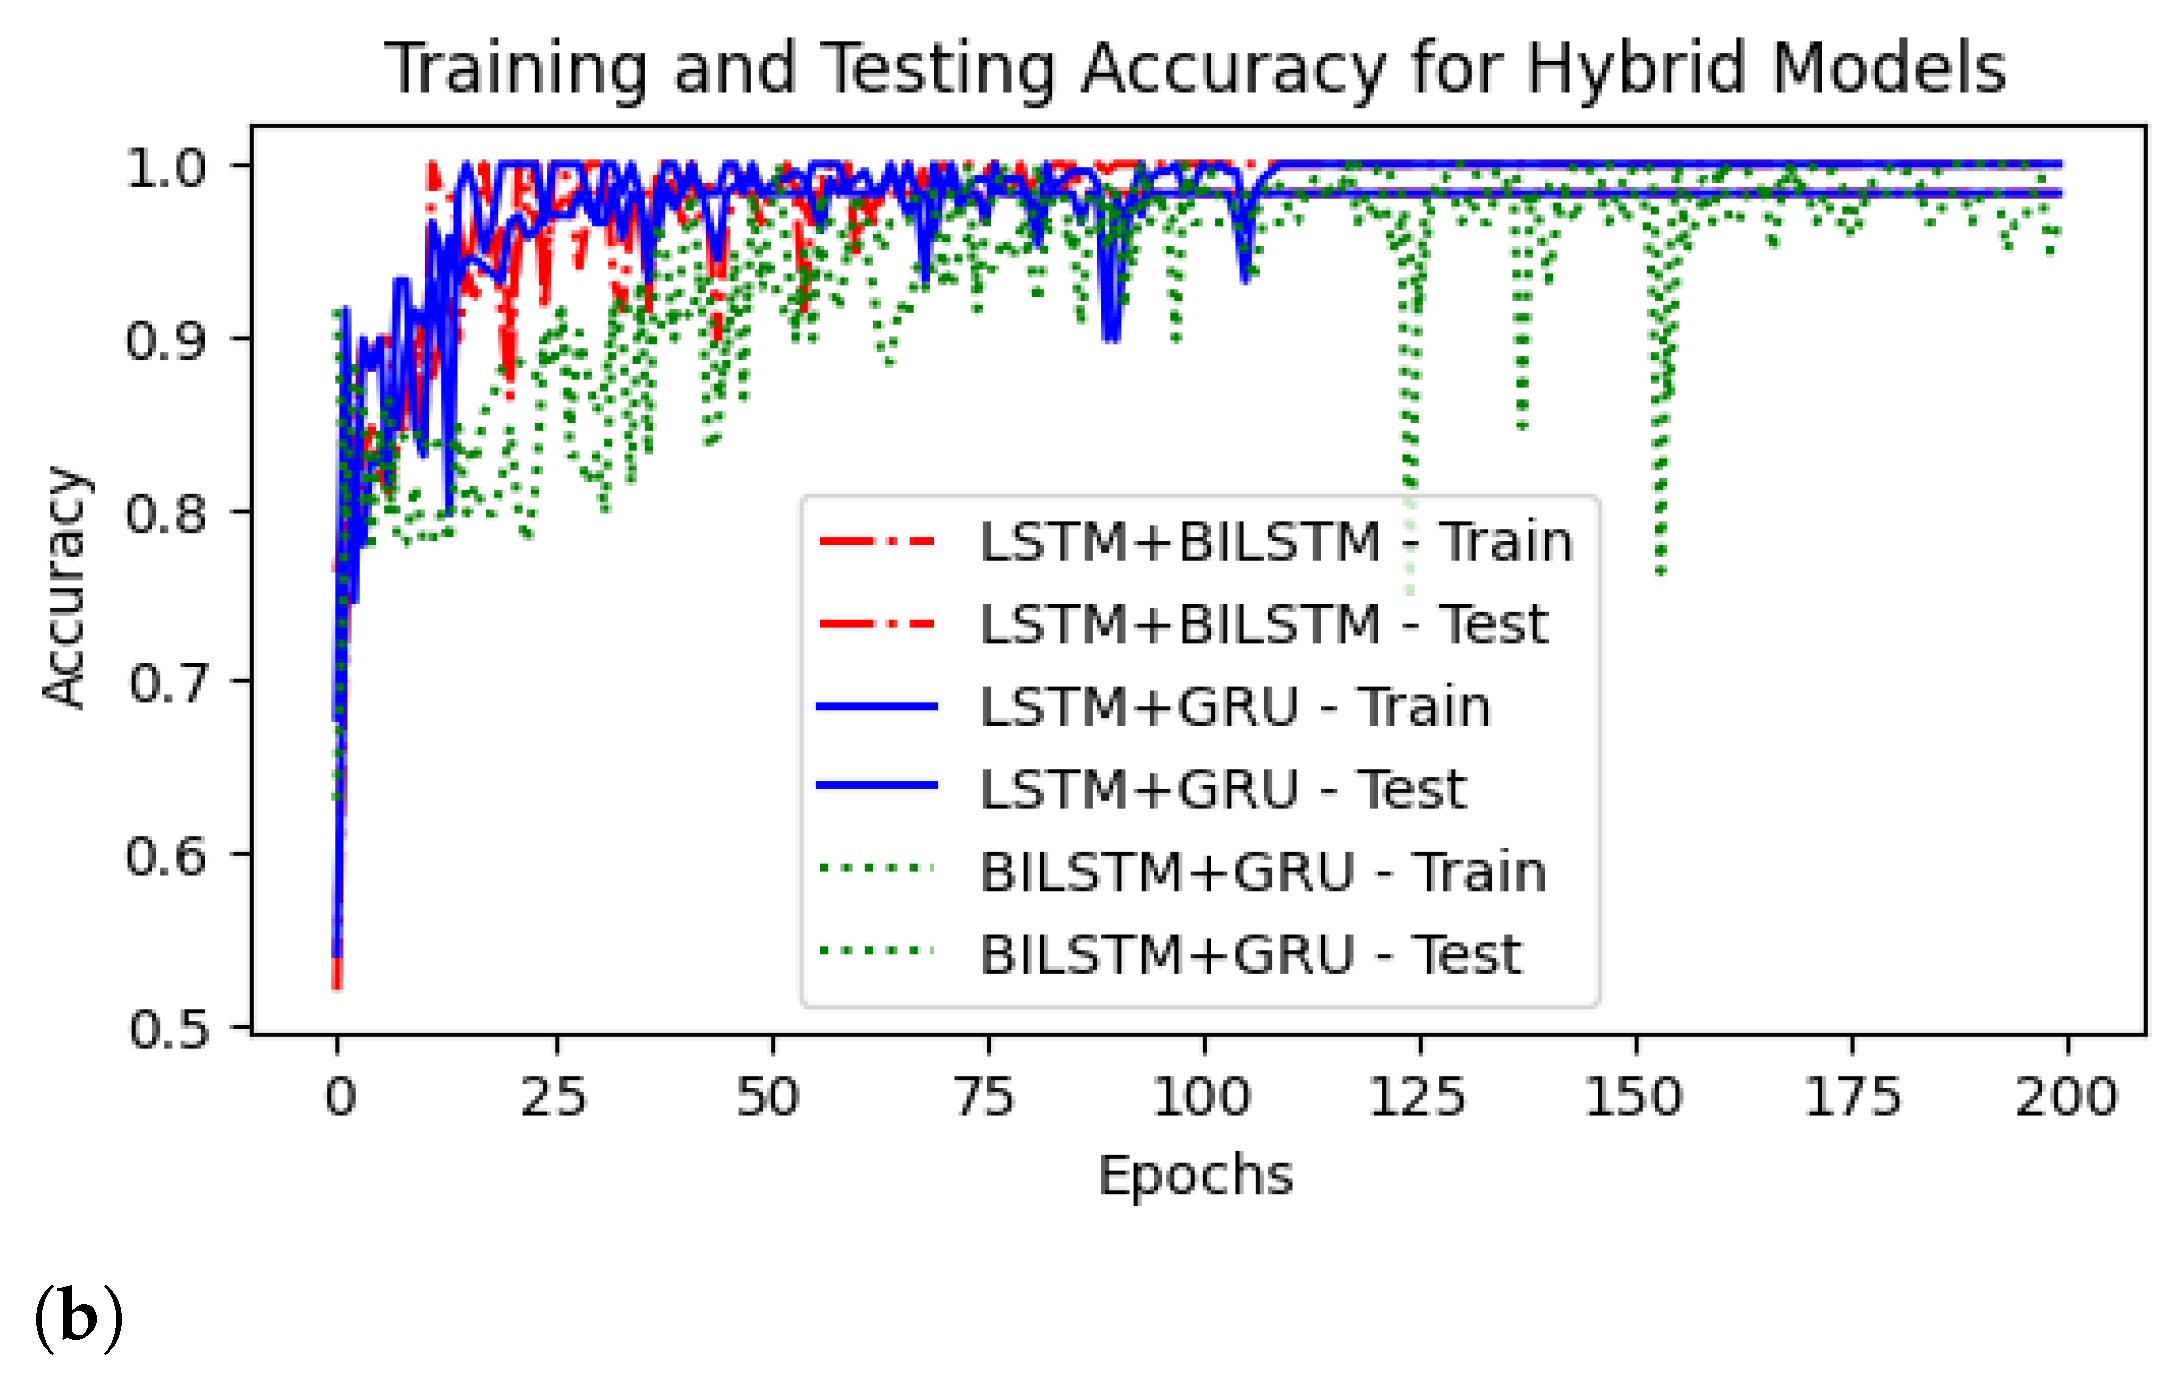
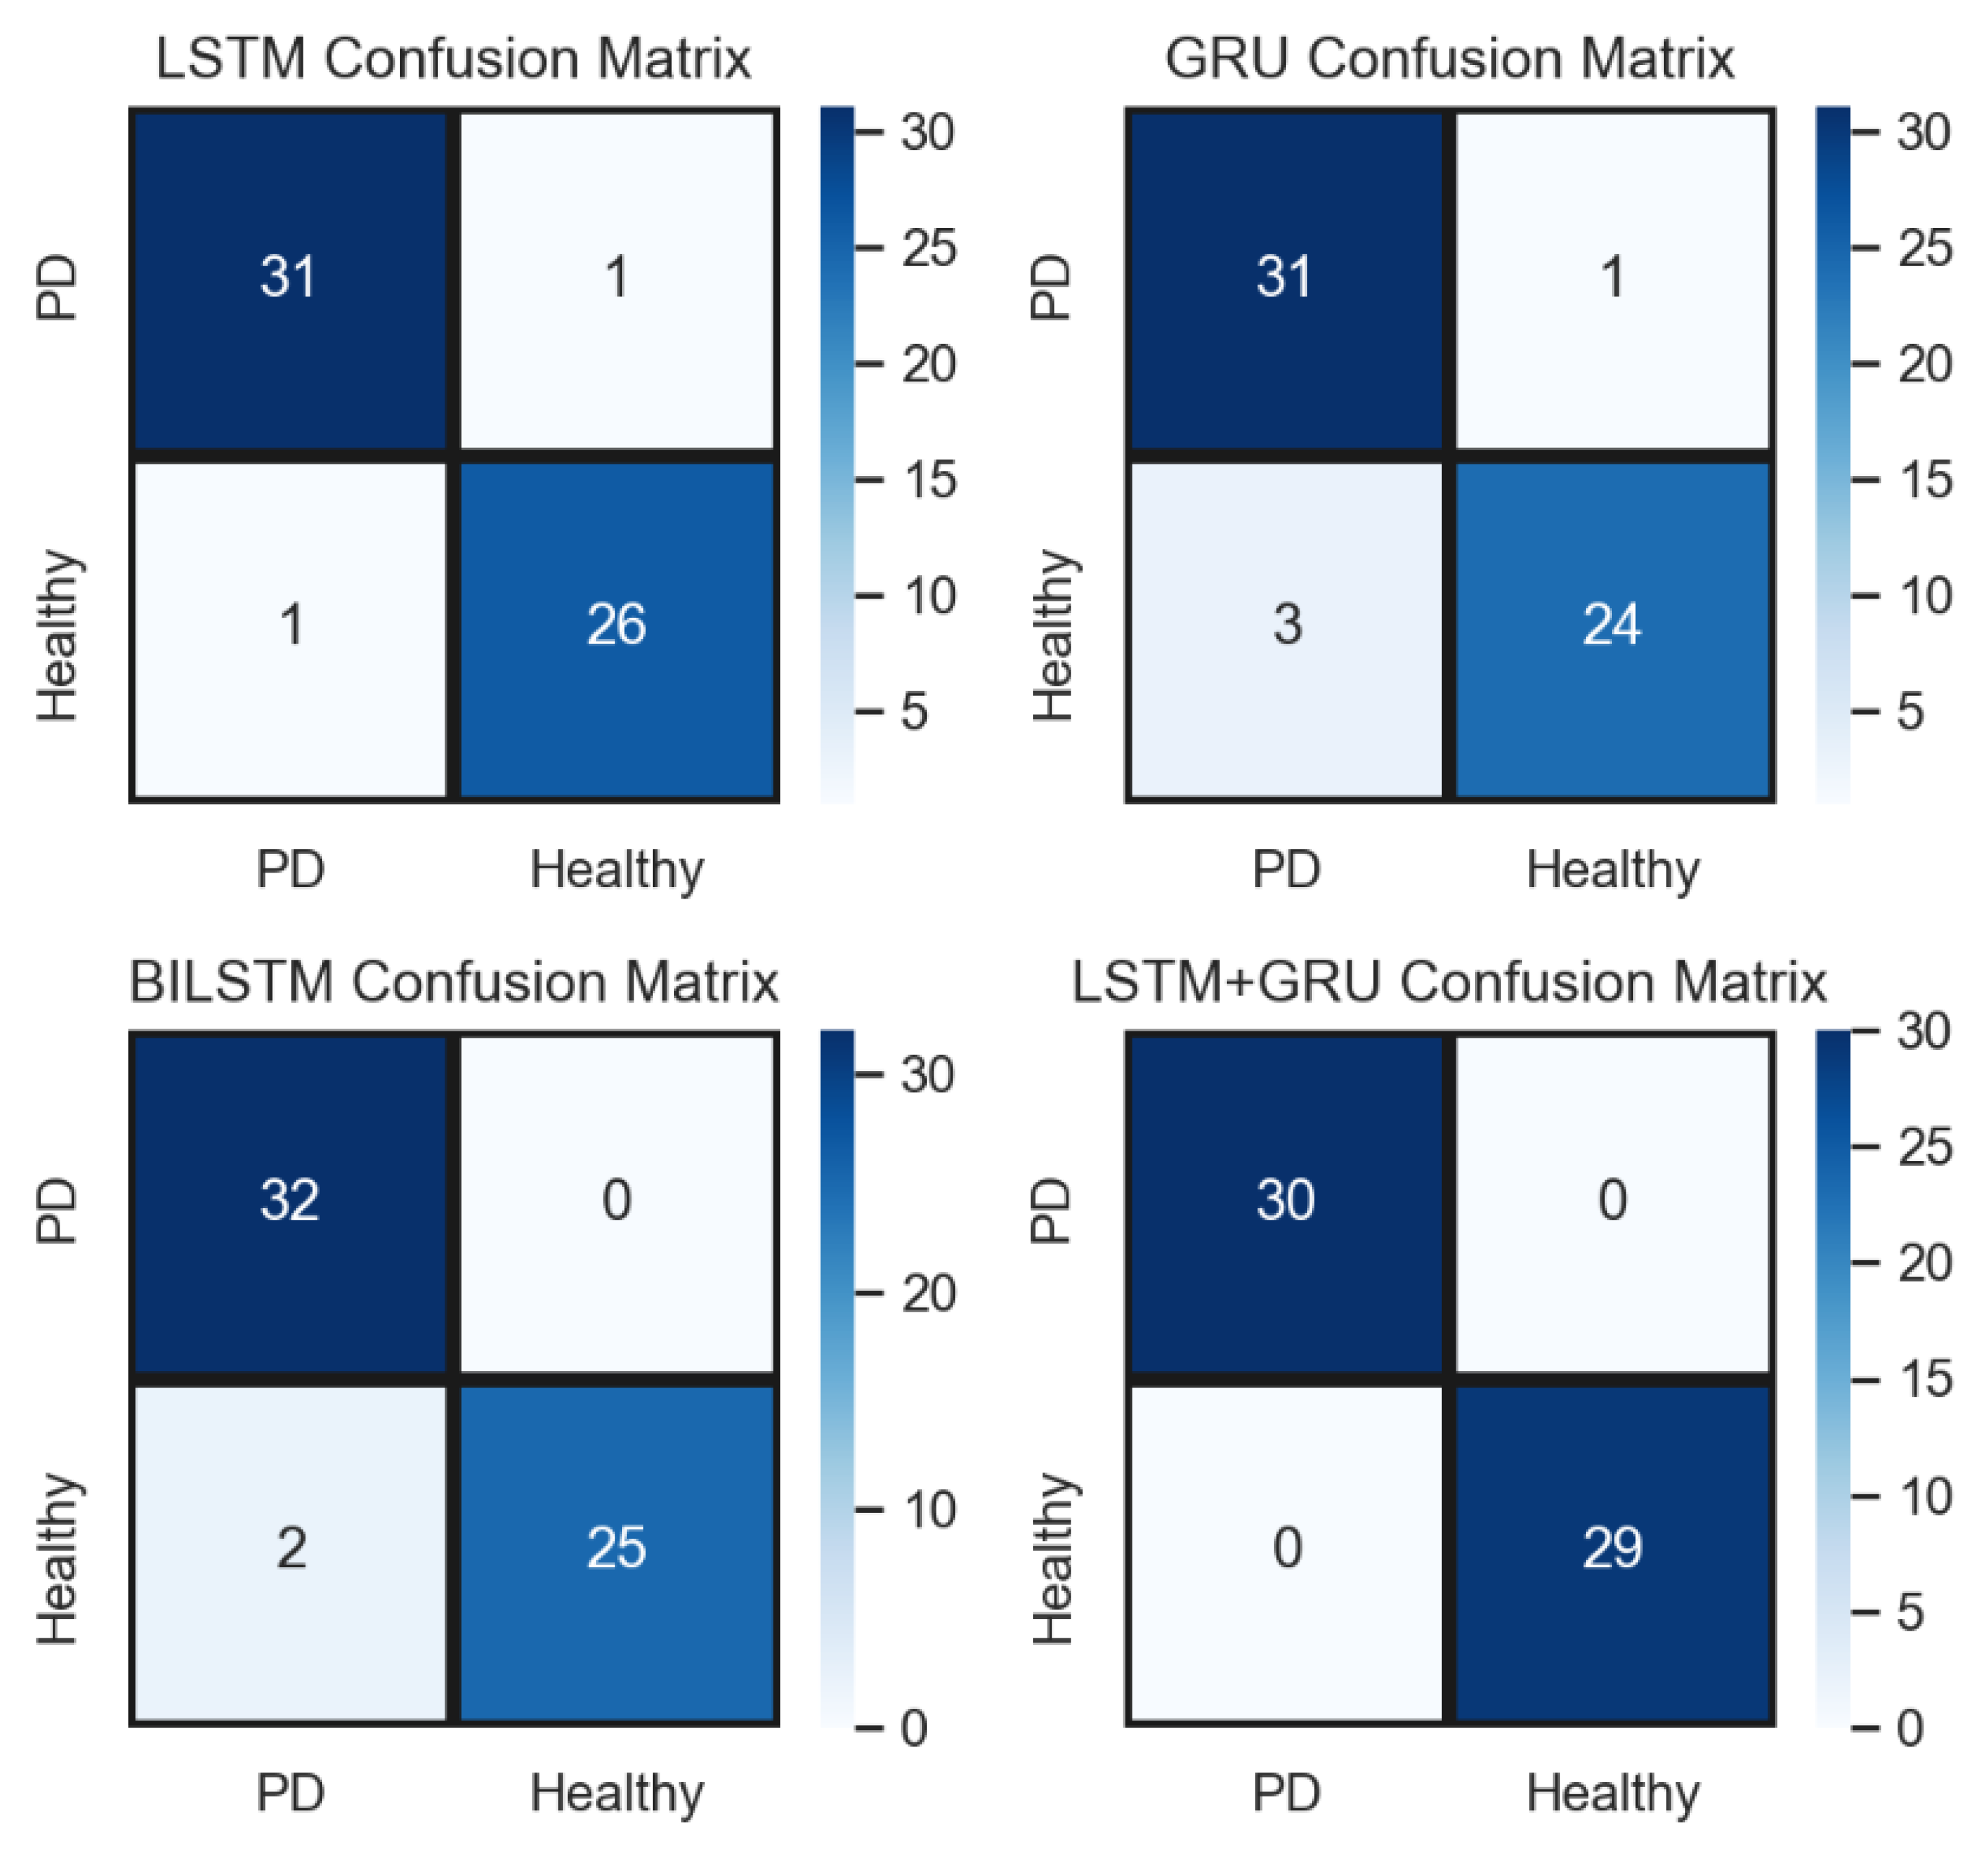
4.2. Performance of Hybrid Models Using Different Sampling Techniques on % (70:30) Dataset

In first case, we performed anexperiment analysis of hybrid deep learning models using the original dataset. Table 6 shows the performance of LSTM+GRU, BILSTM+GRU and LSTM+BILSTM on the original dataset with binary classes (PD and Healthy). Different performance metrics are utilised to check the performance of these models. The best accuracy is achieved by LSTM+GRU at 95%, which is highest for detecting Parkinson’s disease. The LSTM+BILSTM model performed very poorly on the original dataset. In the second case, we used a randomly oversampled dataset to conduct an experiment analysis on a DL model. To evaluate the effectiveness of these models, many performance metrics are used. The accuracy score for LSTM+GRU and BILSTM+GRU are the same but other metrics are different. With a detection rate of 100% for recall, the LSTM+GRU has the highest accuracy for detecting Parkinson’s disease. On the oversampled dataset, the LSTM+BILSTM model also did not perform well at all.
The performance of various models is also evaluated using a balanced dataset with an undersampling technique. The results obtained demonstrate that DL does not perform well using Undersampled data when compared with original and Oversampled data. With undersampling, DL attained the lowest 93% accuracy score and highest 96% score. On the Parkinson’s disease dataset, we applied a different oversampling method called synthetic minority oversampling to efficiently and quickly detect the disease. Table 6 demonstrates that DL models have made some advancements over the balanced dataset with SMOTE.
The performance of hybrid models are more outstanding than single models. In Table 7, LSTM+GRU achieved 95% accuracy using both the original dataset and the balanced dataset with the random undersampling technique. Using a balanced dataset with SMOTE and random oversampling, LSTM+GRU achieved 100% accuracy and 98% accuracy, respectively. Results demonstrate that single models are less accurate than hybrid models. A single LSTM model attained 89% accuracy; when we combined LSTM with GRU, they attained 95% accuracy. The hybrid model achieved 3% greater accuracy as compared to the single model. Table 8 shows the results of hybrid models using different sampling techniques on the training dataset.
Table 9 demonstrates the time consumption of deep learning using balanced data with the SMOTE oversampling technique and the random oversampling technique. The training and detection times for single-DL models such as LSTM, GRU and BILSTM are 110, 135 and 140 s, respectively. Hybrid DL models such as LSTM+GRU take 150 s to train and detect the disease; BILSTM+GRU takes 165 s; and LSTM+BILSTM takes 211 s. On balanced data with the SMOTE technique, LSTM+BLSTM takes too much time. The proposed model, based on random oversampled data, takes 170 s to detect the disease. The proposed model is computationally efficient and yields accurate detections.

4.3. ROC Curves

The true Positive rate (tpr) and the false Positive rate (fpr) are displayed against one another on the ROC curve for different threshold values [38]. TPR is the ratio of instances correctly identified as positive to all positive instances, whereas FPR is the ratio of instances wrongly labeled as negative to all negative cases. The upper-left corner of the ROC curve would be occupied by a classifier with a tpr of 1 and an fpr of 0. The general effectiveness of the classifier can be assessed using the area under the ROC curve, or AUC. An ideal classifier has an area under the curve (AUC) of 1, whereas a random classifier has an AUC of 0.5. If the AUC is higher, it means that the performance of discriminating between positive and negative events has improved.
Figure 6a shows the ROC curves of hybrid models using the original dataset. The LSTM+BILSTM model achieved 0.96 AUC, LSTM+GRU achieved 0.90 AUC and BILSTM+GRU achieved 0.94 AUC. Figure 6b,c shows that using SMOTE and random oversampling techniques on the original dataset, the hybrid model achieved 1.00 AUC. The undersampled dataset achieved a 0.98 highest AUC and 0.95 lowest AUC in Figure 6d. The ROC curve proved that undersampled and original datasets do not provide accurate results, whereas random oversampling and SMOTED datasets achieved an excellent 1.00 AUC.

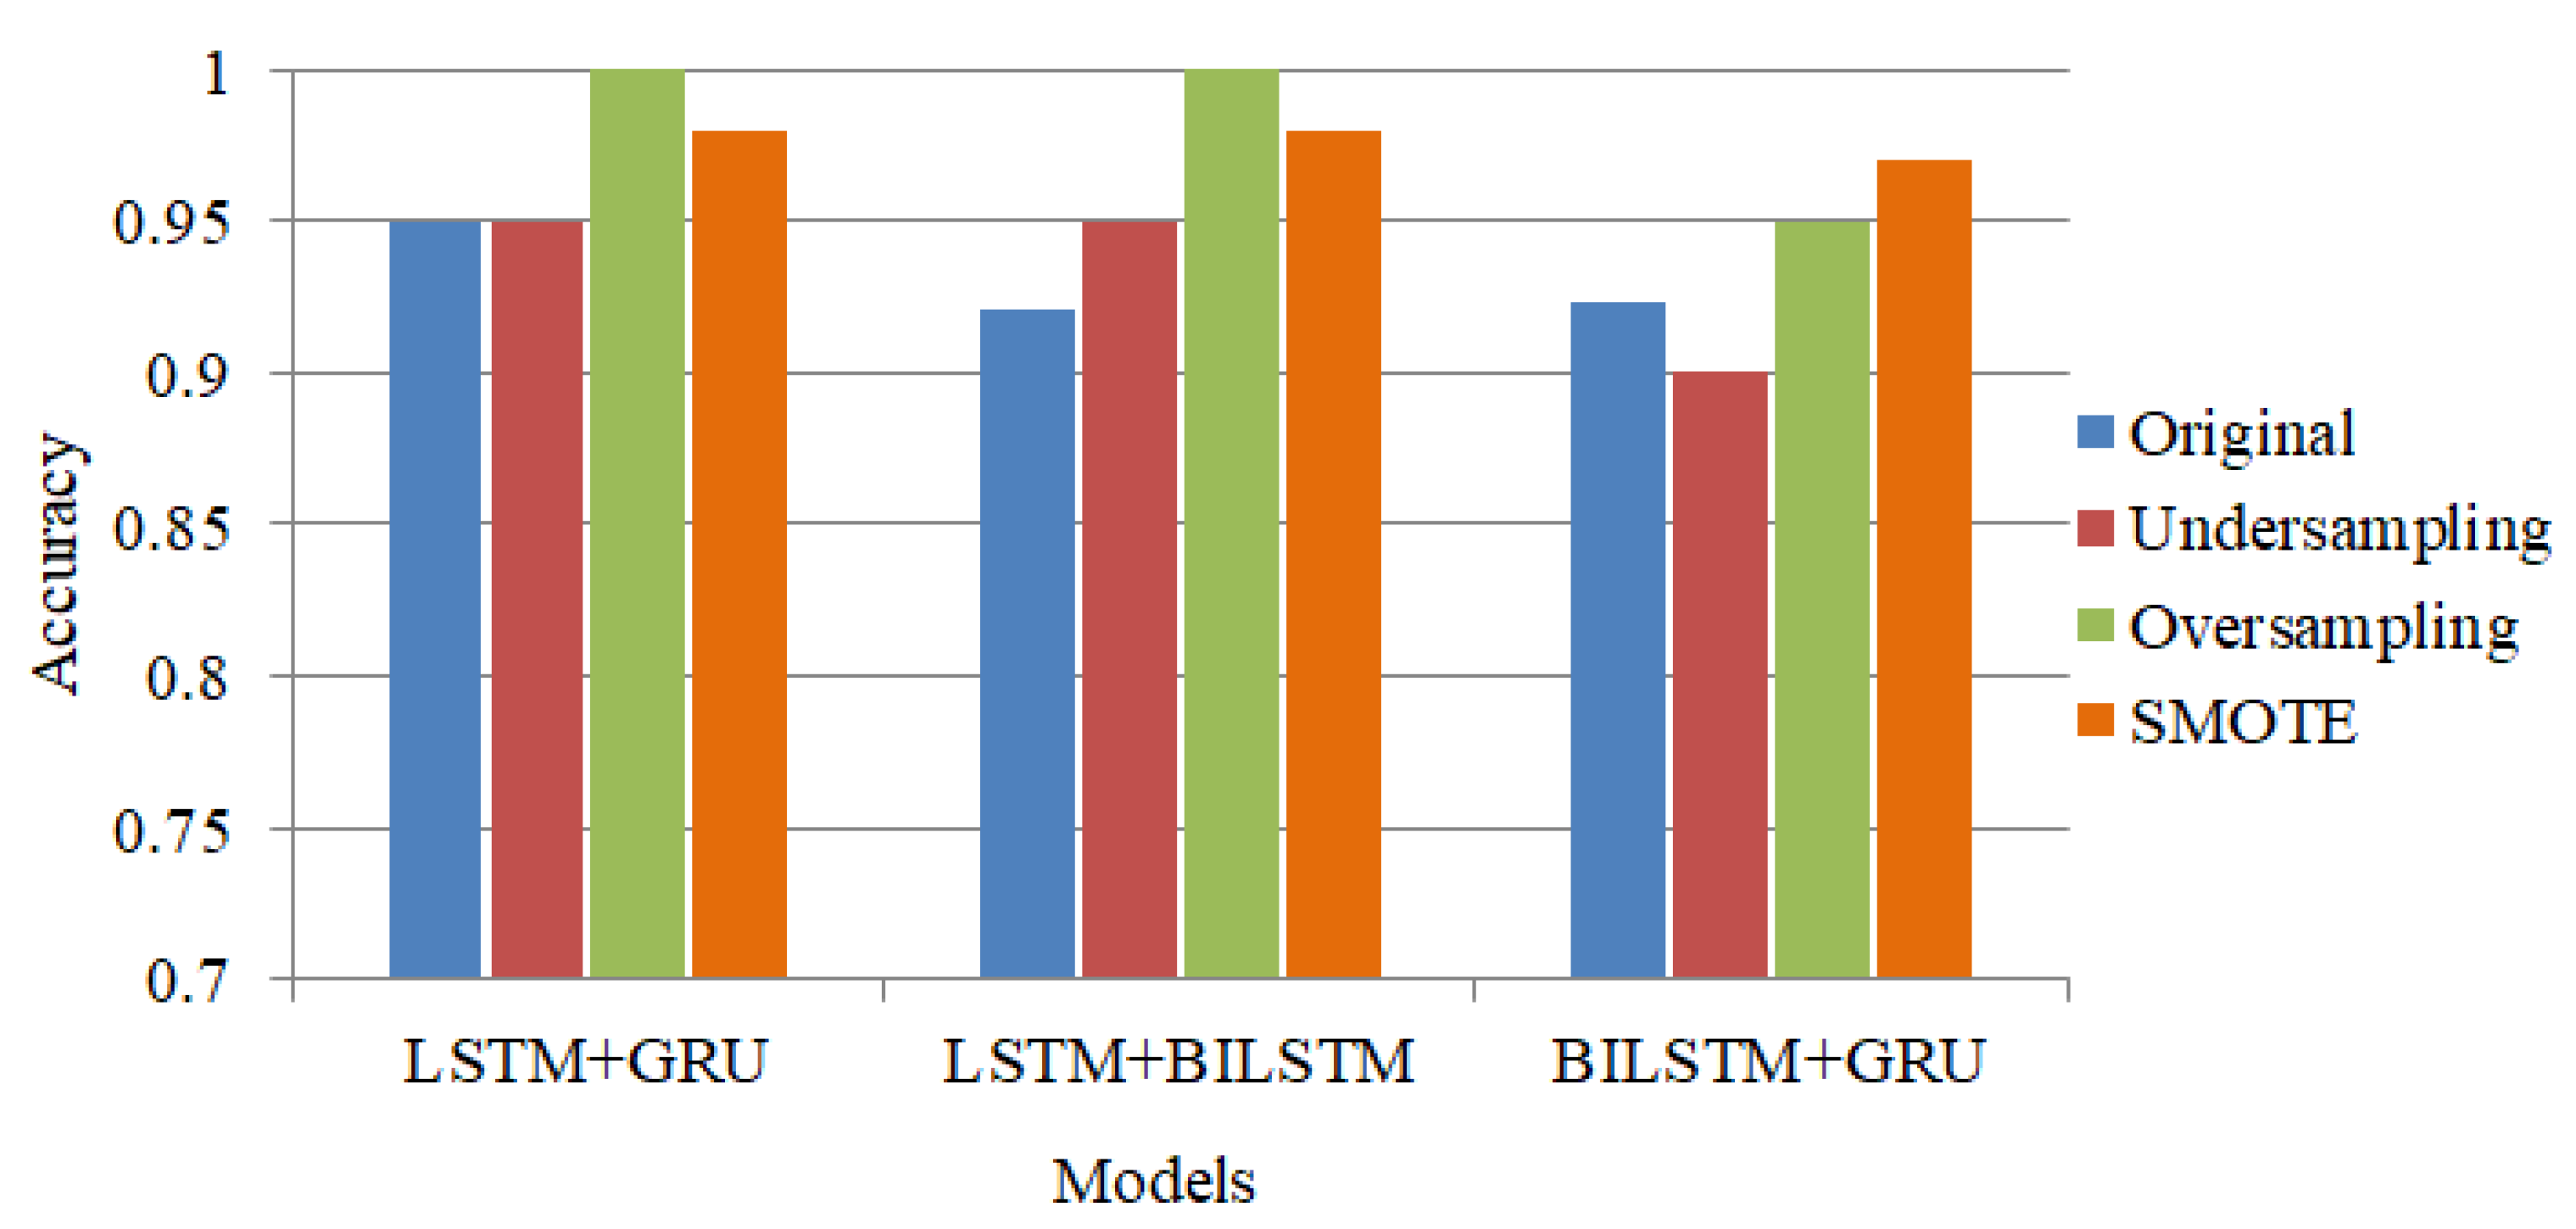
4.4. Comparison Results of Hybrid Models Using Different Sampling Techniques

Imbalanced datasets have a negative impact on the efficacy of Arabic tweet classification models. This is because these models tend to support the majority class and have difficulties accurately classifying instances that belong to the minority-class. Employing sampling techniques, which provide training data that is more representative and more balanced, increases the performance of the model, allowing-it to efficiently learn from the classes. Figure 7 indicates the performance comparison of sampling techniques used in this study with hybrid models. Figure 7 shows that the hybrid model performance is outclassed on balanced datasets using random oversampling and SMOTE oversampling techniques.
These models do not perform well on the original and undersampled datasets. With undersampling, some data from the majority-class are lost and the size of training-data are reduced that cause low model accuracy; the chance of overfitting increases. The undersampling technique is not suitable to address class imbalance issues in text classification. Figure 8 demonstrates the train and test accuracy for individual and hybrid DL models with a balanced dataset.
Figure 9 presents the confusion matrix results using the balanced dataset with a random oversampling technique. The LSTM model achieved two wrong predictions, the GRU achieved four wrong predictions and the BILST model also achieved two wrong predictions. The proposed LSTM+GRU model achieved 59 correct predictions from a total of 59 predictions, with no wrong predictions.

4.5. Comparative Results of Proposed Hyrbrid Model with the State-of-the-Art Studies

Several studies in the literature used multiple individual DL models, and some studies used ensembles of various DL models and an ANN model to obtain more accurate results for Parkinson’s disease detection. Table 10 presents the comparison of our proposed hybrid model with previous studies to assess the proposed approach. For example, in order to predict Parkinson’s disease using 42 preprocessed speech samples, Grover et al. [24] created a deep neural network. However, in 2018, the 81% accuracy is quite low. They demonstrated that their technique achieved greater accuracy than earlier accuracies. They did not use any oversampling or augmentation technique to balance the dataset and enhance the performance of DNN. Quan et al. [25] employed two LSTM layers, units 20 and 200; each make up the bidirectional deep learning LSTM model. Adagrad had 58 input dimensions, and a 0.1 learning rate was used for the BiLSTM model. With an 81% F1 score, the authors had an accuracy of 75%. For the purpose of detecting Parkinson’s disease using voice sounds, Oh et al. [26] used a 13-layer CNN deep model. To conduct the experiment, they needed a dataset of 20 patients. While making predictions, their model had an accuracy rate of 88% and made 361 errors. Voice signals were employed by Wodzinski et al. [27] in their LSTM model to forecast the PD illness. A total of 100 patients (50 healthy and 50 unwell) contributed to the dataset. They processed the dataset, applied a deep model and achieved 91% accuracy. Previous studies demonstrated lower detection accuracy and were not efficient. Comparison with previous studies demonstrate that the proposed hybrid model shows better results for Parkinson’s disease detection, with 98% accuracy.

4.6. Discussion and Limitations

The experimental design is conducted using multiple deep learning and hybird models, including three sampling techniques (random oversampling, undersampling and SMOTE oversampling) to balance the dataset classes. Random oversampling is a technique for creating classes with a more uniform distribution that entails duplicating instances from the minority class at random. SMOTE generates new minority-class instances based on existing instances. The method selects a minority class member and then identifies its k closest neighbors in the feature space. Undersampling can result in the loss of crucial data that could have contributed to the development of an effective model. First, we conduct experiments on an imbalanced dataset and observe that DL models also performed worse in the imbalanced case, and hybrid models achieved some better results. Second, we balance the dataset using the SMOTE oversampling technique, and hybrid models provide 97% more accurate detection than other models. Thirdly, we balanced the dataset using the random oversampling technique and achieved 98% through our proposed model.
Results demonstrate that the undersampling technique does not provide better results as compared to the oversampling technique for detecting Parkinson’s disease using Dl, and hybrids of the LSTM+GRU model. Oversampling techniques are proven to be more helpful for increasing the performance of models. Figure 6 showed a 0.90 ROC-AUC for LSTM+GRU on imbalanced data; 0.95 ROC-AUC on balanced data with undersampling technique. Balanced data with oversampling techniques attained a 1.00 ROC-AUC score. Figure 8 demonstrated that hybrid models performed better than individual Dl models. The LSTM model provided two wrong predictions, the GRU model provided three wrong predictions, and when combining these two models, they achieved 59 correct predictions and made no mistakes in detecting the disease. The proposed model attained 98% accuracy on oversampled, 97% on SMOTE, and 95% on undersampled datasets. Comparative analysis demonstrated that oversampling techniques are proven to be more helpful for increasing the performance of models.
This study has some limitations, one of which is the proposed model’s utilization of every feature, which could be identified as a limitation. We did not follow any particular technique when selecting the features. Additionally, the collected dataset contains fewer features; we applied sampling techniques to enhance the samples of the dataset that might lead to generalization errors and biases. These cannot be effectively trained using deep learning models.

5. Conclusions

The early detection of Parkinson’s disease is one of the most challenging tasks in medical research. This study proposed a hybrid deep learning approach (LSTM+GRU) to detect early Parkinson’s disease automatically. The Gated recurrent unit (GRU) achieved 92% accuracy, and LSTM+GRU achieved 95% accuracy on imbalanced datasets. Using the random oversampling technique, LSTM achieved 97% accuracy, and LSTM+GRU achieved 100% accuracy. Using the SMOTE technique, LSTM+GRU achieved 98% accuracy. Results suggest that deep learning models performed better. In addition, the proposed hybrid model achieved excellent, accurate results for Parkinson’s disease detection. The proposed hybrid model is 100% accurate in detection with the balanced dataset, enhancing the detection accuracy and minimizing generalization errors. Our proposed model successfully distinguishes between PD and healthy patients with outclass performance accuracy. Comparing hybrid models to four DL individual models, hybrid models offer a superior performance.
In the future, to extract the majority of important features from the dataset in order to detect Parkinson’s disease, we will investigate more advanced feature selection techniques, as well as evaluate the results using an independent dataset to determine the method’s robustness and reliability. Second, we we will strengthen existing data by combining two or more datasets in order to predict Parkinson’s disease.

Author Contributions

Conceptualization, A.R. and T.S.; methodology, M.M. and T.S.; software, A.R.; validation, A.R., F.S.A., N.E. and T.S.; formal analysis, M.M., N.E. and A.R.; investigation, A.R.; resources, A.R.; writing—original draft, M.M. and A.R.; writing—review and editing, M.M., N.E. and T.S.; visualization, F.S.A.; supervision, A.R.; project administration, T.S. All authors have read and agreed to the published version of the manuscript.

Funding

This research was funded by Princess Nourah bint Abdulrahman University and Researchers Supporting Project number (PNURSP2023R346), Princess Nourah bint Abdulrahman University, Riyadh, Saudi Arabia.

Data Availability Statement

Not applicable.

Acknowledgments

This research was funded by Princess Nourah bint Abdulrahman University and Researchers Supporting Project number (PNURSP2023R346), Princess Nourah bint Abdulrahman University, Riyadh, Saudi Arabia. This work was also supported by the Project [A Hybrid Color Space Transformation Saliency Model for Lesion Segmentation]; Prince Sultan University; Saudi Arabia [SEED-119-2022]. The authors are also thankful for the support of Artificial Intelligence & Data Analytics Lab (AIDA) CCIS Prince Sultan University, Riyadh, Saudi Arabia.

Conflicts of Interest

The authors declare no conflict of interest.

References

  1. Poewe, W.; Seppi, K.; Tanner, C.; Halliday, G.; Brundin, P.; Volkmann, J.; Schrag, A.; Lang, A. Parkinson disease. Nat. Rev. Dis. Prim. 2017, 3, 17013. [Google Scholar] [CrossRef] [PubMed]
  2. Hopes, L.; Grolez, G.; Moreau, C.; Lopes, R.; Ryckewaert, G.; Carrière, N.; Auger, F.; Laloux, C.; Petrault, M.; Devedjian, J.C.; et al. Magnetic resonance imaging features of the nigrostriatal system: Biomarkers of Parkinson’s disease stages? PLoS ONE 2016, 11, e0147947. [Google Scholar] [CrossRef] [Green Version]
  3. Chaudhuri, K.R.; Schapira, A.H. Non-motor symptoms of Parkinson’s disease: Dopaminergic pathophysiology and treatment. Lancet Neurol. 2009, 8, 464–474. [Google Scholar] [CrossRef]
  4. Cheng, H.C.; Ulane, C.M.; Burke, R.E. Clinical progression in Parkinson disease and the neurobiology of axons. Ann. Neurol. 2010, 67, 715–725. [Google Scholar] [CrossRef] [PubMed]
  5. Pringsheim, T.; Jette, N.; Frolkis, A.; Steeves, T.D. The prevalence of Parkinson’s disease: A systematic review and meta-analysis. Mov. Disord. 2014, 29, 1583–1590. [Google Scholar] [CrossRef]
  6. Shivangi; Johri, A.; Tripathi, A. Parkinson disease detection using deep neural networks. In Proceedings of the 2019 Twelfth International Conference on Contemporary Computing (IC3), Noida, India, 8–10 August 2019; pp. 1–4. [Google Scholar]
  7. Singh, N.; Pillay, V.; Choonara, Y.E. Advances in the treatment of Parkinson’s disease. Prog. Neurobiol. 2007, 81, 29–44. [Google Scholar] [CrossRef] [PubMed]
  8. Sakar, C.O.; Kursun, O. Telediagnosis of Parkinson’s disease using measurements of dysphonia. J. Med. Syst. 2010, 34, 591–599. [Google Scholar] [CrossRef]
  9. Ali, N.A.; Abbassi, A.E.; Cherradi, B. The performances of iterative type-2 fuzzy C-mean on GPU for image segmentation. J. Supercomput. 2022, 78, 1583–1601. [Google Scholar] [CrossRef]
  10. Ali, N.A.; Cherradi, B.; El Abbassi, A.; Bouattane, O.; Youssfi, M. New parallel hybrid implementation of bias correction fuzzy C-means algorithm. In Proceedings of the 2017 International Conference on Advanced Technologies for Signal and Image Processing (ATSIP), Fez, Morocco, 22–24 May 2017; pp. 1–6. [Google Scholar]
  11. Aitali, N.; Cherradi, B.; El Abbassi, A.; Bouattane, O.; Youssfi, M. GPU based implementation of spatial fuzzy c-means algorithm for image segmentation. In Proceedings of the 2016 4th IEEE International Colloquium on Information Science and Technology (CiSt), Tangier, Morocco, 24–26 October 2016; pp. 460–464. [Google Scholar]
  12. Ait Ali, N.; Cherradi, B.; El Abbassi, A.; Bouattane, O.; Youssfi, M. GPU fuzzy c-means algorithm implementations: Performance analysis on medical image segmentation. Multimed. Tools Appl. 2018, 77, 21221–21243. [Google Scholar] [CrossRef]
  13. Aitali, N.; Cherradi, B.; Bouattane, O.; Youssfi, M.; Raihani, A. New fine-grained clustering algorithm on GPU architecture for bias field correction and MRI image segmentation. In Proceedings of the 2015 27th International Conference on Microelectronics (ICM), Casablanca, Morocco, 20–23 December 2015; pp. 118–121. [Google Scholar]
  14. Dolz, J.; Desrosiers, C.; Ayed, I.B. 3D fully convolutional networks for subcortical segmentation in MRI: A large-scale study. NeuroImage 2018, 170, 456–470. [Google Scholar] [CrossRef] [Green Version]
  15. Ghafoorian, M.; Karssemeijer, N.; Heskes, T.; van Uden, I.W.; Sanchez, C.I.; Litjens, G.; de Leeuw, F.E.; van Ginneken, B.; Marchiori, E.; Platel, B. Location sensitive deep convolutional neural networks for segmentation of white matter hyperintensities. Sci. Rep. 2017, 7, 5110. [Google Scholar] [CrossRef]
  16. Wang, S.H.; Phillips, P.; Sui, Y.; Liu, B.; Yang, M.; Cheng, H. Classification of Alzheimer’s disease based on eight-layer convolutional neural network with leaky rectified linear unit and max pooling. J. Med. Syst. 2018, 42, 85. [Google Scholar] [CrossRef]
  17. Younis Thanoun, M.; Yaseen, M.T. A comparative study of Parkinson disease diagnosis in machine learning. In Proceedings of the 2020 the 4th International Conference on Advances in Artificial Intelligence, London, UK, 9–11 October 2020; pp. 23–28. [Google Scholar]
  18. Elhassan, T.; Aljurf, M. Classification of imbalance data using tomek link (t-link) combined with random under-sampling (rus) as a data reduction method. Glob. J. Technol. Optim. S 2016, 1, 2016. [Google Scholar]
  19. Fan, S.; Sun, Y. Early Detection of Parkinson’s Disease using Machine Learning and Convolutional Neural Networks from Drawing Movements. Comput. Sci. Inf. Technol. 2022, 12, 291–301. [Google Scholar]
  20. Aşuroğlu, T.; Oğul, H. A deep learning approach for parkinson’s disease severity assessment. Health Technol. 2022, 12, 943–953. [Google Scholar] [CrossRef]
  21. Chintalapudi, N.; Battineni, G.; Hossain, M.A.; Amenta, F. Cascaded Deep Learning Frameworks in Contribution to the Detection of Parkinson’s Disease. Bioengineering 2022, 9, 116. [Google Scholar] [CrossRef] [PubMed]
  22. Polat, K. A hybrid approach to Parkinson disease classification using speech signal: The combination of smote and random forests. In Proceedings of the 2019 Scientific Meeting on Electrical-Electronics & Biomedical Engineering and Computer Science (EBBT), Istanbul, Turkey, 24–26 April 2019; pp. 1–3. [Google Scholar]
  23. Caliskan, A.; Badem, H.; Basturk, A.; Yuksel, M. Diagnosis of the parkinson disease by using deep neural network classifier. IU-J. Electr. Electron. Eng. 2017, 17, 3311–3318. [Google Scholar]
  24. Grover, S.; Bhartia, S.; Yadav, A.; Seeja, K. Predicting severity of Parkinson’s disease using deep learning. Procedia Comput. Sci. 2018, 132, 1788–1794. [Google Scholar] [CrossRef]
  25. Quan, C.; Ren, K.; Luo, Z. A deep learning based method for Parkinson’s disease detection using dynamic features of speech. IEEE Access 2021, 9, 10239–10252. [Google Scholar] [CrossRef]
  26. Oh, S.L.; Hagiwara, Y.; Raghavendra, U.; Yuvaraj, R.; Arunkumar, N.; Murugappan, M.; Acharya, U.R. A deep learning approach for Parkinson’s disease diagnosis from EEG signals. Neural Comput. Appl. 2020, 32, 10927–10933. [Google Scholar] [CrossRef]
  27. Wodzinski, M.; Skalski, A.; Hemmerling, D.; Orozco-Arroyave, J.R.; Nöth, E. Deep learning approach to Parkinson’s disease detection using voice recordings and convolutional neural network dedicated to image classification. In Proceedings of the 2019 41st Annual International Conference of the IEEE Engineering in Medicine and Biology Society (EMBC), Berlin, Germany, 23–27 July 2019; pp. 717–720. [Google Scholar]
  28. Little, M.; McSharry, P.; Hunter, E.; Spielman, J.; Ramig, L. Suitability of dysphonia measurements for telemonitoring of Parkinson’s disease. Nat. Preced. 2008. [Google Scholar] [CrossRef]
  29. Quan, C.; Ren, K.; Luo, Z.; Chen, Z.; Ling, Y. End-to-end deep learning approach for Parkinson’s disease detection from speech signals. Biocybern. Biomed. Eng. 2022, 42, 556–574. [Google Scholar] [CrossRef]
  30. Yasar, A.; Saritas, I.; Sahman, M.; Cinar, A. Classification of Parkinson disease data with artificial neural networks. IOP Conf. Ser. Mater. Sci. Eng. 2019, 675, 012031. [Google Scholar] [CrossRef]
  31. Li, K.; Ao, B.; Wu, X.; Wen, Q.; Ul Haq, E.; Yin, J. Parkinson’s disease detection and classification using EEG based on deep CNN-LSTM model. Biotechnol. Genet. Eng. Rev. 2023. [Google Scholar] [CrossRef] [PubMed]
  32. Ma, Y.W.; Chen, J.L.; Chen, Y.J.; Lai, Y.H. Explainable deep learning architecture for early diagnosis of Parkinson’s disease. Soft Comput. 2023, 27, 2729–2738. [Google Scholar] [CrossRef]
  33. Staudemeyer, R.C.; Morris, E.R. Understanding LSTM–a tutorial into long short-term memory recurrent neural networks. arXiv 2019, arXiv:1909.09586. [Google Scholar]
  34. Dey, R.; Salem, F.M. Gate-variants of gated recurrent unit (GRU) neural networks. In Proceedings of the 2017 IEEE 60th International Midwest Symposium on Circuits and Systems (MWSCAS), Boston, MA, USA, 6–9 August 2017; pp. 1597–1600. [Google Scholar]
  35. Shelke, M.S.; Deshmukh, P.R.; Shandilya, V.K. A review on imbalanced data handling using undersampling and oversampling technique. Int. J. Recent Trends Eng. Res. 2017, 3, 444–449. [Google Scholar]
  36. Fernández, A.; Garcia, S.; Herrera, F.; Chawla, N.V. SMOTE for learning from imbalanced data: Progress and challenges, marking the 15-year anniversary. J. Artif. Intell. Res. 2018, 61, 863–905. [Google Scholar] [CrossRef]
  37. Abunadi, I. Deep and hybrid learning of MRI diagnosis for early detection of the progression stages in Alzheimer’s disease. Connect. Sci. 2022, 34, 2395–2430. [Google Scholar] [CrossRef]
  38. Eltahir, M.M.; Abunadi, I.; Al-Wesabi, F.N.; Hilal, A.M.; Yousif, A.; Motwakel, A.; Al Duhayyim, M.; Hamza, M.A. Optimal Hybrid Feature Extraction with Deep Learning for COVID-19. Comput. Mater. Contin. 2022, 71, 6257–6273. [Google Scholar] [CrossRef]
  39. Abdullah, S.M.; Abbas, T.; Bashir, M.H.; Khaja, I.A.; Ahmad, M.; Soliman, N.F.; El-Shafai, W. Deep Transfer Learning Based Parkinson’s Disease Detection Using Optimized Feature Selection. IEEE Access 2023, 11, 3511–3524. [Google Scholar] [CrossRef]
Figure 1. Work Flow of Proposed Methodology.
Electronics 12 02856 g001
Figure 2. SMOTE Oversampling Scatter and Count Plot.
Electronics 12 02856 g002
Figure 3. Random Oversampling Scatter and Count Plot.
Electronics 12 02856 g003
Figure 4. Random undersampling Scatter and Count Plot.
Electronics 12 02856 g004
Figure 5. Hybrid Model Architecture.
Electronics 12 02856 g005
Figure 6. Receiver Operating Characteristic (ROC) Curves. (a) Using original data, (b) using SMOTE data, (c) using oversampled data and (d) using undersampled data.
Electronics 12 02856 g006
Figure 7. Comparison results of Hybrid Models using Different Sampling Techniques.
Electronics 12 02856 g007
Figure 8. Train and Test accuracy (a) shows the accuracy for Individual DL models; (b) shows the accuracy for Hybrid DL models, using Balanced Parkinson’s dataset.
Electronics 12 02856 g008aElectronics 12 02856 g008b
Figure 9. Confusion Matrix results using balanced dataset with random oversampling technique.
Electronics 12 02856 g009
Table 2. Description of Dataset.
Name and FeaturesDescription of Features
MDVP; Fo (Hz)[Average Vocal Fundamental Frequency]
MDVP; Fhi (Hz[Maximum Vocal Fundamental Frequency]
MDVP; Flo (Hz)[Minimum Vocal Fundamental Frequency]
MDVP; Jitter (%)[Several Measures of Variation in Fundamental Frequency,
Kay pentax multi-dimensional voice program as (%)]
MDVP; Jitter (Abs)[Kay pentax Multi-dimensional voice program Absolute
in Microseconds]
MDVP; RAP[Kay pentax Multi-dimensional voice program relative
amplitude perturbation]
MDVP; PPQ[Kay pentax Multi-dimensional voice program Five point
period perturbation]
Jitter; DDP[Difference of differences between Cycles and period]
MDVP; Shimmer,[Kay pentax Multi-dimensional voice program
shimmer local]
MDVP; Shimmer (dB)[Kay pentax Multi-dimensional voice program
shimmer in decibel’s]
Shimmer; APQ3[Kay pentax Multi-dimensional voice program
amplitude perturbation
quotient with three points]
MDVP; APQ[Eleven point Kay pentax Multi-dimensional
voice program amplitude
perturbation quotient]
Shimmer; APQ5[Five point Kay pentax Multi-dimensional
voice program amplitude
perturbation quotient]
Shimmer; DDA[Difference of differences between amplitude
and period]
NHR, HNR[Noise to harmonic ratio, Harmonic to noise ratio]
Status[Healthy (0) and Parkinson’s disease (1)]
RPDE[Re-currence period density Entropy]
DFA[Detrended fluctuation analysis]
spread1, spread2, PPE[Pitch period Entropy, the fundamental frequency
can be quantified in three nonlinear ways].
Table 3. Performance of DL models using Original Dataset.
ModelClassAccuracy ScorePrecision ScoreRecall ScoreF1 Score
NNPD0.870.800.570.67
Healthy0.910.970.94
LSTMPD0.890.800.570.67
Healthy0.910.970.94
BILSTMPD0.920.830.710.77
Healthy0.940.970.92
GRUPD0.920.830.710.77
Healthy0.940.970.95
Table 4. Performance of DL models using Balanced Dataset (With Random Oversampling Technique).
ModelClassAccuracy ScorePrecision ScoreRecall ScoreF1 Score
NNPD0.980.971.000.98
Healthy1.000.970.98
LSTMPD0.970.970.970.97
Healthy0.960.960.96
BILSTMPD0.970.941.000.97
Healthy1.000.930.96
GRUPD0.930.910.970.94
Healthy0.960.890.92
Table 5. Performance of DL models using Balanced Dataset (With SMOTE Technique).
ModelClassAccuracy ScorePrecision ScoreRecall ScoreF1 Score
NNPD0.981.000.970.98
Healthy0.971.000.98
LSTMPD0.970.941.000.97
Healthy1.000.930.96
BILSTMPD0.900.910.910.91
Healthy0.890.890.89
GRUPD0.950.940.970.95
Healthy0.960.930.94
Table 6. Performance of Hybrid models using different Sampling Techniques with % (70:30) dataset.
  Original DatasetBalanced Dataset
(With Random Oversampling Technique)
Model Class Accuracy Precision Recall F1 Score Accuracy Precision Recall F1 Score
LSTM+GRUPD0.950.950.920.960.980.961.000.98
Healthy0.940.910.951.000.950.97
BILSTM+GRUPD0.930.920.930.930.980.980.980.98
Healthy0.930.920.920.980.980.98
LSTM+BILSTMPD0.910.910.920.910.940.930.950.94
Healthy0.910.930.920.960.950.94
  Balanced Dataset
(With Random Undersampling Technique)
Balanced Dataset
(With SMOTE Oversampling Technique)
LSTM+GRUPD0.961.000.930.960.980.980.980.98
Healthy0.941.000.970.980.980.98
BILSTM+GRUPD0.930.930.930.930.960.930.970.95
Healthy0.930.930.930.980.940.96
LSTM+BILSTMPD0.930.930.930.930.940.900.970.94
Healthy0.930.930.930.980.920.95
Table 7. Performance of Hybrid models using different Sampling Techniques on whole dataset.
  Original DatasetBalanced Dataset
(With Random Oversampling Technique)
Model Class Accuracy Precision Recall F1 Score Accuracy Precision Recall F1 Score
LSTM+GRUPD0.951.000.710.831.001.001.001.00
Healthy0.941.000.971.001.001.00
BILSTM+GRUPD0.920.830.710.771.001.001.001.00
Healthy0.940.970.951.001.001.00
LSTM+BILSTMPD0.920.830.710.770.950.911.000.95
Healthy0.940.970.951.000.900.95
  Balanced Dataset
(With Random Undersampling Technique)
Balanced Dataset
(With SMOTE Oversampling Technique)
LSTM+GRUPD0.950.921.000.960.981.000.970.98
Healthy1.000.890.940.971.000.98
BILSTM+GRUPD0.950.921.000.960.981.000.970.98
Healthy1.000.890.940.971.000.98
LSTM+BILSTMPD0.900.910.910.910.971.000.930.97
Healthy0.890.890.890.941.000.97
Table 8. Performance of Hybrid models using different Sampling Techniques on Training set.
  Original DatasetBalanced Dataset
(With Random Oversampling Technique)
Model Class Accuracy Precision Recall F1 Score Accuracy Precision Recall F1 Score
LSTM+GRUPD0.941.000.790.860.980.970.970.98
Healthy0.910.970.930.961.000.96
BILSTM+GRUPD0.910.870.740.720.970.940.970.97
Healthy0.900.950.920.970.930.97
LSTM+BILSTMPD0.900.830.750.880.950.960.970.95
Healthy0.910.970.920.960.950.96
  Balanced Dataset
(With Random Undersampling Technique)
Balanced Dataset
(With SMOTE Oversampling Technique)
LSTM+GRUPD0.951.000.900.950.970.971.000.98
Healthy0.911.000.951.000.960.98
BILSTM+GRUPD0.950.921.000.960.970.970.970.98
Healthy1.000.890.940.960.950.96
LSTM+BILSTMPD0.910.910.910.910.960.960.970.96
Healthy0.890.890.890.960.950.96
Table 9. Time Consumption for DL models.
Random OversamplingSMOTE
ModelTime consumptionModelTime consumption
LSTM110 sLSTM120 s
GRU135 sGRU150 s
BILSTM140 sBILSTM130 s
LSTM+GRU150 sLSTM+GRU170 s
BILSTM+GRU165 sBILSTM+GRU185 s
LSTM+BILSTM211 sLSTM+BILSTM203 s
Table 10. Comparative results of Proposed Hyrbrid model with the state-of-the-art studies.
AuthorsDatasetModelAccuracy
Grover et al. [24]42 patientsDNN81%
Quan et al. [25]45 patientsRNN84%
Oh et al. [26]20 patientsCNN88%
Wodzinski et al. [27]100 patientsResNet90%
Abdullah et al. [39]-CNN95%
Yasir et al. [30]80 patientsANN95%
Caliskan et al. [23]31 patientsDNN94%
Yasir et al.80 patientsANN95%
Our Study31 patientsHybrid LSTM+GRU98%
Disclaimer/Publisher’s Note: The statements, opinions and data contained in all publications are solely those of the individual author(s) and contributor(s) and not of MDPI and/or the editor(s). MDPI and/or the editor(s) disclaim responsibility for any injury to people or property resulting from any ideas, methods, instructions or products referred to in the content.

