

Assessing Perceived Trust and Satisfaction with Multiple Explanation Techniques in XAI-Enhanced Learning Analytics

Abstract
:1. Introduction
2. Background and Related Work
2.1. Explainable Artificial Intelligence
2.2. XAI in Education
2.3. Measuring Trust and Satisfaction
2.4. Objective
- RQ1: What is the impact of diverse XAI explanation approaches on user trust and satisfaction in the context of learning analytics?
- RQ1: How does the study level impact user trust and satisfaction in diverse XAI explanation approaches?
3. Materials and Methods
3.1. Data and Prediction Models
3.2. Architecture and Tech Stack
3.3. Interface and Explanation Techniques
4. Results
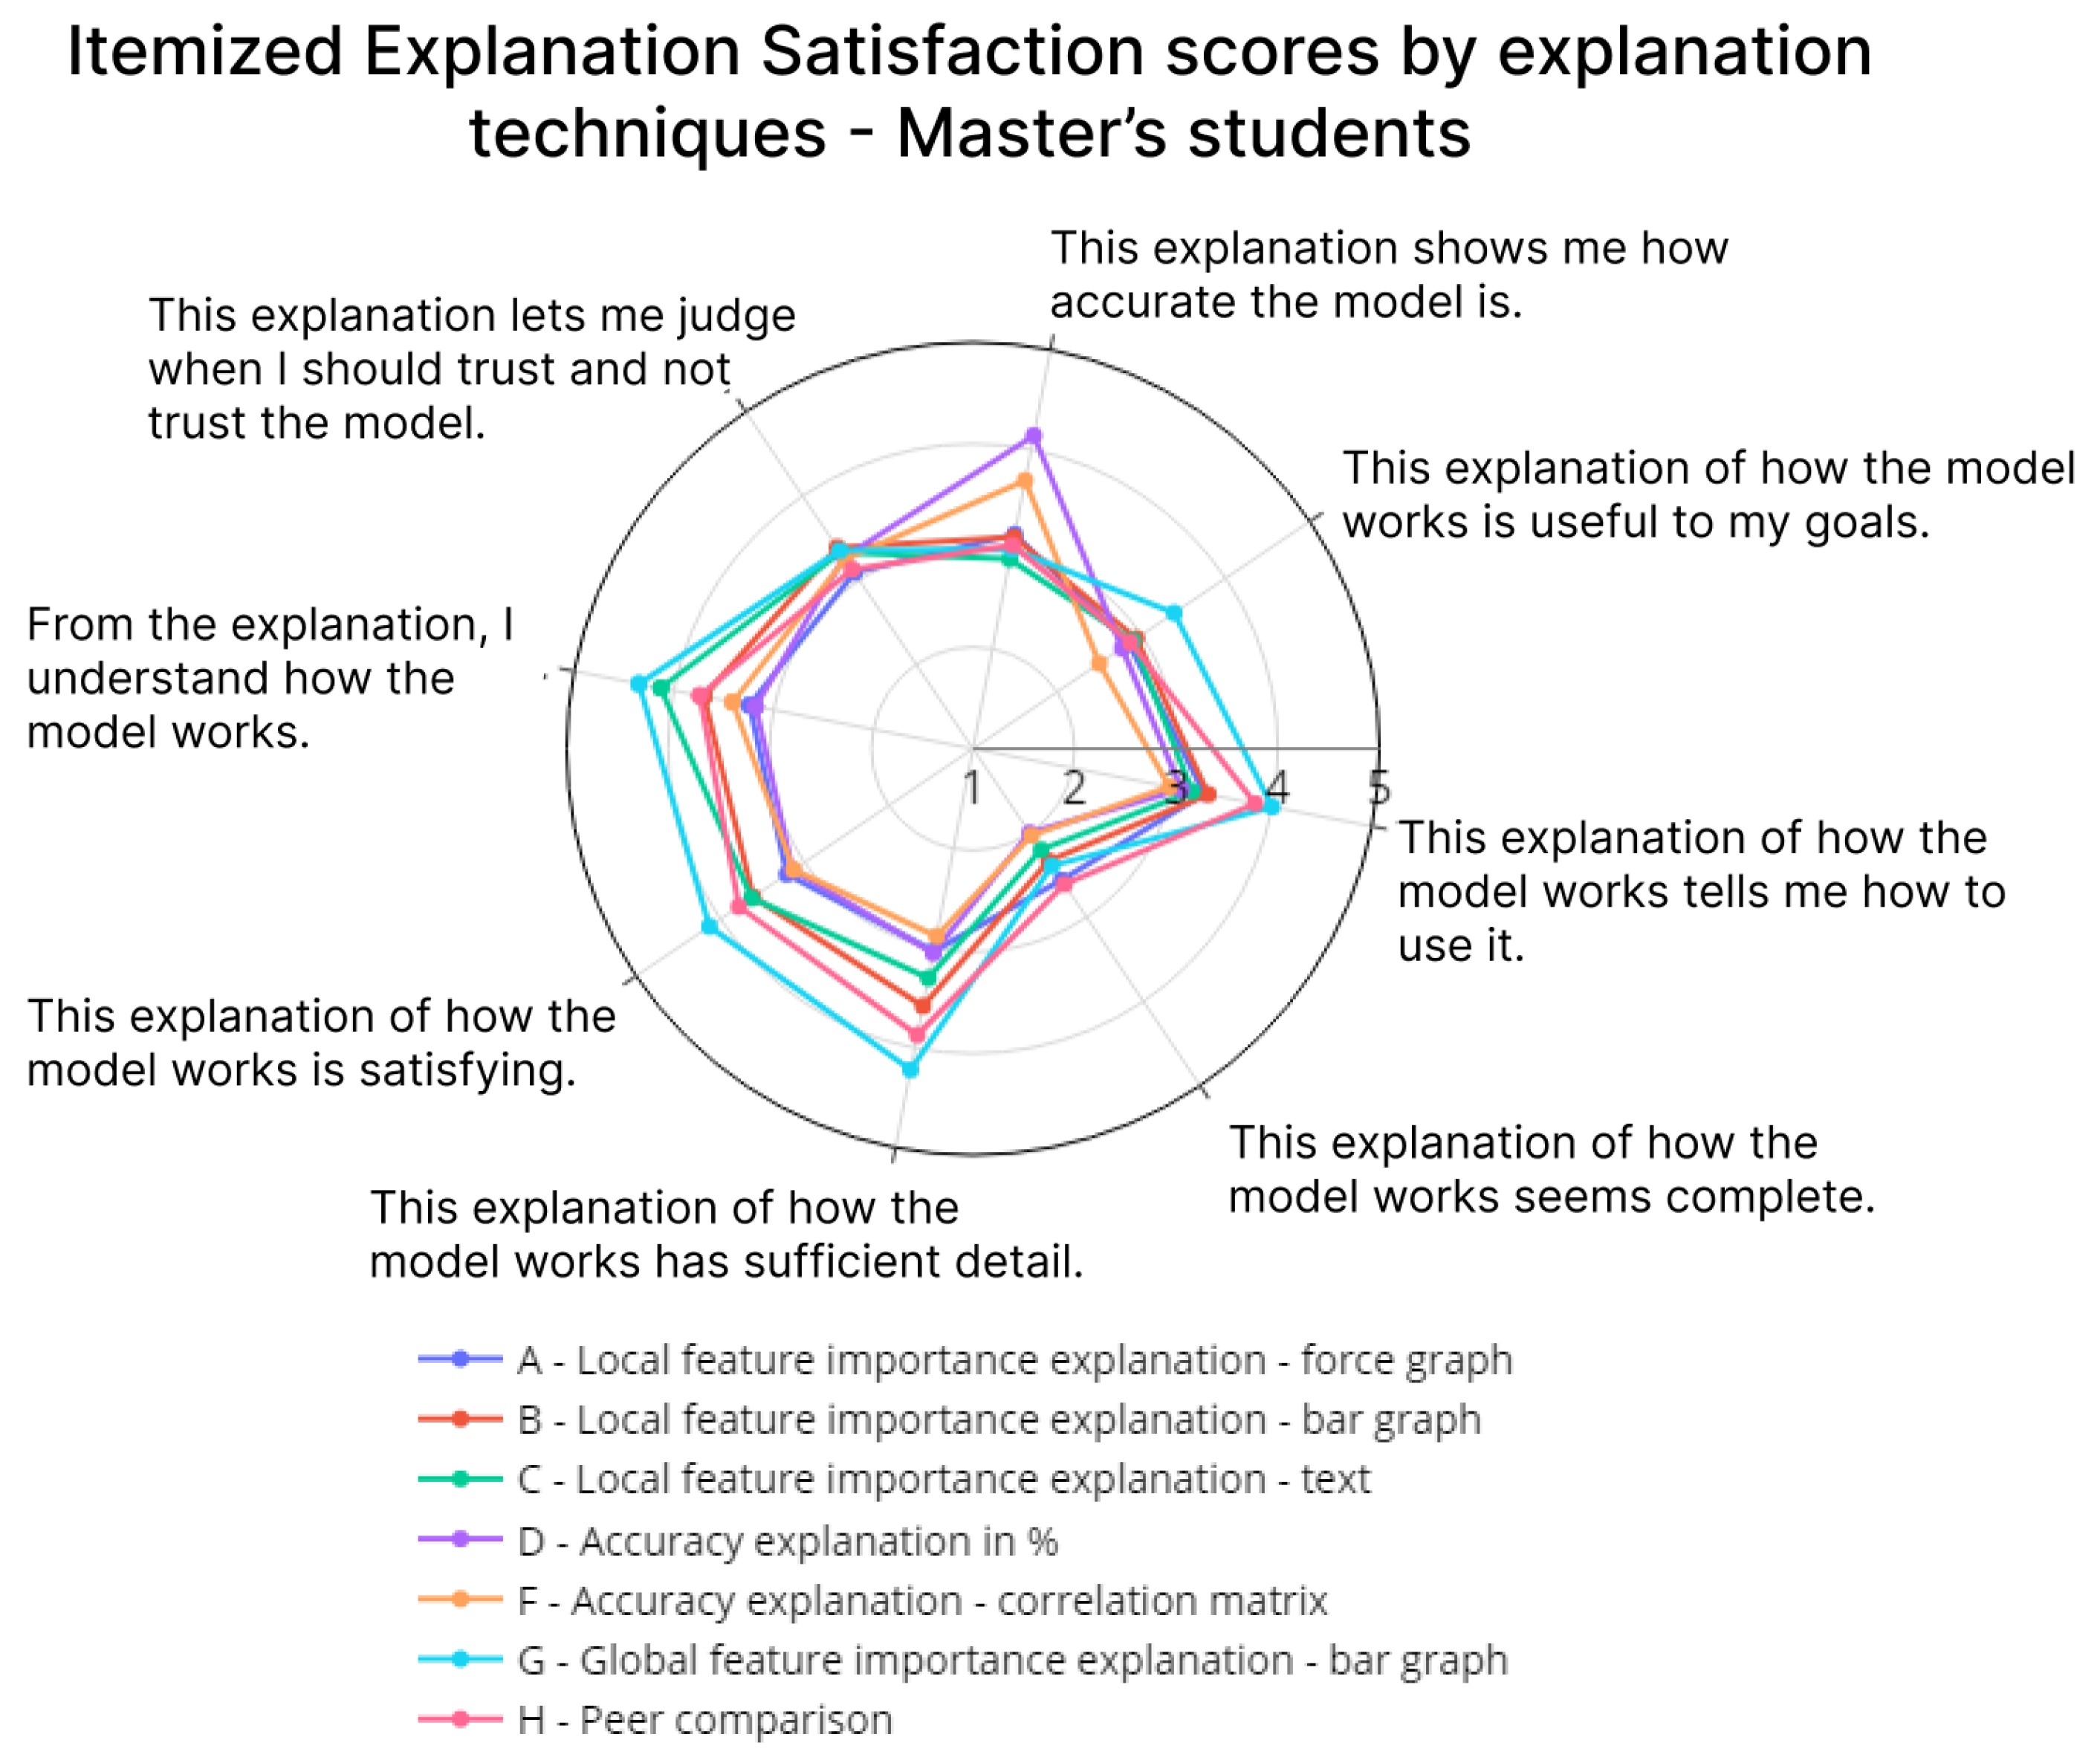
4.1. Explanation Satisfaction
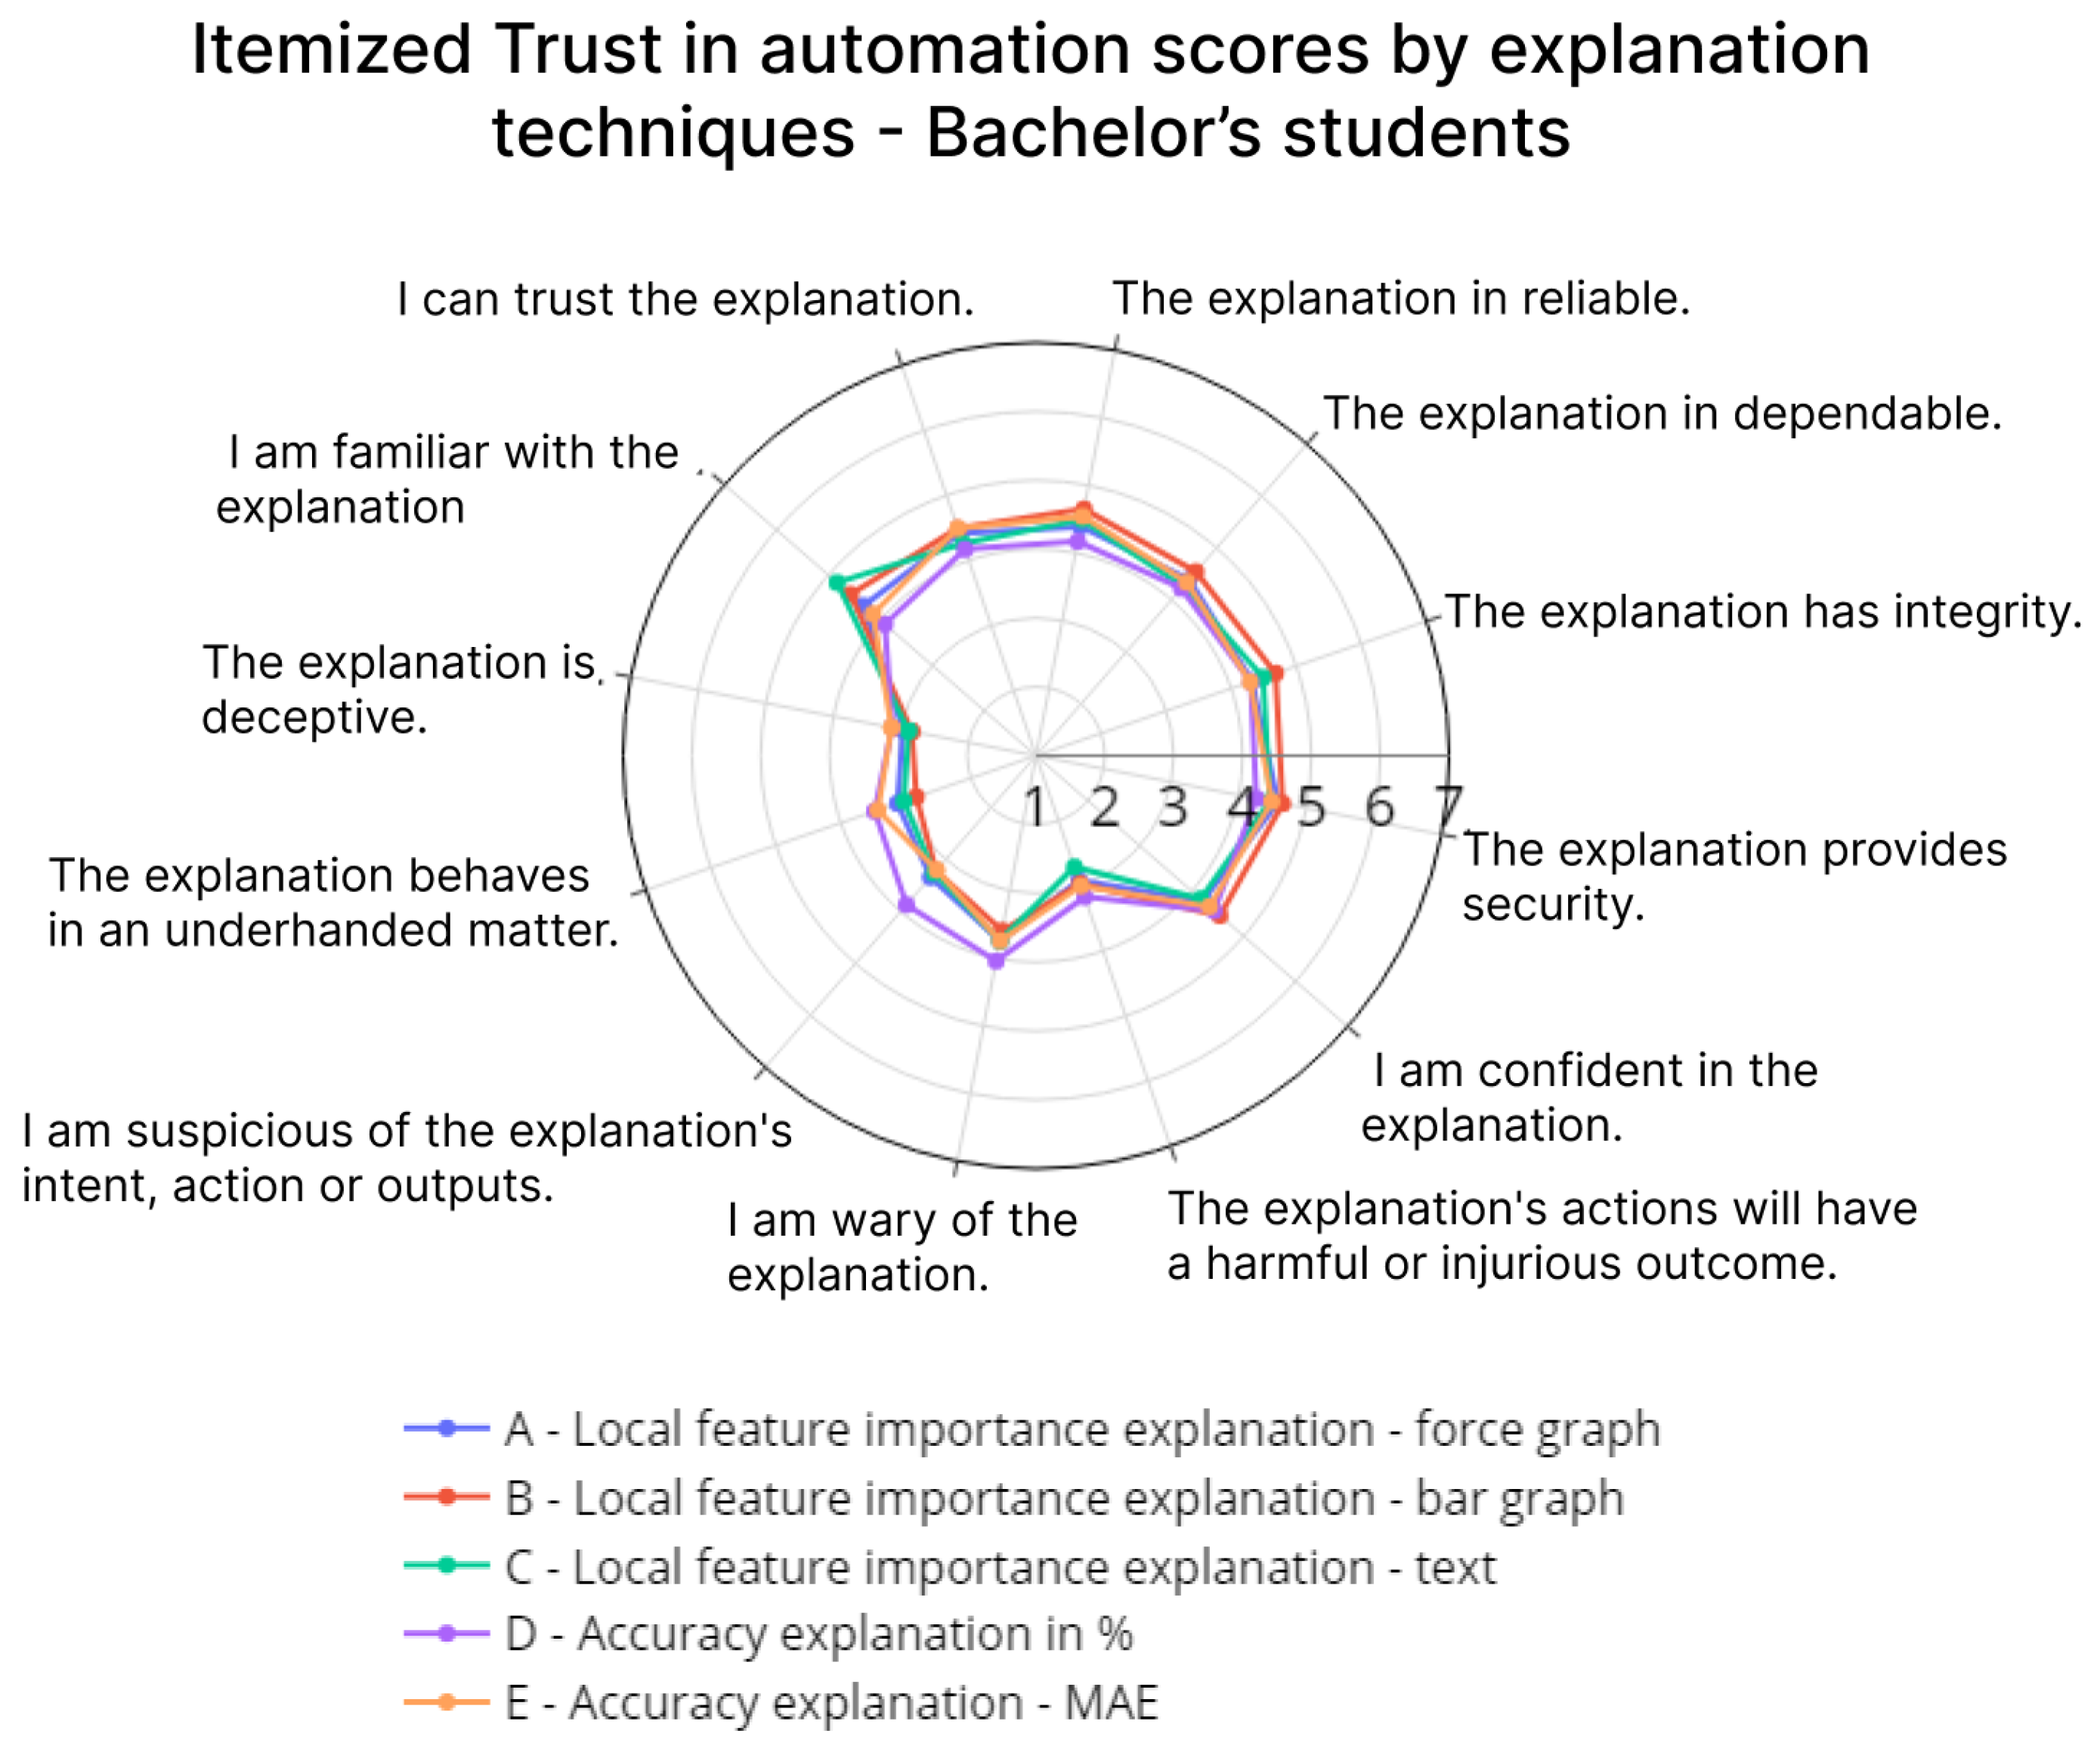
4.2. Trust
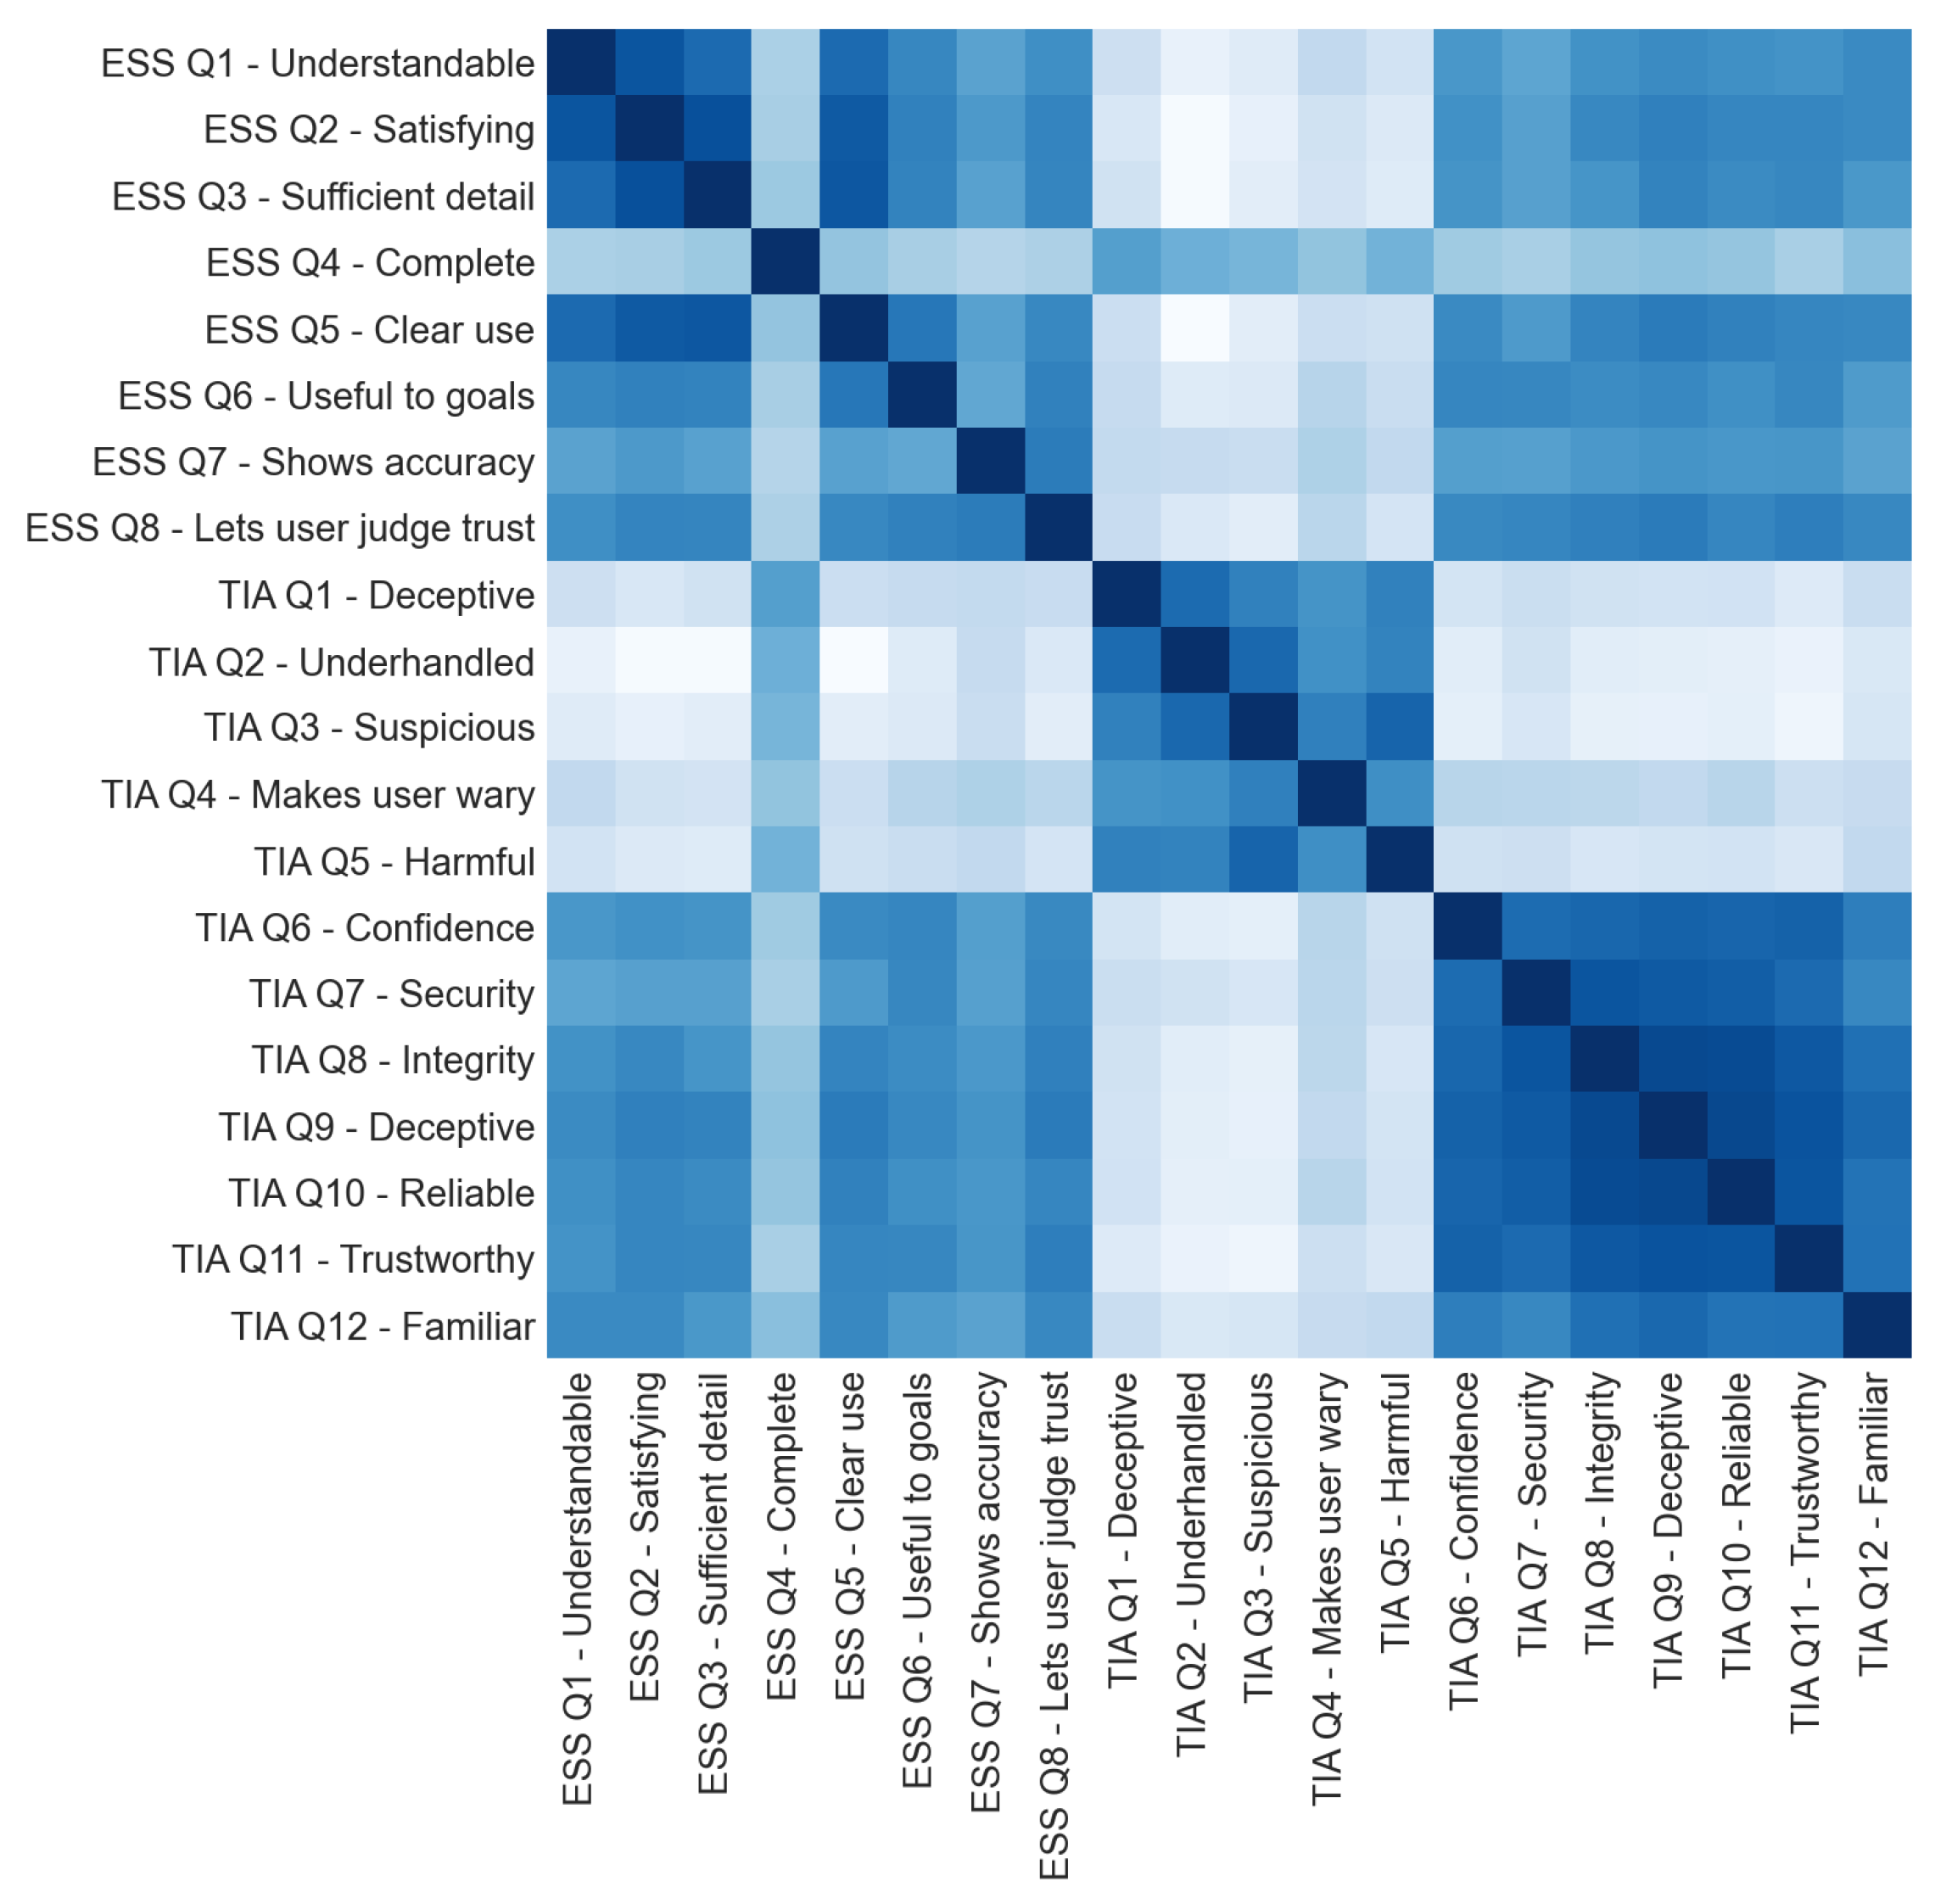
Correlation
5. Discussion and Conclusions
Limitations and Future Work
Author Contributions
Funding
Institutional Review Board Statement
Informed Consent Statement
Data Availability Statement
Conflicts of Interest
Abbreviations
| AI | Artificial Intelligence |
| XAI | Explainable Artificial Intelligence |
| LA | Learning Analytics |
| KW | Kruskal–Wallis H test |
| ESS | Explanation Satisfaction Scale (questionnaire) |
| TIA | Trust in Automation (questionnaire) |
| MAE | Mean Absolute Error |
Appendix A. Overview of Explanation Techniques

| ID | Description | Example |
|---|---|---|
| A | Local feature explanation with force graph |  |
| B | Local feature explanation with bar graph |  |
| C | Local feature explanation with text |  |
| D | Accuracy explanation with error margin in percentage |  |
| E | Accuracy explanation with mean absolute error |  |
| F | Accuracy explanation with confusion matrix |  |
| G | Global feature importance explanation |  |
| H | Simple peer comparison and sample overview |  |
Appendix B. Questionnaires and Their Translations
| Item | Adaptation | Slovene Translation |
|---|---|---|
| 1 | The explanation is deceptive. | Razlaga je zavajajoča. |
| 2 | The explanation behaves in an underhanded matter. | Razlaga se obnaša pomanjkljivo. |
| 3 | I am suspicious of the explanation’s intent, action, or outputs. | Sumničav sem glede namena, delovanja ali rezultatov razlage. |
| 4 | I am wary of the explanation. | Previden sem do razlage. |
| 5 | The explanation’s actions will have a harmful or injurious outcome. | Delovanje razlage bo imelo škodljive posledice. |
| 6 | I am confident in the explanation. | Zaupam razlagi. |
| 7 | The explanation provides security. | Razlaga zagotavlja varnost. |
| 8 | The explanation has integrity. | Razlaga ima integriteto. |
| 9 | The explanation is dependable. | Razlaga je zanesljiva. |
| 10 | The explanation is reliable. | Razlaga je verodostojna. |
| 11 | I can trust the explanation. | Lahko zaupam razlagi. |
| 12 | I am familiar with the explanation. | Razlaga mi je poznana. |
| Item | Adaptation | Slovene Translation |
|---|---|---|
| 1 | From the explanation, I understand how the model works. | Razumem razlago delovanja napovednega modela. |
| 2 | This explanation of how the model works is satisfying. | Razlaga delovanja modela je bila zadovoljiva. |
| 3 | This explanation of how the model works has sufficient detail. | Razlaga delovanja modela je bila dovolj podrobna. |
| 4 | This explanation of how the model works seems complete. | Razlaga delovanja modela vključuje nepotrebne podrobnosti. |
| 5 | This explanation of how the model works tells me how to use it. | Razlaga modela je bila celostna. |
| 6 | This explanation of how the model works is useful to my goals. | Razlaga delovanja modela je uporabna za moje cilje. |
| 7 | This explanation shows me how accurate the model is. | Razlaga poda informacijo natančnosti modela. |
| 8 | This explanation lets me judge when I should trust and not trust the model. | Razlaga mi omogoča, da lahko sam presodim ali naj modelu zaupam ali ne. |
References
- Bahalul Haque, A.K.M.; Najmul Islam, A.K.M.; Patrick Mikalef, P. Explainable Artificial Intelligence (XAI) from a user perspective: A synthesis of prior literature and problematizing avenues for future research. Technol. Forecast. Soc. Chang. 2023, 186, 122120. [Google Scholar] [CrossRef]
- Alamri, R.; Alharbi, B. Explainable Student Performance Prediction Models: A Systematic Review. IEEE Access 2021, 9, 33132–33143. [Google Scholar] [CrossRef]
- Rachha, A.; Seyam, M. Explainable AI In Education: Current Trends, Challenges, And Opportunities. In Proceedings of the SoutheastCon 2023, Orlando, FL, USA, 13–16 April 2023; pp. 232–239. [Google Scholar] [CrossRef]
- Anjomshoae, S.; Najjar, A.; Calvaresi, D.; Främling, K. Explainable Agents and Robots: Results from a Systematic Literature Review. In Proceedings of the AAMAS ’19: 18th International Conference on Autonomous Agents and MultiAgent Systems, Richland, SC, USA, 13–17 May 2019; International Foundation for Autonomous Agents and Multiagent Systems: Richland, SC, USA,; pp. 1078–1088. [Google Scholar]
- Hoffman, R.R.; Mueller, S.T.; Klein, G.; Litman, J. Metrics for Explainable AI: Challenges and Prospects. arXiv 2018, arXiv:1812.04608. [Google Scholar]
- Gunning, D.; Aha, D. DARPA’s explainable artificial intelligence (XAI) program. AI Mag. 2019, 40, 44–58. [Google Scholar]
- Kulesza, T.; Burnett, M.; Wong, W.K.; Stumpf, S. Principles of Explanatory Debugging to Personalize Interactive Machine Learning. In Proceedings of the IUI ’15: 20th International Conference on Intelligent User Interfaces, New York, NY, USA, 29 March–1 April 2015; Association for Computing Machinery: New York, NY, USA; pp. 126–137. [Google Scholar] [CrossRef] [Green Version]
- Kraus, S.; Azaria, A.; Fiosina, J.; Greve, M.; Hazon, N.; Kolbe, L.; Lembcke, T.B.; Muller, J.P.; Schleibaum, S.; Vollrath, M. AI for explaining decisions in multi-agent environments. Proc. AAAI Conf. Artif. Intell. 2020, 34, 13534–13538. [Google Scholar] [CrossRef]
- Vössing, M.; Kühl, N.; Lind, M.; Satzger, G. Designing Transparency for Effective Human-AI Collaboration. Inf. Syst. Front. 2022, 24, 877–895. [Google Scholar] [CrossRef]
- Ooge, J.; Kato, S.; Verbert, K. Explaining Recommendations in E-Learning: Effects on Adolescents’ Trust. In Proceedings of the IUI ’22: 27th International Conference on Intelligent User Interfaces, Helsinki, Finland, 22–25 March 2022; Association for Computing Machinery: New York, NY, USA, 2022; pp. 93–105. [Google Scholar] [CrossRef]
- Barredo Arrieta, A.; Díaz-Rodríguez, N.; Del Ser, J.; Bennetot, A.; Tabik, S.; Barbado, A.; Garcia, S.; Gil-Lopez, S.; Molina, D.; Benjamins, R.; et al. Explainable Artificial Intelligence (XAI): Concepts, taxonomies, opportunities and challenges toward responsible AI. Inf. Fusion 2020, 58, 82–115. [Google Scholar] [CrossRef] [Green Version]
- Khosravi, H.; Shum, S.B.; Chen, G.; Conati, C.; Tsai, Y.S.; Kay, J.; Knight, S.; Martinez-Maldonado, R.; Sadiq, S.; Gašević, D. Explainable Artificial Intelligence in education. Comput. Educ. Artif. Intell. 2022, 3, 100074. [Google Scholar] [CrossRef]
- Lim, B.Y.; Dey, A.K. Toolkit to Support Intelligibility in Context-Aware Applications. In Proceedings of the UbiComp ’10: 12th ACM International Conference on Ubiquitous Computing, Copenhagen, Denmark, 26–29 September 2010; Association for Computing Machinery: New York, NY, USA, 2010; pp. 13–22. [Google Scholar] [CrossRef]
- Mohseni, S.; Zarei, N.; Ragan, E.D. A Multidisciplinary Survey and Framework for Design and Evaluation of Explainable AI Systems. ACM Trans. Interact. Intell. Syst. 2021, 11, 24. [Google Scholar] [CrossRef]
- Liao, Q.V.; Varshney, K.R. Human-Centered Explainable AI (XAI): From Algorithms to User Experiences. arXiv 2022, arXiv:2110.10790. [Google Scholar]
- Conati, C.; Barral, O.; Putnam, V.; Rieger, L. Toward personalized XAI: A case study in intelligent tutoring systems. Artif. Intell. 2021, 298, 103503. [Google Scholar] [CrossRef]
- Schwendimann, B.A.; Rodríguez-Triana, M.J.; Vozniuk, A.; Prieto, L.P.; Boroujeni, M.S.; Holzer, A.; Gillet, D.; Dillenbourg, P. Perceiving Learning at a Glance: A Systematic Literature Review of Learning Dashboard Research. IEEE Trans. Learn. Technol. 2017, 10, 30–41. [Google Scholar] [CrossRef]
- Jivet, I.; Scheffel, M.; Specht, M.; Drachsler, H. License to Evaluate: Preparing Learning Analytics Dashboards for Educational Practice. In Proceedings of the LAK ’18: 8th International Conference on Learning Analytics and Knowledge, Sydney, Australia, 7–9 March 2018; Association for Computing Machinery: New York, NY, USA, 2018; pp. 31–40. [Google Scholar] [CrossRef] [Green Version]
- Clow, D. An overview of learning analytics. Teach. High. Educ. 2013, 18, 683–695. [Google Scholar] [CrossRef] [Green Version]
- Mathrani, A.; Susnjak, T.; Ramaswami, G.; Barczak, A. Perspectives on the challenges of generalizability, transparency and ethics in predictive learning analytics. Comput. Educ. Open 2021, 2, 100060. [Google Scholar] [CrossRef]
- Zawacki-Richter, O.; Marín, V.I.; Bond, M.; Gouverneur, F. Systematic review of research on artificial intelligence applications in higher education—Where are the educators? Int. J. Educ. Technol. High. Educ. 2019, 16, 39. [Google Scholar] [CrossRef] [Green Version]
- Zhang, K.; Aslan, A.B. AI technologies for education: Recent research & future directions. Comput. Educ. Artif. Intell. 2021, 2, 100025. [Google Scholar] [CrossRef]
- Wang, X.; Guo, B.; Shen, Y. Predicting the At-Risk Online Students Based on the Click Data Distribution Characteristics. Sci. Program. 2022, 2022, 9938260. [Google Scholar] [CrossRef]
- Kuzilek, J.; Hlosta, M.; Herrmannova, D.; Zdráhal, Z.; Wolff, A. OU Analyse: Analysing at-risk students at The Open University. Learn. Anal. Rev. 2015, LAK15-1, 1–16. [Google Scholar]
- Al-Azawei, A.; Al-Masoudy, M. Predicting Learners’ Performance in Virtual Learning Environment (VLE) based on Demographic, Behavioral and Engagement Antecedents. Int. J. Emerg. Technol. Learn. 2020, 15, 60–75. [Google Scholar] [CrossRef]
- Chitti, M.; Chitti, P.; Jayabalan, M. Need for Interpretable Student Performance Prediction. In Proceedings of the 2020 13th International Conference on Developments in eSystems Engineering (DeSE), Liverpool, UK, 14–17 December 2020; pp. 269–272. [Google Scholar] [CrossRef]
- Alonso, J.M.; Casalino, G. Explainable Artificial Intelligence for Human-Centric Data Analysis in Virtual Learning Environments. In Higher Education Learning Methodologies and Technologies Online; Burgos, D., Cimitile, M., Ducange, P., Pecori, R., Picerno, P., Raviolo, P., Stracke, C.M., Eds.; Springer International Publishing: Cham, Switzerland, 2019; pp. 125–138. [Google Scholar]
- Conijn, R.; Kahr, P.; Snijders, C. The Effects of Explanations in Automated Essay Scoring Systems on Student Trust and Motivation. J. Learn. Anal. 2023, 10, 37–53. [Google Scholar] [CrossRef]
- Shulner-Tal, A.; Kuflik, T.; Kliger, D. Fairness, Explainability and in-between: Understanding the Impact of Different Explanation Methods on Non-Expert Users’ Perceptions of Fairness toward an Algorithmic System. Ethics Inf. Technol. 2022, 24, 2. [Google Scholar] [CrossRef]
- Lee, J.D.; See, K.A. Trust in Automation: Designing for Appropriate Reliance. Hum. Factors 2004, 46, 50–80. [Google Scholar] [CrossRef] [Green Version]
- Vereschak, O.; Bailly, G.; Caramiaux, B. How to Evaluate Trust in AI-Assisted Decision Making? A Survey of Empirical Methodologies. Proc. ACM Hum.-Comput. Interact. 2021, 5, 1–39. [Google Scholar] [CrossRef]
- Jian, J.Y.; Bisantz, A.M.; Drury, C.G. Foundations for an Empirically Determined Scale of Trust in Automated Systems. Int. J. Cogn. Ergon. 2000, 4, 53–71. [Google Scholar] [CrossRef]
- Chien, S.Y.; Lewis, M.; Sycara, K.; Liu, J.S.; Kumru, A. The Effect of Culture on Trust in Automation: Reliability and Workload. Acm Trans. Interact. Intell. Syst. 2018, 8, 1–31. [Google Scholar] [CrossRef] [Green Version]
- Merritt, S.M. Affective Processes in Human–Automation Interactions. Hum. Factors 2011, 53, 356–370. [Google Scholar] [CrossRef] [PubMed]
- Muir, B. Operators’ Trust in and Use of Automatic Controllers in a Supervisory Process Control Task. Ph.D. Thesis, University of Toronto, Toronto, ON, Canada, 1989. [Google Scholar]
- Benbasat, I.; Wang, W. Trust in and adoption of online recommendation agents. J. Assoc. Inf. Syst. 2005, 6, 4. [Google Scholar] [CrossRef]
- Schraagen, J.M.; Elsasser, P.; Fricke, H.; Hof, M.; Ragalmuto, F. Trusting the X in XAI: Effects of different types of explanations by a self-driving car on trust, explanation satisfaction and mental models. Proc. Hum. Factors Ergon. Soc. Annu. Meet. 2020, 64, 339–343. [Google Scholar] [CrossRef]
- Ribeiro, M.T.; Singh, S.; Guestrin, C. “Why Should I Trust You?”: Explaining the Predictions of Any Classifier. arXiv 2016, arXiv:1602.04938. [Google Scholar]
- Lundberg, S.M.; Lee, S.I. A Unified Approach to Interpreting Model Predictions. In Advances in Neural Information Processing Systems 30; Guyon, I., Luxburg, U.V., Bengio, S., Wallach, H., Fergus, R., Vishwanathan, S., Garnett, R., Eds.; Curran Associates, Inc.: Red Hook, NY, USA, 2017; pp. 4765–4774. [Google Scholar]
- Belle, V.; Papantonis, I. Principles and practice of explainable machine learning. Front. Big Data 2021, 4, 39. [Google Scholar] [CrossRef]
- Aechtner, J.; Cabrera, L.; Katwal, D.; Onghena, P.; Valenzuela, D.P.; Wilbik, A. Comparing User Perception of Explanations Developed with XAI Methods. In Proceedings of the 2022 IEEE International Conference on Fuzzy Systems (FUZZ-IEEE), Padua, Italy, 18–23 July 2022; pp. 1–7. [Google Scholar] [CrossRef]
- Aykin, N.M.; Aykin, T. Individual differences in human-computer interaction. Comput. Ind. Eng. 1991, 20, 373–379. [Google Scholar] [CrossRef]
- ISO 9241-1:1997; Ergonomic Requirements for Office Work with Visual Display Terminals (VDTs). International Organization for Standardization: Geneva, Switzerland, 1997.
- European Commission, Directorate-General for Education, Youth, Sport and Culture. ECTS Users’ Guide 2015; Publications Office of the European Union: Luxembourg, 2017. [Google Scholar] [CrossRef]
- Brooke, J. SUS-A quick and dirty usability scale. Usability Eval. Ind. 1996, 189, 4–7. [Google Scholar]
- You, J.W. Identifying significant indicators using LMS data to predict course achievement in online learning. Internet High. Educ. 2016, 29, 23–30. [Google Scholar] [CrossRef]
- Rivas, A.; González-Briones, A.; Hernández, G.; Prieto, J.; Chamoso, P. Artificial neural network analysis of the academic performance of students in virtual learning environments. Neurocomputing 2021, 423, 713–720. [Google Scholar] [CrossRef]
- Schoonderwoerd, T.A.J.; Jorritsma, W.; Neerincx, M.A.; van den Bosch, K. Human-Centered XAI: Developing Design Patterns for Explanations of Clinical Decision Support Systems. Int. J. Hum.-Comput. Stud. 2021, 154, 102684. [Google Scholar] [CrossRef]
- Poulin, B.; Eisner, R.; Szafron, D.; Lu, P.; Greiner, R.; Wishart, D.; Fyshe, A.; Pearcy, B.; MacDonell, C.; Anvik, J. Visual explanation of evidence in additive classifiers. Proc. Natl. Conf. Artif. Intell. 2006, 2, 1822–1829. [Google Scholar]
- Ramaswami, G.; Susnjak, T.; Mathrani, A. Capitalizing on Learning Analytics Dashboard for Maximizing Student Outcomes. In Proceedings of the 2019 IEEE Asia-Pacific Conference on Computer Science and Data Engineering (CSDE), Melbourne, Australia, 9–11 December 2019; pp. 1–6. [Google Scholar]
- Aljohani, N.R.; Daud, A.; Abbasi, R.A.; Alowibdi, J.S.; Basheri, M.; Aslam, M.A. An integrated framework for course adapted student learning analytics dashboard. Comput. Hum. Behav. 2019, 92, 679–690. [Google Scholar] [CrossRef]


| Feature | Description |
|---|---|
| Course A | |
| Schedule group | The group (N = 6) in which students attend their lab work activities. |
| Gender | Gender of the student. |
| Disability | Boolean feature with information on whether a student holds the status of a disabled student. |
| Number of monthly clicks | Includes multiple features containing the number of clicks for all previous months from August until the date of prediction. The clicks for the ongoing month are calculated up to the day of the prediction. |
| Date of first interaction on Moodle | The date student first interacted with Moodle course, counted from the first day of the semester. |
| Sum of all clicks | The sum of all clicks from student’s interaction with Moodle course. |
| Task grades | Multiple features, including the grades from all the tasks with deadlines prior to the date of the prediction. |
| Midterm grade | Grade student obtained on the first midterm (out of the two). |
| Quiz grade | Grade student obtained on the first quiz (out of the two). |
| Course B | |
| Graduation year | Year of bachelor program graduation. The data were collected from the national online library, where the final theses are published. |
| Alma mater of undergraduate studies | University where students obtained their bachelor’s degree, if available. |
| Graduation from same Bologna bachelor’s program | Boolean whether student obtained their bachelor’s degree from the same bachelor’s Bologna program and are continuing their studies in the same program in the next Bologna cycle. |
| Gender | Gender of the student. |
| Course C grade | Grade from the mandatory course, given in the first (fall) semester of master’s studies. Course holder is the same as in course B. |
| Course D grade | Grade from the mandatory course, given in the first (fall) semester of master’s studies. Course holder is the same as in course B. |
| Moodle access in first semester week | Boolean value noting if the students accessed the Moodle environment in the first week of the semester. |
| Sum of clicks in Moodle | Sum of all the clicks from Moodle learning environment. |
| Study module | One of the three study modules students selected as a form of specialization within the study program. |
| Course A | Q1 | Q2 | Q3 | Q4 | Q5 | Q6 | Q7 | Q8 |
|---|---|---|---|---|---|---|---|---|
| p | 0.258 | 0.013 | 0.056 | 0.086 | 0.343 | 0.615 | 0.146 | 0.068 |
| 5.294 | 12.736 | 9.201 | 8.157 | 4.494 | 2.665 | 6.818 | 8.730 | |
| Mean | 3.46 | 3.42 | 3.47 | 2.62 | 3.41 | 2.99 | 3.19 | 3.42 |
| SD | 1.083 | 1.029 | 0.991 | 1.065 | 0.918 | 1.105 | 1.061 | 1.029 |
| Course B | Q1 | Q2 | Q3 | Q4 | Q5 | Q6 | Q7 | Q8 |
| p | <0.001 | 0.003 | <0.001 | 0.076 | 0.002 | 0.287 | 0.001 | 0.942 |
| 24.338 | 20.177 | 31.072 | 11.432 | 20.591 | 7.379 | 21.593 | 1.739 | |
| Mean | 3.66 | 3.49 | 3.38 | 2.30 | 3.37 | 2.87 | 3.27 | 3.26 |
| SD | 1.143 | 1.081 | 1.139 | 1.059 | 1.039 | 1.261 | 1.181 | 1.169 |
| Course A | Q1 | Q2 | Q3 | Q4 | Q5 | Q6 | Q7 | Q8 | Q9 | Q10 | Q11 | Q12 |
|---|---|---|---|---|---|---|---|---|---|---|---|---|
| p | 0.976 | 0.462 | 0.702 | 0.958 | 0.958 | 0.783 | 0.933 | 0.738 | 0.871 | 0.780 | 0.949 | 0.219 |
| 0.477 | 3.607 | 2.183 | 0.641 | 0.644 | 1.741 | 0.841 | 1.987 | 1.243 | 1.757 | 0.718 | 5.749 | |
| Mean | 2.98 | 3.25 | 3.34 | 3.75 | 2.94 | 4.33 | 4.51 | 4.42 | 4.36 | 4.47 | 4.38 | 4.39 |
| SD | 1.0506 | 1.468 | 1.681 | 1.611 | 1.585 | 1.483 | 1.367 | 1.343 | 1.494 | 1.418 | 1.570 | 1.627 |
| Course B | ||||||||||||
| p | 0.061 | <0.001 | 0.205 | 0.322 | 0.509 | 0.769 | 0.673 | 0.861 | 0.800 | 0.411 | 0.783 | 0.180 |
| 12.059 | 23.936 | 8.485 | 6.990 | 5.272 | 3.307 | 4.024 | 2.567 | 3.069 | 6.109 | 3.200 | 8.890 | |
| Mean | 2.70 | 3.28 | 3.23 | 3.95 | 2.50 | 4.30 | 4.10 | 4.37 | 4.48 | 4.44 | 4.46 | 4.38 |
| SD | 1.406 | 1.589 | 1.665 | 1.593 | 1.438 | 1.442 | 1.522 | 1.474 | 1.490 | 1.426 | 1.479 | 1.753 |
Disclaimer/Publisher’s Note: The statements, opinions and data contained in all publications are solely those of the individual author(s) and contributor(s) and not of MDPI and/or the editor(s). MDPI and/or the editor(s) disclaim responsibility for any injury to people or property resulting from any ideas, methods, instructions or products referred to in the content. |
© 2023 by the authors. Licensee MDPI, Basel, Switzerland. This article is an open access article distributed under the terms and conditions of the Creative Commons Attribution (CC BY) license (https://creativecommons.org/licenses/by/4.0/).
Share and Cite
Brdnik, S.; Podgorelec, V.; Šumak, B. Assessing Perceived Trust and Satisfaction with Multiple Explanation Techniques in XAI-Enhanced Learning Analytics. Electronics 2023, 12, 2594. https://doi.org/10.3390/electronics12122594
Brdnik S, Podgorelec V, Šumak B. Assessing Perceived Trust and Satisfaction with Multiple Explanation Techniques in XAI-Enhanced Learning Analytics. Electronics. 2023; 12(12):2594. https://doi.org/10.3390/electronics12122594
Chicago/Turabian StyleBrdnik, Saša, Vili Podgorelec, and Boštjan Šumak. 2023. "Assessing Perceived Trust and Satisfaction with Multiple Explanation Techniques in XAI-Enhanced Learning Analytics" Electronics 12, no. 12: 2594. https://doi.org/10.3390/electronics12122594