Article

Automated Multimodal Stress Detection in Computer Office Workspace

by
Thelma Androutsou
1,*,
Spyridon Angelopoulos
2,
Evangelos Hristoforou
2,
George K. Matsopoulos
1 and
Dimitrios D. Koutsouris
1
1
Biomedical Engineering Laboratory, National Technical University of Athens, 15772 Athens, Greece
2
Laboratory of Electronic Sensors, National Technical University of Athens, 15772 Athens, Greece
*
Author to whom correspondence should be addressed.
Electronics 2023, 12(11), 2528; https://doi.org/10.3390/electronics12112528
Submission received: 9 May 2023 / Revised: 29 May 2023 / Accepted: 1 June 2023 / Published: 3 June 2023
(This article belongs to the Special Issue Emerging E-health Applications and Medical Information Systems)

Abstract

:
Nowadays, changes in the conditions and nature of the workplace make it imperative to create unobtrusive systems for the automatic detection of occupational stress, which can be feasibly addressed through the adoption of Internet of Things (IoT) technologies and advances in data analysis. This paper presents the development of a multimodal automated stress detection system in an office environment that utilizes measurements derived from individuals’ interactions with the computer and its peripheral units. In our analysis, behavioral parameters of computer keyboard and mouse dynamics are combined with physiological parameters recorded by sensors embedded in a custom-made smart computer mouse device. To validate the system, we designed and implemented an experimental protocol simulating an office environment and included the most known work stressors. We applied known classifiers and different data labeling methods to the physiological and behavioral parameters extracted from the collected data, resulting in high-performance metrics. The feature-level fusion analysis of physiological and behavioral parameters successfully detected stress with an accuracy of 90.06% and F1 score of 0.90. The decision-level fusion analysis, combining the features extracted from both the computer mouse and keyboard, showed an average accuracy of 66% and an average F1 score of 0.56.

1. Introduction

Work-related stress is a major challenge for today’s societies, as it is accompanied by many social and economic consequences. The fields of work and employment have changed dramatically during the last decades due to the globalization of society and the economy, the rapid development of technology, and the increased workload [1]. This has resulted in the formation of a new context of environmental and occupational risks, workplace safety issues, and stress. The field of occupational health and well-being—and in particular, the area of work-related stress—has been the subject of numerous research studies and has become a major issue for both the economy and the physical and mental health of the productive part of the population.
The automatic monitoring and detection of occupational stress through the use of innovative technological tools and methods of the emerging field of Affective Computing [2] have proven to be able to contribute decisively to its effective coping and management [3]. Physiological signals and measurements, such as electrocardiogram features [4,5,6], electrodermal activity [7,8,9], skin temperature [10,11] and electromyographic activity [12], have been well studied and have proven to be reliable in detecting stress. However, they often require the use of intrusive equipment and their measurement is not always realistic in work environments [13]. On the other hand, the analysis of behavioral measurements, such as facial expressions [14,15], body posture [16] and patterns of people’s interaction with technological tools and interfaces [17,18], is steadily gaining ground, as it offers non-invasive solutions that show increasing accuracy and reliability, in line with the evolution of technology and artificial intelligence. However, issues and concerns that arise regarding security and privacy should also be considered in this case, especially when designing interventions intended for application in workplaces.
Due to the multifactorial nature of stress and the fact that many symptoms are not unique to it, there is a strong claim among researchers that a multimodal approach, utilizing information from different types of instruments and measurement techniques, can lead to more effective and reliable systems [19]. Consequently, many studies have combined physiological and behavioral parameters to detect workplace stress. In addition, the need to create non-invasive and unobtrusive systems that are transparent to the users has emerged clearly. The development of smart wearable devices and Internet of Things (IoT) technology facilitates the implementation of systems that do not interfere with users’ routines, thus increasing their acceptance [20]. This possibility has been further important in recent years, where the confrontation with the pandemic COVID-19 disease has brought about major changes in the labor sector [21]. The traditional office working environment has changed and remote working has been greatly enhanced and maintained until today, after the end of the emergency health crisis period. The facts described above highlight the need to adapt automatic monitoring and stress detection systems to the new conditions that have emerged.
The patterns of interaction with the computer and its peripheral units are favorable candidates for detecting users’ emotional state, as information and communication technologies are fully integrated and interrelated with the daily life of office workers. This type of data, which has been used extensively in security and user authorization applications [22], is also gaining ground in the field of emotion and stress recognition. However, few studies in the literature have investigated the combined analysis of keyboard and mouse dynamics parameters and physiological measurements to determine occupational stress (Table 1). Naegelin et al. [23] conducted an experiment simulating an office environment and measured keyboard, mouse, and heart variability features to automatically detect stress. Their results showed that the combination of keyboard and mouse dynamics are better indicators of occupational stress than heart rate variability. In [24], Koldjik et al. focused on developing automatic classifiers for inferring working conditions and stress-related mental states through a multimodal non-invasive sensor dataset. The collected data included physiological measures related to heart rate and skin conductance and behavioral measures related to facial expressions, body posture, and computer interactions. Comparison of different machine learning classification approaches showed that neutral and stressful work conditions can be distinguished with 90% accuracy using Support Vector Machines (SVM), yet computer interaction features were not among those that yielded the most valuable information about stress. The multimodal SWELL knowledge work (SWELL-KW) dataset that was collected in this work was also used by subsequent studies. In [25], Alberdi et al. focused on the concept of the “smart office”, an environment that can adapt to users’ needs and relieve them of the routine tasks they have to perform, change to suit the preferences of workers, and give access to services available at any time through customized interfaces. The analysis and prediction approach of the study included the extraction of time-series statistics from the physiological data and behavioral data of the SWELL-KW dataset, focusing on the pattern change and variability rather than the instantaneous values of the features. Results showed that computer-use patterns, along with postural and body movement characteristics, are the best predictors of workplace stress. On the other hand, researchers in [26] trained individual stress classification models based on artificial neural networks (ANNs) and concluded that body posture is the best indicator of stress. Both early and late fusion-based techniques for multimodal data fusion were applied, leading to an accuracy of up to 96%.
The integration or attachment of appropriate sensors to a computer mouse allows the simultaneous recording and analysis of physiological and behavioral parameters during the use of a device that is prevalent in everyday office work. However, there are only a few studies to date that have developed such systems and have focused on multimodal analysis. In [27], heart rate, skin temperature, and features of facial and blink expressions were combined with parameters of mouse dynamics and performance indicators during the execution of computer tasks. The physiological parameters were recorded by sensors mounted on a computer mouse. The authors argued that the stress level of the users derived from the Dynamic Bayesian Network (DBN) framework applied for modeling was consistent with that predicted by psychological theories. Kaklauskas et al. [28] also used a computer mouse and physiological signal sensor system to create a web-based biometric advisory system that assesses the productivity level and the emotional state of users. The system was designed to provide real-time assessments and stress management recommendations through the combined analysis of mouse dynamics features and measurements related to heart rate, skin temperature, skin conductance, and humidity.
In this study, we present an unobtrusive, multimodal system for automatic monitoring and detection of stress of office workers using a computer. The core part of the system is a custom IoT device, which consists of a photoplethysmography (PPG) sensor, a galvanic skin response (GSR) sensor, and a microcontroller development board, embedded in a computer mouse. Physiological measurements recorded by the device are combined with behavioral parameters derived from the use of the computer keyboard and mouse to detect the stress levels of the users. We argue that the proposed solution contributes significantly to the field of multimodal stress recognition by fusing physiological measurements with features of keyboard and mouse dynamics, through an IoT-based system that does not disrupt the users’ routine. A key aspect of the novelty in our work lies in the structure of the smart computer mouse that combines a non-invasive and user-friendly design with the benefits of wireless data transfer. These features, along with its potential for simultaneous recording of parameters of different types, facilitate its adoption in multimodal systems’ contexts, even outside traditional office work environments.
To validate the system’s effectiveness, we designed, developed, and implemented an experimental protocol that involved the execution of tasks simulating a stressful office work environment. In our previous works [29,30], we focused on the description of the device’s components and the validation of the experimental protocol. Moreover, by analyzing the physiological signals with statistical analysis tools, we demonstrated that the smart computer mouse can be used in the context of an occupational stress detection system. In this paper, we will study the behavioral metrics related to keyboard and mouse dynamics and develop a multimodal work stress monitoring and detection system by applying machine learning algorithms. In this regard, we will investigate different methodologies regarding data annotation and the fusion of measurements from different modalities, with the aim of developing a solution with high accuracy and reliability. Section 2 presents the system architecture and experimental procedure and describes the methodology for both the data analysis and feature extraction and the machine learning models and tools applied. The results of our analysis, both individually for the physiological and behavioral parameters and for their combination, are reported in Section 3. Finally, Section 4 and Section 5 present the discussion and conclusions of the research, respectively.

2. Materials and Methods

2.1. System Architecture

The purpose of the proposed system is to automatically monitor and detect stress through measurements calculated during the use of computer peripherals. Behavioral metrics related to keyboard and mouse dynamics—i.e., characteristics of the user’s interaction with the keyboard and mouse of the electron computer—are recorded by Inputlog [31]. It is a logging tool that records input modes of keyboard, mouse, and speech, and can be used free of charge for research purposes. We selected this tool because of its usability, its ability to log activity in all computer applications, and the provision of some tools for analysis and preprocessing of the recorded values. On the other hand, the recording of physiological data is performed by the smart custom-made computer mouse device we developed. The structure of the device and its hardware and software components are described in detail in our previous works [29,30].
While the system is in use, the PPG and GSR sensors measure signals which are subsequently received by the development board’s microcontroller. At this stage, the signals are processed and filtered using specialized algorithms aimed at reducing noise and motion artifacts, as thoroughly presented in [30]. The resulting data is then transmitted to the cloud backend of the development board via its embedded Wi-Fi capabilities. To ensure secure communication, mutual authentication through RSA public-private key pairs is employed. Additionally, an encrypted session utilizing AES over TCP is established for secure data transmission. Using these communication features, the data is then transmitted over TLS/SSL to an external server for further analysis. Concurrently, the measurements of keyboard and mouse dynamics are recorded and stored by the logger after the end of each session in corresponding files, marked with timestamps. An overview of the system architecture is shown in Figure 1.

2.2. Experimental Procedure

2.2.1. Participants

The study comprised of 32 individuals (12 women and 20 men) between the ages of 20 and 40, with a mean age of 29.34 years (SD = 4.65). Selection criteria for participation did not include stress level assessment; the only requirement was the use of a computer mouse with the right hand due to the experimental setup. Thirteen and fifteen participants reported having a high or extremely high level of familiarity with computers, respectively, while four reported a moderate level of familiarity. All individuals reported using the computer daily as part of their work or studies, and three of them had previously participated in a similar experiment. Prior to the experiment, the participants were provided with written and verbal explanations of the procedure and written informed consent was obtained. The stress-induction objective of the study was not revealed until after the experiment was completed to prevent bias in the measurements and results.

2.2.2. Protocol

The aim of the present study was to reproduce a typical office work environment both in a normal state and under stressful conditions. To achieve this, we utilized established laboratory stressors, which were adapted to fit the experimental setup and real-life situations. As mental strain is inherent in office work, we classified the conditions into a state of concentration with mild mental load and a state of presence of occupational stress, based on previous research [32]. These are referred to as the control condition and the stress condition, respectively. We divided each task in the experiment into two levels, based on these conditions. Our protocol was designed to simulate common workplace stressors such as time pressure, social pressure related to performance, and the fear of evaluation by others [33]. To further challenge the participants’ appraisal, the stress-inducing levels of the tasks were performed in front of an audience. In these instances, the experimenter stood next to the participant and observed the test interface on the computer screen, taking notes. Conversely, during the control level, the researcher sat at a distance and did not participate in the experimental process. The study protocol consisted of four tasks, two of which were performed exclusively using the computer mouse, one exclusively using the computer keyboard, and one using a combination of keyboard and mouse. We selected this design to study the contribution of physiological and behavioral parameters to stress detection, both individually and in the context of a multimodal system. We used the Flutter framework to implement the experimental protocol, which was executed through a web application running locally on a computer. The experimental setup is shown in Figure 2. The performed tasks are described in detail in the following sections.

Stroop Color Word Task

The Stroop Color Word test, named after J. R. Stroop, is a neuropsychological test used to evaluate the ability to inhibit cognitive interference when simultaneously processing two different stimulus attributes [34]. During the test, colored words are presented to participants, and they are instructed to name the color of the word rather than read the word itself. The delay in reaction times between congruent and incongruent stimuli is the basis of the test’s effect. Congruency occurs when the meaning of a word and its font color are the same. To differentiate between the control and stress conditions, we utilized two versions of the test with varying levels of difficulty. In the first version, a word appears in the center of the computer screen and the participants are required to select the correct answer from a set of three candidate options displayed in buttons positioned below the colored word. The corresponding button turns green or red after the selection to indicate whether the answer is correct or incorrect, respectively. The subject’s score is displayed and updated after each response in the top right corner of the screen. The first level of the task mainly involves congruent stimuli, where the colors and word names match. In contrast, the second level includes incongruous words and colors, and participants must select the correct option within three seconds, with a countdown timer displayed in the top left corner of the screen. This approach intensifies cognitive interference while introducing time pressure as a stressor.

Mental Arithmetic Task

Mental Arithmetic tests have been commonly used as stressors and are included in well-known experimental protocols, such as the Trier Social Stress Test [35]. In the first level of the experimental procedure of this study, participants are required to perform mathematical calculations involving the four basic mathematical operations: addition, subtraction, multiplication, and division. On the computer screen, a mathematical operation between two numbers up to two digits is displayed, and either one of them or the result of the operation is required to be completed. The participants can provide their answer by clicking on the appropriate button, and the color of the numbers turns green or red to indicate whether they answered correctly or incorrectly before moving on to the next mathematical operation. The performance score, which increases with each correct answer and decreases with each incorrect answer, is displayed at the top right of the computer screen. In the second level, which pertains to the stress condition, the same procedure is repeated, but with a time limit of ten seconds for each answer to be submitted. If the time limit, displayed via a countdown timer, is exceeded, an automatic transition to the next mathematical operation occurs and the score decreases. Random integer generators are used to generate mathematical operations at both levels. However, in the second level, the ranges utilized to generate the numbers are set to increase the complexity and difficulty of the calculations significantly, intensifying the mental load.

Information Pick Up Task

This task, despite its limited application in similar studies, is considered to contain realistic content that can mimic real-life office work scenarios. During both versions of the task, regarding the control and the stress condition, the participants read around nine hundred words of text of general interest and are asked to answer ten questions related to it. The texts used for the task are adapted Wikipedia articles that contain condensed information and are written in the native language of the participants. The difference of the stress-inducing condition is the addition of a six-minute time limit, which is quite difficult to meet, considering the average reading speed and the time required to type the answers. Except from the time pressure, subjects in the second phase are confronted with audible notifications of incoming calls and emails at regular intervals. This addition was made with a view to introducing sounds that are not just disturbing but automatically associated with working in a computer office, in order to study their potential to cause or increase stress. Moreover, a countdown sound effect is included at the end of the task.

Text Transcription Task

This task involves the transcription of an 80–85 word text on a general interest topic. Participants are informed that their typing rate and the accuracy of their transcription will be evaluated. To provide feedback on performance, an interactive colored progress bar is displayed on the right-hand side of the screen, with green indicating good performance and red indicating poor performance. During the control condition, the bar gradually fills up and remains steadily high until the task is completed, creating a sense of accomplishment, and encouraging the user. However, during the stress condition, the bar initially appears full but then gradually indicates deteriorating performance, remaining low until the end of the test. In addition, participants hear a series of sounds during periods of the stress condition that are either disturbing, such as the countdown sound effect, or are associated with a computer-based office work environment, such as audio alerts of incoming messages, emails, and calls.

2.2.3. Procedure

The experimental procedure lasted approximately 45–60 min per participant. Upon arrival, the experimenter provided information about the equipment and sensors to familiarize participants with the setup, followed by completion of the consent form. The main procedure commenced with participants answering a general questionnaire that included demographic information, computer familiarity and use, and factors that could affect stress measurements, such as caffeine or alcohol consumption, medication intake, and prior experience with similar experiments.
Subsequently, participants performed two levels of each of the four tasks, consisting of a control condition followed by a stress condition designed to activate selected stressors. Before beginning each task, participants received detailed instructions on the computer screen, and at the end of each task, they were informed about their performance before proceeding to the next step. The order of tasks for each participant was not fixed, but the levels within each task were always presented in the same order. After each level, participants completed a self-report questionnaire using the NASA Task Load Index [36], which includes questions about mental, physical, and temporal demand, performance, effort, and stress/frustration, with answers rated on a scale of 1 to 10. The questionnaire was completed after both levels of each task, resulting in eight questionnaires per participant.
We introduced rest periods at the beginning and end of the procedure and between tasks, during which participants viewed videos featuring natural landscapes and animals, accompanied by relaxing music. The videos lasted three minutes before any task was performed, two minutes between tasks, and at the end of the experiment. Participants were required to watch the videos in a comfortable seated position with their right hand resting on the mouse to enable monitoring of physiological parameters. The rest periods were designed to ensure consistency of measurements across different condition setups and to establish the baseline signal for each participant.
The sequence of periods for each of the four total tasks of the experimental procedure is presented in Figure 3.

2.3. Data Analysis and Feature Extraction

2.3.1. Physiological Measurements

Throughout the experiment, the sensors embedded in the smart computer mouse acquired GSR and PPG signals with a sampling frequency of 500 Hz and transferred them to the microcontroller. Preprocessing techniques, which are described in detail in [30], were applied during data acquisition to reduce noise and extract the necessary values for subsequent processing. For PPG signal processing, we used an algorithm to detect the exact moment of each heartbeat and calculate beats-per-minute (BPM) accurately, while time thresholds were used to mitigate noise and interference. Motion and ambient light variations in PPG signals were addressed by applying a Kalman filter [37,38]. To remove artifacts in GSR signals caused by body gestures, movements, and improper contact, a moving average filter was used [39]. The voltage output of the sensor was converted to human skin conductance (SC) measured in Siemens, using a conversion formula adapted to the system’s specifications. The above methods of signal processing and filtering were performed at the microprocessor level. As a result, the SC and BPM measurements obtained from the PPG signal were sent per second to the cloud backend of the development board and were subsequently stored in our local database.
Physiological measurements of the data set were divided into time windows to extract statistical features. We chose the time windows to overlap in order to improve performance and avoid missing information at the window boundaries. The mean value, standard deviation (std), and maximum and minimum values of the BPM parameter were calculated for each window. Regarding the SC values, we used pyEDA [40], an open-source toolkit for pre-processing and feature extraction of electrodermal activity. The features of mean value, number of signal peaks, and maximum value of the peaks were extracted for each time window.

2.3.2. Behavioral Measurements

The events during the user interaction with the experiment’s computer interface were recorded by the Inputlog program and were stored with a unique timestamp, expressed in milliseconds. For each input action—including letters, operations, mouse clicks, and movements—session information was recorded and stored, which included an input ID, timestamps in Coordinated Universal Time (UTC) and Unix time, the action time, pause time after the action, and screen cursor coordinates in case of a mouse operation. Upon segregating the data associated with the tasks that involved the use of the computer keyboard and mouse, the raw data underwent feature extraction, using overlapping time windows. The selection of the computed features was based on similar studies on stress detection through keyboard and mouse dynamics [18,41].
The following keyboard features were calculated:
  • Keystroke dwell time (ms): the time between pressing and releasing a key.
  • Keystroke down-to-down time (ms): the time between the press of two consecutive keys.
  • Velocity: the number of keys pressed per second.
  • Latency (ms): the time between the release of a key and the press of the next key.
  • Number of errors: the number of times the backspace and delete keys were pressed.
  • From the mouse activity, the following features were calculated for each window:
  • Mouse action time (ms): the duration of the movement, clicking or scrolling of the computer mouse.
  • Mouse pause time (ms): the time that follows a mouse action.
  • Number of clicks
  • Number of scrolls
  • Total mouse distance: the total distance travelled by the mouse cursor on the screen.
Regarding the features of keystroke dwell time, keystroke down-to-down time, latency, mouse action time, and mouse pause time, an array of values was derived for each time window; thus, the mean, standard deviation, minimum and maximum values, and point-to-point (PtP) variation values were extracted. For the remaining features, a single value was extracted. Therefore, a set of 17 features related to the time and content of keyboard and a set of 13 features related to the computer mouse use were finally obtained. The final set of extracted features for both the physiological and behavioral parameters are presented in Table 2.

2.4. Classification

2.4.1. Machine Learning Tools

Several machine learning algorithms have been applied to automated stress detection models. Each algorithm has its strengths and weaknesses, and the selection often depends on the specific features of the dataset and the problem being addressed. In this study, we compared the performance of several well-known machine learning algorithms, including Support Vector Machines (SVM), k-Nearest Neighbors (k-NN), Random Forest, and Decision Tree. As our dataset contained both physiological and behavioral parameters, we also applied ensemble learning techniques to combine the strengths of multiple models. Specifically, we employed gradient boosting algorithms such as XGBoost, RUSBoost, LightGBM, and AdaBoost, with a view to improve the overall performance of our stress detection system. By comparing the performance of the resulting models, we aimed to identify the most effective approach for accurately detecting stress in our multimodal dataset. Tenfold cross validation was used to estimate the skill of our models. The evaluation of the performance was based on the metrics of accuracy and F1 score.

2.4.2. Data Annotation

The accurate labeling of samples in the training data set is a crucial aspect of the classification process in automated stress detection systems. Given the complex and multifactorial nature of stress, choosing the ground truth that will determine the annotation of the data set is a challenge. Cortisol levels in the body are considered among the most reliable objective measures of stress, but using them as ground truth is quite difficult, especially in real-life scenarios [42]. User feedback on the stress experienced during the intervention is a widely used method for labeling the data, due to the subjective nature of stress [19]. Additionally, the analysis of physiological parameters, such as electrical skin resistance, is considered a reliable indicator of stress [43], while combining user responses with physiological measurements has also been studied [44]. In some cases, the data are labeled based on the phase of the experimental procedure in which they were collected, once the validity of the protocol has been established.
In this study, we investigated the application of different data labeling methods and compared the performance of classification models that were based on them. Our analysis focused on detecting the presence of stress rather than distinguishing between levels of stress intensity. As a result, we created two classes for the machine learning model training data: Class 0 represented the presence of mental load but the absence of stress, while Class 1 represented the presence of stress. The data were divided into these classes using the following methodology:
  • Label 1: The training data annotation process was determined by the experimental protocol design, with data collected from control conditions classified as Class 0 and data from stress conditions classified as Class 1.
  • Label 2: Data labeling was based on subjects’ reported stress levels as obtained from self-report questionnaires completed after each level of each task. We divided the ten-level range scale into two parts for the purposes of our binary classification problem. Thus, the samples that preceded responses in the 1–5 range were categorized into Class 0, and samples that preceded responses in the range of 6–10 were categorized into Class 1.
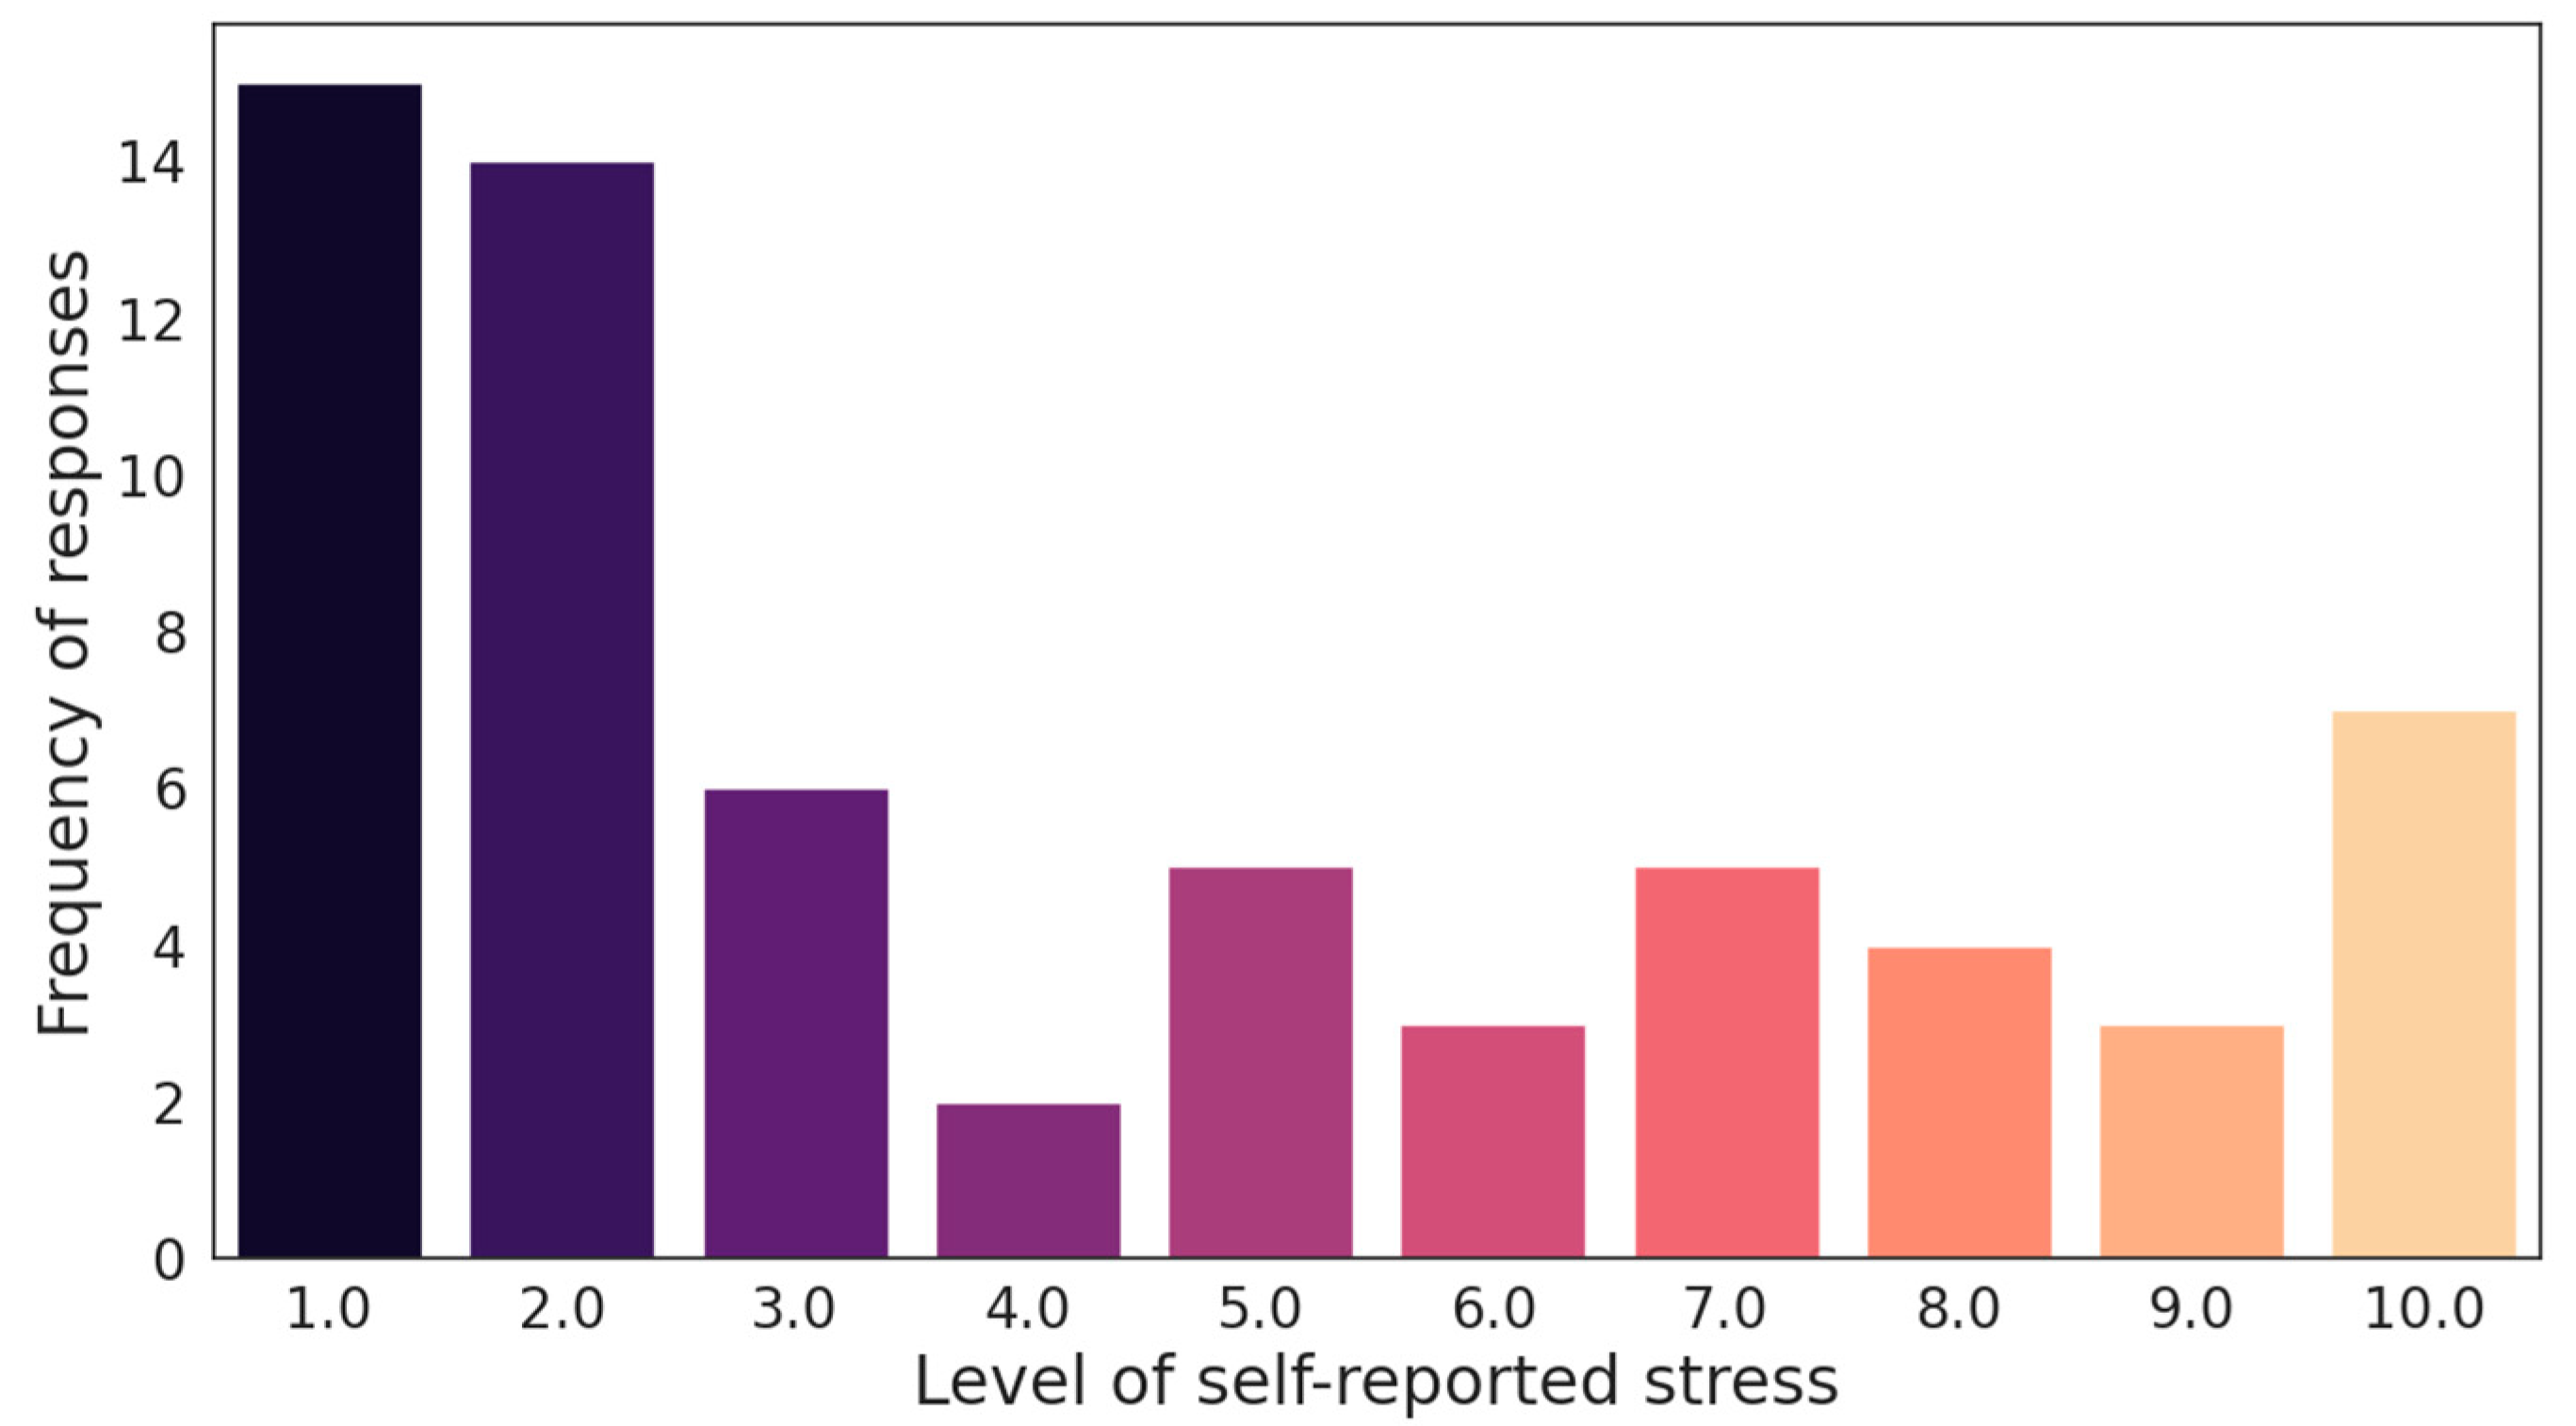
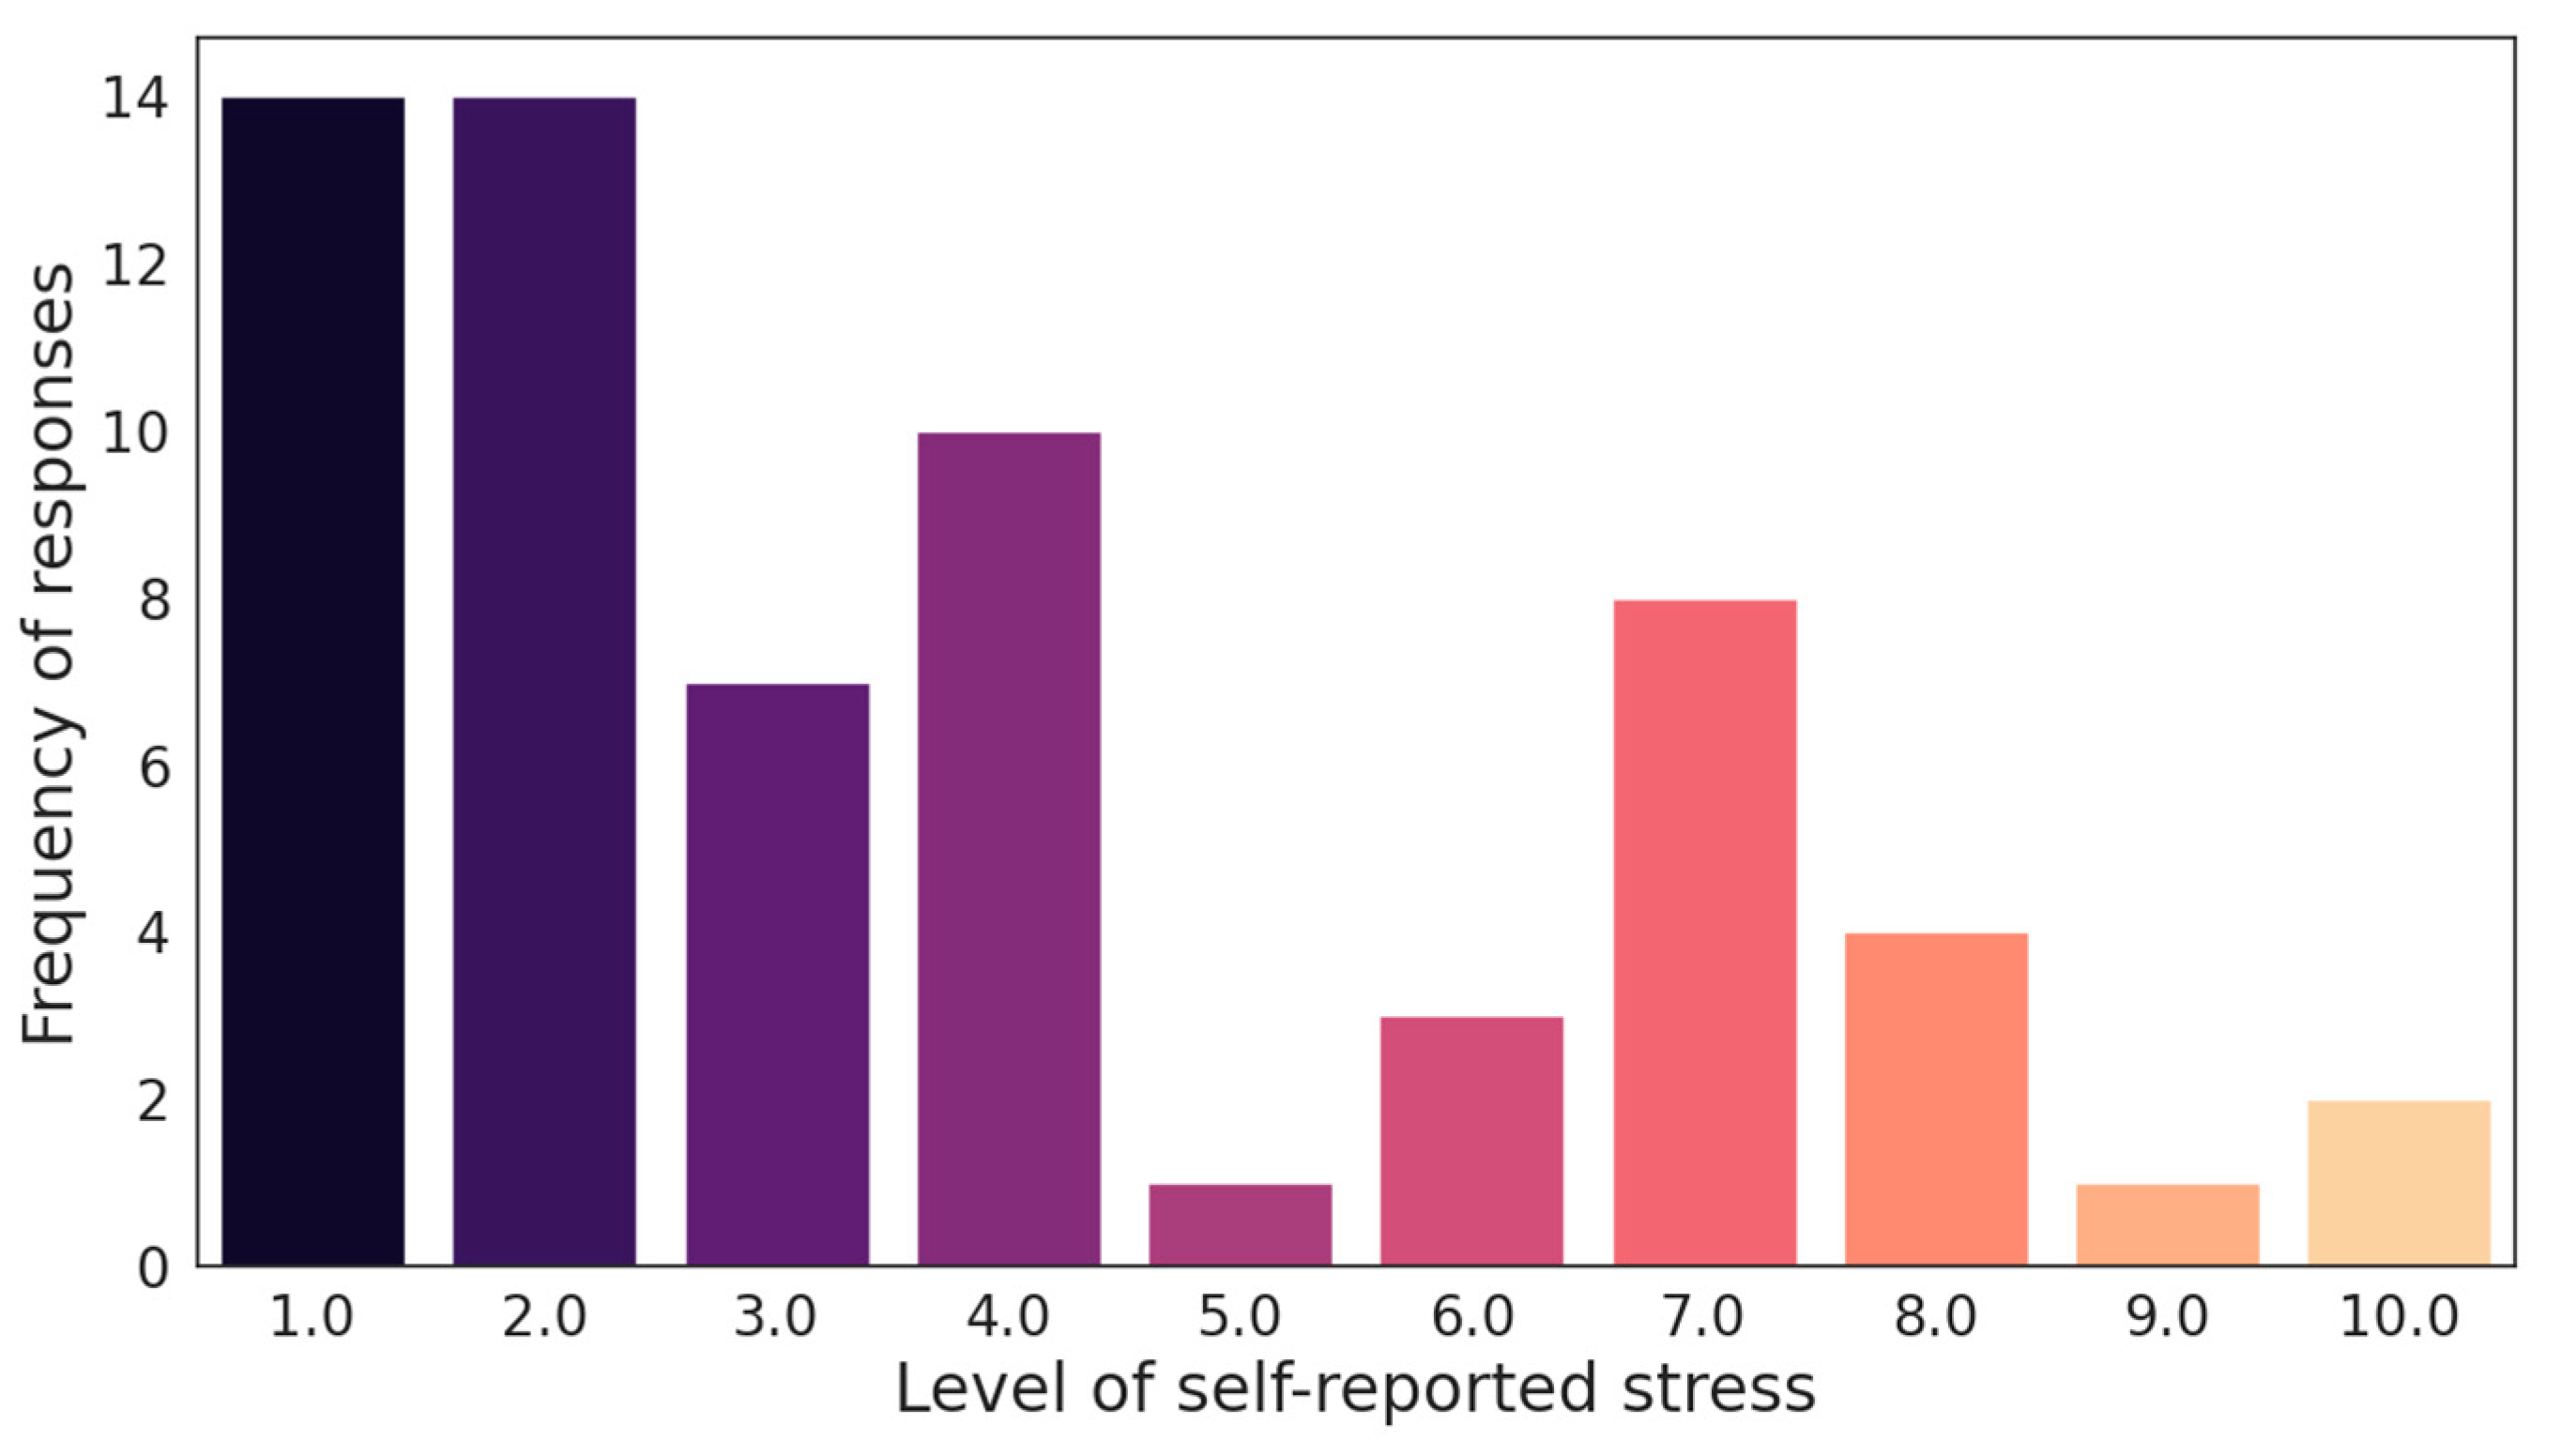
  • Label 3: Data labeling was based on the subjects’ responses regarding self-reported stress levels, following a different approach from the one adopted for Label 2. Upon analyzing the responses of all subjects, it was noticed that the frequencies of the responses differed significantly depending on the stress levels. Some of the responses in the selected range were selected much less often than others. An example is shown in Figure 4, which shows the questionnaire responses that followed the two levels of the Information Pick Up Task. The questionnaire responses for the other three tasks are shown in Figure A1, Figure A2 and Figure A3 of the Appendix A section. This is justified by the large range of 10 levels available for subjects to choose from. However, this large range may result in creating false conclusions in a categorization, such as the one in Label 2 above. To investigate this issue, we attempted to condense this range based on the frequency of different responses. Specifically, training data from the conditions that preceded responses in the 1–3 range were categorized into Class 0, while correspondingly, data that preceded responses in the 4–10 range were categorized into Class 1.

2.4.3. Class Imbalance

The design of our experimental protocol resulted in the collection of different numbers of samples for the control and stress levels of the tasks. Specifically, for some tasks, the stressor of time was introduced only in the second level, while in others there was no time constraint for either level. This imbalance can cause problems for the classifier as it may become biased towards the majority class and perform poorly in predicting the minority class. Synthetic Minority Over-sampling Technique (SMOTE) is a popular technique used to address this issue [45]. SMOTE generates synthetic examples of the minority class by creating new instances that interpolate between existing minority class examples. This increases the representation of the minority class in the training data and can improve the performance of the classifier in predicting both the majority and minority classes. SMOTE has been shown to be effective in improving classification accuracy in many applications, particularly in medical and financial domains where the cost of misclassification is high. We applied this scheme to any cases where the dataset appeared imbalanced.

3. Results

3.1. Stress Detection Based on Physiological Parameters

This section presents the results of machine learning models that we trained using physiological parameters derived from the analysis of signals obtained from the sensors of the experimental setup. We focused on data obtained during the Stroop Color Word Task and Mental Arithmetic Task, as these tasks involved exclusive and continuous use of the computer mouse for signal recording. We considered the use of the keyboard during the Mental Arithmetic Task negligible for analysis, as it involved typing only a few characters belonging to a specific range (the keyboard numbers). Moreover, we did not consider the features derived from the use of the computer mouse due to the design of both tasks, which involved rapid and abrupt movements of the computer mouse and could introduce potential measurement biases. We divided the physiological measurements into 20 s time windows with 50% overlap. The final dataset contained 572 samples, of which 275, 169, and 252 belonged to the stress class for the cases of Label 1, Label 2, and Label 3, respectively.
As shown by the metrics presented in Table 3, the overall performance of the algorithms is the worst for Label 1, while it shows its maximum values for Label 2. The performance values of the algorithms are quite close to each other, with the gradient boosting algorithms generally outperforming the traditional machine learning algorithms SVM, k-NN, and Decision Tree in terms of accuracy. The Random Forest algorithm showed the best performance in all 3 categories of data labeling, showing a maximum accuracy of 86.45% and a maximum F1 score of 0.86 for Label 2.

3.2. Stress Detection Based on Behavioral Parameters

Machine learning models based on stress detection through behavioral data analysis were trained with the data obtained from the execution of the Text Transcription Task. It should be noted that this task was performed exclusively using the keyboard, as subjects barely needed to use the mouse at the beginning and end of the task. We isolated the data related to this task and extracted the features described in Section 2.3.2. The duration of the time windows was set to 5 s. The final dataset contained 5038 samples and the stress class for the 3 different annotation methods contained 2369, 1319, and 2213 records.
The results are shown in Table 4. As was the case for the physiological parameters, the performance of all the algorithms exhibited the lowest values for Label 1 and the highest for Label 2. The XGBoost algorithm showed the best performance for Label 1 and Label 2, while the Random Forest algorithm was the most efficient when annotating the data based on Label 3. In each case, the metrics of the two algorithms are remarkably close in all three scenarios and outperform the other alternatives, with the results of LightGBM following.

3.3. Stress Detection Based on Multimodal Analysis

In order to investigate the combined analysis of physiological and behavioral parameters recorded by our stress detection system, we used the data collected during the Information Pick Up task. As is evident, when individuals type, they do not typically make simultaneous use of the computer mouse. Therefore, it is not possible to have concurrent recording of keyboard dynamics features and physiological measurements, as the sensors that record physiological signals are embedded in the computer mouse. On the other hand, simultaneous recording of physiological measurements and behavioral measurements, both resulting from the use of the computer mouse, is performed.
The first step for the combined analysis of diverse types of parameters was to perform feature-level fusion on the computer mouse measurements by concatenating the physiological and behavioral features into a single feature vector. We isolated the exercise-related data from the 32 participant datasets and calculated the above features, resulting in a dataset of 1511 samples, of which 494, 377, and 652 were categorized into the stress class according to Label 1, Label 2, and Label 3, respectively. We then trained machine learning models with the resulting dataset and compared their performance to models trained individually with the physiological and behavioral parameters of the vectors. The results are shown in Table 5, Table 6 and Table 7. We can observe that models trained with the combined set of features performed better, outperforming well those trained with the behavioral parameters and lesser those based on the physiological ones. In the case of behavioral features, the Random Forest and LightGBM algorithms showed the best performance, while in the case of physiological features, the Random Forest algorithm outperformed the others. The LightGBM and XGBoost algorithms were the most efficient in the case of the combined feature vector, reaching up to 90% accuracy rates. As in the previous task, the performance metrics were overall higher for the data annotation based on Label 2.
The next step of our analysis was the combined study of the parameters extracted from the use of the computer keyboard and mouse. For this purpose, we divided the measurements taken during the Information Pick Up task into one-minute time windows. The final dataset included 376 samples, of which 153, 99, and 171 were annotated as instances of the stress condition class, based on Label 1, Label 2, and Label 3, respectively. We then trained separate models for the keyboard and computer mouse data and applied decision-level fusion to develop the final system. As the recordings of the two devices are mutually exclusive, several samples of the resulting dataset exhibited the missing modality issue, despite the large time window we selected. To address this, we applied a methodology during the model training process where the prediction is based on the measurements of the device available at any given time. Specifically, if only one device’s recordings are available, the prediction is based on the corresponding classifier, while if both are available, the final prediction is obtained through a weighted decision fusion algorithm. The weights of the two classifiers were defined based on their performance, using the keyboard and the computer mouse features accordingly. Random Forest, XGBoost and LightGBM were applied during this part of the study, as they showed the best performance in the previously trained models.
The results of the training process are presented in Table 8. The models exhibit higher accuracy in labeling data from Label 2; however, in this instance, their efficiency in classifying samples from the stress condition class is not as strong, resulting in lower F1 score values. The performance of the algorithms is very similar, with the Random Forest algorithm being superior in accuracy but showing, in some cases, lower F1 score values.

4. Discussion

The proposed system leverages the analysis of non-invasive measurements integrated into the work routine and the use of a low-cost IoT device to create a multimodal stress monitoring and detection model. The adoption of IoT applications has improved the quality of life by providing ways to monitor and detect the emotional state and stress levels of individuals [46]. In [47], several sensors, including those integrated in our proposed smart computer mouse, were used to develop a stress diagnostic system. The physiological measurements of the sensors were wirelessly transferred to a database and processed by applying fuzzy logic. The GSR sensor we used was also adopted in [48], in the context of an IoT device that transmits data about the stress of individuals via the internet and Bluetooth connection. A threshold value determination algorithm was defined to identify the real-time stress levels, while data visualization and analysis was achieved through the use of a cloud server. The pulse sensor we selected was used along with a development board and a microcomputer in an IoT system presented in [49], aiming at identifying the stress levels of students in a real environment. Moreover, ultra-short recordings of the same sensor were analyzed by Zubair and Yoon in [50], developing a multilevel stress detection system with high performance. These studies, in contrast to the proposed multimodal system, focused on the analysis of physiological measurements, while the signal recording is often performed by cumbersome and intrusive devices.
In regards to the labor sector, IoT technologies have radically changed and improved many work-related areas in recent years, while monitoring the health, emotional state, and stress levels of workers has been at the focus of several interventions. Studies have been carried out for certain highly stressful occupations, such as that of firefighters, which propose systems that include attaching sensors to clothing and equipment [51,52] or using wearables [53,54] to record physiological and environmental parameters and sending them over the internet. Smartphones and the large amount of data they can provide on a daily basis, both through the sensors they incorporate, such as the accelerometer, and through statistics on the use of various applications, have become a subject of study for the detection of workplace stress [55,56,57]. The trend towards developing non-invasive, non-intrusive, and cost-effective stress sensing applications has led to the design of systems that utilize surfaces and devices that are frequently used by users and do not disturb their routine, which is particularly critical in an office workplace [58,59]. In the specific application area of our system, there are a limited number of studies involving the integration of sensors into a computer mouse for the purpose of stress monitoring [28,60,61] However, most of these devices have not been tested and evaluated in a work-life scenario. Our system’s smart mouse is easy-to-use and cost-effective, incorporating low-cost sensors into a structure that is as minimally invasive to the user as possible. At the same time, it serves the purpose of a multimodal stress detection system, which combines the analysis of physiological signals and behavioral features of computer use.
Choosing the ground truth and annotating the dataset based on it is challenging because of the complexity and multifactoriality of stress. In this study, we explored different data annotations based on both the design of the experimental protocol and the subjects’ responses to the self-report questionnaires. Regarding the latter, we tested two threshold values for splitting the data into the two classes of mental load and stress, due to the unequal distribution of response frequencies in the available range of stress levels. The results showed that the machine learning models performed better in the case of labeling the data based on user feedback and the threshold located in the middle of the range of stress levels (Label 2). This was confirmed both in the individual analysis of the physiological and behavioral parameters and in their combined analysis—i.e., for the whole experimental protocol. Despite the success of the experimental tasks to induce stress in the participants, the subjectivity of responses and interpersonal differences around stress lead to the emergence of user feedback as a more reliable way to define ground truth. However, this is not as feasible in real-time analytics systems and real work environments. Thus, user feedback should be limited to baseline periods and during the definition of thresholding algorithms for calculating stress levels of individuals.
The experimental protocol we performed in this study was designed in such a way that the different stages involved the recording of different types of parameters. Specifically, the Stroop Color Word task and Mental Arithmetic task included the collection of physiological signals, the Text Transcription task included the collection of behavioral data on keyboard use, and the Information Pick Up Task included the combined collection of physiological measures and behavioral data of keyboard and mouse dynamics. Machine learning models trained with the physiological measurements derived from the PPG and GSR signals showed a remarkably high classification performance, with the Random Forest algorithm outperforming the others. These results support the claim that these physiological signals are reliable indicators of stress monitoring and detection. At the same time, the usefulness of the smart mouse device we developed for this purpose is demonstrated. Very satisfactory results in terms of performance were also shown by the models trained with the features obtained from the use of the keyboard during the Text Transcription Task. In this case, the XGBoost algorithm showed the best performance, with the Random Forest algorithm following. It would not be reliable to perform a direct comparison of the model performances when analyzing physiological and behavioral parameters individually, as the above datasets were collected during different tasks and are of different sizes. In any case, the possibility of detecting work stress through the calculation of the specific features and training of general models is highlighted in the instances of both types of parameters.
The structure of the proposed smart mouse allows the simultaneous recording and combined analysis of the biosignals collected by the sensors and the measurements from the use of the computer mouse. The results of our feature-level fusion analysis showed that concatenation of behavioral and physiological parameters increases the performance of a stress classification model compared to models based on the analysis of a single data type. On the other hand, the performance of the machine learning models that were based on decision-level fusion of computer keyboard and mouse data was lower than one of the models that trained individually with each device’s measurements. This can be partly attributed to the design of the experimental exercise. Another important performance inhibitor is the small dataset used to train these models. It is worth noting here that, as our system has the peculiarity that the data sources—namely, the computer keyboard and mouse—are mutually exclusive, the final decision during decision-level fusion is often identical to the decision of the available classifier. Different fusion methods at both feature and decision level, as well as feature selection algorithms can be applied to further study the combination of multiple modalities and sources and improve the performance. Nevertheless, the results obtained are encouraging and highlight the potential of a multimodal system in monitoring and detecting stress levels. Additionally, in the case of the multimodal system, gradient boosting algorithms seem to be in many scenarios the most efficient, which supports the claim that they are suitable for handling data coming from different modalities.
Our study faced several limitations during its implementation. The experimental protocol was designed to include all known stressors of work and was based on established stress protocols. The introduction of some new elements, such as sounds from incoming notifications, proved to be effective and demonstrates the possibility of designing realistic protocols more directly linked to the content of everyday working life. However, certain aspects of the exercise design may have hindered the analysis of measurements. Specifically, in order to limit the duration of the experimental procedure, the texts used in the Text Transcription Task were, while the answers to questions in the Information Pick Up Task were often brief, affecting the provided metrics for analysis. Additionally, while efforts were made to design a laboratory experiment that would simulate real-life scenarios, a more reliable evaluation of the system’s effectiveness would require an application in actual office work environments, with larger participant samples and data.

5. Conclusions

This paper presents a non-invasive automated system that can reliably detect work stress levels through computer usage data. The validation of the proposed solution was performed through the execution of an experimental protocol designed to simulate a stressful office work environment. Our analysis highlights the feasibility of using low-cost IoT devices and utilizing modules that are already integrated into the work routine to monitor the status and stress levels of office workers. User feedback and self-reported stress levels proved to be the most reliable ground truth for data annotation. The combined analysis of physiological and behavioral parameters through feature-level fusion resulted in models that demonstrated enhanced efficiency compared to models utilizing single modalities. Among the evaluated algorithms, gradient boosting algorithms yielded the best results, achieving up to 90% accuracy and an F1 score of 0.90 in classifying mental workload and stress. Decision-level fusion analysis, which combined features extracted from the computer mouse and keyboard, achieved a mean accuracy rate of 66% and a mean F1 score of 0.56. Further experimentation in real work environments and the exploration of established fusion techniques, such as leveraging deep learning, are necessary to validate and enhance similar systems.

Author Contributions

Conceptualization, T.A.; methodology, T.A. and S.A.; software, T.A.; validation, S.A. and T.A.; formal analysis, T.A.; investigation, T.A.; resources, E.H. and D.D.K.; data curation, T.A.; writing—original draft preparation, T.A.; writing—review and editing, S.A., E.H. and T.A.; visualization, T.A.; supervision, D.D.K. and G.K.M.; project administration, D.D.K. and G.K.M.; funding acquisition, D.D.K. and G.K.M. All authors have read and agreed to the published version of the manuscript.

Funding

This research received no external funding.

Data Availability Statement

The data presented in this study are available on reasonable request from the corresponding author.

Conflicts of Interest

The authors declare no conflict of interest.

Appendix A

Figure A1. The number of responses given for each of the self-reported stress levels in the range 1–10 in the questionnaires following the 2 levels of the Stroop Color Word Task.
Electronics 12 02528 g0a1
Figure A2. The number of responses given for each of the self-reported stress levels in the range 1–10 in the questionnaires following the 2 levels of the Mental Arithmetic Task.
Electronics 12 02528 g0a2
Figure A3. The number of responses given for each of the self-reported stress levels in the range 1–10 in the questionnaires following the 2 levels of the Text Transcription Task.
Electronics 12 02528 g0a3

References

  1. Bakker, J.; Holenderski, L.; Kocielnik, R.; Pechenizkiy, M.; Sidorova, N. Stess@work: From Measuring Stress to Its Understanding, Prediction and Handling with Personalized Coaching. In Proceedings of the IHI’12—2nd ACM SIGHIT International Health Informatics Symposium, Miami, FL, USA, 28–30 January 2012; pp. 673–677. [Google Scholar]
  2. Picard, R.W. Affective Computing; MIT Press: London, UK, 2000; ISBN 9780262661157. [Google Scholar]
  3. Greene, S.; Thapliyal, H.; Caban-Holt, A. A Survey of Affective Computing for Stress Detection: Evaluating Technologies in Stress Detection for Better Health. IEEE Consum. Electron. Mag. 2016, 5, 44–56. [Google Scholar] [CrossRef]
  4. Cinaz, B.; Arnrich, B.; La Marca, R.; Tröster, G. Monitoring of Mental Workload Levels during an Everyday Life Office-Work Scenario. Pers. Ubiquitous Comput. 2013, 17, 229–239. [Google Scholar] [CrossRef]
  5. Rizwan, M.F.; Farhad, R.; Mashuk, F.; Islam, F.; Imam, M.H. Design of a Biosignal Based Stress Detection System Using Machine Learning Techniques. In Proceedings of the 2019 International Conference on Robotics, Electrical and Signal Processing Techniques (ICREST), Dhaka, Bangladesh, 10–12 January 2019; IEEE: Piscataway, NJ, USA, 2019. [Google Scholar]
  6. Taelman, J.; Vandeput, S.; Vlemincx, E.; Spaepen, A.; Van Huffel, S. Instantaneous Changes in Heart Rate Regulation Due to Mental Load in Simulated Office Work. Eur. J. Appl. Physiol. 2011, 111, 1497–1505. [Google Scholar] [CrossRef] [PubMed]
  7. Liu, Y.; Du, S. Psychological Stress Level Detection Based on Electrodermal Activity. Behav. Brain Res. 2018, 341, 50–53. [Google Scholar] [CrossRef] [PubMed]
  8. Lopez, F.S.; Condori-Fernandez, N.; Catala, A. Towards Real-Time Automatic Stress Detection for Office Workplaces. In Proceedings of the Annual International Symposium on Information Management and Big Data, Lima, Peru, 3–5 September 2018; Springer: Berlin/Heidelberg, Germany, 2018; pp. 273–288. [Google Scholar]
  9. Amalan, S.; Shyam, A.; Anusha, A.S.; Preejith, S.P.; Tony, A.; Jayaraj, J.; Mohanasankar, S. Electrodermal Activity Based Classification of Induced Stress in a Controlled Setting. In Proceedings of the MeMeA 2018—2018 IEEE International Symposium on Medical Measurements and Applications, Rome, Italy, 11–13 June 2018; Volume 3528725544, pp. 1–6. [Google Scholar] [CrossRef]
  10. Anusha, A.S.; Jose, J.; Preejith, S.P.; Jayaraj, J.; Mohanasankar, S. Physiological Signal Based Work Stress Detection Using Unobtrusive Sensors. Biomed. Phys. Eng. Express 2018, 4, 065001. [Google Scholar] [CrossRef]
  11. Shi, Y.; Nguyen, M.H.; Blitz, P.; French, B.; Fisk, S.; Torre, F.D.; La Smailagic, A.; Siewiorek, D.P. Personalized Stress Detection from Physiological Measurements. In Proceedings of the Second International Symposium on Quality of Life Technology, Washington, DC, USA, 7–10 May 2010. [Google Scholar]
  12. Wijsman, J.; Grundlehner, B.; Penders, J.; Hermens, H. Trapezius Muscle EMG as Predictor of Mental Stress. ACM Trans. Embed. Comput. Syst. 2013, 12, 1–20. [Google Scholar] [CrossRef]
  13. Gunawardhane, S.D.W.; De Silva, P.M.; Kulathunga, D.S.B.; Arunatileka, S.M.K.D. Non Invasive Human Stress Detection Using Key Stroke Dynamics and Pattern Variations. In Proceedings of the 2013 International Conference on Advances in ICT for Emerging Regions (ICTer), Colombo, Sri Lanka, 11–15 December 2013; IEEE: Piscataway, NJ, USA, 2013. [Google Scholar]
  14. Almeida, J.; Rodrigues, F. Facial Expression Recognition System for Stress Detection with Deep Learning. In Proceedings of the 23rd International Conference on Enterprise Information Systems, Virtual Event, 26–28 April 2021; SCITEPRESS—Science and Technology Publications: Setúbal, Portugal, 2021. [Google Scholar]
  15. Giannakakis, G.; Koujan, M.R.; Roussos, A.; Marias, K. Automatic Stress Detection Evaluating Models of Facial Action Units. In Proceedings of the 2020 15th IEEE International Conference on Automatic Face and Gesture Recognition (FG 2020), Buenos Aires, Argentina, 16–20 November 2020; IEEE: Piscataway, NJ, USA, 2020. [Google Scholar]
  16. Aigrain, J.; Dubuisson, S.; Detyniecki, M.; Chetouani, M. Person-Specific Behavioural Features for Automatic Stress Detection. In Proceedings of the 2015 11th IEEE International Conference and Workshops on Automatic Face and Gesture Recognition (FG), Ljubljana, Slovenia, 4–8 May 2015; IEEE: Piscataway, NJ, USA, 2015. [Google Scholar]
  17. Carneiro, D.; Castillo, J.C.; Novais, P.; Fernández-Caballero, A.; Neves, J. Multimodal Behavioral Analysis for Non-Invasive Stress Detection. Expert Syst. Appl. 2012, 39, 13376–13389. [Google Scholar] [CrossRef] [Green Version]
  18. Pepa, L.; Sabatelli, A.; Ciabattoni, L.; Monteriu, A.; Lamberti, F.; Morra, L. Stress Detection in Computer Users from Keyboard and Mouse Dynamics. IEEE Trans. Consum. Electron. 2021, 67, 12–19. [Google Scholar] [CrossRef]
  19. Alberdi, A.; Aztiria, A.; Basarab, A. Towards an Automatic Early Stress Recognition System for Office Environments Based on Multimodal Measurements: A Review. J. Biomed. Inform. 2016, 59, 49–75. [Google Scholar] [CrossRef]
  20. Massaro, A. Internet of Things Solutions in Industry. In Electronics in Advanced Research Industries: Industry 4.0 to Industry 5.0 Advances; IEEE: New York, NY, USA, 2022; pp. 155–202. [Google Scholar]
  21. Da, S.; Fladmark, S.F.; Wara, I.; Christensen, M.; Innstrand, S.T. To Change or Not to Change: A Study of Workplace Change during the COVID-19 Pandemic. Int. J. Environ. Res. Public Health 2022, 19, 1982. [Google Scholar] [CrossRef]
  22. Siddiqui, N.; Dave, R.; Vanamala, M.; Seliya, N. Machine and Deep Learning Applications to Mouse Dynamics for Continuous User Authentication. Mach. Learn. Knowl. Extr. 2022, 4, 502–518. [Google Scholar] [CrossRef]
  23. Naegelin, M.; Weibel, R.P.; Kerr, J.I.; Schinazi, V.R.; La Marca, R.; von Wangenheim, F.; Hoelscher, C.; Ferrario, A. An Interpretable Machine Learning Approach to Multimodal Stress Detection in a Simulated Office Environment. J. Biomed. Inform. 2023, 139, 104299. [Google Scholar] [CrossRef]
  24. Koldijk, S.; Neerincx, M.A.; Kraaij, W. Detecting Work Stress in Offices by Combining Unobtrusive Sensors. IEEE Trans. Affect. Comput. 2018, 9, 227–239. [Google Scholar] [CrossRef] [Green Version]
  25. Alberdi, A.; Aztiria, A.; Basarab, A.; Cook, D.J. Using Smart Offices to Predict Occupational Stress. Int. J. Ind. Ergon. 2018, 67, 13–26. [Google Scholar] [CrossRef] [Green Version]
  26. Walambe, R.; Nayak, P.; Bhardwaj, A.; Kotecha, K. Employing Multimodal Machine Learning for Stress Detection. J. Healthc. Eng. 2021, 2021, 9356452. [Google Scholar] [CrossRef]
  27. Liao, W.; Zhang, W.; Zhu, Z.; Ji, Q. A Real-Time Human Stress Monitoring System Using Dynamic Bayesian Network. In Proceedings of the 2005 IEEE Computer Society Conference on Computer Vision and Pattern Recognition (CVPR’05)-Workshops, San Diego, CA, USA, 21–23 September 2005; p. 70. [Google Scholar] [CrossRef]
  28. Kaklauskas, A.; Zavadskas, E.K.; Seniut, M.; Dzemyda, G.; Stankevic, V.; Simkevičius, C.; Stankevic, T.; Paliskiene, R.; Matuliauskaite, A.; Kildiene, S.; et al. Web-Based Biometric Computer Mouse Advisory System to Analyze a User’s Emotions and Work Productivity. Eng. Appl. Artif. Intell. 2011, 24, 928–945. [Google Scholar] [CrossRef]
  29. Androutsou, T.; Angelopoulos, S.; Kouris, I.; Hristoforou, E.; Koutsouris, D. A Smart Computer Mouse with Biometric Sensors for Unobtrusive Office Work-Related Stress Monitoring. In Proceedings of the 2021 43rd Annual International Conference of the IEEE Engineering in Medicine & Biology Society (EMBC), Mexico City, Mexico, 1–5 November 2021; Volume 2021, pp. 7256–7259. [Google Scholar] [CrossRef]
  30. Androutsou, T.; Angelopoulos, S.; Hristoforou, E.; Matsopoulos, G.K.; Koutsouris, D.D. A Multisensor System Embedded in a Computer Mouse for Occupational Stress Detection. Biosensors 2022, 13, 10. [Google Scholar] [CrossRef]
  31. Leijten, M.; Van Waes, L. Keystroke Logging in Writing Research: Using Inputlog to Analyze and Visualize Writing Processes. Writ. Commun. 2013, 30, 358–392. [Google Scholar] [CrossRef] [Green Version]
  32. Arnrich, B.; Setz, C.; La Marca, R.; Tröster, G.; Ehlert, U. What Does Your Chair Know about Your Stress Level? IEEE Trans. Inf. Technol. Biomed. 2010, 14, 207–214. [Google Scholar] [CrossRef]
  33. Bickford, M. Stress in the Workplace: A General Overview of the Causes, the Effects, and the Solutions; Canadian Mental Health Association Newfoundland and Labrador Division: St. John’s, NL, Canada, 2005; pp. 1–44. [Google Scholar]
  34. Scarpina, F.; Tagini, S. The Stroop Color and Word Test. Front. Psychol. 2017, 8, 557. [Google Scholar] [CrossRef] [Green Version]
  35. Kirschbaum, C.; Pirke, K.; Neuropsychobiology, D. Undefined the ’Trier Social Stress Test’—A Tool for Investigating Psychobiological Stress Responses in a Laboratory Setting. Neuropsychobiology 1993, 28, 76–81. [Google Scholar] [CrossRef] [PubMed]
  36. Hart, S.G.; Staveland, L.E. Development of NASA-TLX (Task Load Index): Results of Empirical and Theoretical Research. In Advances in Psychology; Elsevier: Amsterdam, The Netherlands, 1988; pp. 139–183. ISBN 9780444703880. [Google Scholar]
  37. Seyedtabaii, S.; Seyedtabaii, L. Kalman Filter Based Adaptive Reduction of Motion Artifact from Photoplethysmographic Signal. World Acad. Sci. Eng. Technol. 2008, 37, 173–176. [Google Scholar]
  38. Park, S.; Gil, M.-S.; Im, H.; Moon, Y.-S. Measurement Noise Recommendation for Efficient Kalman Filtering over a Large Amount of Sensor Data. Sensors 2019, 19, 1168. [Google Scholar] [CrossRef] [PubMed] [Green Version]
  39. Jerritta, S.; Murugappan, M.; Nagarajan, R.; Wan, K. Physiological Signals Based Human Emotion Recognition: A Review. In Proceedings of the 2011 IEEE 7th International Colloquium on Signal Processing and Its Applications, Penang, Malaysia, 4–6 March 2011; IEEE: Piscataway, NJ, USA, 2011. [Google Scholar]
  40. Hossein Aqajari, S.A.; Naeini, E.K.; Mehrabadi, M.A.; Labbaf, S.; Dutt, N.; Rahmani, A.M. PyEDA: An Open-Source Python Toolkit for Pre-Processing and Feature Extraction of Electrodermal Activity. Procedia Comput. Sci. 2021, 184, 99–106. [Google Scholar] [CrossRef]
  41. Kolakowska, A. A Review of Emotion Recognition Methods Based on Keystroke Dynamics and Mouse Movements. In Proceedings of the 2013 6th International Conference on Human System Interactions (HSI), Sopot, Poland, 6–8 June 2013; IEEE: Piscataway, NJ, USA, 2013. [Google Scholar]
  42. Gjoreski, M. Continuous Stress Detection Using a Wrist Device—In Laboratory and Real Life. In Proceedings of the 2016 ACM International Joint Conference on Pervasive and Ubiquitous Computing, Heidelberg Germany, 12–16 September 2016; pp. 1185–1193. [Google Scholar]
  43. Peternel, K.; Pogačnik, M.; Tavčar, R.; Kos, A. A Presence-Based Context-Aware Chronic Stress Recognition System. Sensors 2012, 12, 15888–15906. [Google Scholar] [CrossRef]
  44. Hernandez, J.; Paredes, P.; Roseway, A.; Czerwinski, M.; Kołakowska, A. Under Pressure: Sensing Stress of Computer Users. In Proceedings of the CHI’14, SIGCHI Conference on Human Factors in Computing Systems, Toronto, ON, Canada, 26 April–1 May 2014; pp. 51–60. [Google Scholar]
  45. Chawla, N.V.; Bowyer, K.W.; Hall, L.O.; Kegelmeyer, W.P. SMOTE: Synthetic Minority over-Sampling Technique. J. Artif. Intell. Res. 2002, 16, 321–357. [Google Scholar] [CrossRef]
  46. De Fazio, R.; De Vittorio, M.; Visconti, P. Innovative IoT Solutions and Wearable Sensing Systems for Monitoring Human Biophysical Parameters: A Review. Electronics 2021, 10, 1660. [Google Scholar] [CrossRef]
  47. Setiawan, R.; Budiman, F.; Basori, W.I. Stress Diagnostic System and Digital Medical Record Based on Internet of Things. In Proceedings of the 2019 International Seminar on Intelligent Technology and Its Applications (ISITIA), Surabaya, Indonesia, 28–29 August 2019; IEEE: Piscataway, NJ, USA, 2019. [Google Scholar]
  48. Singh, R.; Gehlot, A.; Rashid, M.; Saxena, R.; Akram, S.V.; Alshamrani, S.S.; AlGhamdi, A.S. Cloud Server and Internet of Things Assisted System for Stress Monitoring. Electronics 2021, 10, 3133. [Google Scholar] [CrossRef]
  49. Rodic-Trmcic, B.; Labus, A.; Bogdanovic, Z.; Despotovic-Zrakic, M.; Radenkovic, B. Development of an IoT System for Students’ Stress Management. Facta Univ. Ser. Electron. Energetics 2018, 31, 329–342. [Google Scholar] [CrossRef] [Green Version]
  50. Zubair, M.; Yoon, C. Biomedical Signal Processing and Control Multilevel Mental Stress Detection Using Ultra-Short Pulse Rate Variability Series. Biomed. Signal Process. Control 2020, 57, 101736. [Google Scholar] [CrossRef]
  51. Tartare, G.; Zeng, X.; Koehl, L. Development of a Wearable System for Monitoring the Firefighter’s Physiological State. In Proceedings of the 2018 IEEE Industrial Cyber-Physical Systems (ICPS), Saint Petersburg, Russia, 15–18 May 2018; IEEE: Piscataway, NJ, USA, 2018. [Google Scholar]
  52. Raj, J.V.; Sarath, T.V. An IoT Based Real-Time Stress Detection System for Fire-Fighters. In Proceedings of the 2019 International Conference on Intelligent Computing and Control Systems (ICCS), Madurai, India, 15–17 May 2019; IEEE: Piscataway, NJ, USA, 2019. [Google Scholar]
  53. Pluntke, U.; Gerke, S.; Sridhar, A.; Weiss, J.; Michel, B. Evaluation and Classification of Physical and Psychological Stress in Firefighters Using Heart Rate Variability. In Proceedings of the 41st Annual International Conference of the IEEE Engineering in Medicine and Biology Society (EMBC), Berlin, Germany, 23–27 July 2019; Volume 2019, pp. 2207–2212. [Google Scholar] [CrossRef]
  54. Oskooei, A.; Chau, S.M.; Weiss, J.; Sridhar, A.; Martínez, M.R.; Michel, B. DeStress: Deep Learning for Unsupervised Identification of Mental Stress in Firefighters from Heart-Rate Variability (HRV) Data. Stud. Comput. Intell. 2021, 914, 93–105. [Google Scholar] [CrossRef]
  55. Can, Y.S.; Arnrich, B.; Ersoy, C. Stress Detection in Daily Life Scenarios Using Smart Phones and Wearable Sensors: A Survey. J. Biomed. Inform. 2019, 92, 103139. [Google Scholar] [CrossRef]
  56. Osmani, V.; Ferdous, R.; Mayora, O. Smartphone App Usage as a Predictor of Perceived Stress Levels at Workplace. In Proceedings of the 9th International Conference on Pervasive Computing Technologies for Healthcare, Istanbul, Turkey, 20–23 May 2015. [Google Scholar]
  57. Garcia-Ceja, E.; Osmani, V.; Mayora, O. Automatic Stress Detection in Working Environments from Smartphones’ Accelerometer Data: A First Step. IEEE J. Biomed. Health Inform. 2016, 20, 1053–1060. [Google Scholar] [CrossRef] [Green Version]
  58. Carneiro, D.; Novais, P.; Augusto, J.C.; Payne, N. New Methods for Stress Assessment and Monitoring at the Workplace. IEEE Trans. Affect. Comput. 2019, 10, 237–254. [Google Scholar] [CrossRef] [Green Version]
  59. Lawanont, W.; Inoue, M. An Unsupervised Learning Method for Perceived Stress Level Recognition Based on Office Working Behavior. In Proceedings of the 2018 International Conference on Electronics, Information, and Communication (ICEIC), Honolulu, HI, USA, 24–27 January 2018; IEEE: Piscataway, NJ, USA, 2018. [Google Scholar]
  60. Belk, M.; Portugal, D.; Germanakos, P.; Quintas, J.; Christodoulou, E.; Samaras, G. A Computer Mouse for Stress Identification of Older Adults at Work. In Proceedings of the UMAP, Halifax, NS, Canada, 13–17 July 2016. [Google Scholar]
  61. Chigira, H.; Kobayashi, M.; Maeda, A. Mouse with Photo-Plethysmographic Surfaces for Unobtrusive Stress Monitoring. In Proceedings of the 2012 IEEE Second International Conference on Consumer Electronics—Berlin (ICCE-Berlin), Berlin, Germany, 3–5 September 2012; IEEE: Piscataway, NJ, USA, 2012. [Google Scholar]
Figure 1. A schematic diagram of system architecture. Both the behavioral measurements that are logged by the Inputlog and the physiological measurements that are sent to the development board’s cloud backend are being saved in a local database for further analysis.
Electronics 12 02528 g001
Figure 2. The experimental setup. Subjects perform the exercises through a web application, using the computer keyboard and the custom-made computer mouse. A pair of headphones is used throughout the experiment for auditing the sounds involved in the procedure.
Electronics 12 02528 g002
Figure 3. The periods included in the performance of each of the four tasks of the experiment. The control period (CP) of the task always precedes the stress period (SP). After each period, a self-report questionnaire (Q) is filled in. A rest period (RP) is introduced at the beginning and end of the task to allow sufficient recovery time between the different tasks.
Electronics 12 02528 g003
Figure 4. The number of responses given for each of the self-reported stress levels in the range 1–10 in the questionnaires following the 2 levels of the Information Pick Up Task.
Electronics 12 02528 g004
Table 1. Stress detection studies combining physiological parameters and computer interaction features.
StudyParametersClassification MethodsResults
[23]Keyboard features, mouse features, heart rate variability Support vector machines, Random Forests, Light Gradient boosting machinesF1 scores of 0.625, 0.631 and 0.775 for the prediction of perceived stress, arousal, and valence (LightGBM)
[24]SWELL-KW datasetNearest neighbors algorithms, Bayesian approaches, Support vector machines, Classification trees, Artificial neural networkAccuracy up to 90% (SVM)
[25]SWELL-KW datasetNaive Bayes, Support Vector Machines, C4.5 tree algorithm, AdaBoost, SMOTEBoost, RUSBoostComputer-use patterns and body posture features are best predictors for stress and mental workload levels
[26]SWELL-KW datasetArtificial Neural Network Accuracy up to 96.09%
[27]Heart rate, skin temperature, Galvanic skin response, facial expressions, mouse features, blink features, head movement features, performance measurementsDynamic Bayesian NetworkThe inferred user stress level is consistent with that predicted by psychological theories (correlation coefficients using all evidence ≥0.79).
[28]Heart rate, temperature, humidity, skin conductance, touch intensityLinear Regression modelsDiastolic blood pressure, systolic blood pressure and temperature are predictors of stress levels (p-values → 0)
Table 2. The set of features extracted from the physiological and behavioral measurements of the data set.
TypeParameterFeatures
PhysiologicalBPMMean, std, max, min
SCMean, number of peaks, maximum peak
BehavioralKeystroke dwell timeMean, std, max, min, PtP
Keystroke down-to-down timeMean, std, max, min, PtP
VelocitySingle value
LatencyMean, std, max, min, PtP
Number of errorsSingle value
Mouse action timeMean, std, max, min, PtP
Mouse pause timeMean, std, max, min, PtP
Number of clicksSingle value
Number of scrollsSingle value
Total mouse distanceSingle value
Table 3. The performance results of the classification models that were based on the analysis of physiological features, derived from the Stroop Color Word Task and the Mental Arithmetic Task. The evaluation metrics of accuracy and F1 scores are presented for all the labels defined during data annotation.
Label 1Label 2Label 3
ModelAccuracy
(%)
F1 ScoreAccuracy
(%)
F1 ScoreAccuracy
(%)
F1 Score
SVM67.590.6574.780.7566.020.66
k-NN64.100.6478.610.8170.310.71
Decision Tree67.360.6778.290.7971.380.72
Random Forest71.880.7286.450.8676.070.77
XGBoost70.120.7084.510.8574.160.74
RUSBoost64.850.6470.460.7066.470.66
LightGBM70.130.7185.330.8575.220.75
AdaBoost65.120.6572.380.7167.760.67
Table 4. The performance results of the classification models that were based on the analysis of behavioral features, derived from the use of the keyboard during the Text Transcription Task. The evaluation metrics of accuracy and F1 scores are presented for all the labels defined during data annotation.
Label 1Label 2Label 3
ModelAccuracy
(%)
F1 ScoreAccuracy
(%)
F1 ScoreAccuracy
(%)
F1 Score
SVM58.350.6079.760.8264.940.65
k-NN62.550.6486.510.8872.310.75
Decision Tree59.370.5985.110.8670.560.71
Random Forest68.360.6892.120.9280.340.81
XGBoost68.600.6992.940.9378.550.79
RUSBoost60.800.6180.480.8164.450.63
LightGBM66.650.6791.430.9176.800.77
AdaBoost60.190.6181.430.8265.280.64
Table 5. The performance results of the classification models that were based on the analysis of behavioral features, derived from the use of the computer mouse during the Information Pick Up Task. The evaluation metrics of accuracy and F1 scores are presented for all the labels defined during data annotation.
Label 1Label 2Label 3
ModelAccuracy
(%)
F1 ScoreAccuracy
(%)
F1 ScoreAccuracy
(%)
F1 Score
SVM62.750.6862.860.7157.820.65
k-NN71.020.7473.130.7665.460.67
Decision Tree72.410.7376.290.7769.500.70
Random Forest79.010.8083.240.8373.450.74
XGBoost79.470.8081.760.8272.690.73
RUSBoost65.660.6768.890.7063.450.65
LightGBM80.200.8082.850.8374.450.75
AdaBoost66.590.6869.520.7062.940.64
Table 6. The performance results of the classification models that were based on the analysis of physiological features, derived from the use of the computer mouse during the Information Pick Up Task. The evaluation metrics of accuracy and F1 scores are presented for all the labels defined during data annotation.
Label 1Label 2Label 3
ModelAccuracy
(%)
F1 ScoreAccuracy
(%)
F1 ScoreAccuracy
(%)
F1 Score
SVM65.150.6473.150.7368.180.68
k-NN73.150.7580.280.8272.150.73
Decision Tree71.780.7380.960.8270.250.71
Random Forest79.330.8089.210.8978.100.78
XGBoost78.030.7888.480.8976.690.76
RUSBoost64.310.6474.210.7468.680.69
LightGBM77.380.7887.420.8877.020.77
AdaBoost64.570.6475.390.7670.660.71
Table 7. The performance results of the classification models that were based on the analysis of the concatenation of physiological and behavioral features, derived from the use of the computer mouse during the Information Pick Up Task. The evaluation metrics of accuracy and F1 scores are presented for all the labels defined during data annotation.
Label 1Label 2Label 3
ModelAccuracy
(%)
F1 ScoreAccuracy
(%)
F1 ScoreAccuracy
(%)
F1 Score
SVM69.270.6976.500.7864.940.66
k-NN73.030.7676.840.8067.460.69
Decision Tree71.760.7279.890.8167.850.68
Random Forest81.620.8189.380.8974.530.74
XGBoost82.130.8290.010.9076.810.77
RUSBoost71.320.7177.290.7767.370.67
LightGBM81.630.8290.060.9077.600.77
AdaBoost73.420.7379.660.7967.140.67
Table 8. The performance results of the classification models that were based on the decision-level fusion analysis of the parameters extracted by the use of the computer keyboard and mouse during the execution of the Information Pick Up Task. The evaluation metrics of accuracy and F1 scores are presented for all the labels defined during data annotation.
Label 1Label 2Label 3
ModelAccuracy
(%)
F1 ScoreAccuracy
(%)
F1 ScoreAccuracy
(%)
F1 Score
Random Forest69.430.6274.100.4961.200.57
XGBoost65.670.5473.260.5459.100.56
LightGBM63.270.5572.130.5659.800.58
Disclaimer/Publisher’s Note: The statements, opinions and data contained in all publications are solely those of the individual author(s) and contributor(s) and not of MDPI and/or the editor(s). MDPI and/or the editor(s) disclaim responsibility for any injury to people or property resulting from any ideas, methods, instructions or products referred to in the content.

