Article

Visual Extraction of Refined Operation Mode of New Power System Based on IPSO-Kmeans

1
School of Computer Science, Northeast Electric Power University, Jilin 132012, China
2
Jilin Engineering Technology Research Center of Intelligent Electric Power Big Data Processing, Jilin 132012, China
*
Author to whom correspondence should be addressed.
Electronics 2023, 12(10), 2326; https://doi.org/10.3390/electronics12102326
Submission received: 12 April 2023 / Revised: 15 May 2023 / Accepted: 17 May 2023 / Published: 22 May 2023

Abstract

:
Due to the influence of the high proportion of renewable energy penetration, the time-varying and complex operation mode of the new power system is gradually increasing, leading to a lack of fineness and practicality of traditional operation modes. To this end, a new visual extraction method for fine operation mode of power system is proposed. Specifically, aiming at the dimensional problem between high-dimensional electrical characteristic variables, a power grid operation data preprocessing method based on maximum absolute standardization (MaxAbs) is designed. Then, in order to reduce the impact of redundant features on the accuracy of the operation mode extraction results, the Pearson correlation coefficient is introduced to optimize the feature space relationship matrix, constructing a screening model of operating mode characteristic variables based on pearson kernel principal component analysis (P_KPCA). Then, with the clustering elbow index as the constraint condition, a K-means algorithm based on improved particle swarm optimization (IPSO-Kmeans) was proposed to realize fine operation mode extraction. Finally, the experimental analysis is carried out with the actual operation data of the power grid for one year and based on uniform manifold approximation and projection (UMAP) to visualize the extraction results of the operation mode. The validity and accuracy of the proposed method are verified.

1. Introduction

The proposal of dual carbon targets has led to the rapid development of renewable energy such as wind power and photovoltaics [1,2]. Vigorous development of renewable energy is an important trend in building a new generation of low-carbon and clean power systems. Access to a high proportion of renewable energy will have a profound impact on the operation mode [3]. As the penetration rate of renewable energy increases, the uncertainty of the power system increases significantly [4]. At the same time, the uncertainty of renewable energy output greatly increases the number of combinations of operating scenarios [5]. Analyzing the power system operation mode is the basis for the formulation of power system dispatching strategies. However, the number of operation scenarios to be considered and the difficulty of analysis are also increasing day by day. Traditional power system analysis methods based on models and experience are increasingly difficult to cope with the massive and changeable operation modes in power system operation, planning, and stability analysis [6]. Since the operation mode in the traditional power system is mainly affected by the load and the season, and its size and direction of the tidal current are relatively fixed. Typically, the system’s short-circuit current maximum value, minimum value, wet season, dry season, and other specific rules are used to select typical operation modes to evaluate the safety and stability of the power system [7]. However, in the new power system, with the access of a large number of renewable energy and power electronic equipment, the time-varying and complex operation mode of the power system is increasing day by day, and it is showing a trend of further diversification [8,9]. Traditional analysis methods based on manual experience cannot meet the needs of refined operation of power systems, and it is difficult to restore the real situation in system operation. Therefore, it is urgent to carry out the research on the refined operation mode extraction method under the new power system to ensure the reliability, safety, and economy of the power system operation.
From a macro point of view, the operation mode of the power system is to ensure the safe and economical operation of the system, according to the power generation plan, the equipment maintenance plan, and the actual situation of the power grid, etc. The operation strategy is arranged by comprehensively considering factors such as weather, holidays, recent water conditions, fuel supply, and equipment conditions. If the massive amount of electricity generated during operation can be effectively processed and utilized, extracting a more refined operation mode can guide dispatchers and operators to deal with power fluctuations correctly and efficiently during power grid operation, improve the consumption rate and stability of grid-connected new energy to ensure the safe, stable, and economic operation of the power system [10].
For a long time, experts from China and abroad have conducted extensive research on the application of artificial intelligence methods in the extraction of power system operation modes:
(1)
Taking key sections of the power grid as the entry point, extended calculations are carried out from different angles, such as transient stability margin, section quota, and limit transmission capacity, etc. Among them, [11] identified the strongly correlated sections based on the transient stability margin, improved the section monitoring accuracy of dispatching operators, and laid the foundation for the rationalization of the operation mode. The limit transmission capacity is an important index to evaluate the safe operation status of the transmission section. Ref. [12] analyzed the conditions affecting the section limit rules and proposed a method based on the branch power flow and the number of start-up units as the judgment rules to realize the automatic matching of section quotas and power generation plans and tap the transmission potential of the power grid. Ref. [13] proposed a search method for key transmission interface; the missing sections are searched to complement the initial sections, and then the key transmission interface is determined, reducing the possibility of missed selection. Furthermore, [14] proposed an FCM clustering algorithm based on fuzzy theory to solve the clustering problem of transmission lines in power system. Refs. [15,16] studied the calculation method of the real-time limit transmission capacity of the key section to solve the demand of power grid online analysis. However, this research method generally faces the problem that the selection of the initial section depends on the experience of experts or dispatchers, and in the new power system, the traditional safe operation area division method also has shortcomings, such as a single safety margin index, missed or wrongly selected lines, and so on;
(2)
The operating mode can be extracted based on machine learning algorithms, such as traditional clustering algorithms, hierarchical clustering algorithms, and long-term short-term memory networks. For instance, [5] proposes a power system flexibility evaluation method for typical operating scenarios, which clusters and combines the operating scenarios of new energy and loads to obtain typical operating scenarios and, and the authors propose flexibility evaluation indicators to evaluate the system. Ref. [17] clustered and preprocessed the historical scheduling based on the K-means algorithm then constructed a deep learning model of unit combination based on long short-term memory network and proposed a data-driven intelligent decision-making method for unit combination with self-learning ability. Ref. [18] proposed a hierarchical clustering technique to select typical scenes and consider the temporal and spatial correlation between scenes. Ref. [6] proposes an analysis method for the power system operation mode and its morphological change based on power system timing operation simulation data, analyzing the power system operation mode from qualitative and quantitative perspectives. Ref. [19] constructed a feature quantity library representing the operating section of the system and used the decision tree model to screen the feature quantities. Finally, the similarity clustering of the historical operation sections is carried out by the data-driven method. Ref. [20] proposed a meta-heuristic algorithm to classify the way. Variability and uncertainty in power generation operations are taken into account. At the same time, the total power generation cost is minimized, and the convergence time is shortened.
In general, the integration of renewable energy has a significant impact on the operation mode [21,22]. However, the current method of extracting the typical operation mode is relatively extensive and does not consider the output fluctuation of a high proportion of renewable energy, making it difficult to accurately describe the change of operation mode in the current new power system, and it cannot provide more accurate and detailed operation mode guidance for dispatching and operation personnel. For this reason, based on the simulated operation data of the actual power grid area, this paper proposes a cluster-based visualization extraction method for the refined operation mode of the new power system.
The innovation of this paper is mainly reflected in the following aspects:
(1)
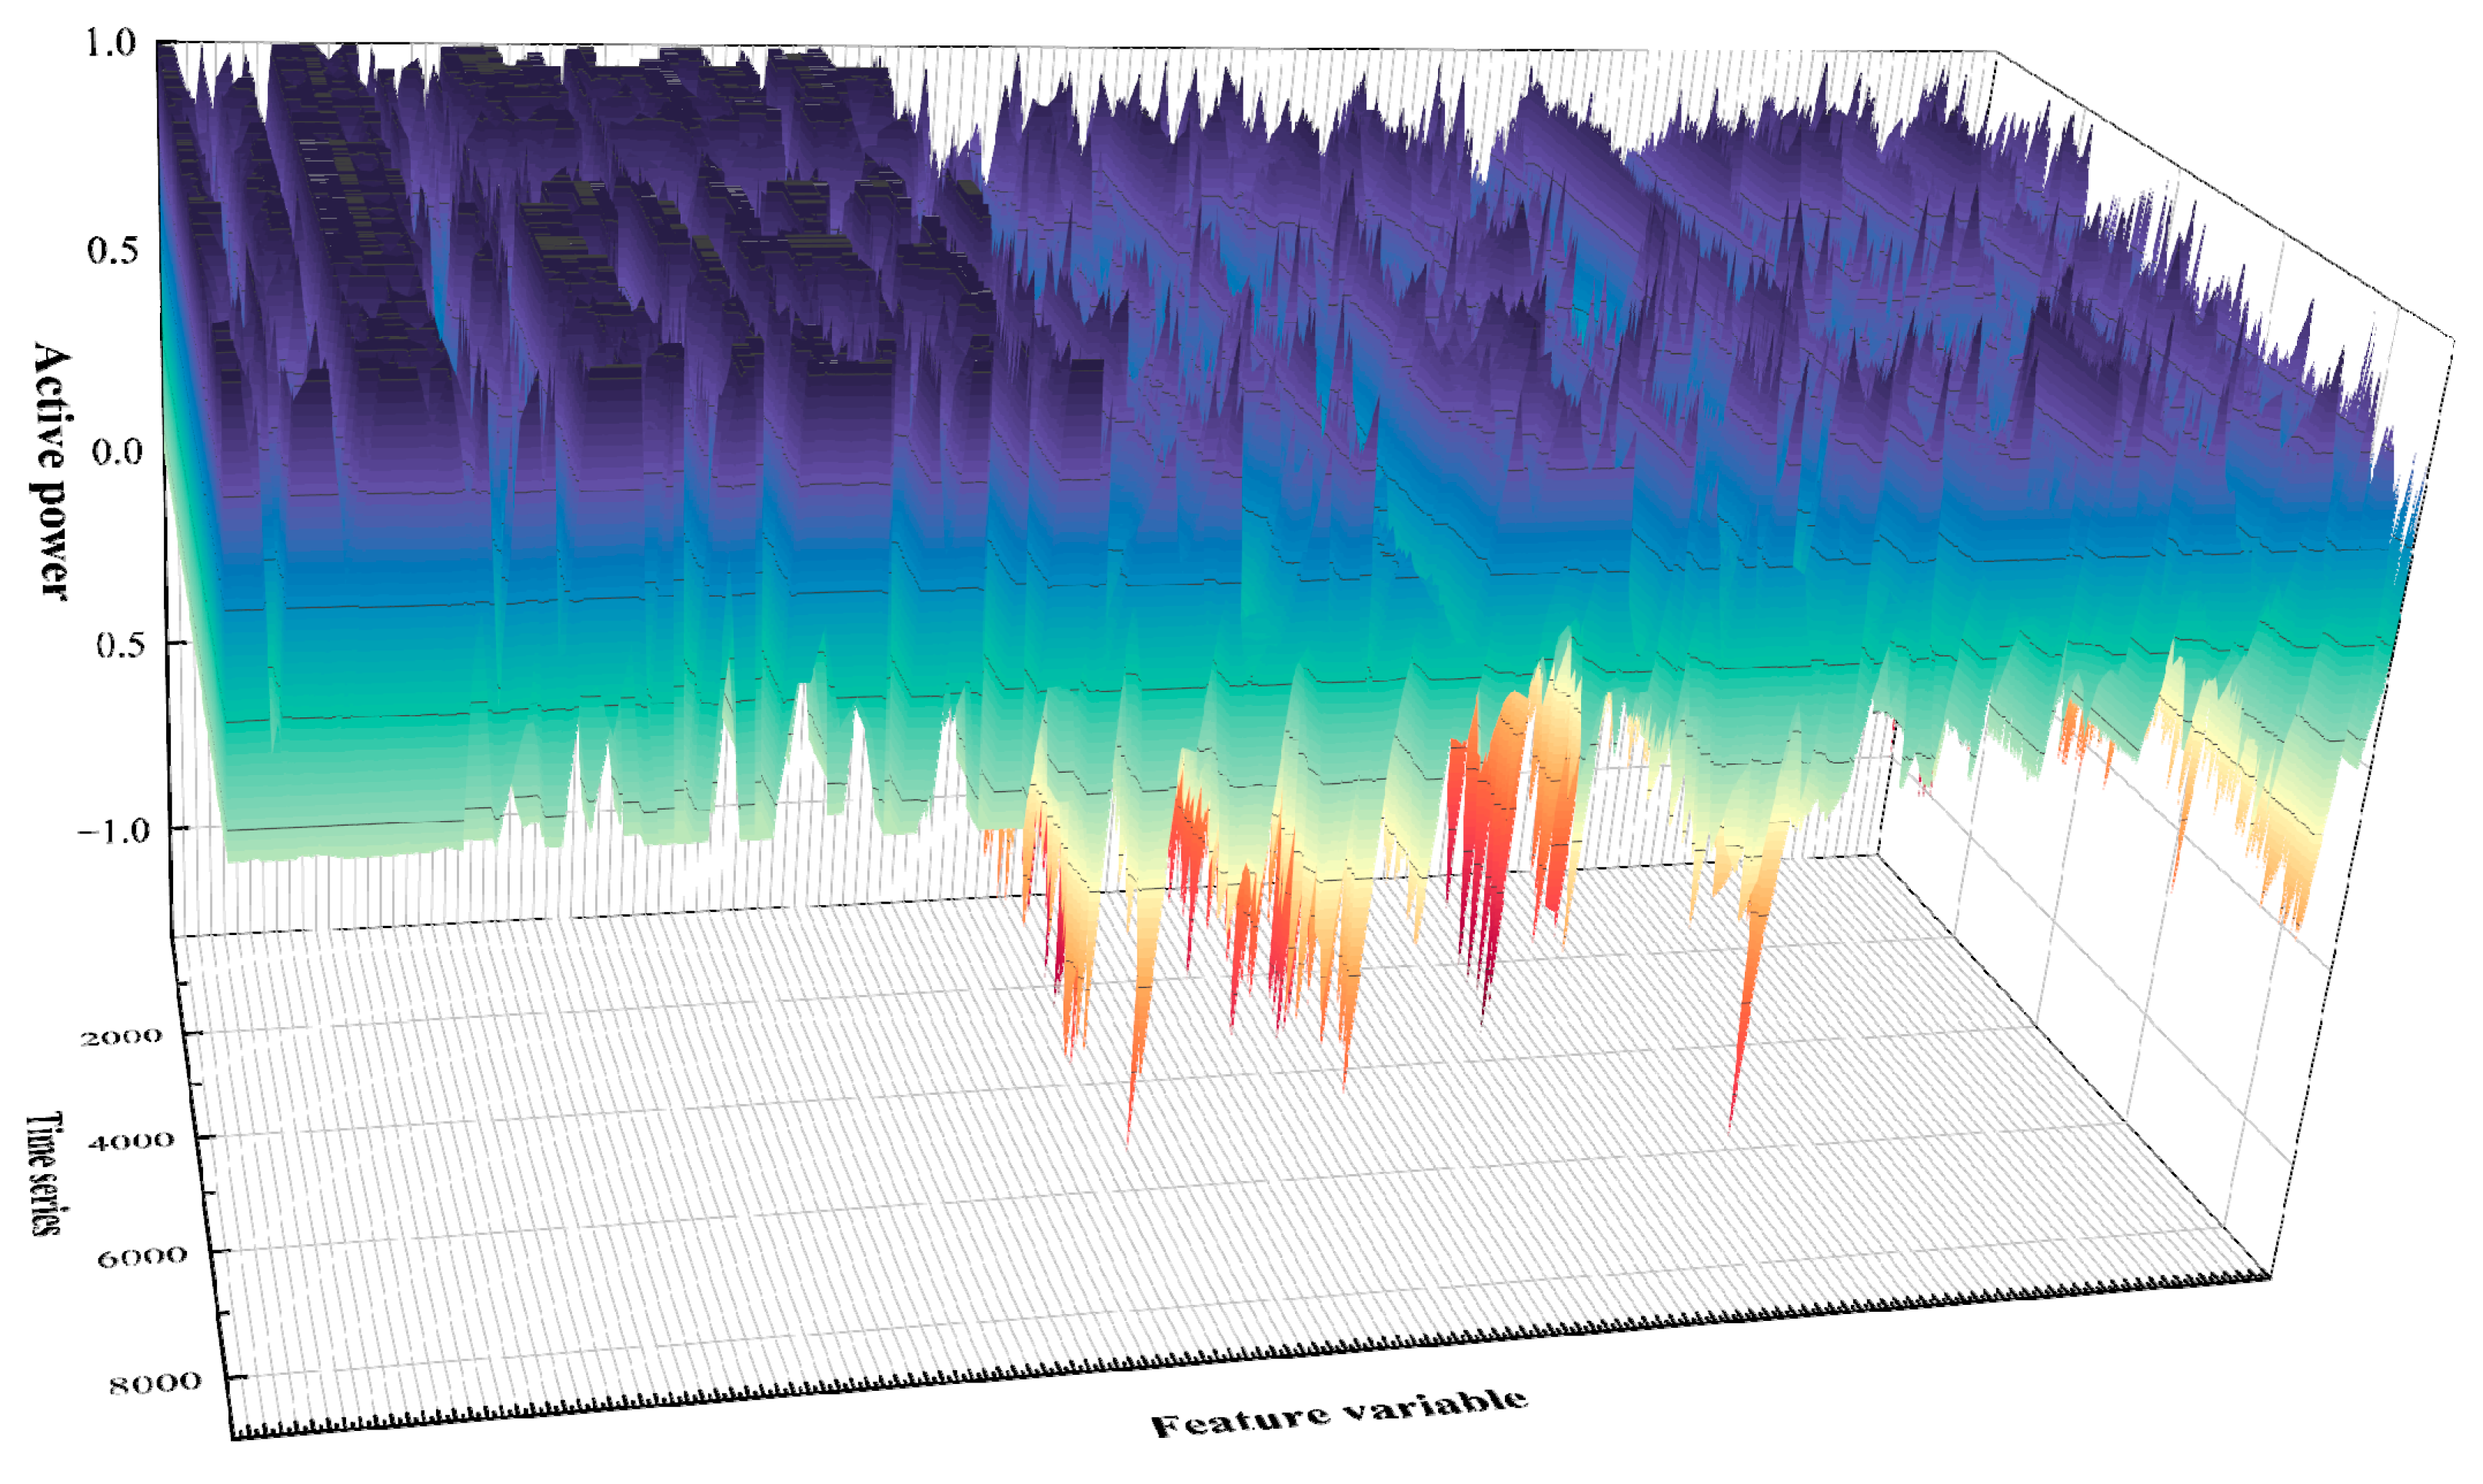
A variable standardization preprocessing method based on the maximum absolute value (MaxAbs) is proposed. It takes account of the characteristics of the power data of the characterization variable and uses the maximum value of the apparent power as the reference value to realize the unification of the dimension and scale of the data value;
(2)
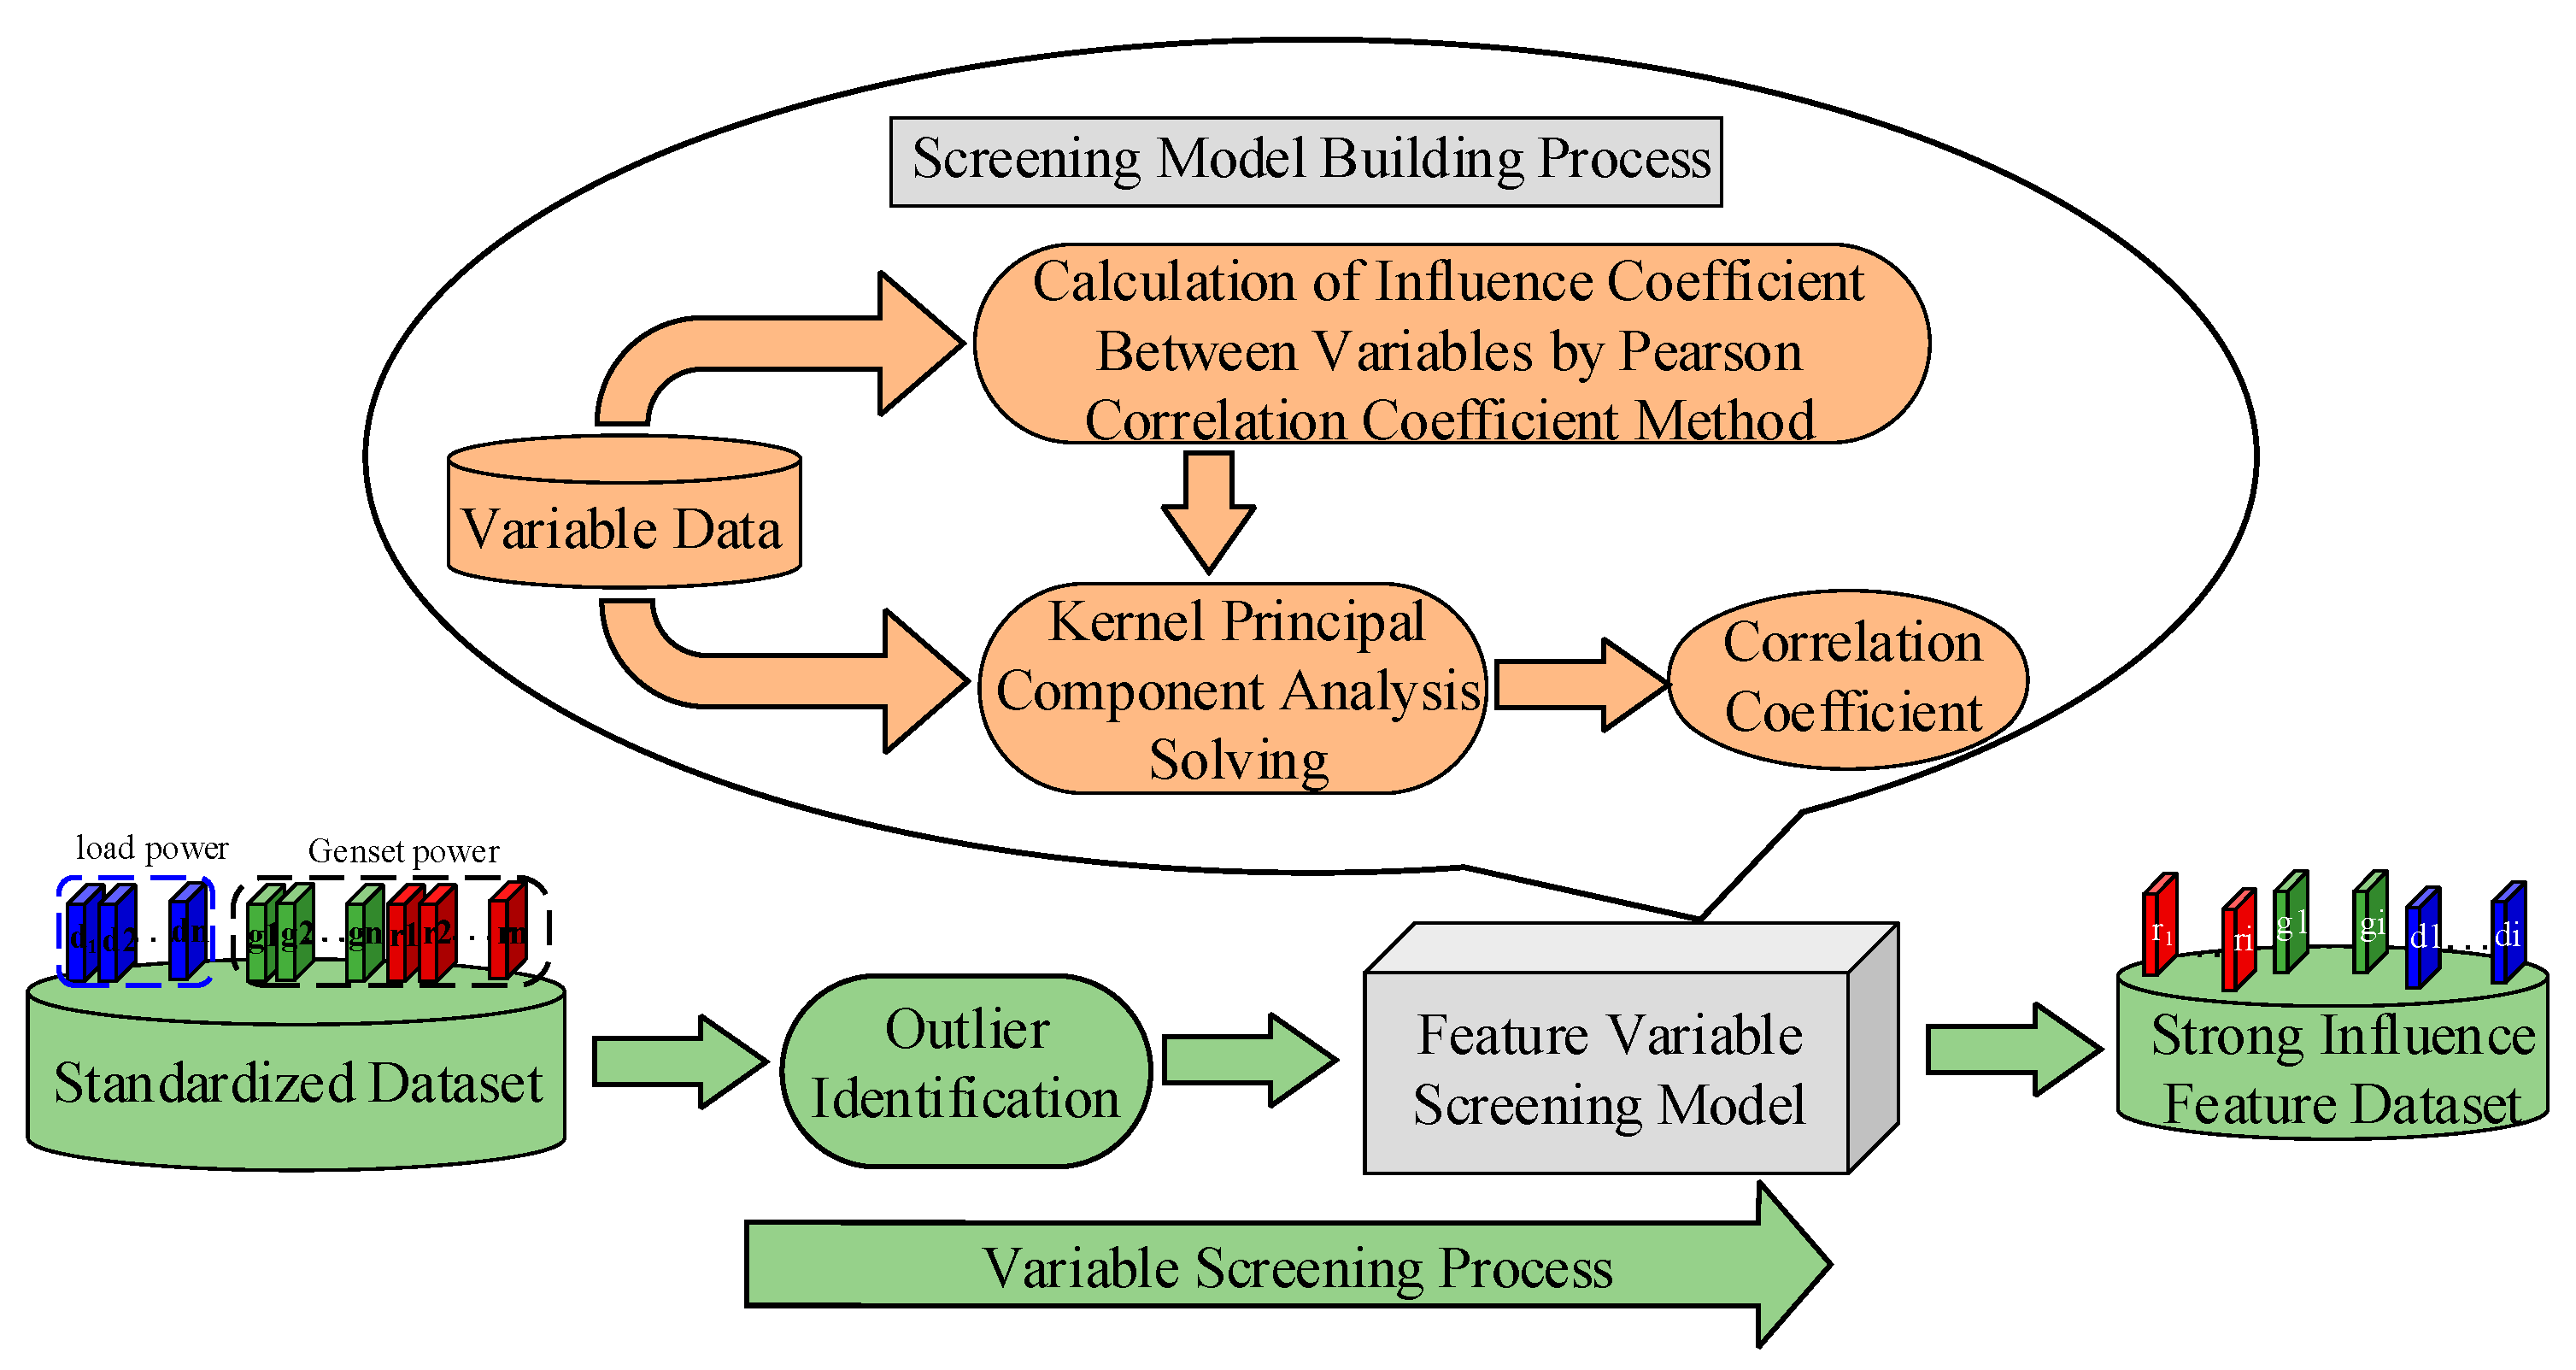
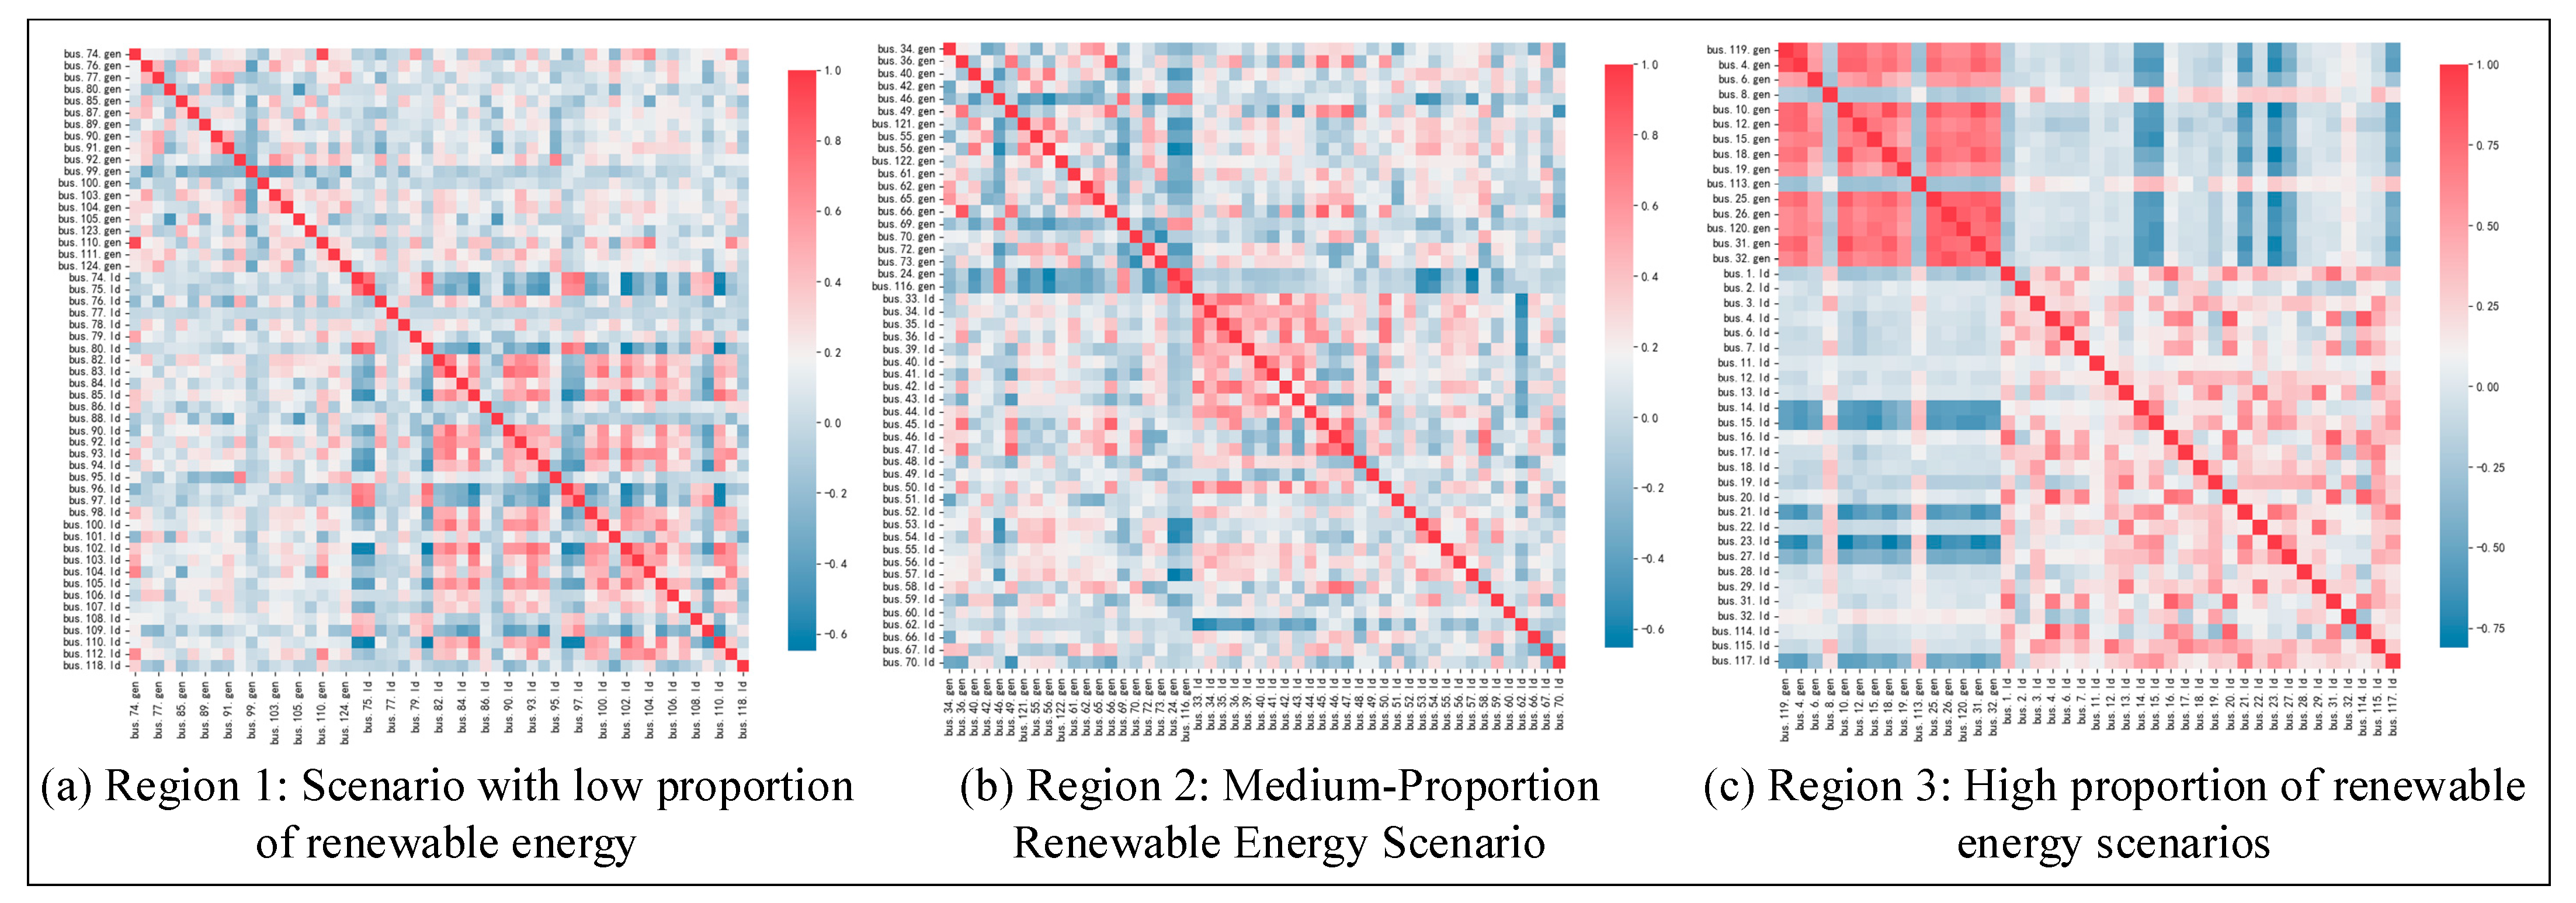
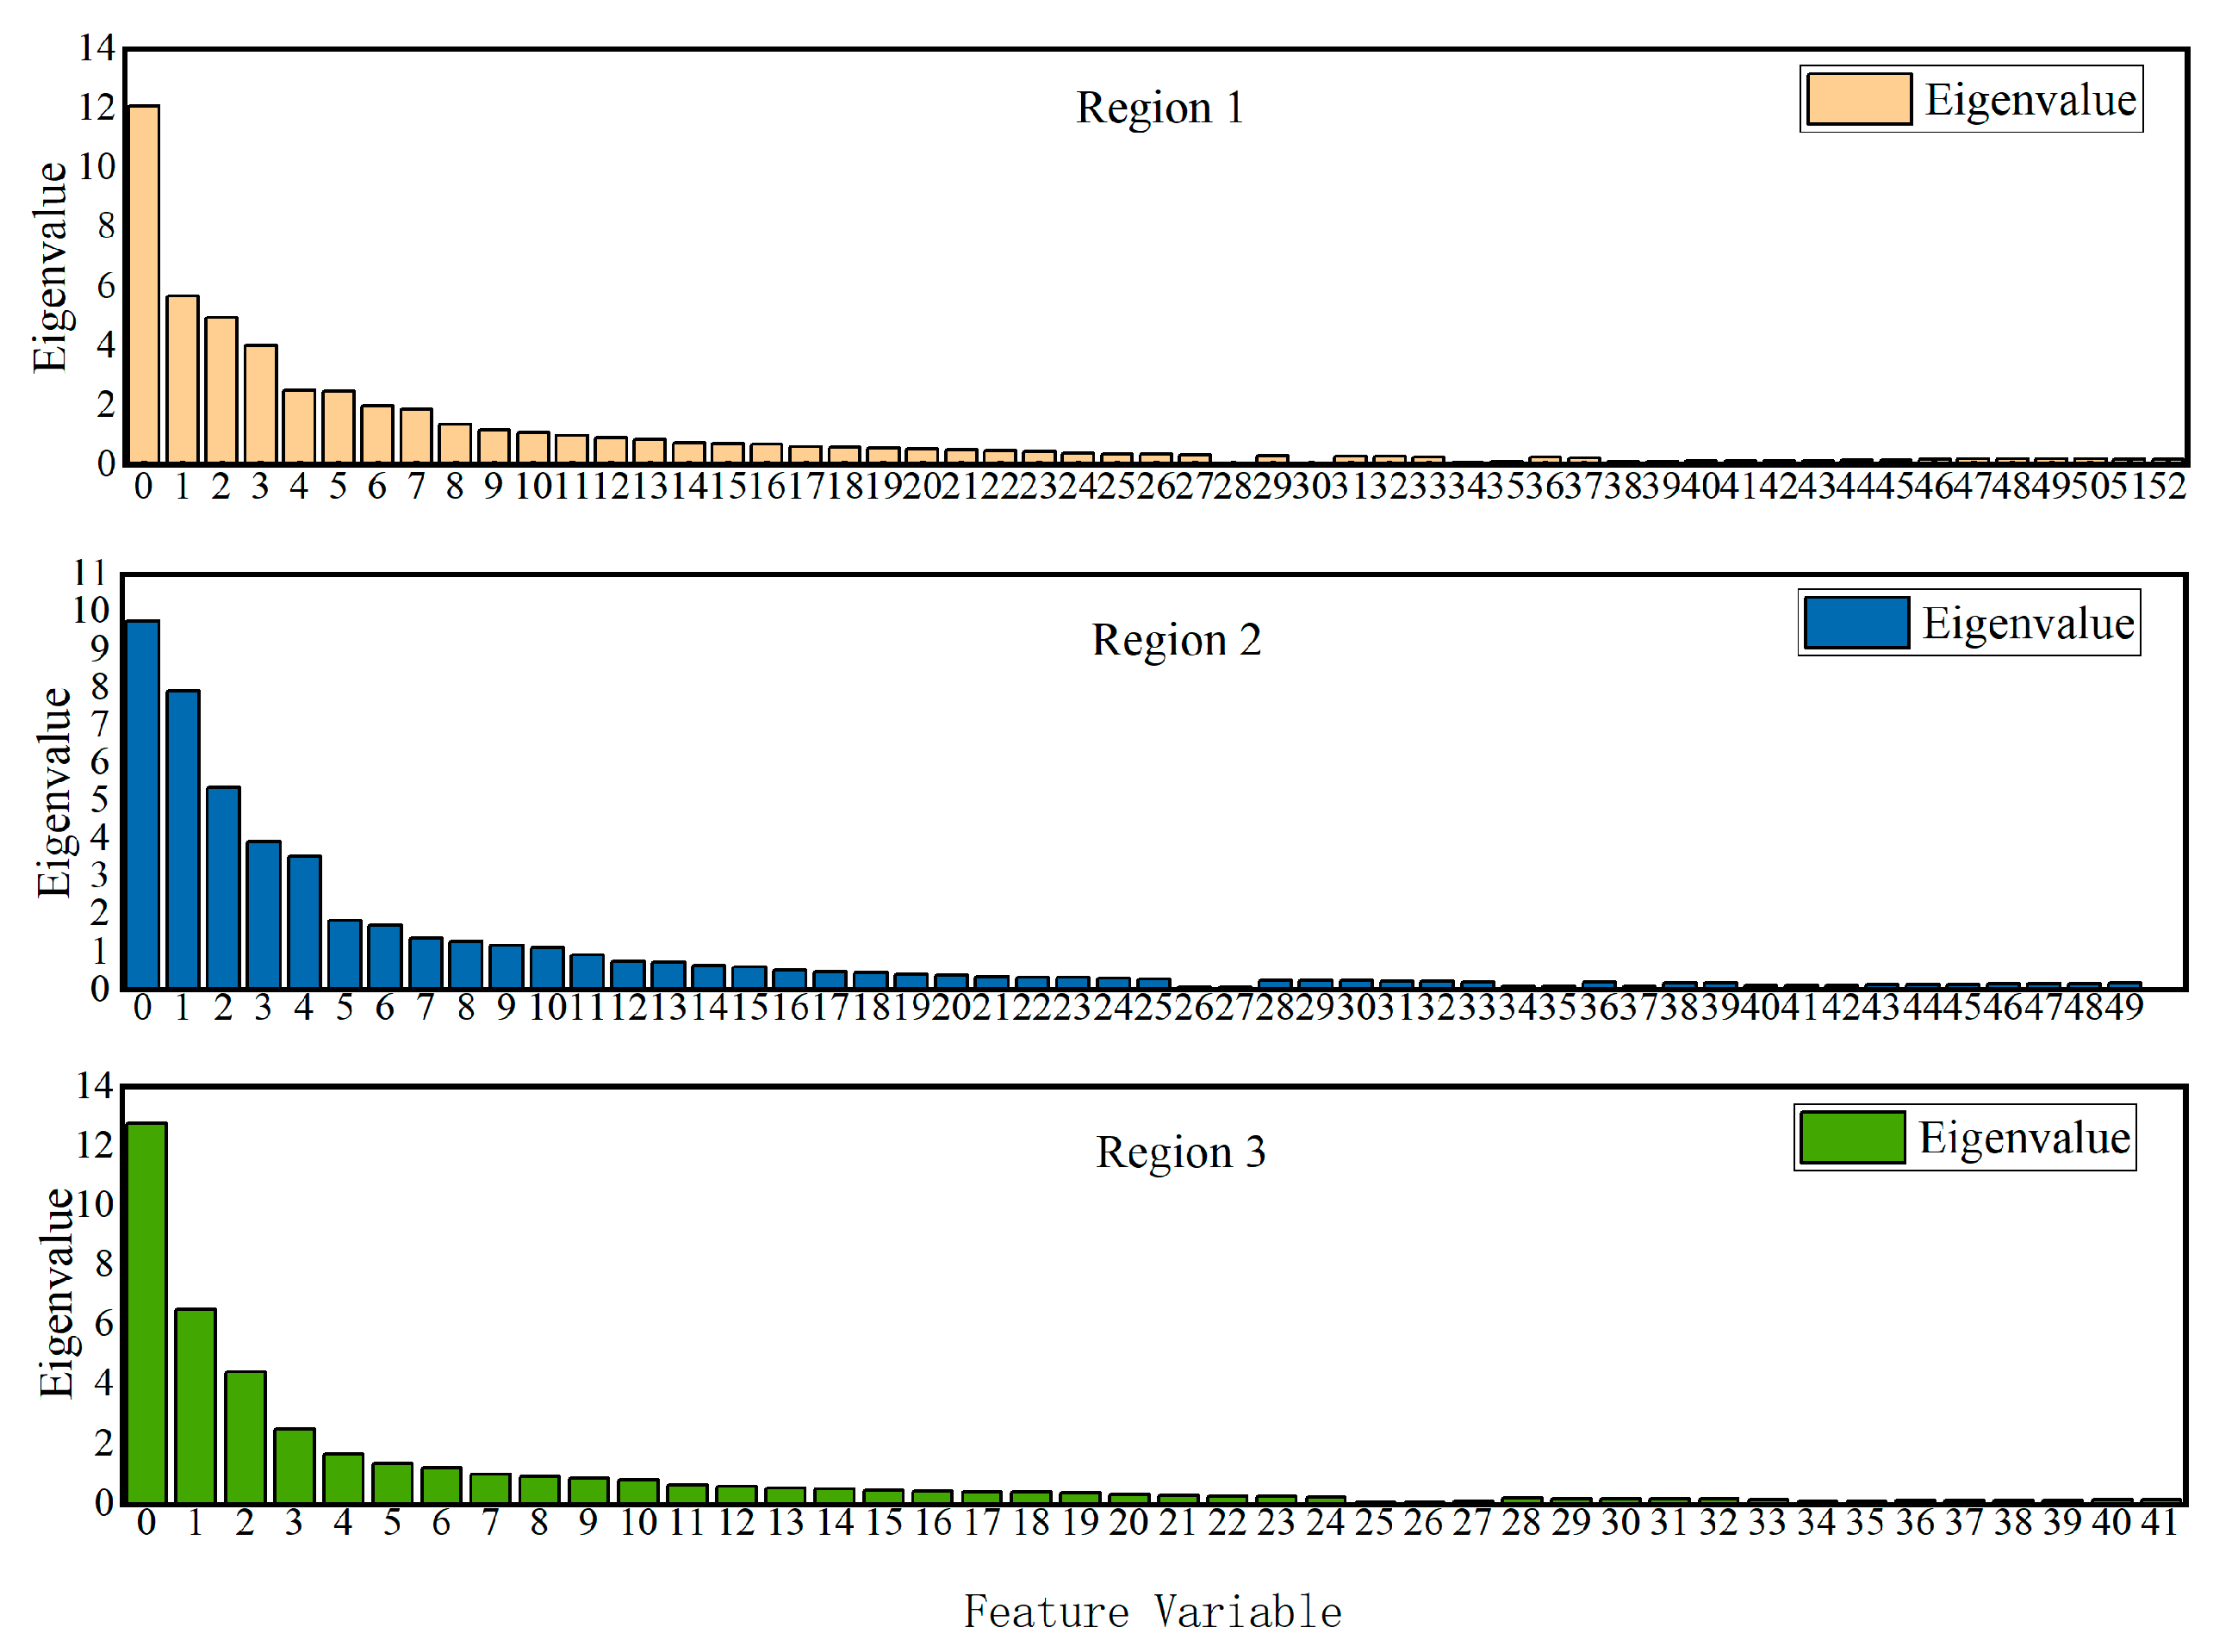
A feature variable screening model based on pearson kernel principal component analysis (P_KPCA) was constructed to improve the accuracy of the extraction results of the operation mode by calculating the correlation between sample points and selecting strongly correlated feature variables;
(3)
An operation mode extraction algorithm was designed based on improved particle swarm optimization traditional clustering (IPSO-Kmeans). Taking the clustering elbow index as the premise, the operation scenarios with similar power output methods are clustered into one group so as to realize the extraction of the refined operation mode of the new power system.
This study is organized as follows: In Section 2, the visual extraction process of the fine operation mode of the new power system will be introduced. Section 3 proposes a new type of power system operation mode representation variable selection and operation data preprocessing algorithm. Section 4 constructs the feature variable screening model. Section 5 introduces the fine-grained operation mode visualization extraction algorithm. Section 6 experimentally analyzes the law of refined operation mode in the new power system. Section 7 summarizes the study.

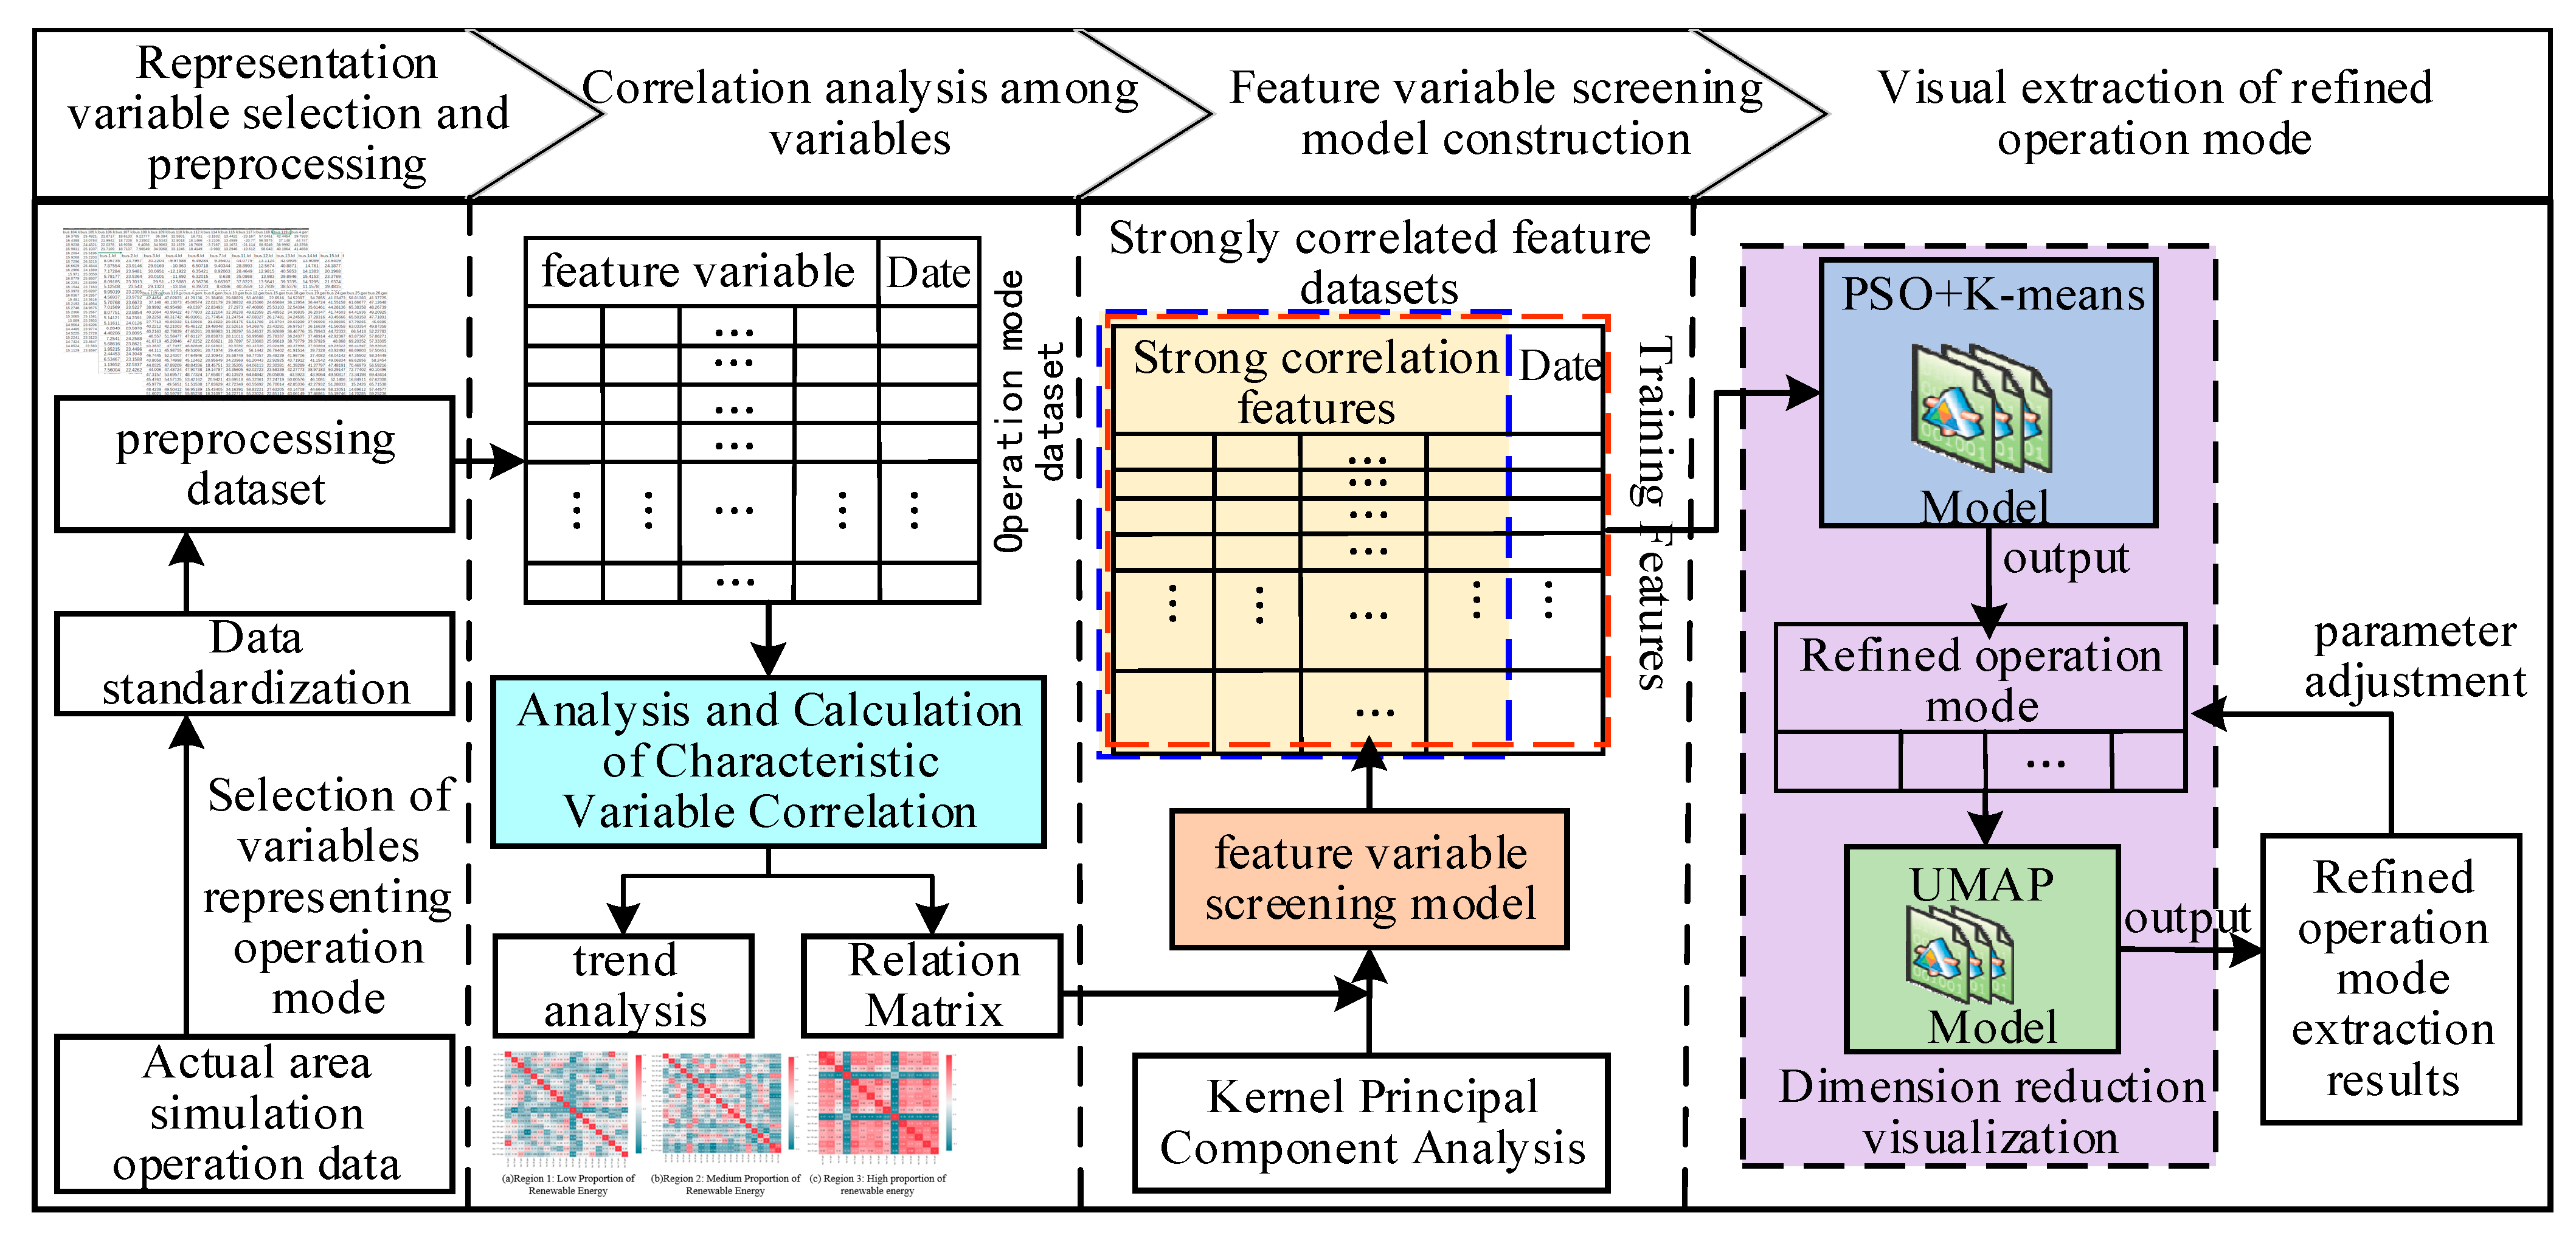
2. Visual Extraction Process of Refined Operation Mode

The refined operation mode can provide dispatchers with a more realistic reference basis, and make greater use of renewable energy, which is conducive to ensuring the safe and stable operation of the power grid. This paper analyzes the actual regional operation simulation data and related electrical quantities and proposes a fine-grained operation mode visualization extraction method that considers the characteristics of new influencing factors such as access to a large amount of renewable energy in the power system. The specific process is shown in Figure 1.
First, the high-dimensional operation data are preprocessed by selecting variables that can characterize the characteristics of the new power system and performing standardized preprocessing operations to eliminate calculation errors caused by excessive numerical differences. Then, redundant dimensions are screened out from the massive high-dimensional operating data to reduce its impact on the extraction results of refined operating methods and improve the operating efficiency of subsequent algorithms. Next, the linear decreasing method is used to improve the optimization ability of the particle swarm algorithm and combine it with the clustering algorithm to realize the extraction of the refined operation mode of the new power system. Finally, the uniform manifold approximation and projection (UMAP) dimensionality reduction visualization algorithm is used to visualize the extracted operation mode in two dimensions so as to analyze the change rule of the operation mode more intuitively.

3. Operation Mode Representation Variable Selection and Preprocessing Method

The power system is a complex network with a large number of nodes and the nodes are interconnected. It includes multiple links such as power generation, power transmission, power transformation, and power consumption. The status of components put into operation in each link is uniformly calculated and controlled by the system dispatching control center. For example, the generator has a power-on state and a power-off state, and the output power at power-on time can also be regarded as different operating states. The difference in transmission power of the transmission line determines that the components are in different states. In addition, the load link undergoes state transfer as demand changes. Therefore, the combination of different states of components put into operation in each link constitutes different system operation modes.

3.1. Selection of Operating Mode Characterization Variables

The operation mode of the power system includes a variety of variables, such as line flow, unit output, node active and reactive power, amplitude, phase angle, and other related parameters. If all of these variables are used as characterization variables for the new power system operation mode, complex data types will cause redundant dimensions, which will affect the speed and accuracy of calculations. Therefore, it is important to carefully select and analyze the variables that are relevant to the operation mode of the new power system.
(1)
Generator set
The power generation side is an important part of the power system. Factors such as the start and stop of the generator set and the output will affect the operation status of the entire power system. The power generation side includes conventional power generation and renewable energy power generation. Uncertainty in the output of renewable energy such as wind power and photovoltaics will lead to time-varying and increasingly complex operation modes of the power system, and the number of combinations of operation modes will increase greatly. The safe and stable operation of the power system will face huge challenges. Thus, it is essential to consider the influence of the generator set’s output when selecting variables that characterize the operation mode of the new power system from among the many complex data.
(2)
Load side
As the tail end of the whole power system framework, load also plays an important role in the analysis of power system operation mode. A variety of flexible resources such as energy storage have been added to the new power system, which has a great impact on the power system. The demand on the load side not only affects the unit output on the generating side, but also indirectly affects the distribution of line power flow. Therefore, the load side should also be considered in the factors that affect the extraction of refined operation modes of the new power system.
(3)
Line flow
Line power flow distribution is not only closely related to the rationality, safety, and economical judgment of power system operation mode; it is also an indispensable part of static and transient stability calculations, fault analysis, and optimization calculations in power systems. So, it is essential in the study of power grid operation.

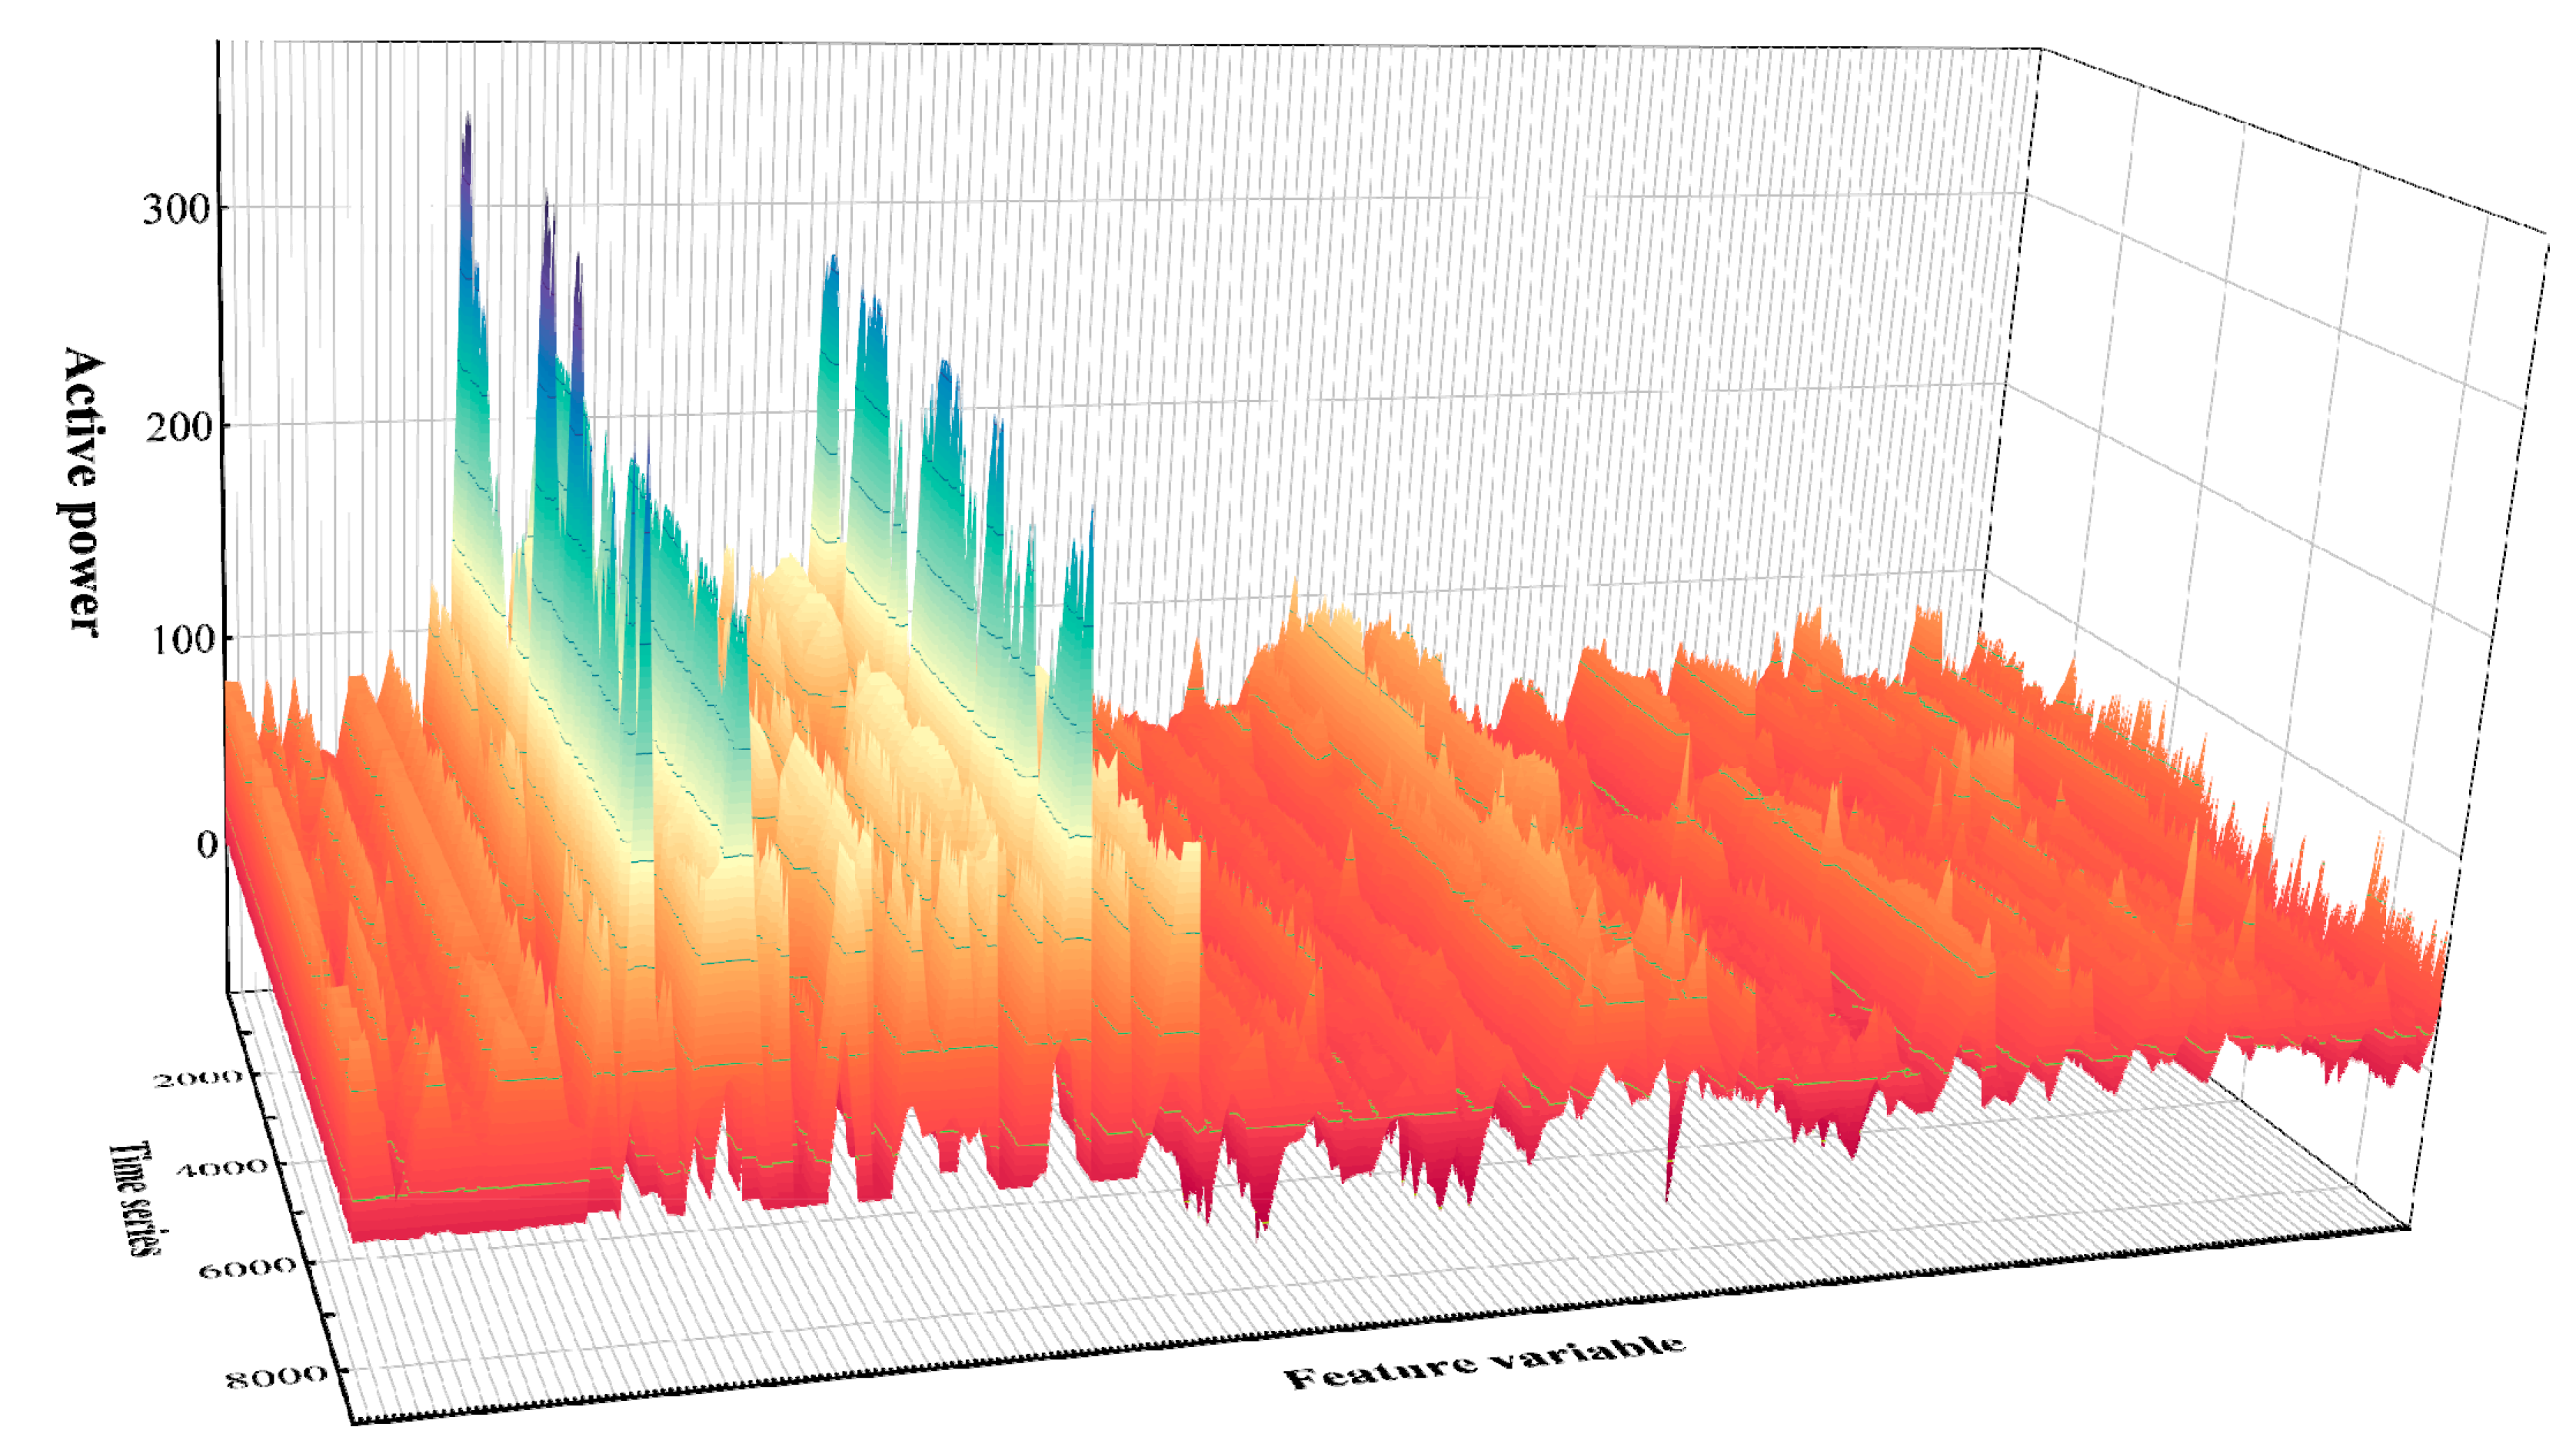
3.2. Variable Data Standardization Based on MaxAbs

Among the variables related to the operation mode of the power system, there may be large numerical differences between the selected characteristic variables of different types or the same type of variables, so it is necessary to standardize them. Data standardization can realize the unification of data dimension and scale and facilitate the screening of subsequent characteristic variables. In this paper, starting from the operating data, a variable standardization processing method based on MaxAbs is designed to realize the numerical standardization of each characteristic variable.
The basic principle of the maximum absolute value standardization method is to realize standardization according to the absolute value of the maximum value on the basis of maintaining the original data distribution structure. The specific standardization processing methods are as follows:
Step 1: Through the analysis of relevant variables, the variable types that can characterize the characteristics of the new power system operation mode are selected.
Step 2: We calculate the apparent power in all running scenarios and take the maximum value of the apparent power at all times as the reference value.
The maximum apparent power of the generator S max ( G ) is:
S max ( G ) = max 1 i n G , 1 t N P 2 G ( i , t ) + Q 2 G ( i , t ) ,
where P G represents the active power of the generator set and Q G represents the reactive power of the generating set.
The maximum apparent power of the load S max ( D ) is:
S max ( D ) = max 1 i n D , 1 t N P 2 D ( i , t ) + Q 2 D ( i , t ) ,
where P D represents the active power on the load side and Q D represents the reactive power on the load side.
Step 3: Calculation of the standard value of active power on the generator side:
P G ( i , t ) = P G ( i , t ) S max ( G ) ,
where P G ( i , t ) represents the active output of the i generator at the t moment; n G represents the total number of power generation nodes; N represents the total number of hours.
Step 4: Calculation of the standard value of active power on the load side:
P D ( i , t ) = P D ( i , t ) S max ( D ) ,
where P D ( i , t ) represents the active load of the i -th load node at time t and n D represents the total number of load nodes.

4. A Screening Model for Operating Mode Characteristic Variables Based on Kernel Principal Component Correlation

The power system is a complex network with numerous nodes and scenarios, which will lead to high dimensionality of operating data. There may also be complex nonlinear correlations between different dimensions, and some active and reactive data may have a high degree of similarity over time and even repeated variables to be selected. Not all characteristic variables have a reference significance for the operation mode [23]. Therefore, it is necessary to eliminate redundant feature variables and select representative feature variables to improve the efficiency of subsequent algorithms and the accuracy of results.
The purpose of feature variable screening is to reduce the high-dimensional features before extracting refined operating modes [24]. On the premise of ensuring that the information of the data set is not lost, the principal components are extracted, and typical low-dimensional feature variables are selected to replace the original high-dimensional feature variables, so as to achieve the purpose of screening out key feature variables.
Principal component analysis (PCA) is a multivariate statistical method and one of the most commonly used dimensionality reduction methods, which has the advantages of high efficiency and easy control of the degree of compression. However, the PCA dimensionality reduction method is suitable for linear transformation data, while the operating mode data is high-dimensional nonlinear data. To solve this problem, this paper adopts kernel principal component analysis (KPCA), which is suitable for dealing with nonlinear data and has fast calculation efficiency and uses the Pearson correlation coefficient method to optimize the solution of the relationship matrix between samples. A feature variable screening model based on P_KPCA was constructed. It can effectively filter feature variables. This approach helps improve the efficiency of subsequent clustering and visualization algorithms. The specific process is shown in Figure 2.
Assuming that M   N -dimensional daily operation vectors form a matrix P 0 = ( p 1 , p 2 p M ) , the specific steps are as follows.
It is determined to use the Gaussian kernel function to map the original operating mode vector into a high-dimensional space, and its expression is
K ( p 1 , p 2 ) = exp ( | p 1 p 2 | 2 σ 2 2 ) .
Then, the relationship matrix K between samples is given— K [ M , M ] —in which K i j = k ( p i , p j ) .
We use the person correlation coefficient method to calculate the distance between samples and improve the Gaussian kernel function:
d p s , p t = cov ( p s , p t ) σ p s , p t = j = 1 n 1 ( p s j p ¯ s ) ( p t j p ¯ t ) j = 1 n 1 ( p s j p ¯ s ) 2 j = 1 n 1 ( p t j p ¯ t ) 2 , s , t = 1 , 2 , 3 M .
We center the resulting square matrix:
K ˜ = K I M K K I M T + I M K I M T .
We decompose its eigenvalue to obtain the eigenvalue λ 1 , λ 2 , λ M and its corresponding eigenvector μ 1 , μ 2 , μ M , in which λ 1 λ 2 λ M .
Then, we the eigenvectors corresponding to the first d larger eigenvalues to generate a dimensionality reduction matrix u , u [ d , M ] .
We obtain the refined operation mode data P of the power system after screening the characteristic variables.
P = K u T

5. Refined Operation Mode Extraction Based on IPSO-Kmeans

The change in the operation mode of the power system can be expressed as the change of the operation law of the active power and reactive power of all nodes, line flow, voltage amplitude, phase angle, and other related electrical state quantities under a given operating state of the power grid [25]. The cluster-based extraction method can categorize the operating data into different groups according to the different values of the electrical quantity data and ensure that the data in the same category have great similarity [26]. In this section, the extraction of refined operation modes is achieved by utilizing the selected strongly correlated feature variables, combined with the method of unsupervised clustering. In addition, the extracted operation modes are visualized in two dimensions to observe the output characteristics of each variable in different operation modes.

5.1. Refined Operation Mode Extraction
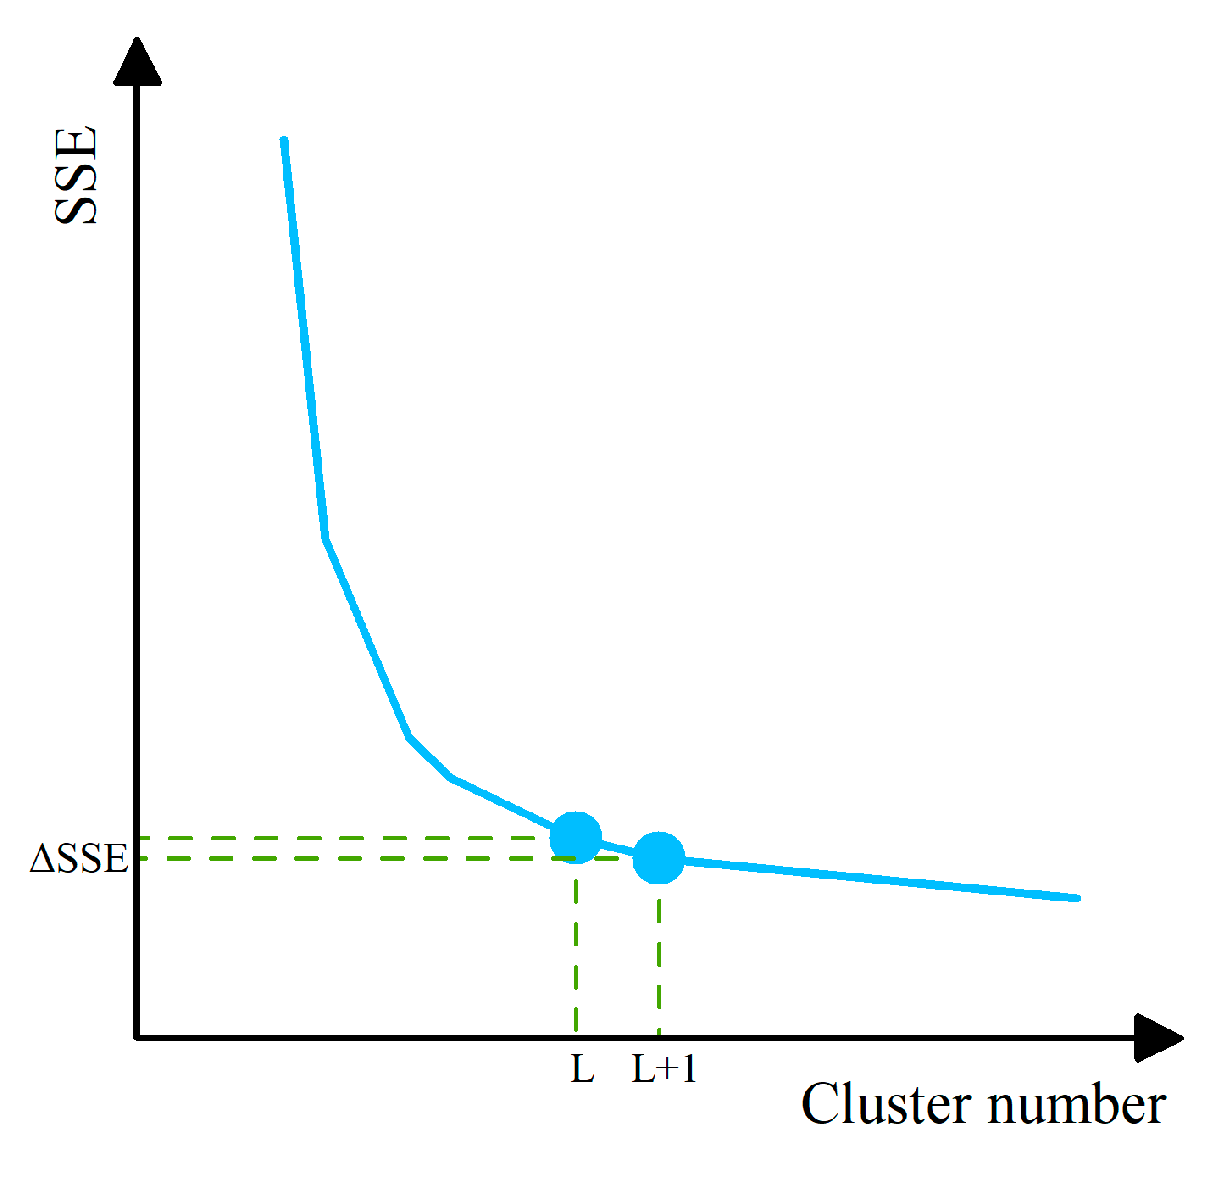
To achieve the extraction of refined operating mode based on IPSO-Kmeans, a clustering algorithm is used to determine its structure and quantity in high-dimensional space. To improve the fineness and accuracy of the extraction algorithm, the elbow index is used as a constraint to determine the number of clusters, and the linear decreasing weight is used to improve the optimization ability of the PSO; it is combined with the K-means algorithm to find the optimal clustering center. The underlying concept behind the improvement of particle swarm optimization and K-means clustering and the combination of the two is as follows.
(1)
Determination of the number of clusters
The number of clusters is a very important part of the clustering algorithm, which usually needs to be given in advance but cannot effectively determine its rationality. So, this paper uses the elbow index to evaluate the clustering effect to determine the optimal number of clusters. The core indicator of the elbow method is the sum of squared errors, and its formula is as follows:
S S E = x = 1 K p Ω x | p - p ¯ x | 2 ,
where K represents the number of clusters; Ω x represents the set of the x -th type of operation mode; and P ¯ x represents the cluster center of the x -th type of operation mode. With the increase in the number of clusters K , the aggregation degree of each type of operation mode gradually increases, and its S S E value decreases accordingly. When the decline of Δ S S E tends to be smooth, it is considered that the value of L at this time is the number of clusters that can achieve the desired effect, as shown in Figure 3.
(2)
Clustering Performance Improvement
The improved method of speed and position iteration in PSO algorithm is:
v i d ( m + 1 ) = w v i d ( m ) + η 1 r 1 ( x i d l i d ( m ) ) + η 2 r 2 ( x g d l i d ( m ) )
l i d ( m + 1 ) = l i d ( m ) + v i d ( m ) ,
where v i d ( m + 1 ) represents the velocity of the i -th particle in the d -th dimension in the k + 1 iteration; and l i d ( m + 1 ) represents the position of the i -th particle in the d -th dimension in the k + 1 iteration. w represents the weight; the optimal solution searched by individual particles is denoted as x i d ; and the global optimal solution is denoted as x g d . The w in the traditional PSO algorithm is fixed, which will greatly reduce the optimization ability of the algorithm. Therefore, the value set in this article decreases linearly from 1, and the method of linear decrease is used to ensure that the search is performed in a large enough range at the beginning of the iteration, and the refined search is started in the middle and late stages. The relation of w is:
w = w max m w max w min m max ,
where m is the current iteration number and w max is the maximum value of weight.
(3)
Cluster Center Iterative Optimization
The loss function of the K-means algorithm is used as the fitness function of the IPSO algorithm, and the mean vector of the sample points in each cluster is:
μ k = 1 N k x i C k x i ,
where N k is the number of samples contained in cluster C k .
Then the fitness function can be defined as:
J = k = 1 K x i C k x i μ k 2 .
We select the appropriate number of clusters and use the particle swarm algorithm’s powerful iterative optimization ability for the center point to find the best cluster center position. Cluster analysis is carried out on the filtered characteristic variables to realize the extraction of refined operation modes of the power system. Specific steps are as follows:
Step 1: Setting parameters. Set the number of particles as L , obtain L groups of initial cluster centers, and then obtain the initial position l i d of L particles. The initial velocity of the particles is set to 0, the maximum number of iterations is set to m max , and the number of iterations is m = 1 ;
Step 2: The operation modes are divided according to the initial cluster center, and the classification results of all operation modes are obtained;
Step 3: Calculate the fitness value J = [ J 1 , J 2 , , J L ] corresponding to each particle according to Formula (14);
Step 4: Determine the individual optimal position x i d and the global optimal position x g d according to the fitness value;
Step 5: Calculate the updated weight w according to Formula (12) and calculate the velocity and position of the updated particle according to Formulas (10) and (11);
Step 6: According to the principle that the cluster center corresponds to the particle, the updated particle is decoded as the cluster center, and m = m + 1 ;
Step 7: If m < m max , go to step 2, otherwise, output the individual optimal position and global optimal position obtained in step 4 in the last iteration. In addition, output the classification result corresponding to the cluster center, and the refinement operation mode extraction algorithm ends.

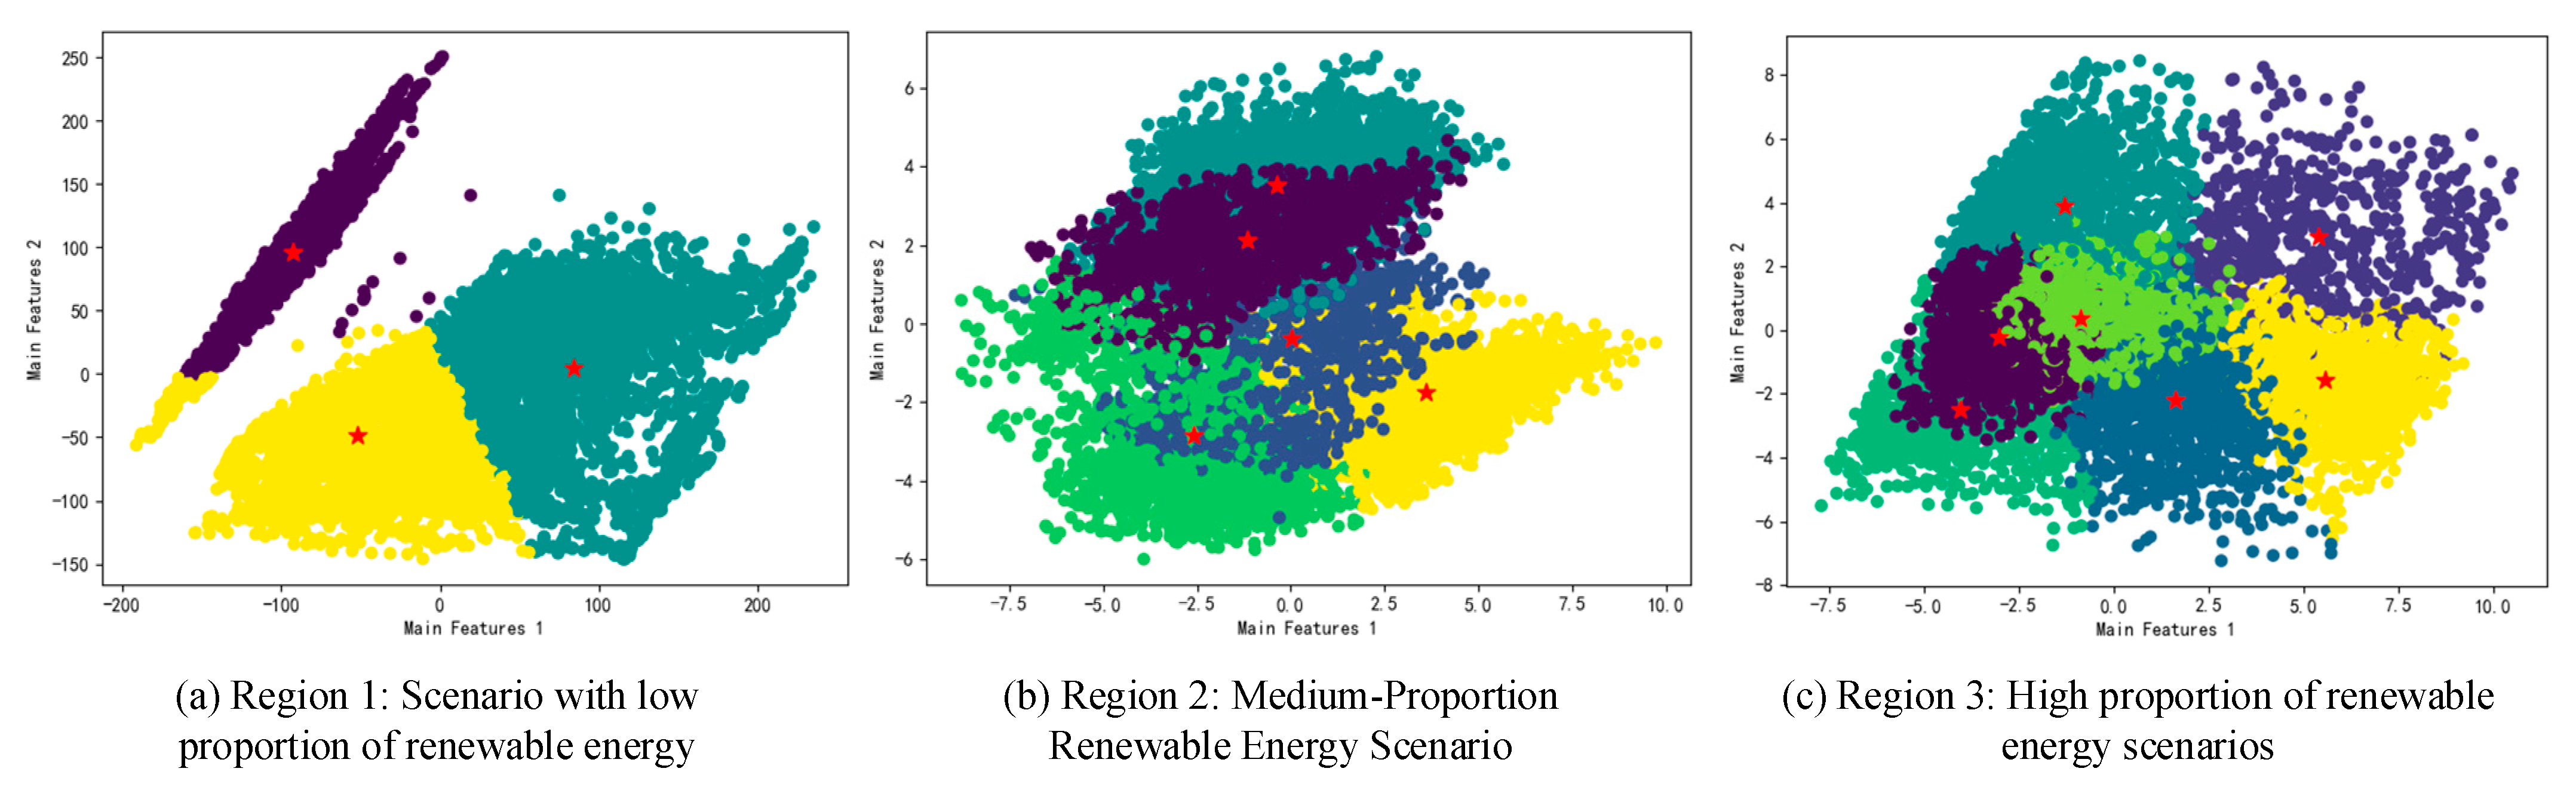
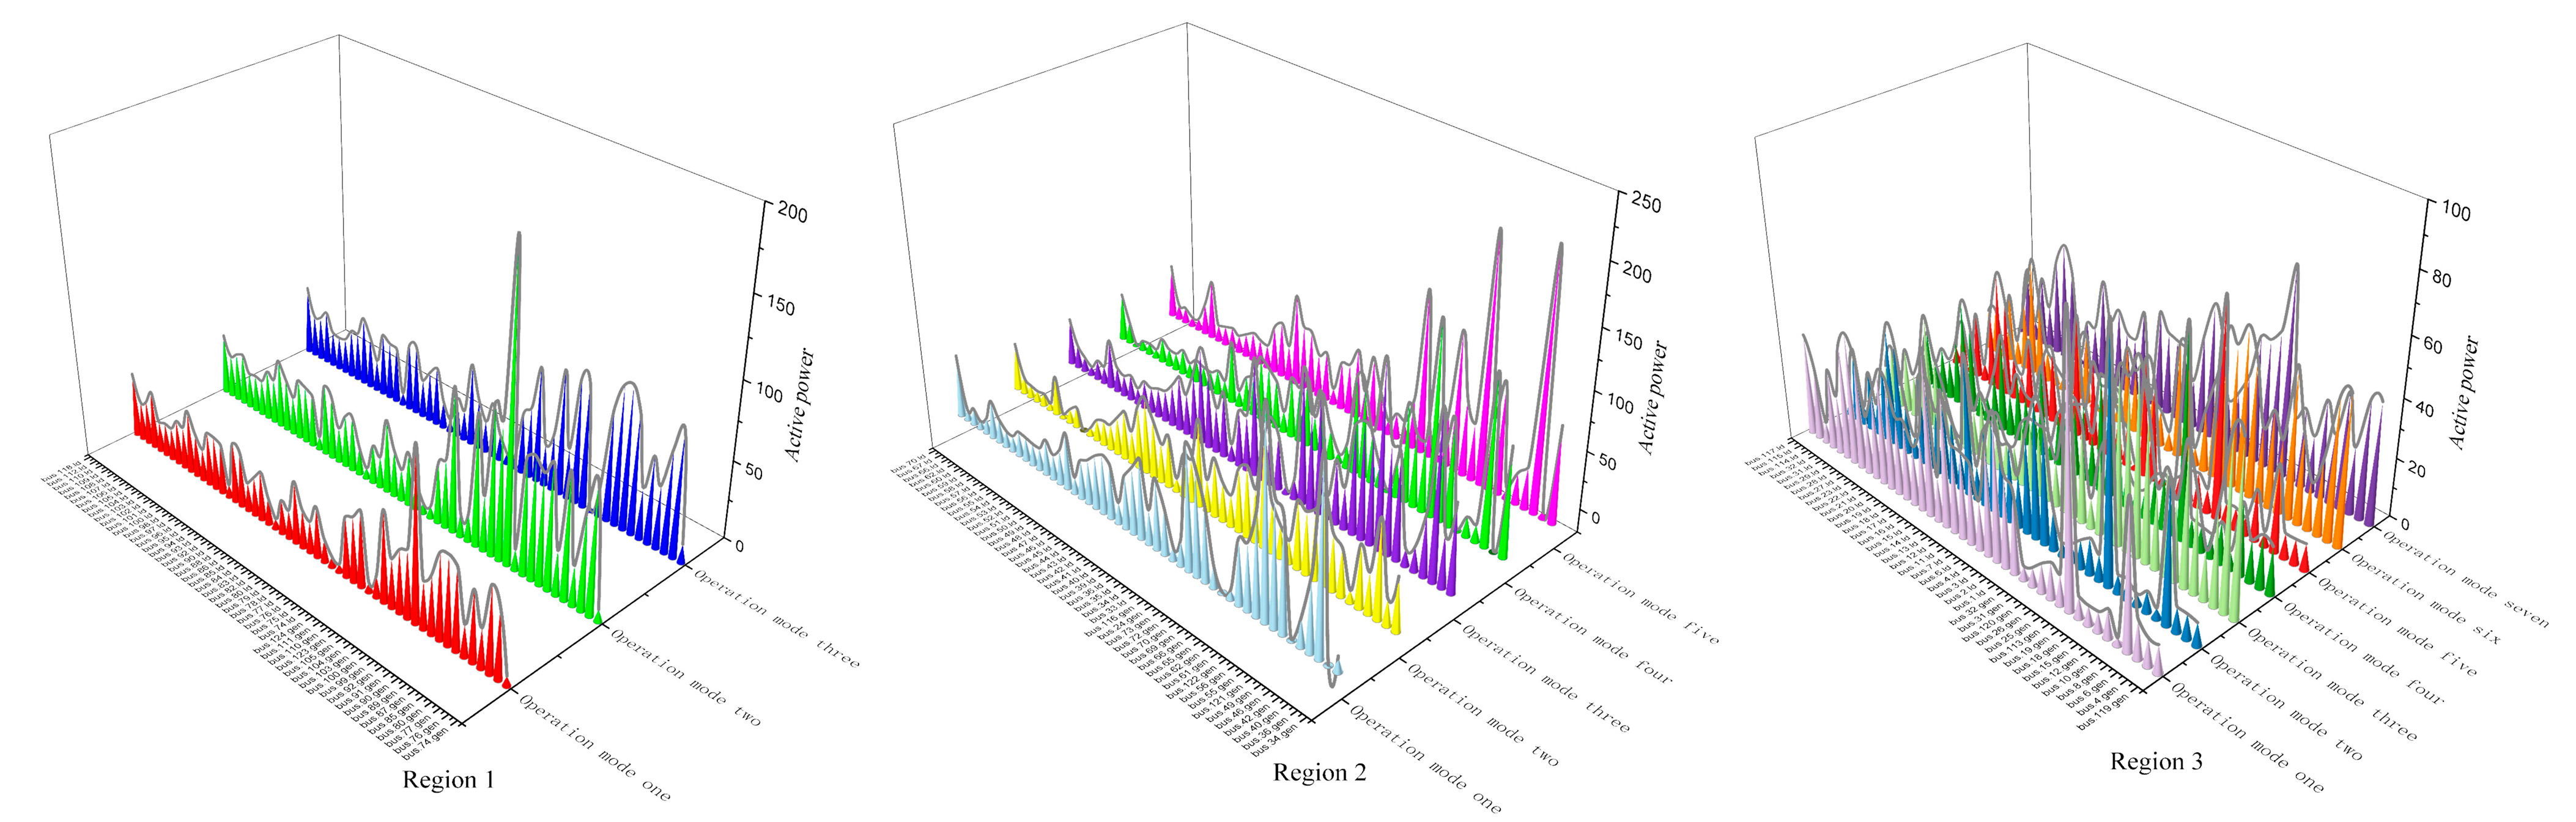
5.2. Visualization of Extraction Results
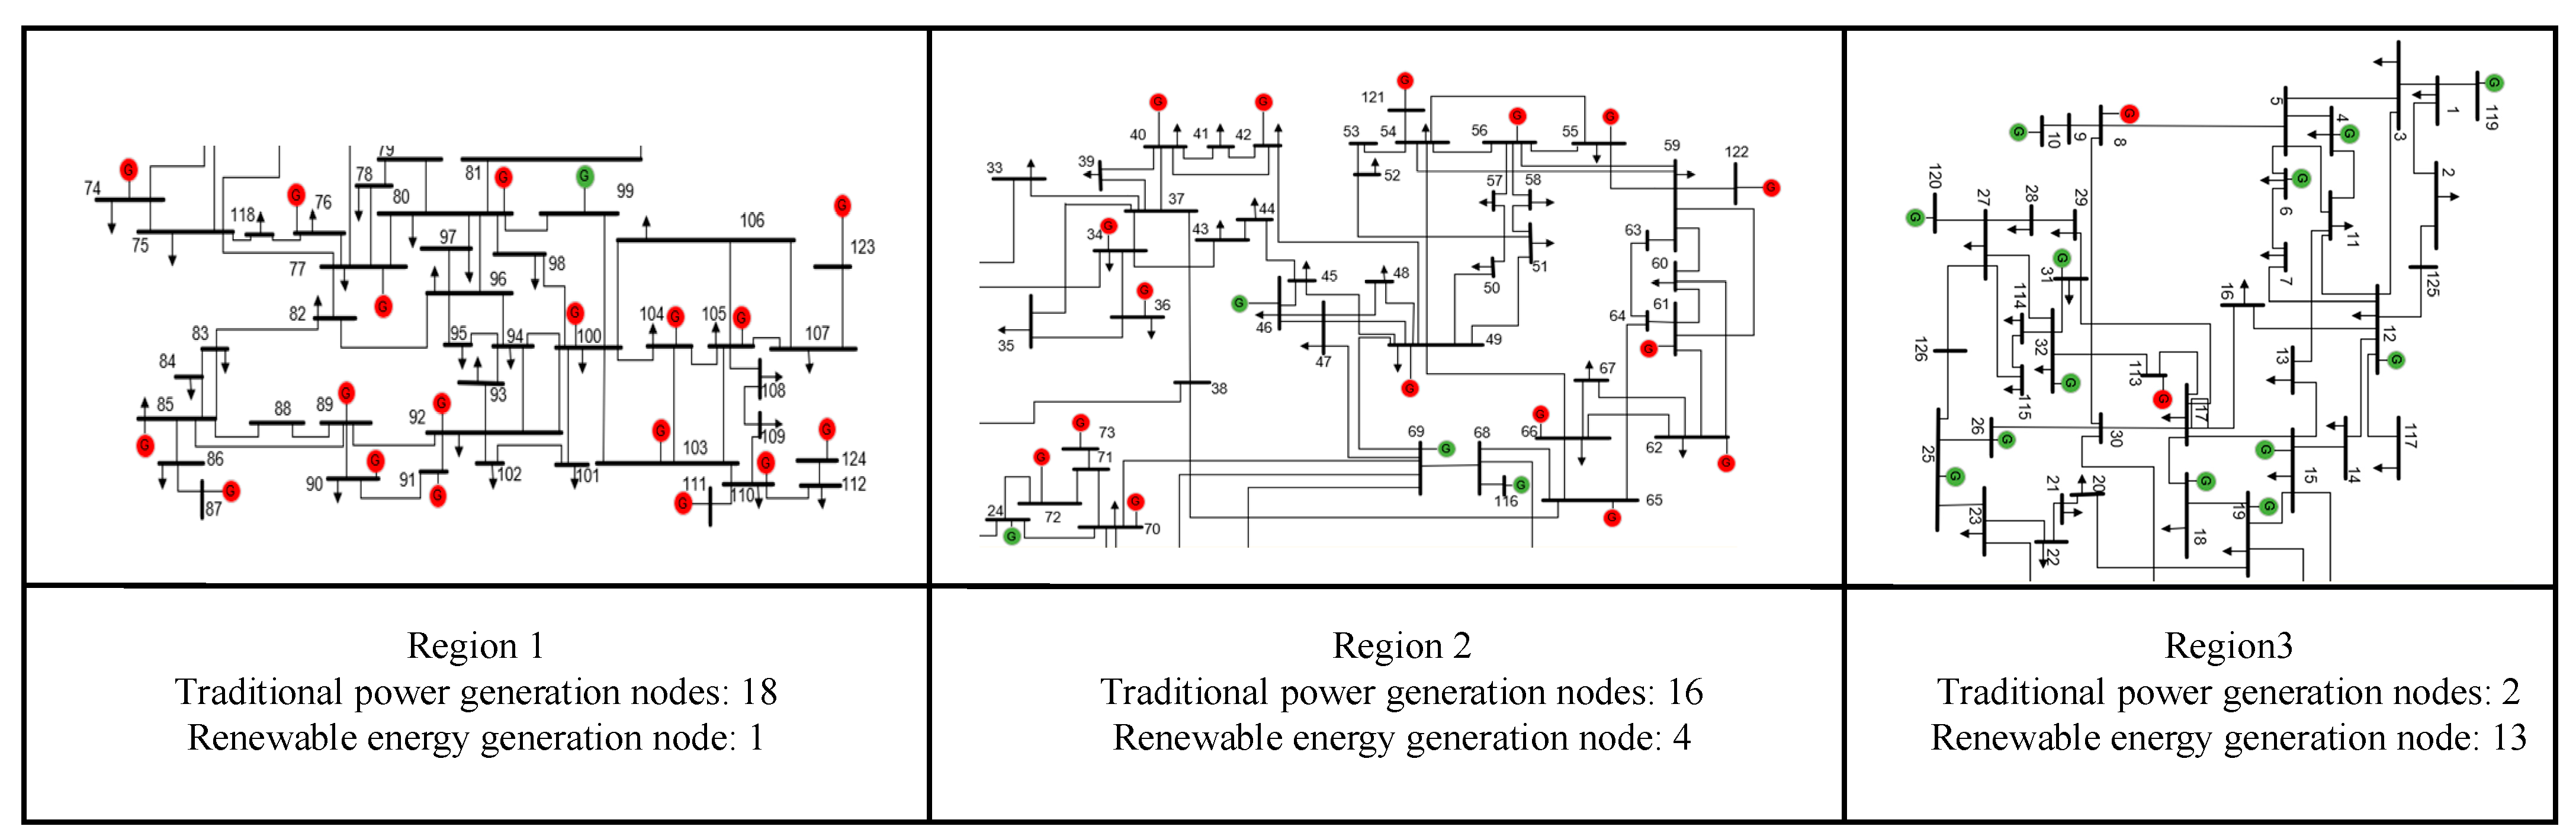
The operation mode of the power system consists of high-dimensional and non-linearly related data. Even after using a clustering algorithm to extract the refined operation mode, it is still difficult to directly observe the change law of the operation mode. Therefore, in order to address the high-dimensional characteristics of the operation mode, the main features of the operation mode are extracted by using the UMAP visualization method, which can obtain a better data aggregation effect, clearly express the structure of the data, is suitable for large-scale data, and can map it to a two-dimensional space for display [27]. The specific ideas are as follows:
First, we design a function to express the structure between high-dimensional sample points, and then design another function to describe the relationship between low-dimensional sample points. Finally, by constructing a loss function, the structural characteristics of the operating mode results in the high-dimensional space are learned in the low-dimensional space, so that the high-dimensional operating mode can be visualized in the two-dimensional space, which is convenient for observing the changing rules of different operating modes. The specific process is as follows:
In UMAP, the conditional probability expression between any two high-dimensional operating mode vectors p i and p j in the extracted refined operating mode is:
x i | j = e d ( p i , p j ) ρ i σ i .
σ i represents the variance item of the high-dimensional distribution item obtained by the two-dimensional search. According to Formula (15), the distribution x i j between any two high-dimensional operating mode vectors is expressed as:
x i j = x i | j + x j | i x i | j x j | i .
The distribution between any two low-dimensional operating mode vectors x and j is expressed as y i j :
y i j = ( 1 + a ( q i q j ) 2 b ) 1 .
The UMAP method makes the relationship between the low-dimensional operation mode and the high-dimensional operation mode as similar as possible through the loss function C E ( p , q ) so as to achieve the purpose of displaying the extraction results of the high-dimensional operation mode in two-dimensional space:
C E ( p , q ) = i j [ x i j ( p ) log ( x i j ( p ) y i j ( q ) ) + ( 1 x i j ( p ) ) log ( 1 x i j ( p ) 1 y i j ( q ) ) ] .

6. Case Analysis

In this paper, a provincial-level SG126 node in China is used as the network frame, and the proposed method is used to extract and display the refined operation mode under the new power system. As shown in Figure 4, the topological map of the power grid is divided into three regions according to the penetration rate of renewable energy in the region: low proportion, medium proportion, and high proportion (among them, the red elements represent traditional power generation nodes, and the green elements represent renewable energy power generation nodes). These regions correspond to different forms of power grids in different periods. The analysis and comparison of the three regions are carried out, and the obtained results are applicable to the actual power system.

6.1. Standardization of Operating Mode Representation Variables

The difference in the power generation capacity of different types of renewable energy and the difference in the load demand of each part of the region may lead to the problem of excessive differences in the power data values, which will affect the calculation of the subsequent refined operation mode extraction process. Based on the method proposed in Section 3.2, this section standardizes the simulation operation data, provides a good foundation for subsequent feature variable screening and refined operation mode extraction, and improves calculation accuracy. Among them, Figure 5 shows the power variation of each generation side and load side nodes in this area with time series, and Figure 6 shows the power variation of each node with time series after normalization.
From Figure 5, it can be seen that the fluctuation trend of the power change of each node is different, some of which have a small span and are relatively stable, and some have a large span of change and show a state of oscillation. After it is standardized, the original distribution structure between the data points is preserved, and the influence caused by the excessive numerical difference between the data points is reduced.

6.2. Strong Correlation Feature Variable Screening

In order to further determine the degree of influence of each characteristic variable on the change of power system operation mode, after excluding the influence of data outliers and missing values, the correlation coefficient values between various types of nodes in this area were quantified, respectively, which laid the foundation for rational and effective screening of strong influencing characteristic variables. The quantification results are shown in Figure 7.
Analysis was carried out on the correlation between generator nodes and load nodes in Figure 7, respectively. Combined with the characteristic variable screening model proposed above, the screening of strongly influencing characteristic variables is carried out, and the size of the characteristic values is shown in Figure 8. Among them, the names of the characteristic variables of each region are replaced by 0, 1, 2, 3..., and the eigenvalues with a value greater than 0.3 and their corresponding eigenvectors are screened to reduce the dimensionality of the standardized operating data, to achieve the purpose of screening out representative characteristic variables, and to improve the efficiency of subsequent clustering and visualization algorithms.

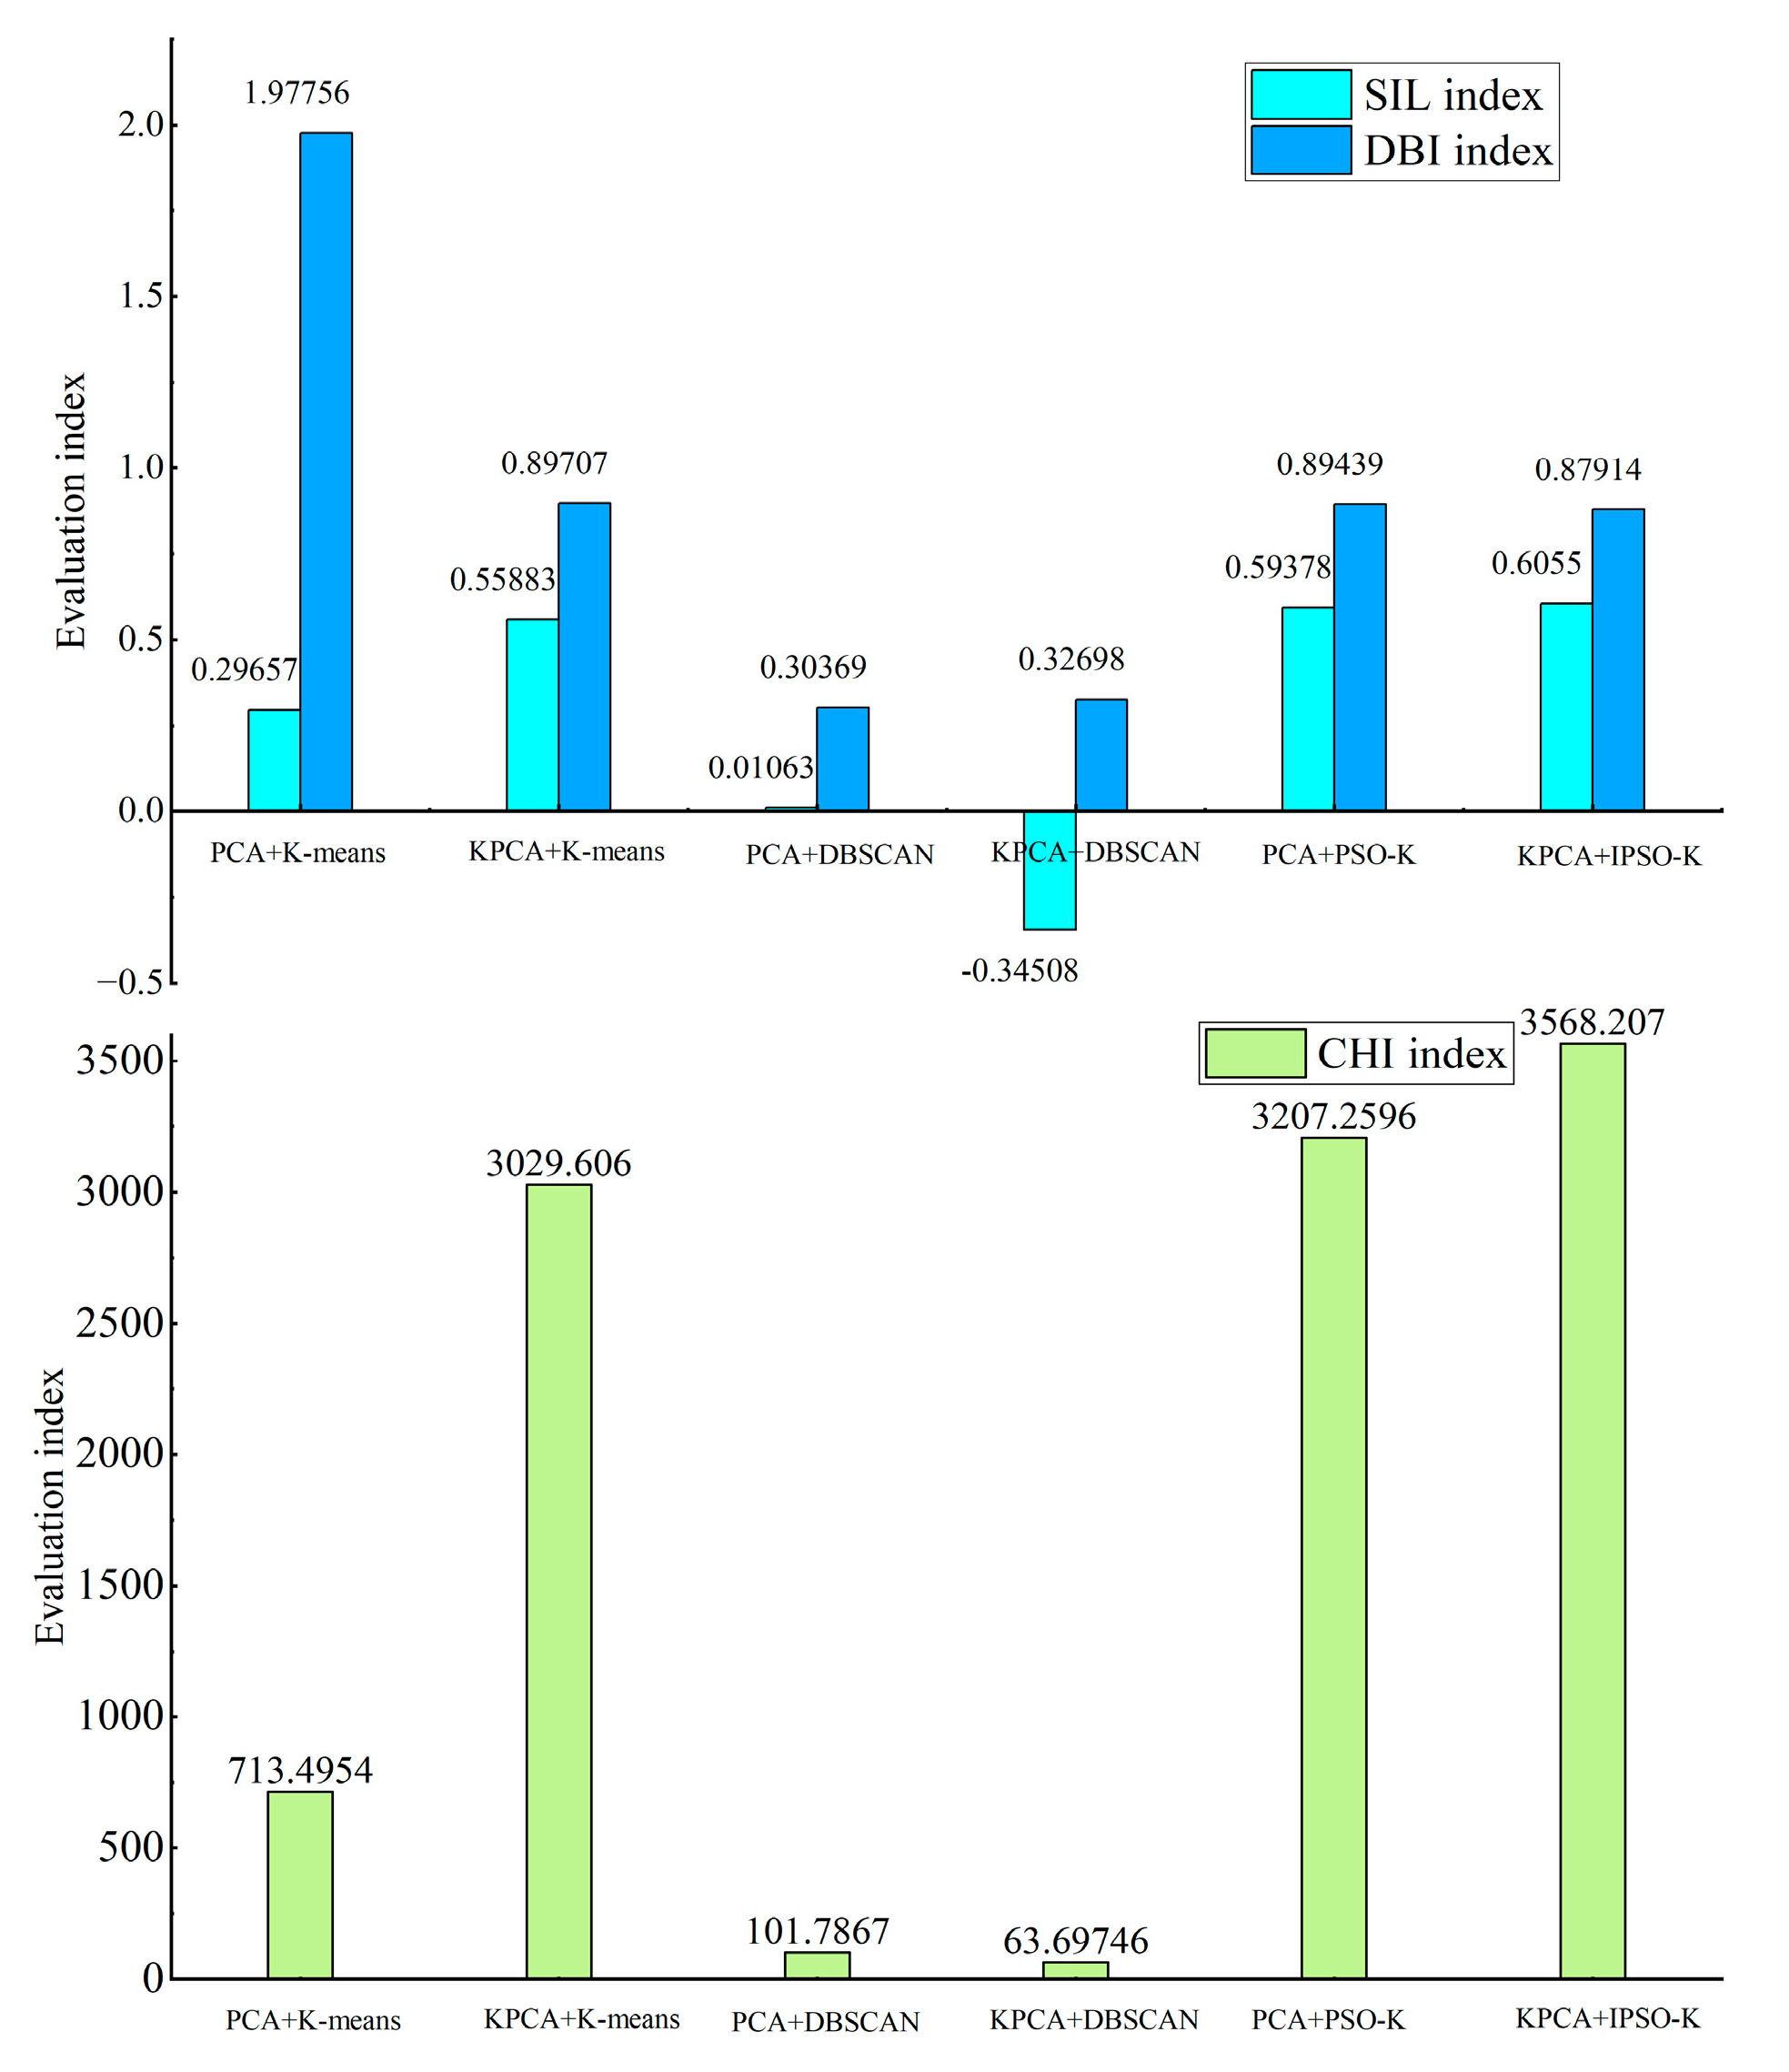
6.3. Visual Extraction of Refined Operation Mode

The operation mode extraction method proposed in this paper is used to perform preprocessing, compression, clustering, and other operations on the operation data to obtain a refined operation mode. Then, a two-dimensional state space distribution diagram of the operation mode is obtained through the dimensionality reduction visualization algorithm. This provides a more intuitive understanding of the distribution structure between different operation modes. As shown in Figure 9, each point represents an operating scenario. Different colors represent different operating modes obtained by clustering, and the cluster center of each operating mode is the representative of this type of operating mode.
The spatial distribution diagram of operation modes indicates that the number of refined operation modes increases with the increase in renewable energy penetration rate. When the proportion is low, there are only three typical operation modes and the aggregation of the same operation mode is relatively close, while the difference between different operation modes is obvious. When the proportion is medium, the number of operation modes increases to five, and the distribution of the same operation mode is relatively scattered, with slight overlap between different types of operation modes. After a high proportion of renewable energy is connected to the power system, not only do the types of operation modes increase to seven but the dispersion of the same operation mode also increases, and there is a large overlap between different types of operation modes. These results show that the access of a large amount of renewable energy makes the operation form of the power system more complex and diverse, the combination of operation scenarios increases, and the operation mode presents a trend of mass change. It is increasingly difficult to rely on traditional experience to judge the real operating status of the current power system. During operation, more and more refined operating modes need to be considered to represent a large number of operating scenarios and provide more accurate reference methods for staff.
The output characteristics of different types of operation modes extracted from areas with different renewable energy penetration rates, such as low proportion, medium proportion, and high proportion, are shown in curves, as shown in Figure 10.
In region 1, when the penetration rate of renewable energy is low, and the operation mode is mainly dominated by load and hydropower, with a relatively fixed patter. In such cases, typical modes such as “big in winter and small in winter, big in summer and small in summer, abundant and dry “ are usually sufficient to select a typical operation mode. However, in the state with a high proportion of renewable energy access—that is, in region 3—the dominant role of seasonal loads and hydropower in the operation mode is reduced, and the operation mode is gradually taken over by renewable energy. Dispatchers are required to deal with not only the fluctuation of different types of renewable energy output when formulating scheduling strategies, but also the coordination of hydropower to improve the capacity of renewable energy consumption. This will result in an increase in the number of operating scenarios, and a trend of variability and diversification in the operating modes.
When faced with these new scenarios, which were not present in the traditional power system, dispatchers may be unable to respond in a timely manner without the operation mode as a reference, which may cause insufficient power supply or a large amount of abandoned wind and light, thus affecting the operation of the power system. Therefore, a refined operation mode that can accurately reflect the real operation of the power system is needed to guide dispatchers and operators to formulate dispatching strategies. With the aid of the refined operation mode, dispatchers can respond correctly and efficiently to power fluctuations during power grid operation, improve the consumption rate and stability of grid-connected renewable energy, and ensure the safe and stable operation of the power system.
Figure 11 compares the operation mode extraction method proposed in this paper with several other extraction methods using the scores of the Silhouette Index (SIL), the Davies–Bouldin Index (DBI), and the Calinski–Harabasz Index (CHI) as clustering evaluation indicators [28].
SIL is an evaluation standard that comprehensively considers the aggregation degree and separation thickness of different operating scenarios. The SIL value range is [−1, 1], and the larger the value, the better the clustering effect. Its definition is as follows:
S I L = i = 1 K b i a i M A X ( a i , b i ) K ,
where K represents the number of clusters; a i represents the average distance between a sample and its similar samples; and b i represents the average distance between a sample and samples of other classes.
DBI is used to measure the ratio of the intra-cluster distance to the inter-cluster distance between any two clusters. The smaller the index, the smaller the intra-class distance and the higher the intra-class similarity. Its definition is as follows:
D B I = 1 K i = 1 K max i j , i , j [ 1 , K ] s i + s j M i j ,
where K have the same meanings as in Formula (19); s i represents the sample point dispersion in the class; and M i j represents the distance between the center of class i and class j .
CHI is also known as the variance ratio criterion. The larger the index, the better the clustering effect. Its definition is as follows:
C H I = t r ( x = 1 K n x ( p ¯ x p ¯ e ) ( p ¯ x p ¯ e ) T ) ( M K ) t r ( x = 1 , p 0 c x K ( p 0 p ¯ x ) ( p 0 p ¯ x ) T ) ( K 1 ) ,
where p ¯ x represents the center point of class x ; p ¯ e represents the center point of the data set x ; n x represents the number of data in class x ; and c x represents the data set of class x .
It can be seen from the comprehensive comparison results that the method adopted in this paper has significant advantages in the three indicators, which proves the effectiveness and rationality of the method.

7. Conclusions

In this work, a new visual extraction method of refined operation mode of power system based on IPSO-Kmeans is proposed. In which a data preprocessing method based on MaxAbs is designed to solve the dimension problem of power grid operation data. Then, by constructing a P_KPCA-based operating mode feature variable screening model, the influence of redundant features on the accuracy of the extraction results is effectively avoided. At the same time, the extraction of the refined operation mode of the power system is realized based on the IPSO-Kmeans algorithm, and UMAP technology is used to visualize the extraction results. Finally, an experimental analysis is carried out with a provincial SG126 node example in China. According to the different penetration rates of new energy sources, different forms of new power system development are deduced, and the experimental results verify the effectiveness and robustness of our method.
In future work, in view of the powerful feature extraction capabilities of deep neural networks, we will explore a run-mode extraction method that considers run-section scene graph transformations. It will be an effective continuation of this work, further improving the accuracy and robustness of the results.

Author Contributions

Conceptualization, X.G.; methodology, Q.S.; software, Z.Z.; validation, Z.Q.; formal analysis, Q.S.; investigation, Z.Z.; resources, X.G.; data curation, Q.S.; writing—original draft preparation, Q.S.; writing—review and editing, Z.Z.; visualization, Q.S.; supervision, Z.Q.; project administration, X.G. All authors have read and agreed to the published version of the manuscript.

Funding

This research was funded by Science and Technology Development Plan Project of Jilin Province (no. 20210203195SF).

Institutional Review Board Statement

Not applicable.

Informed Consent Statement

Not applicable.

Data Availability Statement

Data is contained within the article.

Conflicts of Interest

The authors declare no conflict of interest.

References

  1. Mallapaty, S. How China could be carbon neutral by mid-century. Nature 2020, 586, 482–483. [Google Scholar] [CrossRef] [PubMed]
  2. Kou, L.; Li, Y.; Zhang, F.; Gong, X.; Hu, Y.; Yuan, Q.; Ke, W. Review on monitoring, operation and maintenance of smart offshore wind farms. Sensors 2022, 22, 2822. [Google Scholar] [CrossRef] [PubMed]
  3. Hou, Q.; Zhang, N.; Du, E.; Miao, M.; Peng, F.; Kang, C. Probabilistic duck curve in high PV penetration power system: Concept, modeling, and empirical analysis in China. Appl. Energy 2019, 242, 205–215. [Google Scholar] [CrossRef]
  4. Yan, M.; Zhang, N.; Ai, X.; Shahidehpour, M.; Kang, C.; Wen, J. Robust two-stage regional-district scheduling of multi-carrier energy systems with a large penetration of wind power. IEEE Trans. Sustain. Energy 2018, 10, 1227–1239. [Google Scholar] [CrossRef]
  5. Mohandes, B.; El Moursi, M.S.; Hatziargyriou, N.; El Khatib, S. A review of power system flexibility with high penetration of renewables. IEEE Trans. Power Syst. 2019, 34, 3140–3155. [Google Scholar] [CrossRef]
  6. Hou, Q.; Du, E.; Zhang, N.; Kang, C. Impact of high renewable penetration on the power system operation mode: A data-driven approach. IEEE Trans. Power Syst. 2019, 35, 731–741. [Google Scholar] [CrossRef]
  7. Impram, S.; Nese, S.V.; Oral, B. Challenges of renewable energy penetration on power system flexibility: A survey. Energy Strategy Rev. 2020, 31, 100539. [Google Scholar] [CrossRef]
  8. Sinsel, S.R.; Riemke, R.L.; Hoffmann, V.H. Challenges and solution technologies for the integration of variable renewable energy sources—A review. Renew. Energy 2020, 145, 2271–2285. [Google Scholar] [CrossRef]
  9. D’Ettorre, F.; De Rosa, M.; Conti, P.; Testi, D.; Finn, D. Mapping the energy flexibility potential of single buildings equipped with optimally-controlled heat pump, gas boilers and thermal storage. Sustain. Cities Soc. 2019, 50, 101689. [Google Scholar] [CrossRef]
  10. Tang, A.; Lu, Z.; Yang, H.; Zou, X.; Huang, Y.; Zheng, X. Digital/analog simulation platform for distributed power flow controller based on ADPSS and dSPACE. CSEE J. Power Energy Syst. 2020, 7, 181–189. [Google Scholar]
  11. An, J.; Yu, J.; Li, Z.; Zhou, Y.; Mu, G. A data-driven method for transient stability margin prediction based on security region. J. Mod. Power Syst. Clean Energy 2020, 8, 1060–1069. [Google Scholar] [CrossRef]
  12. Nan, L.; Liu, T.; He, C. Identification of transmission sections based on power grid partitioning. Int. Trans. Electr. Energy Syst. 2019, 29, e2793. [Google Scholar] [CrossRef]
  13. Liu, X.; Min, Y.; Chen, L.; Zhang, X.; Feng, C.; Hu, W. A pragmatic method to determine transient stability constrained with interface real power flow limits via power system scenario similarity. CSEE J. Power Energy Syst. 2019, 6, 131–141. [Google Scholar]
  14. Yu, K.; Liu, Z.; Zhao, G.; Li, J.; Zeng, X.; Wang, Z. A novel protection method for a wind farm collector line based on FCM clustering analysis. Int. J. Electr. Power Energy Syst. 2021, 129, 106863. [Google Scholar] [CrossRef]
  15. Qiu, G.; Liu, J.; Liu, Y.; Liu, T.; Mu, G. Ensemble learning for power systems TTC prediction with wind farms. IEEE Access 2019, 7, 16572–16583. [Google Scholar] [CrossRef]
  16. Qiu, G.; Liu, Y.; Zhao, J.; Liu, J.; Wang, L.; Liu, T.; Gao, H. Analytic Deep learning-based surrogate model for operational planning with dynamic TTC constraints. IEEE Trans. Power Syst. 2020, 36, 3507–3519. [Google Scholar] [CrossRef]
  17. Yang, N.; Ye, D.; Lin, J.; Huang, Y.; Dong, B.T.; Hu, W.B.; Liu, S.K. Research on Data-driven Intelligent Security-constrained Unit Commitment Dispatching Method with Self-learning Ability. Proc. CSEE 2019, 39, 2934–2946. [Google Scholar]
  18. Liu, Y.; Sioshansi, R.; Conejo, A.J. Hierarchical clustering to find representative operating periods for capacity-expansion modeling. IEEE Trans. Power Syst. 2017, 33, 3029–3039. [Google Scholar] [CrossRef]
  19. Li, Y.; Bai, X.; Meng, J.; Zheng, L. Multi-level refined power system operation mode analysis: A data-driven approach. IET Gener. Transm. Distrib. 2022, 16, 2654–2680. [Google Scholar] [CrossRef]
  20. Farhat, M.; Kamel, S.; Atallah, A.M.; Abdelaziz, A.Y.; Tostado-Véliz, M. Developing a strategy based on weighted mean of vectors (INFO) optimizer for optimal power flow considering uncertainty of renewable energy generation. Neural Comput. Appl. 2023, 1–27. [Google Scholar] [CrossRef]
  21. Ulucak, R.; Khan, S.U.D. Determinants of the ecological footprint: Role of renewable energy, natural resources, and urbanization. Sustain. Cities Soc. 2020, 54, 101996. [Google Scholar]
  22. Tang, Y.; Huang, Y.; Wang, H.; Wang, C.; Guo, Q.; Yao, W. Framework for artificial intelligence analysis in large-scale power grids based on digital simulation. CSEE J. Power Energy Syst. 2018, 4, 459–468. [Google Scholar] [CrossRef]
  23. Su, B.; Ding, X.; Liu, C.; Wu, Y. Heteroscedastic Max–Min distance analysis for dimensionality reduction. IEEE Trans. Image Process. 2018, 27, 4052–4065. [Google Scholar] [CrossRef] [PubMed]
  24. Ayesha, S.; Hanif, M.K.; Talib, R. Overview and comparative study of dimensionality reduction techniques for high dimensional data. Inf. Fusion 2020, 59, 44–58. [Google Scholar] [CrossRef]
  25. El Khediri, S.; Fakhet, W.; Moulahi, T.; Khan, R.; Thaljaoui, A.; Kachouri, A. Improved node localization using K-means clustering for Wireless Sensor Networks. Comput. Sci. Rev. 2020, 37, 100284. [Google Scholar] [CrossRef]
  26. Ikotun, A.M.; Ezugwu, A.E.; Abualigah, L.; Abuhaija, B.; Heming, J. K-means clustering algorithms: A comprehensive review, variants analysis, and advances in the era of big data. Inf. Sci. 2023, 622, 178–210. [Google Scholar] [CrossRef]
  27. Anowar, F.; Sadaoui, S.; Selim, B. Conceptual and empirical comparison of dimensionality reduction algorithms (PCA, KPCA, LDA, MDS, SVD, LLE, ISOMAP, LE, ICA, t-SNE). Comput. Sci. Rev. 2021, 40, 100378. [Google Scholar] [CrossRef]
  28. Cai, L.; Wang, H.; Jiang, F.; Zhang, Y.; Peng, Y. A new clustering mining algorithm for multi-source imbalanced location data. Inf. Sci. 2022, 584, 50–64. [Google Scholar] [CrossRef]
Figure 1. The overall process of visual extraction of refined operation mode.
Electronics 12 02326 g001
Figure 2. Feature variable screening process.
Electronics 12 02326 g002
Figure 3. Determination of the number of clusters.
Electronics 12 02326 g003
Figure 4. Network rack partition topology.
Electronics 12 02326 g004
Figure 5. Variation diagram of characteristic variable active value with time series.
Electronics 12 02326 g005
Figure 6. Changes of active energy value of characteristic variables with time series after normalization.
Electronics 12 02326 g006
Figure 7. Quantification of the correlation of characteristic variables.
Electronics 12 02326 g007
Figure 8. The characteristic variables and their characteristic values of each region.
Electronics 12 02326 g008
Figure 9. Spatial distribution diagram of refined operation mode of power system. The red star represents the cluster center.
Electronics 12 02326 g009
Figure 10. Typical operation modes of regional power systems with different renewable energy penetration rates.
Electronics 12 02326 g010
Figure 11. Comparison of the effectiveness of the operation mode extraction algorithm.
Electronics 12 02326 g011
Disclaimer/Publisher’s Note: The statements, opinions and data contained in all publications are solely those of the individual author(s) and contributor(s) and not of MDPI and/or the editor(s). MDPI and/or the editor(s) disclaim responsibility for any injury to people or property resulting from any ideas, methods, instructions or products referred to in the content.

