Article

Research on Railway Dispatcher Fatigue Detection Method Based on Deep Learning with Multi-Feature Fusion

1
School of Electronic Information Engineering, Beijing Jiaotong University, Beijing 100044, China
2
National Research Center of Railway Safety Assessment, Beijing Jiaotong University, Beijing 100044, China
3
Collaborative Innovation Center of Railway Traffic Safety, Beijing 100044, China
*
Author to whom correspondence should be addressed.
Electronics 2023, 12(10), 2303; https://doi.org/10.3390/electronics12102303
Submission received: 13 April 2023 / Revised: 16 May 2023 / Accepted: 17 May 2023 / Published: 19 May 2023
(This article belongs to the Special Issue Advances in Computer Vision and Deep Learning and Its Applications)

Abstract

:
Traffic command and scheduling are the core monitoring aspects of railway transportation. Detecting the fatigued state of dispatchers is, therefore, of great significance to ensure the safety of railway operations. In this paper, we present a multi-feature fatigue detection method based on key points of the human face and body posture. Considering unfavorable factors such as facial occlusion and angle changes that have limited single-feature fatigue state detection methods, we developed our model based on the fusion of body postures and facial features for better accuracy. Using facial key points and eye features, we calculate the percentage of eye closure that accounts for more than 80% of the time duration, as well as blinking and yawning frequency, and we analyze fatigue behaviors, such as yawning, a bowed head (that could indicate sleep state), and lying down on a table, using a behavior recognition algorithm. We fuse five facial features and behavioral postures to comprehensively determine the fatigue state of dispatchers. The results show that on the 300 W dataset, as well as a hand-crafted dataset, the inference time of the improved facial key point detection algorithm based on the retina–face model was 100 ms and that the normalized average error (NME) was 3.58. On our own dataset, the classification accuracy based the an Bi-LSTM-SVM adaptive enhancement algorithm model reached 97%. Video data of volunteers who carried out scheduling operations in the simulation laboratory were used for our experiments, and our multi-feature fusion fatigue detection algorithm showed an accuracy rate of 96.30% and a recall rate of 96.30% in fatigue classification, both of which were higher than those of existing single-feature detection methods. Our multi-feature fatigue detection method offers a potential solution for fatigue level classification in vital areas of the industry, such as in railway transportation.

1. Introduction

In recent years, China’s railway industry has developed rapidly, and the country has entered an era of high-speed, high-density, and heavy-weight railway transportation. Railway traffic dispatching is critical to ensuring the safe operation of railways. During active operations, it is necessary to follow the unified commands given by those in charge of traffic dispatching. A dispatcher organizes relevant personnel to fulfill the train operation diagram, the marshaling plan, and the transportation schedule, and to meet the transportation goals. Errors in dispatching can cause traffic delays and service interruptions, and occasionally, they may lead to severe accidents. Therefore, detecting the fatigued state of the dispatcher should be the basis for ensuring successful, reliable operations and is of great significance for the safe operation of railways. Research on the detection of the fatigue state of dispatchers refers to research on fatigue detection methods for high-speed rail and car drivers, and it has combined the characteristics of the dispatching work itself to design fatigue detection methods for dispatchers.
Many methods for measuring fatigue have been developed and can be divided into two types: subjective and objective. Subjective detection methods aim to obtain the fatigue status of personnel with the filling out of questionnaires, subjective evaluations, and other methods. Evaluation scales include the Karolinska sleepiness scale (KSS), the morning-type and evening-type questionnaire (MEQ) [1], the mood fatigue scale (POMS-F), the vitality scale (POMS-V), the NASA task load index (NASA-TLX), etc. Courtney et al. conducted sleep restriction and deprivation experiments and concluded that all scales are effective for fatigue detection [2]. Gaydos et al. [3] proposed an approach not only based on pilots themselves but also their peers’ perspectives. Useche et al. [4] studied the relationships among fatigue, work-related and stress-related conditions, and dangerous driving behaviors. Fan, J., et al. [5] studied the correlation between workload and fatigue but did not consider other factors. When a person is in a state of fatigue, the body has physiological reactions, such as increased blinking, increased yawning, and general weakness [6], and these are used to inform detection methods based on human physiological indicators and behavioral feature detection using image- and voice-processing technologies. To evaluate a driver’s physiological indicators while driving, the authors collected drivers’ bio-electrical signals recorded using electro-encephalogram (EEG), electro-oculogram (EOG), and electro-cardiogram (ECG) tests [7], as well as their physiological parameters, such as body temperature. Then, a fatigue detection method was applied for feature extraction analysis in order to determine drivers’ alertness [8,9].
Research on fatigue detection has been focused on fatigue state detection, often using a single facial feature, for example, monitoring an operator’s eye movements. When an operator is tired, the body posture changes, and the operator may perform certain movements or gestures, such as covering the face. It is often the case that people exhibit more bodily behaviors indicative of fatigue than facial behaviors [10]. Thus, detecting fatigue based on a single facial feature must be reconsidered. The goal of this study was to propose a dispatcher fatigue detection method based on the fusion of multi-feature information. We performed this by combining facial cues and body postures. In this study, we explored a fatigue detection model based on multi-feature fusion in order to improve the train dispatcher fatigue detection accuracy. The major contributions of this work are summarized as follows:
  • Fusing multiple features in addition to facial movements, such as body posture: We integrate facial features and behaviors indicative of a fatigued state, and we use the RetinaFace model to identify the key indicators of the face. The particle swarm optimization–support vector machine (PSO-SVM) algorithm of the histogram of oriented gradient (HOG) feature graph is used to determine the open and closed states of the eyes, and the LSTM–AdaBoost algorithm, to determine fatigue gestures.
  • Differential model robustness: In order to improve the effect of the fusion model, we explored the RetinaFace network model, optimized the support vector machine method using particle swarm optimization, and improved the LSTM–AdaBoost algorithm.
  • Comprehensive experiments and studies: We conducted detailed ablation studies and comprehensive experimentation to evaluate the model’s efficiency and accuracy, and the behavior classification of the model; an ablation test comparison; and a benchmarking test against other algorithms’ results.
The abbreviations used in the article are listed in Table 1.

2. Related Works

Subjective evaluation methods are simple and direct. Participants complete answers according to an evaluation scale and their own feelings. Objective fatigue detection methods are feature detection methods based on human physiological indicators, behavioral actions, and image- and speech-processing technology.
(1)
Subjective fatigue measurement methods.
In 2013, Gaydos et al. [3] proposed a new peer fatigue scoring system based on the subjective evaluation of pilot fatigue in the military. The flight safety office records and tracks the median and the variance of each pilot’s peer rating. The rating system consists of a simple 1–10 rating scale, with instructions for each rating to ensure the consistency of the subjective assessments and accurately determine the level of exhaustion of each pilot. The scoring system evaluates a pilot’s fatigue state, their relative response, and their degree of coping from a multi-dimensional, external perspective. Scoring is based on a peer’s perspective, which could include activities other than work, such as social interactions, and could also observe the pilot’s service limitations. Based on this approach, fatigue management is transformed into a more proactive management approach.
In 2017, Useche et al. [4] studied the specific relationships among the fatigue of bus-rapid-transit (BRT) drivers, their work-related and stress-related conditions, and dangerous driving behaviors. The trial involved 524 male drivers from four BRT transport companies in Bogota, Colombia’s capital city. The participants completed three questionnaires on driver behavior, effort–reward imbalance, and job performance, along with a subjective fatigue scale. Using a structural equation model (SEM), they found that dangerous driving behavior is predicated on work stress, effort–reward imbalance, and social support and that fatigue driving plays a role in the relationship between work stress and dangerous driving, as well as between social support and dangerous driving.
In 2017, Fan and Smith [5] studied the correlation between workload and fatigue, and its impact on work performance, particularly in the railway industry. The results showed that workload is a predictor of fatigue. Furthermore, they applied a combination of subjective measures and online objective cognitive tests, including self-assessment, a 10 min psycho-motor alertness task, a visual search, and a logical reasoning task. SPSS software was used for the statistical analysis of the data to evaluate the correlations among workload, fatigue, and performance. The results showed that workload was an important factor that intensified fatigue and that subjective fatigue could be predicted using an evaluation test.
(2)
Objective fatigue measurement methods.
Allam, J.P., et al. [11] proposed a deep learning algorithm based on a convolutional neural network to automatically recognize the state of drowsiness. Their model uses single-channel raw EEG signals as the input and then extracts features from the applied EEG signals. In [1], researchers proposed an algorithm for detecting QRS waves (a combination of Q waves, R waves, and S waves), T waves, and P waves in ECG data, which could not only identify the amplitude and intervals of the ECG data but also shorten the long-term detection and identification time.
In [12], researchers used eight EEG channels to monitor drivers’ state and then applied a matrix decomposition algorithm to classify the EEG signals collected using wireless wearable technology. If a driver was determined to be fatigued, an early warning alert sounded. This method had a high accuracy rate for fatigue detection, but it was more intrusive and disturbed drivers’ work.
A behavior feature detection method is based on image-/voice-processing technology. Fatigue detection technology based on image processing and video algorithms is employed to evaluate facial features, such as head position, the closing frequency of eyes and mouth, and body posture. Researchers have found with experiments that these features reflect the fatigue state of the human body. It is generally accepted that eye features have the greatest correlation with a fatigued state, such as the duration of eye closure, blink frequency, etc. Human posture and voice characteristics have been used as a supplementary basis for determining the fatigue state of the human body.
The literature [13] compared human eye detection technologies based on neural network methods, support vector machine methods, cascade algorithms, etc., according to images and the PERCLOS (percentage of eyelid closure over the pupil over time, eye closure time per unit time) principle, and the authors designed a deep learning method to detect driver fatigue. The authors of [14], however, used a driver’s facial image, which was collected with a camera, and employed the YOLO-LITE deep learning network and the Haar-like feature cascade for detection. In addition, they proposed a multi-layer perceptron (MLP), instead of the PerStat method of the PERCLOS method.
In [15], the authors proposed an eye state recognition network based on transfer learning, which consists of Gabor features and LBP features that are added to a convolutional neural network module using transfer learning, and they also used a multi-task cascaded convolutional neural network to detect a driver’s face and eyes, which classified the fatigue state of the driver according to the PERCLOS principle. In [16], a machine learning method was applied; it uses the f-value of the PERCLOS criteria for the longest continuous eye closure time and the number of mouth-opening instances as the input of the neural network and then constructs a three-layer BP neural network to identify fatigued states. The authors of [17] extracted image features based on the improved RetinaFace model as well as the improved ShuffleNetV2 network model, and they determined the fatigue status using face detection and the opening and closing of eyes and mouth. In [18], the authors proposed a multi-feature fusion method that combines the degrees by which eyes and mouth open and close, along with the eye movement rate, to determine the level of fatigue using a fuzzy reasoning system. The authors of [19] proposed a two-stream fusion network model based on upper-body postures to determine the level of fatigue of high-speed rail drivers. Regarding issues on fairness in facial detection systems, we have referred to the research findings of the following researchers: The authors of [20] offer a simple and straightforward recipe for confidence calibration in deep learning that improves the network credibility judgment. The authors of [21] introduced Fair-Net, a branched multi-task neural network architecture that improves both classification accuracy and probability calibration across identifiable sub-populations in class-imbalanced datasets. The authors of [22] presented an approach to evaluate the bias present in automated facial analysis algorithms and datasets with respect to phenotypic subgroups.

3. Features of Dispatcher Fatigue

In this study, we examined several features indicative of dispatcher fatigue: features based on eye closure (Section 3.1), blink frequency (Section 3.2), yawn frequency (Section 3.3), bowing the head and dozing off (Section 3.4), and dozing off on a table (Section 3.5).

3.1. Eye Closure-Based Features

PERCLOS refers to the percentage of eye closure during a specified time period. It collects data from videos to realize non-contact fatigue detection without affecting the normal work of personnel. It measures the amount of time during which the eyes are at least 80% closed. This proportion of time is expressed as P80 in [23]. In 1998, the U.S. Federal Highway Administration compared various fatigue detection methods in simulated driving tests conducted in a laboratory, and the researchers found that the P80 standard of the PERCLOS method is the most accurate. The measurement principle assumes that the blink of the eyelid begins at t 1 and ends at t 4 and that the eye is open at both t 1 and t 4 . During this blinking process, the pupil is covered for more than 80% of the time period, which is t 2 t 3 , as shown in Equation (1).
f = t 3 t 2 t 4 t 1
In the video acquisition in this study, the acquisition parameter was 30 fps, that is, 30 frames of images were collected per second. Therefore, the f-value of PERCLOS [24] was obtained by counting the number of image frames with open versus closed eyes, instead of the eyelid coverage area, as shown in Equation (2).
f = M N × 100 %
where N is the number of image frames collected with the camera within a specified period of time and M is the number of frames of closed-eye images. The value range of f is 0 < f ≤ 1. Studies have shown that when the human body is more awake, the f-value of PERCLOS is lower, generally in the range of 0 < f ≤ 0.15, and when the human body is in a state of fatigue, the f-value exceeds 0.4. When one enters the sleep state and the eyes are closed for a long time, f is equal to 1.

3.2. Blink Frequency

Blinking is determined according to the state of the eyes in continuous image sequences. The process of blinking is defined as transitioning from eye opening to closing to opening again. The total number of blinks in a unit cycle is the blink frequency, F r e q b l i n k , which has been medically shown to predict the awake state of the human body. In a normal awake state, the number of blinks per 60 s is 15–30 times, and the duration of each blink is 0.2–0.3 s. While fatigued but not yet asleep, an individual’s blink frequency increases, until reaching a sleep state, where the blink frequency is 0. Equation (3) is used to calculate the blink frequency.
F r e q b l i n k = N T
where N is the number of eye blinks within time T and T is the specified time period. We set the time period to 60 s, collected 30 frames of continuous image data per second, and calculated the number of eye blinks in approximately 1800 frames.

3.3. Yawn Frequency

For the evaluation of facial movements with no occlusion of the mouth, we assumed that the mouth has four states: closed, slightly open, talking, and yawning. When the human body starts to experience tiredness, the frequency of yawning increases. When yawning, the opening of the mouth is the largest in the upward and downward directions, and the length between the left and right corners becomes narrower. Therefore, to accurately identify facial yawning movements, the mouth aspect ratio (MAR) of the upper lip and lower lips is introduced. The distance value is used as an indicator [25], and the index value is calculated with the coordinates of key points around the mouth. Since the mouth movement of yawning could be clearly distinguished from that of speaking, the occurrence of yawning could be determined using the MAR threshold method.
To evaluate behaviors, such as covering the mouth, that indicate yawning, we assumed that people have different habits when yawning. When some people yawn, they cover their mouths with their hands. When this occurred in the image sequences, it occluded the movement of the mouth, which made the determination of yawning using facial key points infeasible. To overcome this, we propose a method that identifies key points in the upper body and uses recognized behaviors to determine yawn occurrence. The schematic diagram is shown in Figure 1.

3.4. Bowing the Head and Dozing Off

When the human body experiences tiredness, it physically reflects drowsiness; the brain response decreases; and the ability to support the head decreases, which is typically manifested with head drooping and frequent nodding. When a person is assuming a sleep state, key points of the face may not be viewable on video, so the fatigue state cannot be determined using the PERCLOS method. At this time, physical behaviors, such as bowing the head, that could indicate fatigued and sleep states are used instead [26].

3.5. Dozing Off on a Table

When a person experiences drowsiness, they may fall asleep in their current position or seek out a convenient location, such as a nearby table, on which to lie down and fall asleep. Therefore, to determine the fatigue of a dispatcher, the fatigue characterization of “table drowsiness” is included, which is defined according to specified movements and behaviors.

4. Multi-Feature Fusion Fatigue Detection Method Based on Deep Learning

The flowchart of our fatigue detection model based on the RetinaFace model [27], HOG-PSO-SVM, and the Bi-LSTM-SVM adaptive enhancement algorithm is shown in Figure 2. The technical reasons for using the RetinaFace and HRNet network models are as follows: RetinaFace is a single-stage multi-task detection algorithm for face detection that has been characterized as fast, lightweight, having high accuracy, and being capable of parsing information extracted from multi-level and multi-scale feature maps. Based on the RetinaFace algorithm, we designed a detection model that could infer the key points of the eyes and is superior in speed and more suitable for a series of tasks, such as facial key point detection, on a small industrial computer. Similarly, HRNet is a high-precision human posture estimation model that was jointly developed and released by University of Science and Technology of China and Microsoft Research Asia. Compared with the serial human posture estimation model, HRNet constructs a unique parallel structure. The parallel connection of high-to-low resolution convolution enables a high-resolution representation to be maintained at all times; then, multi-scale fusion can be performed using cross-parallel convolution to enhance the high-resolution feature representation. It does not rely on the restoration of high-resolution features from low-resolution features, as other methods do, thus significantly improving the prediction results of key points of human postures.
The algorithm flow is as follows: First, real-time video images of the dispatcher are obtained using a video acquisition device. The key points of the eyes and mouth are extracted using the RetinaFace model, while the key points of the body posture are detected using the high-resolution network (HRNet). After the point detection model [28] has extracted these key points, it inputs them into the SVM and the Bi-LSTM-SVM adaptive enhancement algorithm model to obtain the eigenvalues of the fatigued state, which are then used as the input of the artificial neural network to calculate the fatigue state using multi-feature fusion.

4.1. Face Key Point Recognition Based on RetinaFace

RetinaFace is a single-stage multi-task (SSM) detection algorithm proposed by the InsightFace team that specifically detects faces. The characteristics of its network model include single-stage target detection, feature pyramid networks (FPNs), context feature modules (single-stage headless face detector (SSH)), multi-task learning, an anchor box mechanism (Anchors), and the use of lightweight backbone networks.
Based on the RetinaFace algorithm, we designed a detection model that can actively memorize and learn the behaviors of facial key points using data transfer learning [29], network structure redesign, Gabor feature extraction [30], and other methods.
(1)
Face Key Point Design
In the original RetinaFace network, the five key points of the face are originally the left and right eyes, the left and right mouth corners, and the nose tip. According to the needs of fatigue detection, 21 key points of the face are implemented, i.e., 6 each for the left and right eyes, 1 for the tip of the nose, and 8 for the mouth. In this paper, detection points for the eyes and mouth are used. This model has excellent reasoning speed and is suitable for completing the task of facial key point detection on a small industrial computer. The results of facial key point detection using RetinaFace are shown in Figure 3.
(2)
Loss Function Design
L = L c l s ( p i , p i * ) + λ 1 p i * L b o x ( t i , t i * ) + λ 2 p i * L p t s ( l i , l i * ) + λ 3 p i * L p i x e l
Equation (4) is the loss function of the RetinaFace network. In Equation (1), (a) L c l s ( p i , p i * ) is the loss function of face classification, and p i is the i-th anchor frame predicted by the network as a person. The probability of the face, p i * , is the data label. (b) L b o x ( t i , t i * ) is the face box regression loss function, and t i , t i * are the coordinates of the predicted anchor box and the coordinates of the data label, respectively, including face Box 4 positioning data: t x , t y , t w , and t h . (c) L p t s ( l i , l i * ) is the regression loss function of the key points of the face. In order to improve the computational efficiency, therefore, the dense loss function that is less related to the regression of the key points of the human eye is removed. We select lambdas based on the RetinaFace network, which are 0.25/0.1/0.01, respectively. This means that the loss weights from the detection branch are higher than those from the key point branch. Our parameter values are still 0.25/0.1. The optimized loss function is Equation (5).
L = L c l s ( p i , p i * ) + λ 1 p i * L b o x ( t i , t i * ) + λ 2 p i * L p t s ( l i , l i * )
(3)
Network Structure Design
The pyramid structure of the FPN feature map was employed to enhance the detection of small-sized faces. In the fatigue detection scene of the dispatcher, the face area in the collected image accounts for a moderate proportion of the original image. Therefore, in RetinaFace, the P2 and P6 layer structures of the original feature pyramid network of the model can be removed, which greatly improves the reasoning speed and accuracy of the model. The feature pyramid network designed in this paper is shown in Figure 4.
(4)
Image Data Gabor Pre-Processing Design
A Gabor filter is used to extract the feature maps in the directions of 0°, 45°, and 90° from the original image; then, the three-feature images are mapped into a new three-channel image; finally, the Gabor feature map is obtained in gray scale.
(5)
Pre-trained Model Transfer Learning
RetinaFace includes three tasks: face classification, face frame detection, and facial key point detection. When using the pre-trained network weighting file for prediction, there is no need to re-train the model for face classification and face frame detection. We use the previous freezing of the related weights, as separately training the detection points of eye key points can not only greatly improve the training efficiency, but it also improves the accuracy of face detection.

4.2. Eye Opening and Closing Recognition with Support Vector Machine Based on HOG Feature

The extracted features applied for the detection of eye closure include the eye aspect ratio (EAR), image binarization, local binary patterns (LBPs), and the HOG feature. Among these, selecting the EAR thresholds that determine whether an eye is opening or closing is challenging, as people have many different eye sizes [31]. The image binarization method determines the differences between the black pixels of two consecutive frames. The disadvantage is that the distance between the human eye and the camera is greatly affected, and if the subjects continuously close their eyes, the difference between the black pixels cannot be reflected. The LBP feature extraction method [32,33] is not robust under complex lighting conditions. Compared with other features, the HOG feature is stable and less sensitive to changes in lighting conditions. It has better robustness for the feature description of the target, and the detection effect is relatively stable [34].
The HOG feature extraction process is as follows:
  • Calculate the gradient of each pixel in the image.
  • Divide the picture into gridded blocks; then, divide each block into multiple small-cell grids.
  • Count the gradient distribution histogram in each cell; obtain a descriptor of each cell; count the gradient direction distribution of each pixel; then, project it onto the histogram according to the weighted gradient size.
  • Combine N cells into a block, and concatenate the descriptors of each cell to obtain the description of the block.
  • Concatenate the descriptions of each block in the picture to obtain a feature description of the picture, which is the HOG feature of the picture [35]. Since the pixel size of each eye photo was 120 × 60, we set the pixel size of the cells to 6 × 6, and each block was set to 3 × 3.
(1)
Eye Image Cropping
In an actual working environment, dispatchers always look at the control screen from left to right, so their faces would always be turned away from the camera. Because the distances between each eye and the camera are different, the positioning errors of the key points would increase. To solve this problem, we propose a method that selects the eye closest to the camera as the focus. When the dispatcher’s face is turned away, the eye that is closer to the camera is detected, as shown in Figure 5. In the figure, fw and fh represent the width and height, respectively, of the face frame, as detected with RetinaFace. The positioning point of the tip of the nose is compared with the face and the position of the center line of the frame in terms of the direction of the picture. If the tip of the nose is on the right, it detects the left eye in the image (the subject’s right eye); otherwise, it detects the right eye in the image (the subject’s left eye).
Eye cropping is performed on the selected reference eyes. Since the distance between the upper and lower key points changes greatly when the eyes open and close, while the distance between the left and right key points generally does not change, a specific ratio could be used to crop the eye image. Generally, the eye aspect ratio is 1.6 [36]. According to this, Equation (6) is applied to proportionally crop the eye image.
w c r o p = w e y e h o r i z o n × 1.02 , h c r o p = w c r o p ÷ 1.6 .
In Equation (4), w c r o p and h c r o p represent the width and height of the cropped eye image, respectively.
(2)
HOG Feature Extraction
The cropped image is in a three-channel RGB format that contains the color information. The gradient calculation of the image does not require color information, so the first step is to convert the image into a gray-scale image. The participating dispatchers’ workplace was the dispatching hall of the Railway Bureau with sufficient and uniform lighting. Because the HOG feature is a local gradient feature, it is not sensitive to light. Therefore, this study did not consider image-processing methods for scenarios with insufficient lighting. When extracting the HOG features, it is necessary to calculate the horizontal and vertical gradients of each pixel, as shown in Equations (7) and (8).
g x ( x , y ) = H ( x + 1 , y ) H ( x 1 , y )
g y ( x , y ) = H ( x + 1 , y ) H ( x , y 1 )
where g represents the gradient; H represents the pixel value of the corresponding point; and x and y represent the horizontal and vertical directions, respectively. Based on these calculations, the magnitude and angle of the gradient can be obtained at this point, as shown in Equations (9) and (10).
g = ( g x 2 + g y 2 )
θ = arctan g y g x
The figure is divided into a large number of cells, and the gradient information of each cell is counted to form a histogram. The HOG feature map is shown in Figure 6.

4.3. Yawning Recognition Based on Facial Key Points

The extraction of the key points of the mouth also uses the RetinaFace network to locate the eight key points around the mouth. The key points of the mouth position are numbered 13 to 20, as shown in Figure 7.
Generally, when yawning, the MAR changes greatly, which is different from the MAR value when speaking. In order to determine mouth states such as speaking, yawning, and closed, we used the aspect ratio to evaluate the samples, and the experimental results are shown in Figure 8. When MAR < 0.3, the mouth is closed or speaking. When 0.4 < MAR, we determine that the mouth state is yawning. Therefore, we directly use the fixed threshold method to detect yawning based on facial key points [37]. The changes in the mouth MAR are shown in Figure 8.
By recording the MAR value of different subjects when yawning, 0.3 was determined as the threshold of yawning. When MAR > 0.3, the state is determined as yawning, and when MAR ≤ 0.3, it is determined as other actions.

4.4. Behavior Recognition Based on Bi-LSTM-SVM Adaptive Enhancement Algorithm

In order to classify the characteristics of a sitting posture when only half of the subject’s body can be captured with a camera, a human posture classification method based on a bidirectional long short-term memory neural network and an adaptive enhancement algorithm is proposed. Based on the HRNet key point detection model of body postures, multiple key points of the human body were extracted, and by constructing the angle and length features of human movements, an adaptive enhancement algorithm for movement recognition based on the bidirectional long-short-term memory neural network (Bi-LSTM) was built to improve recognition. This improved efficiency, reduced the risk of generalization error and recognized a dispatcher’s fatigue behaviors with excellent precision. The flowchart of the algorithm is shown in Figure 9.
The algorithm is divided into four parts: data acquisition and pre-processing, Bi-LSTM-SVM neural network, Bi-LSTM-SVM adaptive enhancement algorithm, and dispatcher fatigue behavior results. Data acquisition and pre-processing extract and normalize the key points of the human body and allocate them to the training sets and testing sets.
The format of the human posture key point data extracted with HRNet is information on 17 key points in a row, with each key point including horizontal and vertical coordinates, as well as confidence. Therefore, there are a total of 54 columns of data in one row. The pre-processing of data such as denoising mainly includes the following items:
(1)
Remove key point data with a confidence level below 0.5.
(2)
Remove key point data with obvious errors in location.
(3)
Remove key point data with missing data information.
In order to improve the accuracy of human posture detection, it is necessary to extract features from the data. Based on the differences in behavioral movements with body changes and the relatively fixed body length ratio, 7 types of angle features and 10 types of length ratio features are extracted. The seven types of angle features include the angle between each limb and the trunk, and the angle of the line connecting the head and shoulders, and the relative position proportion feature mainly extracts the relative position relationship between limbs, as well as the limb proportion feature based on the length of the trunk. The specific features are shown in Table 2 and Table 3.
The Bi-LSTM-SVM neural network uses softmax to first train Bi-LSTM; then, the trained output of the fully connected layer is used as the input of the SVM network to complete the training of the Bi-LSTM-SVM network. Next, the Bi-LSTM-SVM adaptive enhancement algorithm focuses on training the AdaBoost integrated classifier with the Bi-LSTM+SVM classifier. Dispatcher fatigue behavior is determined and provided as the output of the Bi-LSTM-SVM adaptive enhancement algorithm. The parameters of the model are optimized using the orthogonal experimental method to complete the classification and recognition of human body postures. Human key point recognition is shown in Figure 10.
This algorithm achieved good results on the scheduling simulation fatigue behavior dataset. Compared with the optimized single classifier Bi-LSTM-SVM, the classification ability of the model has been further improved. By building a strong AdaBoost classifier, the accuracy of human behavior classification has been improved.

4.5. Classification Model of Fatigued State Based on Artificial Neural Network

(1)
Selection of Fusion Algorithm
Commonly used fusion algorithms include the fuzzy theory algorithm, Bayesian inference, the voting method, the weighted-average method, artificial neural networks, etc. [38]. The fuzzy theory algorithm is suitable for information fusion in uncertain problems. Bayesian reasoning is suitable for scenarios based on previous knowledge. The voting method works well in scenarios with multiple classifiers and sufficient features, while the weighted-average method is suitable for relatively simple goal–result calculations. However, we adopted an artificial neural network as the fusion algorithm. By training the artificial neural network, the corresponding relationship between the weight of each characteristic parameter and the fatigue level can be found. An artificial neural network is suitable for solving nonlinear problems and finding the relationship between the input and output of different dimensions and features. The accuracy of artificial neural network classification is high; it has strong parallel distributed processing ability, strong distributed storage and learning ability, and strong robustness and fault tolerance to noisy nerves, and it is able to fully approximate complex nonlinear relationships. Based on the previous analysis and comparison, we adopted an artificial neural network for fatigue state detection.
Before using the artificial neural network to analyze the feature information, it is necessary to establish the data labels of fatigue detection and the evaluation benchmarks. For dispatcher fatigue, we used the subjective KSS data of the subjects during the test, along with expert evaluations, to determine the degree of fatigue.
(2)
Network Model Construction
The input of the network includes the f-value of PERCLOS, the blink frequency, the yawning frequency, and physical behaviors including the bowing of the head (and potentially falling asleep) and falling asleep on a table. The network structure is a three-layer fully connected neural network with a dense layer. In order to avoid overfitting, a dropout layer was set after each layer, and the value was set to 0.25. The activation function used was the softmax function, and the relative probability of three classifications was used as the output. The optimizer used was Adam. The learning rate was 0.001; the evaluation index was the accuracy rate; and the loss function of the neural network was the cross-entropy loss function.
There are two significant differences between the proposed method and existing methods. The first is that existing multi-feature fusion algorithms detect fatigue by only using facial or posture features. Our multi-feature fusion algorithm considers both features, ensuring the identification of the level of fatigue even when the face is obscured. The second is that our multi-feature algorithm is relatively advanced, as we use RetinaFace for facial feature recognition, and the Bi-LSTM-SVM–AdaBoost model is applied for posture recognition. Not only is the algorithm small in size, but it is highly effective in fatigue detection.

5. Results and Discussion

5.1. Experimental Environment

The experimental environment configuration of this article includes the following: an operating system that used Windows10, a development language based on Python 3.6 and TensorFlow2.7.0, an Intel i7-6500U 2.5 GHz CPU, and 16 GB memory. We also used a camera (1280 × 720); the GPU was NVIDIA Geforce GTX 1080Ti, and the graphics memory was 11 GB.

5.2. Experimental Dataset

The source of the experimental dataset was composed of the data of the simulation experiment conducted by volunteers in the simulation laboratory. There were five volunteers involved in creating the dataset. Each volunteer was in good physical condition and had no pathological symptoms, such as a poor sleep history.
The ground truth of the dataset was a self-made dataset that used cameras to capture video data of volunteers conducting simulation experiments in a scheduling simulation laboratory. There were a total of 5 volunteers in the dataset, and all of them had been informed of the trial content and purpose in advance and were asked to sign the trial information form. Their information is detailed in the table below. Each volunteer collected 40 min of video data. The time distribution was 10 min between 9:00 a.m. and 10:00 p.m., 10 min between 15:00 p.m. and 16:00 p.m., and 20 min between 23:00 and 24:00 p.m. A total of 200 min of data was collected, including mild-to-no fatigue, moderate fatigue, and severe fatigue states. Each data sample was collected for 1 min, with a total of 200 samples of data. After screening, 192 samples of data were available, including 54 severe fatigue samples, 64 moderate fatigue samples, and 74 mild-to-no fatigue samples. We divided all data into 138 training data (each number was 36, 46, and 56) and 54 testing data (each number was 18, 18, and 18). The training data adopted the 5-fold cross-validation method, and 110 data in the training set were used for training, in turn, while the other 28 data were used for training verification, as shown in Table 4 and Table 5.
In the process of recording the video of the dispatchers’ simulation work, the subjects were asked to fill in the fatigue self-examination form (KSS) [39,40,41] every 300 s and to measure their own fatigue levels during this time period from a subjective perspective. Therefore, 1–4 points indicated that the participant was awake; a total of 5–6 points indicated that the participant had mild fatigue; a total of 7–8 points indicated that the participant had moderate fatigue; and 9–10 points indicated that the participant had severe fatigue (sleepiness). In addition, the fatigue status of the participants in the video was further determined using expert scoring. Since the appearance of early intoxication and mild fatigue are similar, our algorithm does not distinguish between these behaviors and divides the degree of fatigue into the following categories: mild-to-no fatigue, moderate fatigue, and severe fatigue. These were validated with the mutual verification of the degree of fatigue according to the subjective and objective aspects. The sleepiness table is shown in Table 6.

5.3. Experimental Procedure

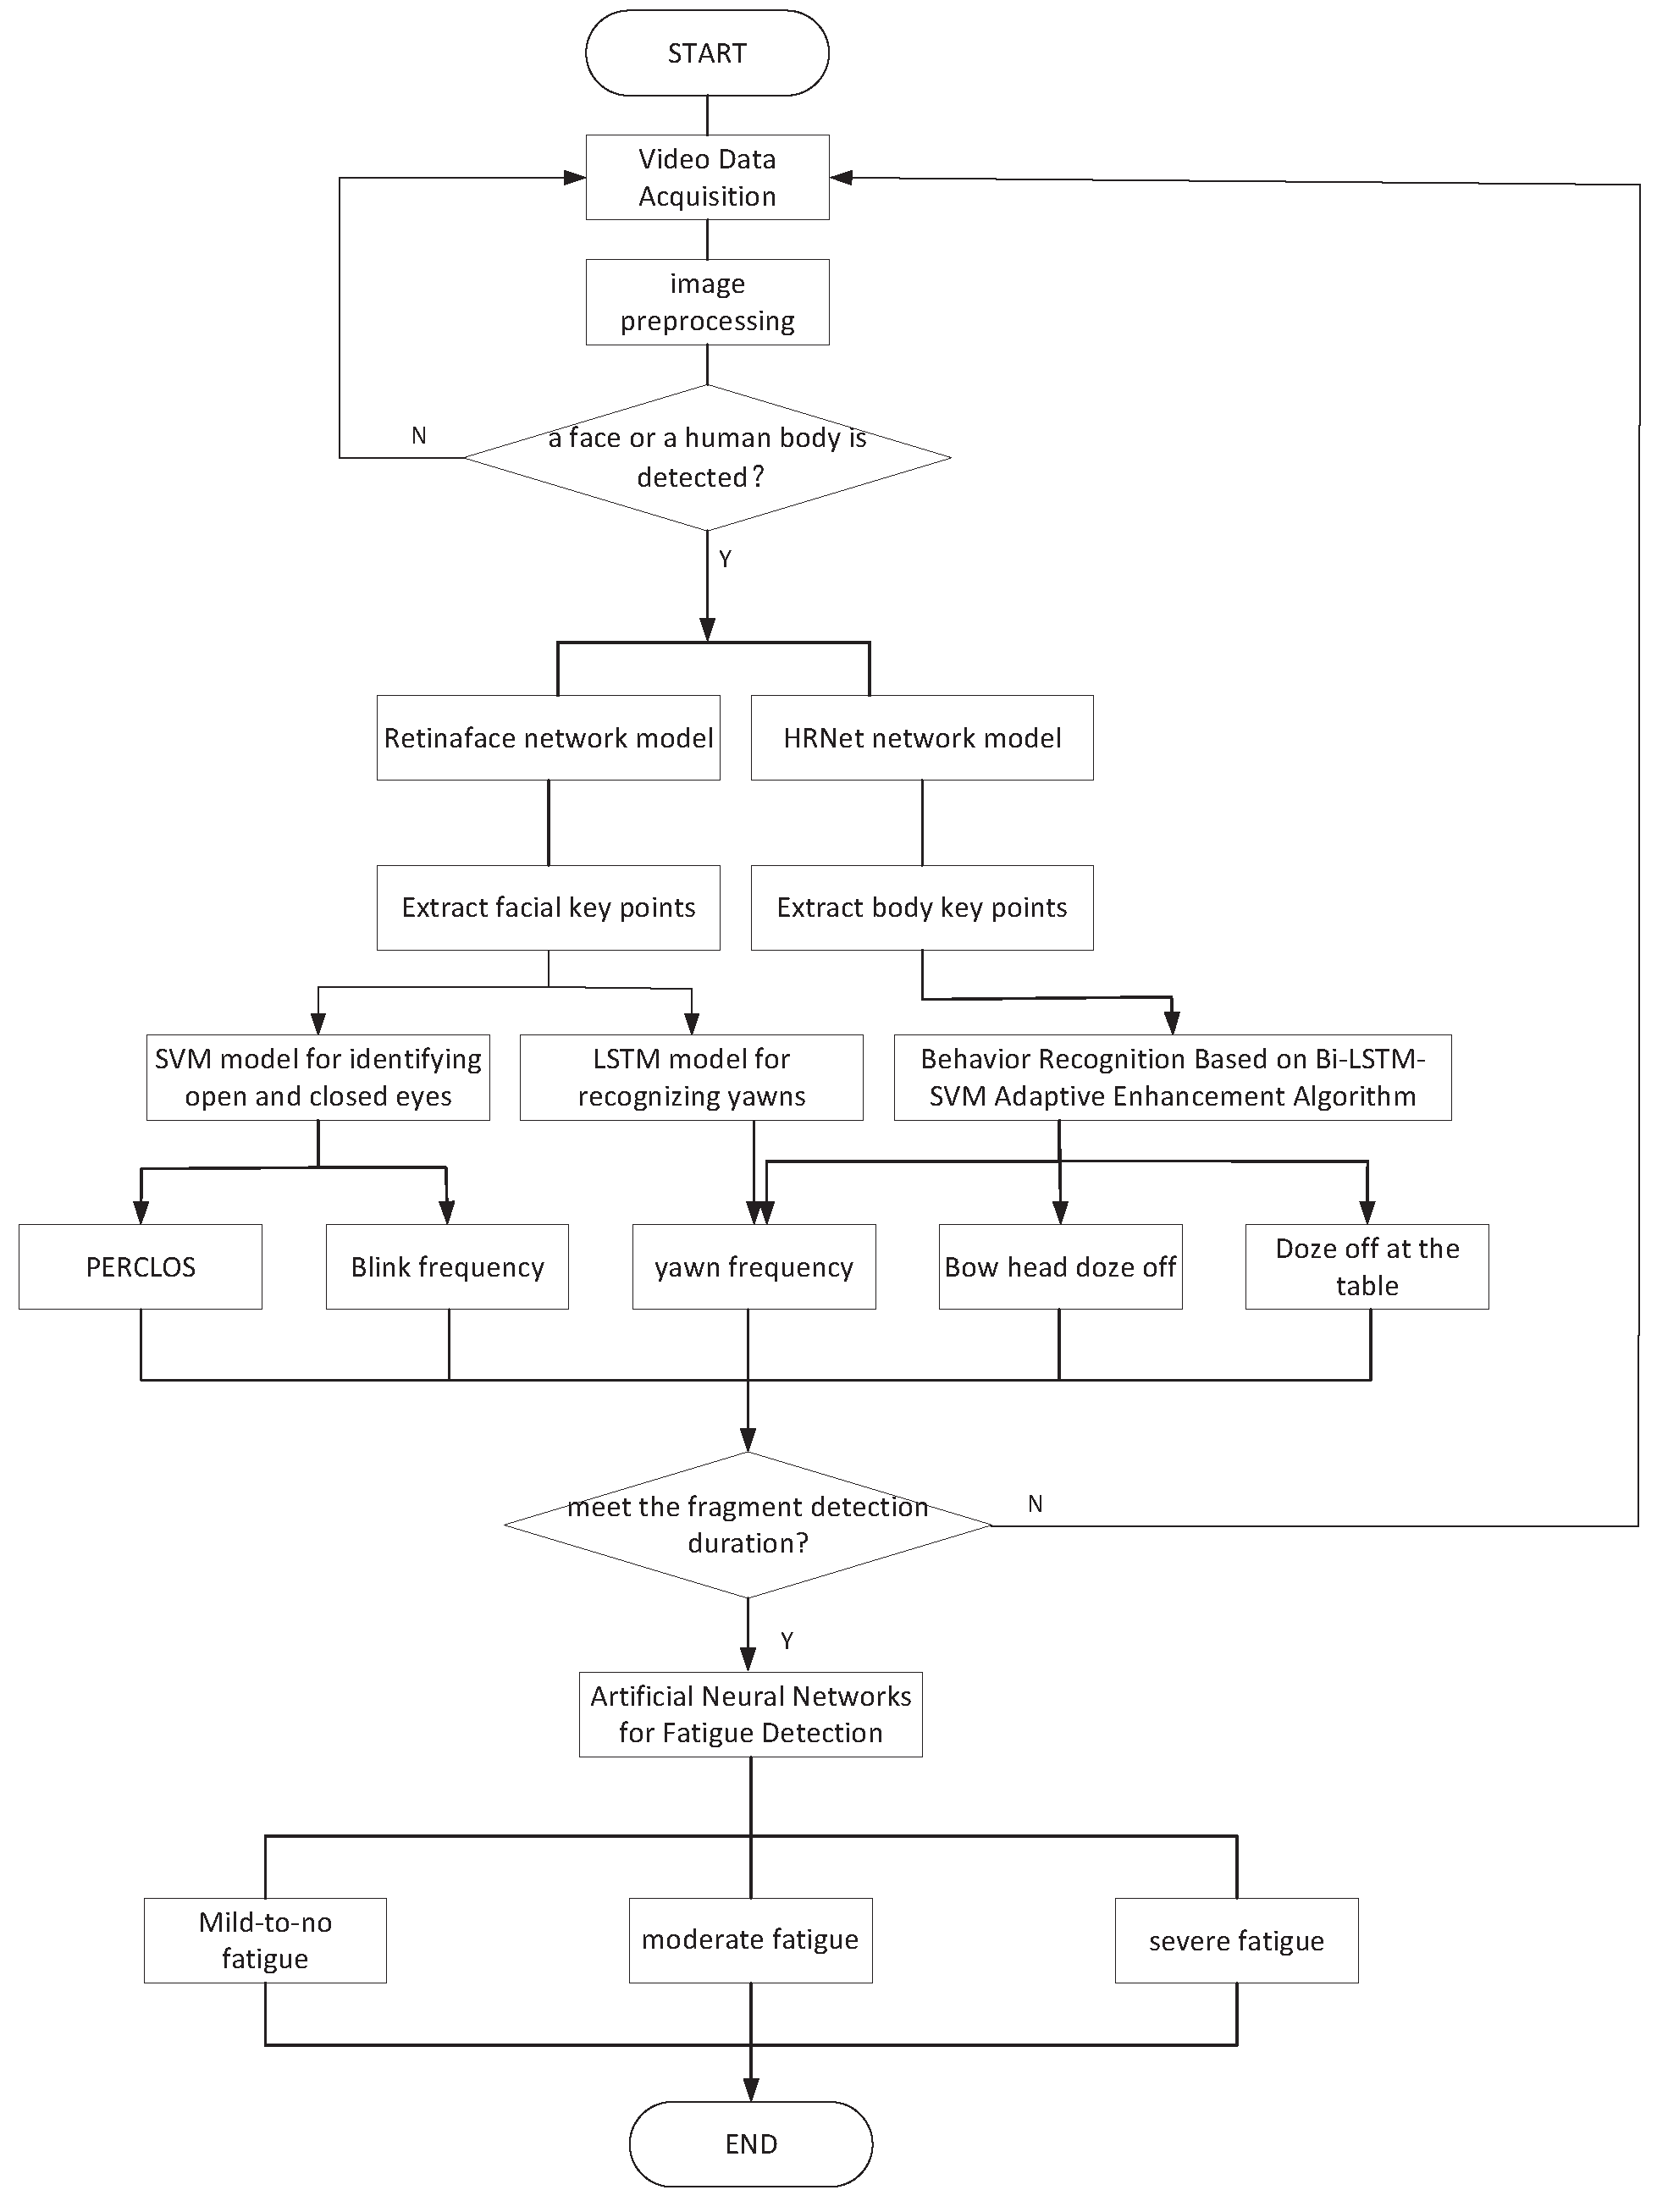
Normally, when the human body reaches a fatigued state, the blink frequency, the f-value of PERCLOS, and the number of yawns significantly increase. However, if the cycle of fatigue detection is too long, the fatigued state is difficult to identify within the time parameters; if the cycle is too short, the fatigue detection error rate increases. In order to ensure effective detection and efficiency, the fatigue detection period was set to 60 s, and the video sampling frame rate was 30 fps. Therefore, the most recent 1800 frames of data were used to calculate the values of various data and the dispatcher’s level of fatigue.
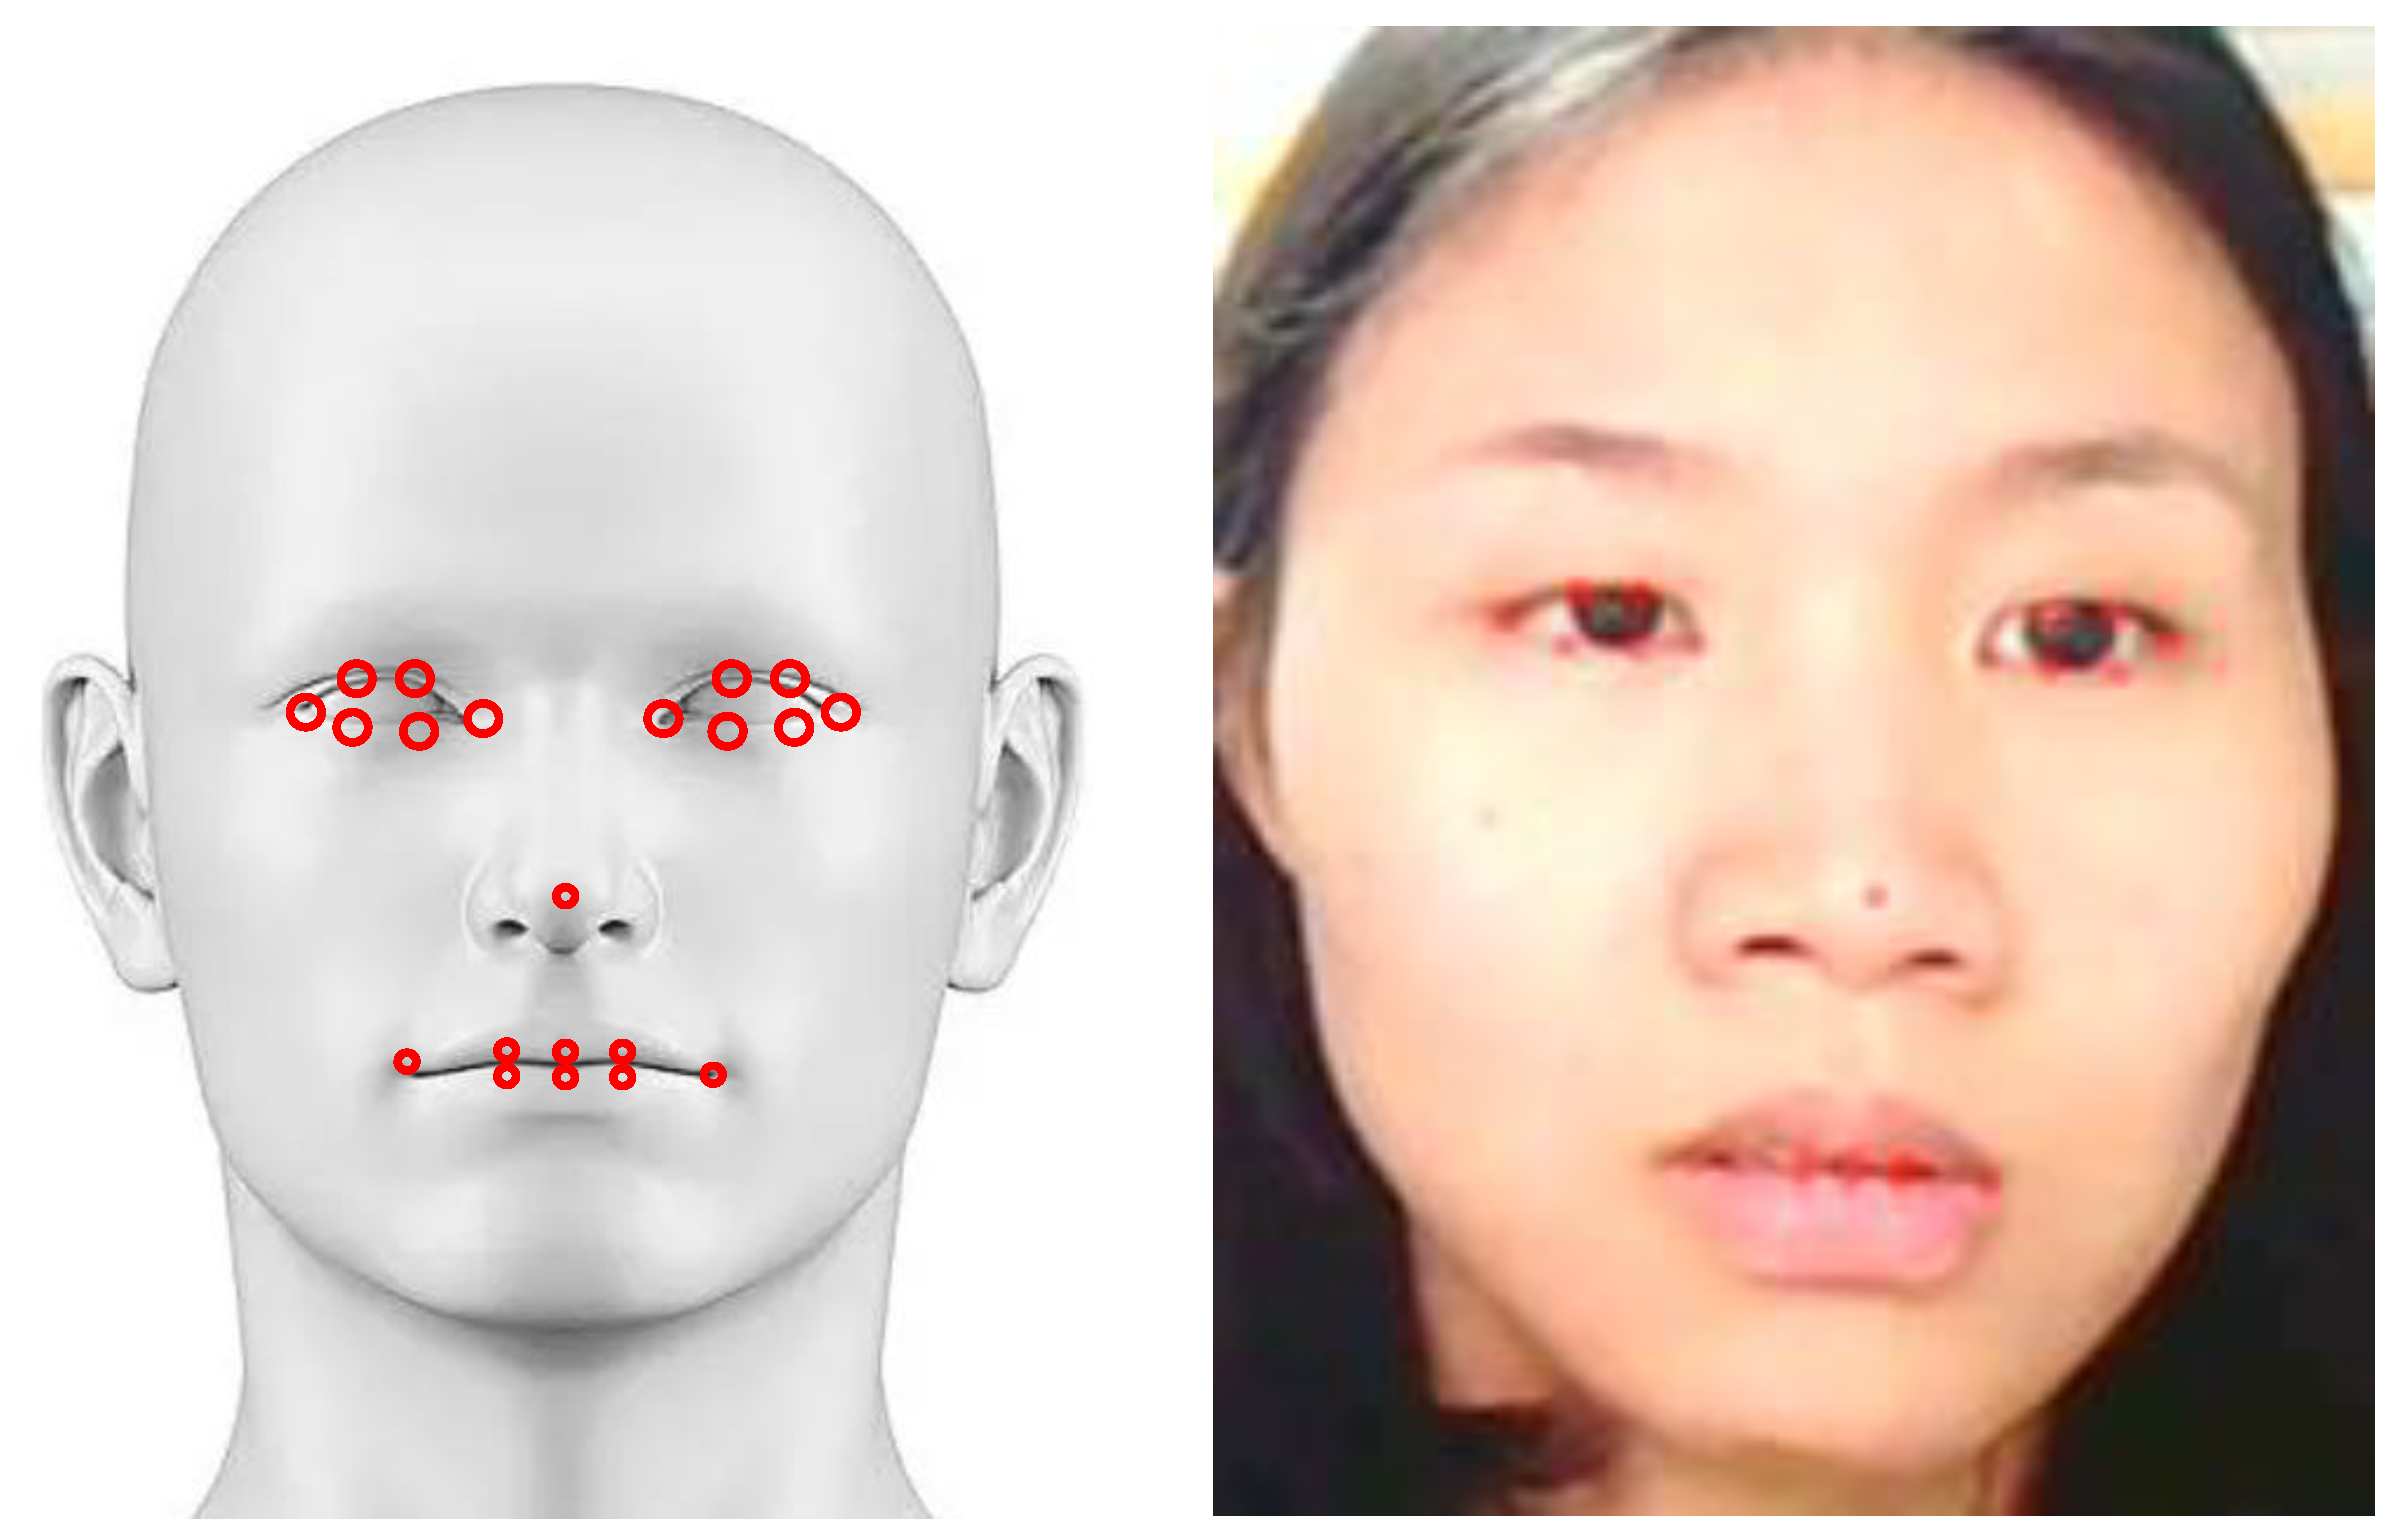
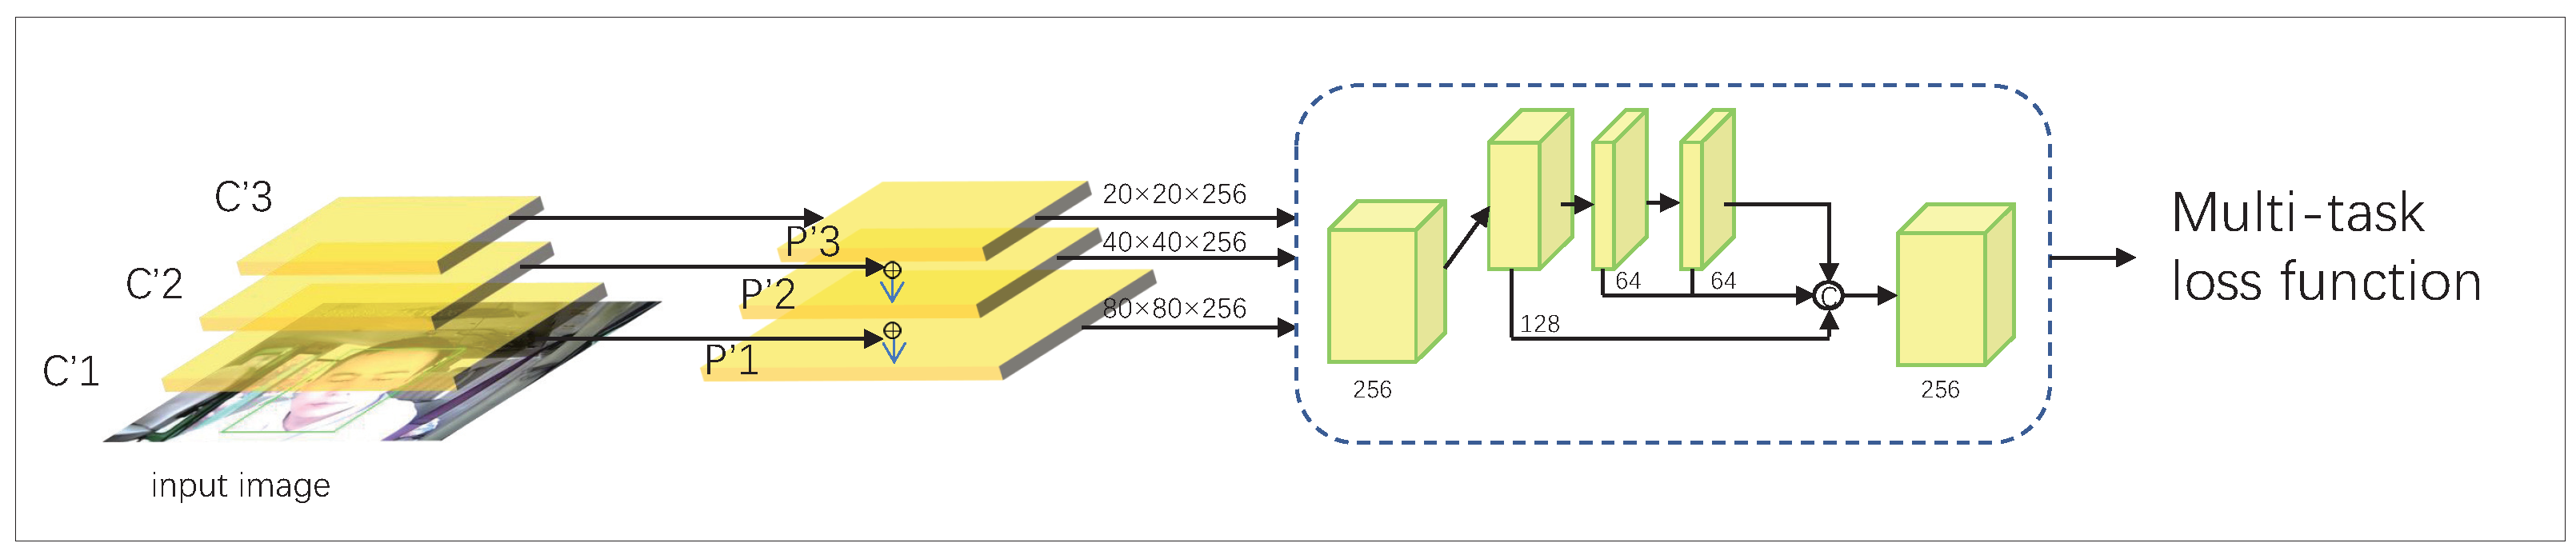
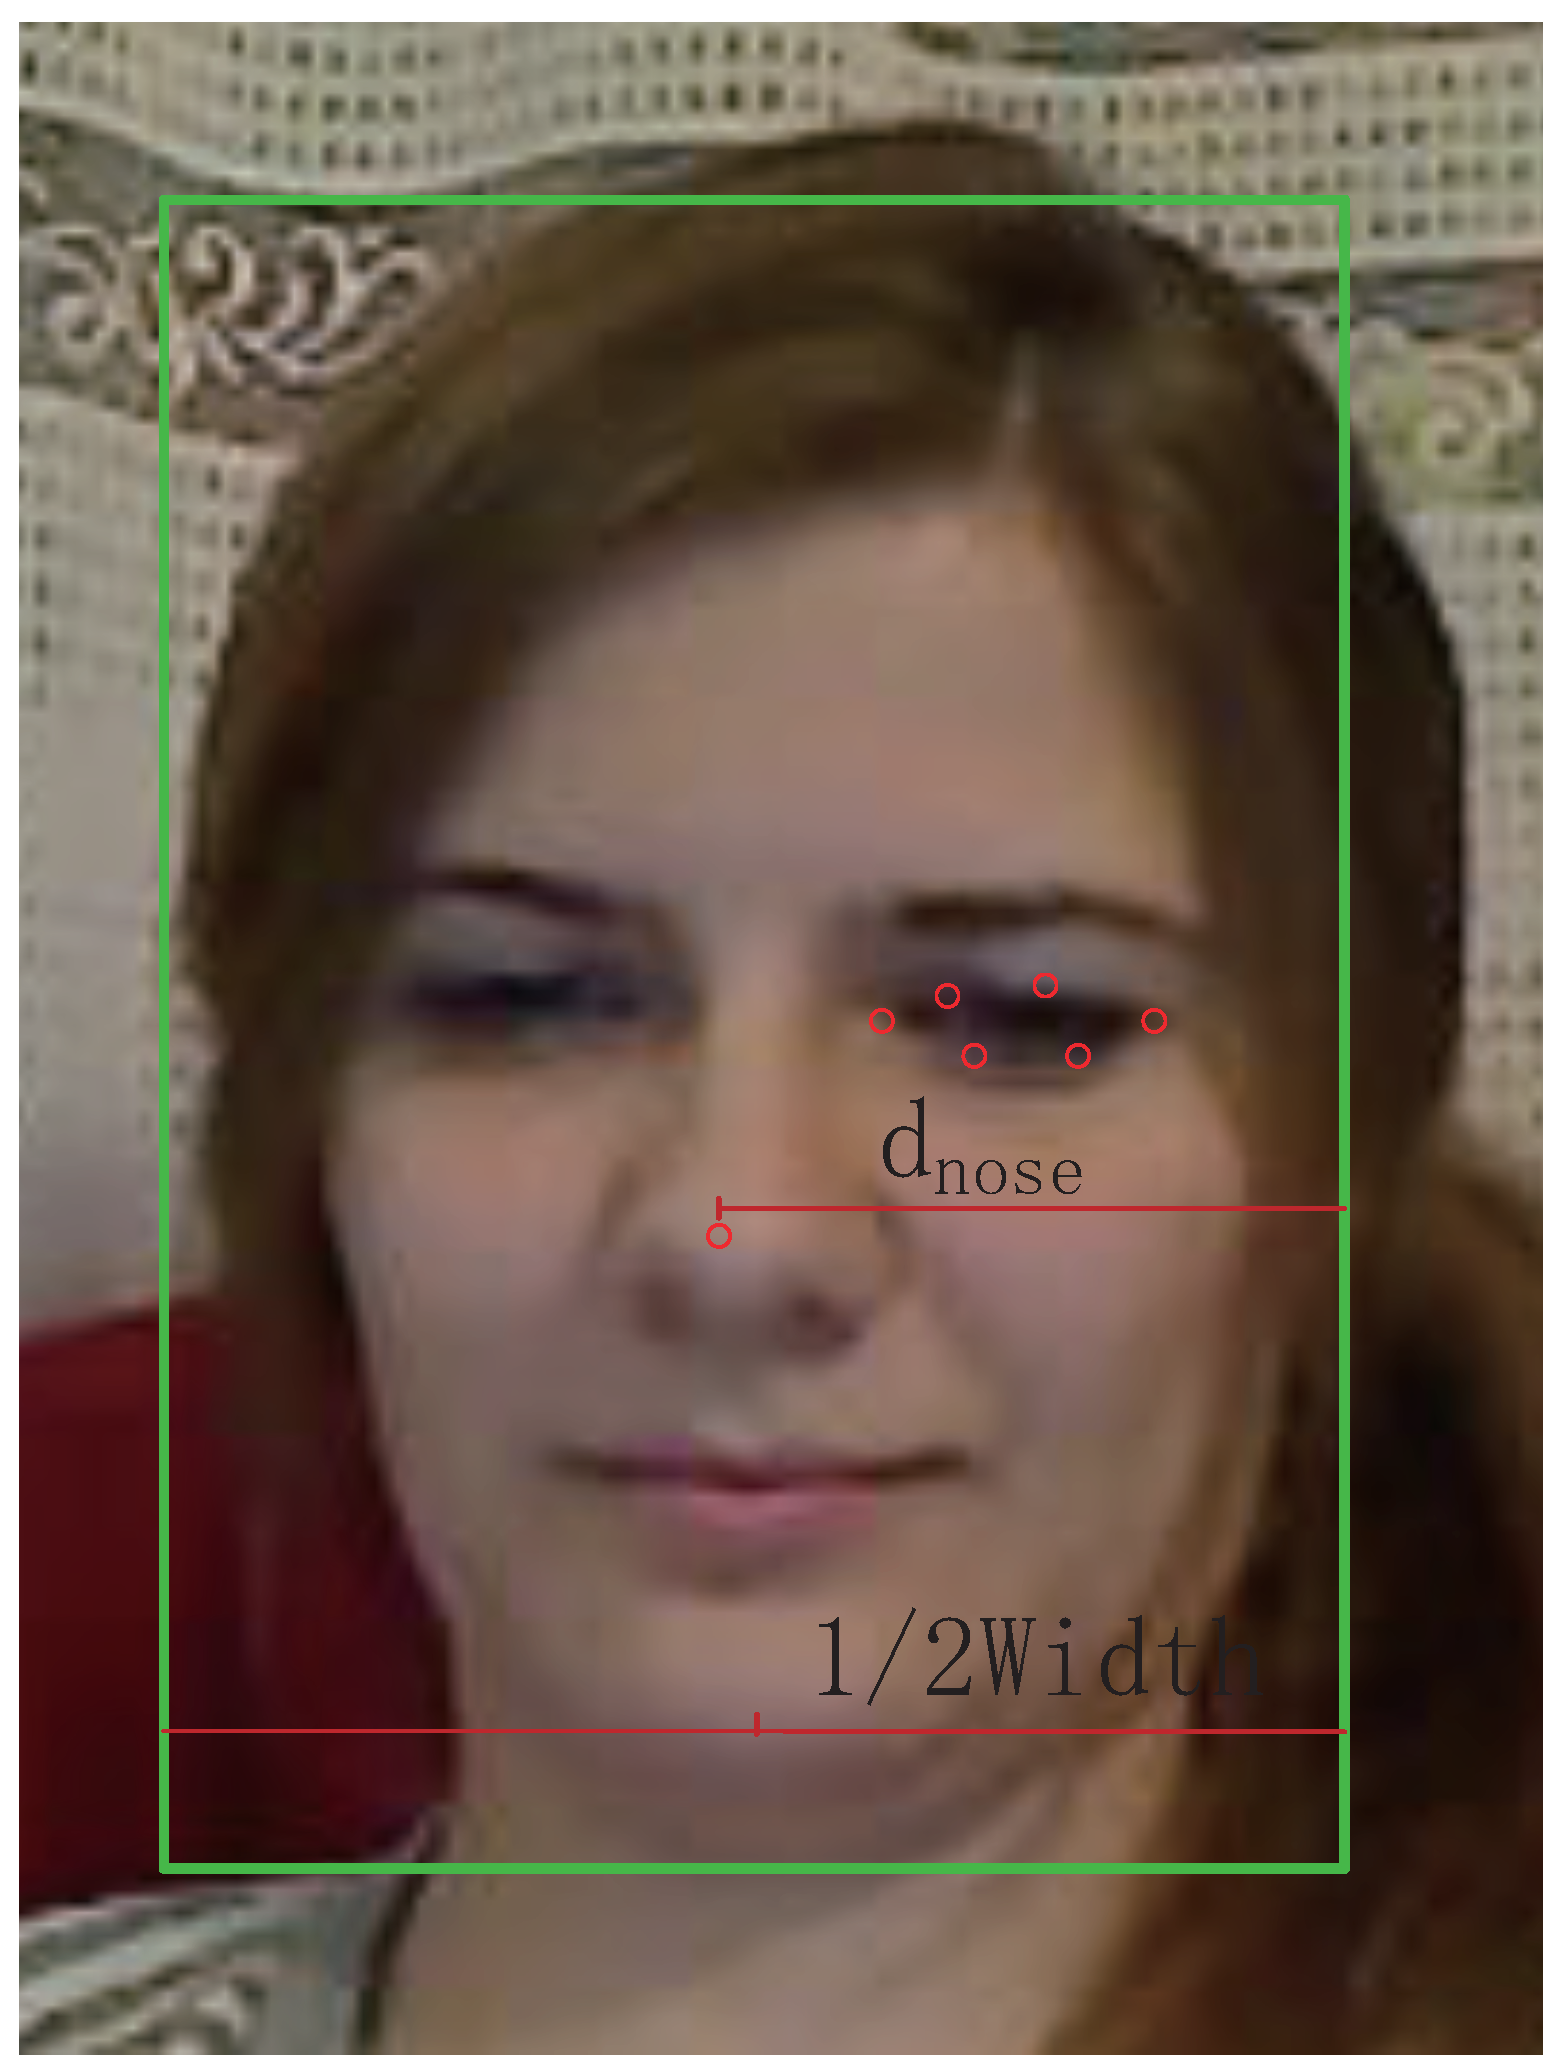
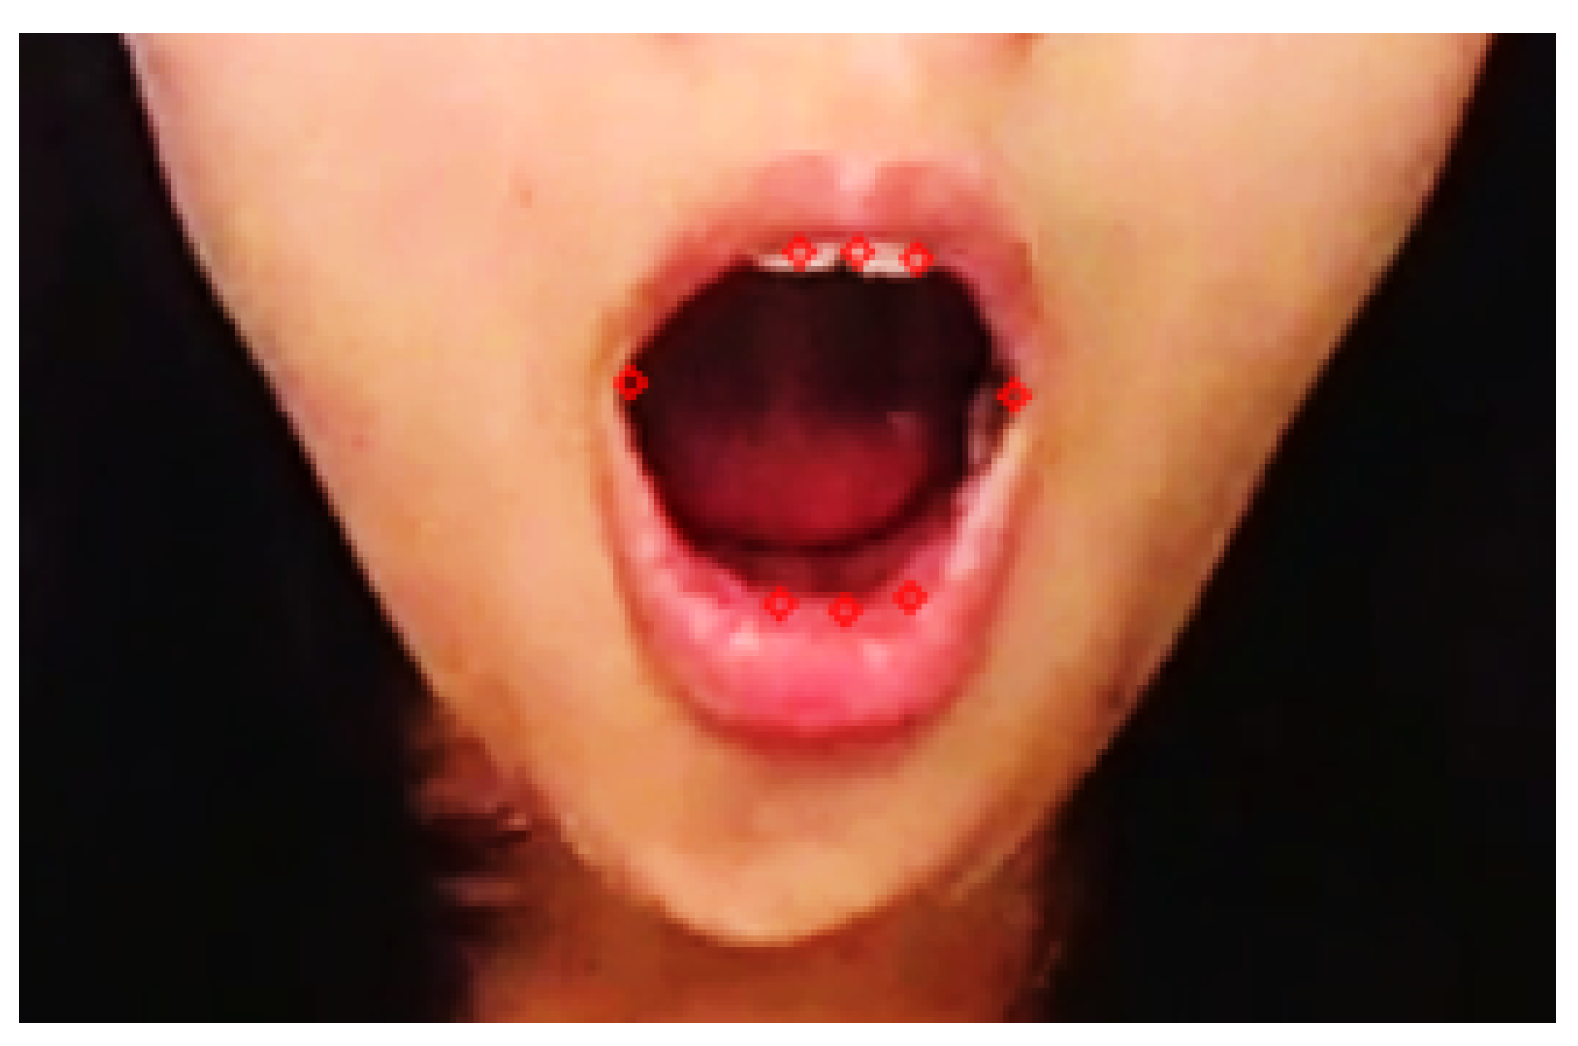
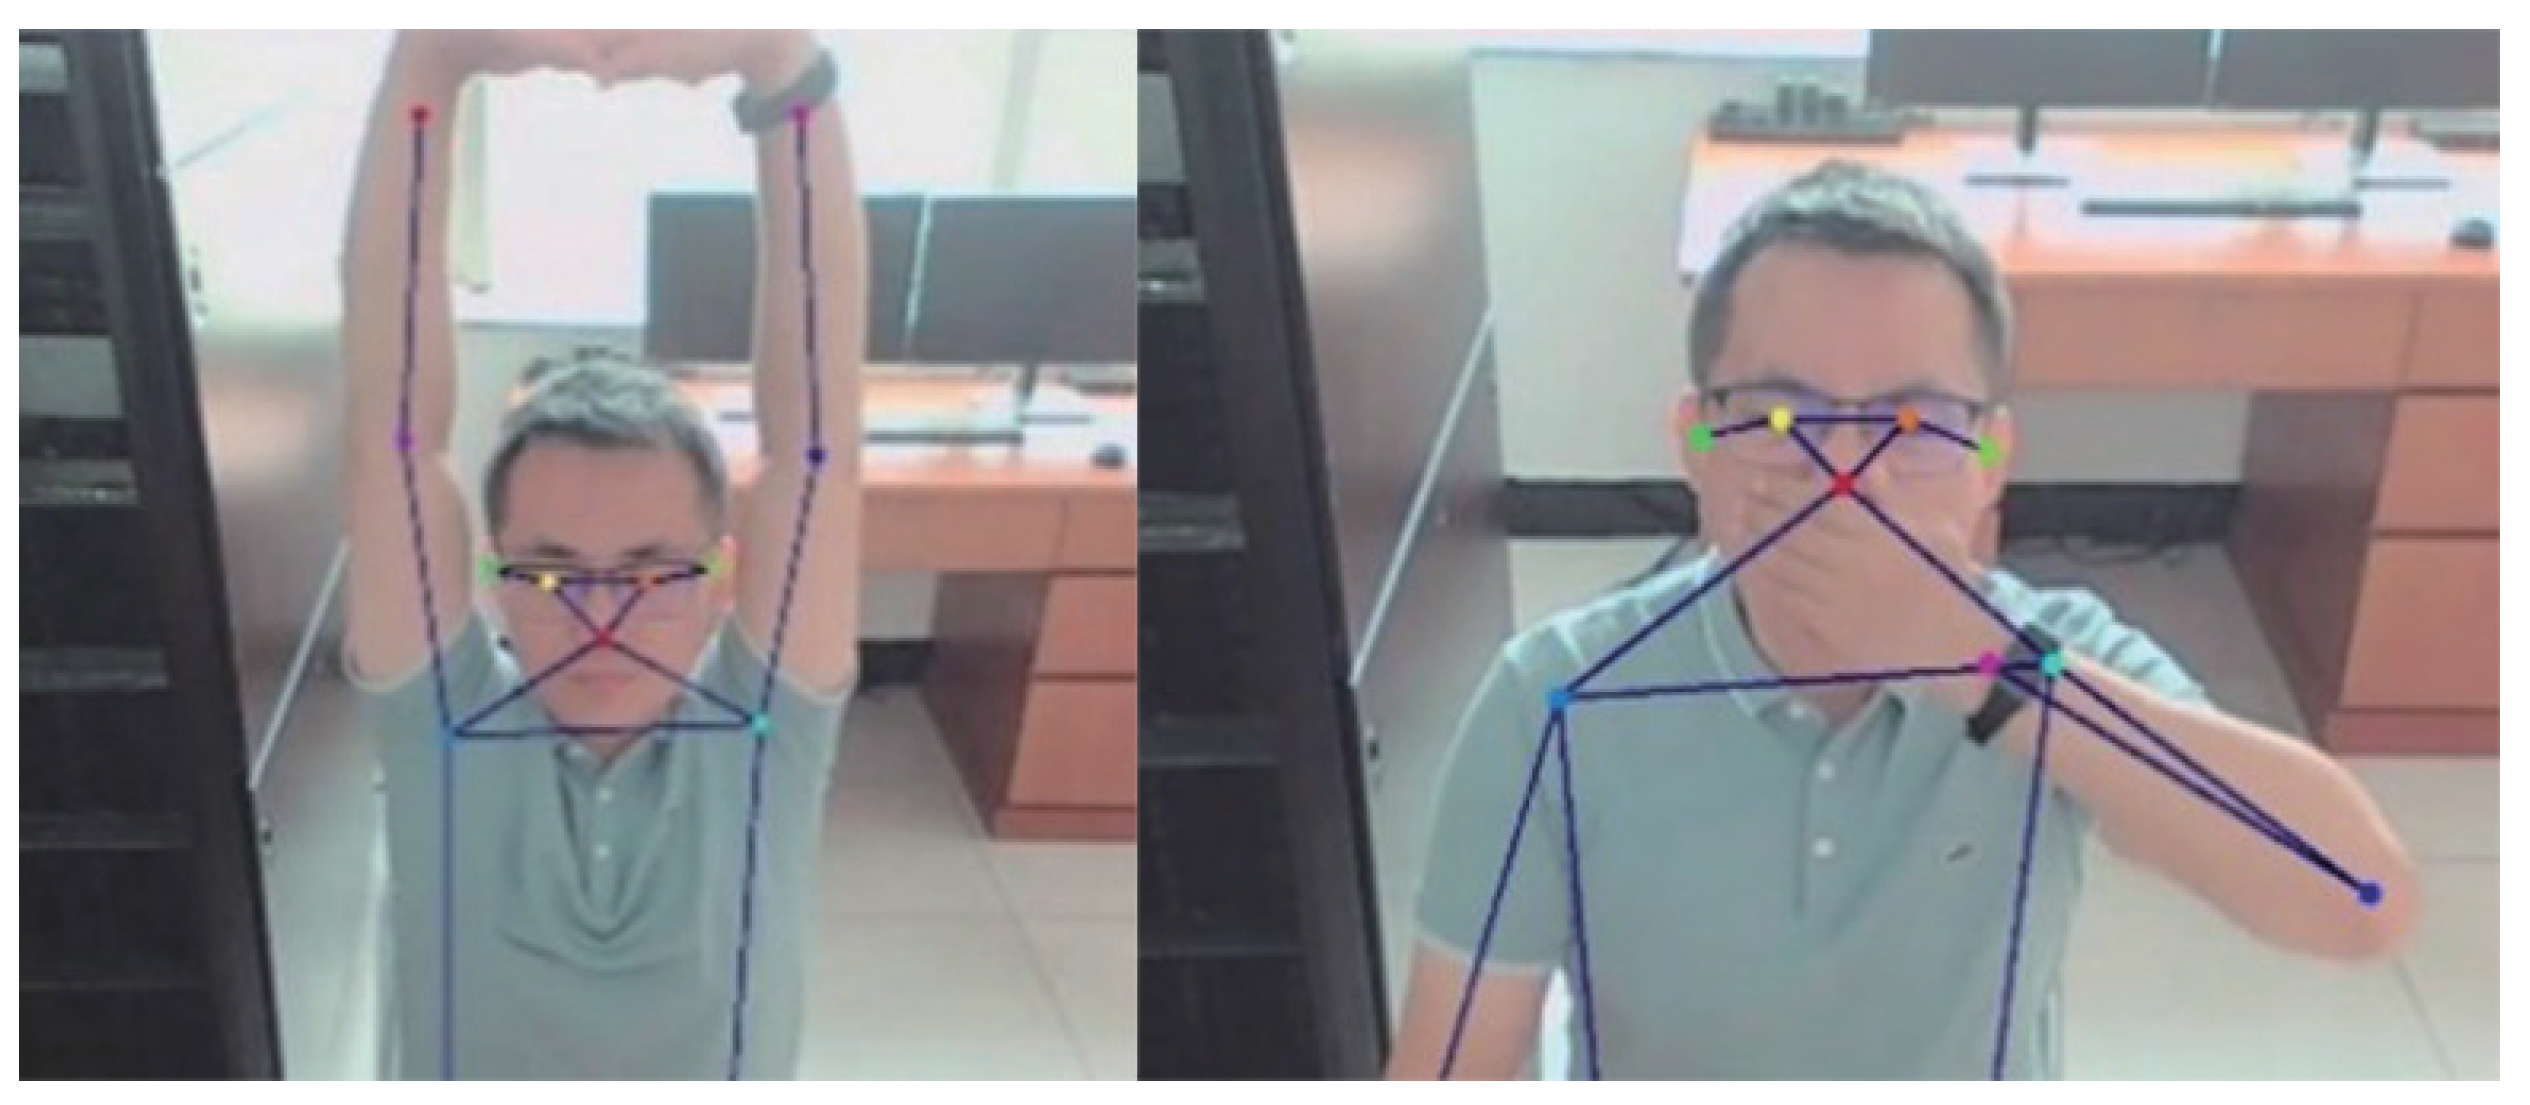
First, we input the collected video data into the RetinaFace model to locate the key points of the face and obtain the positioning data of human eyes (12 points), mouth (8 points), and nose tip (1 point), according to the facial key points of each frame of the image. The key point representing the tip of the nose was calculated to obtain the eye screenshot for the reference eye and extract the HOG feature, which was then input into the PSO-SVM classifier to distinguish the eye open or closed state and calculate the PERCLOS f-value of the latest 1800 frames.
Blinking is a process, and it takes about 0.1 s to blink one time. According to a video frame rate of 30 fps, the sampling time of one frame is about 0.033 s. Without any occlusion, at least two images could capture a single blink, so at least two consecutive pictures with eyes closed were counted as one blink.
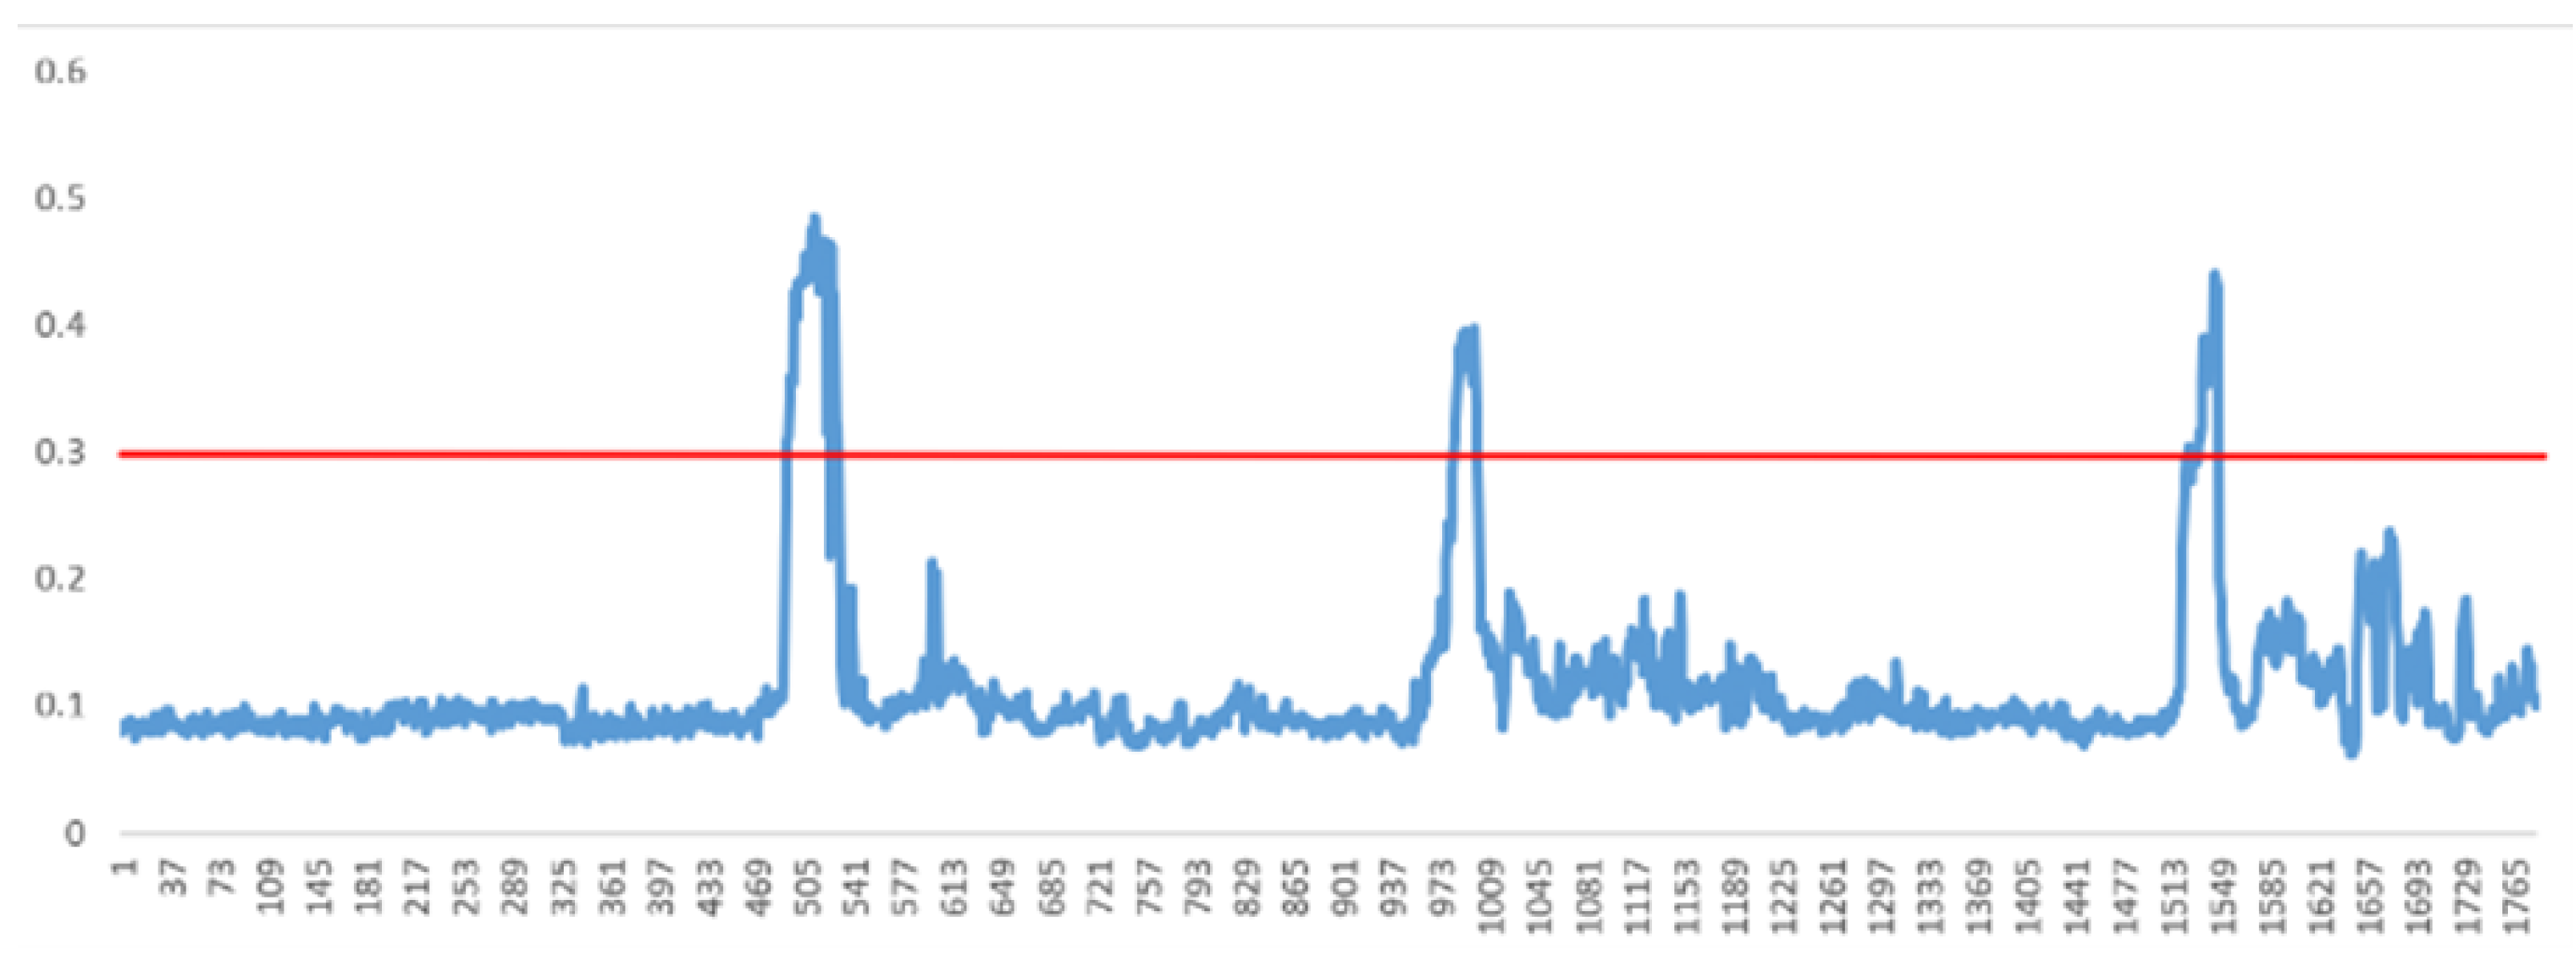
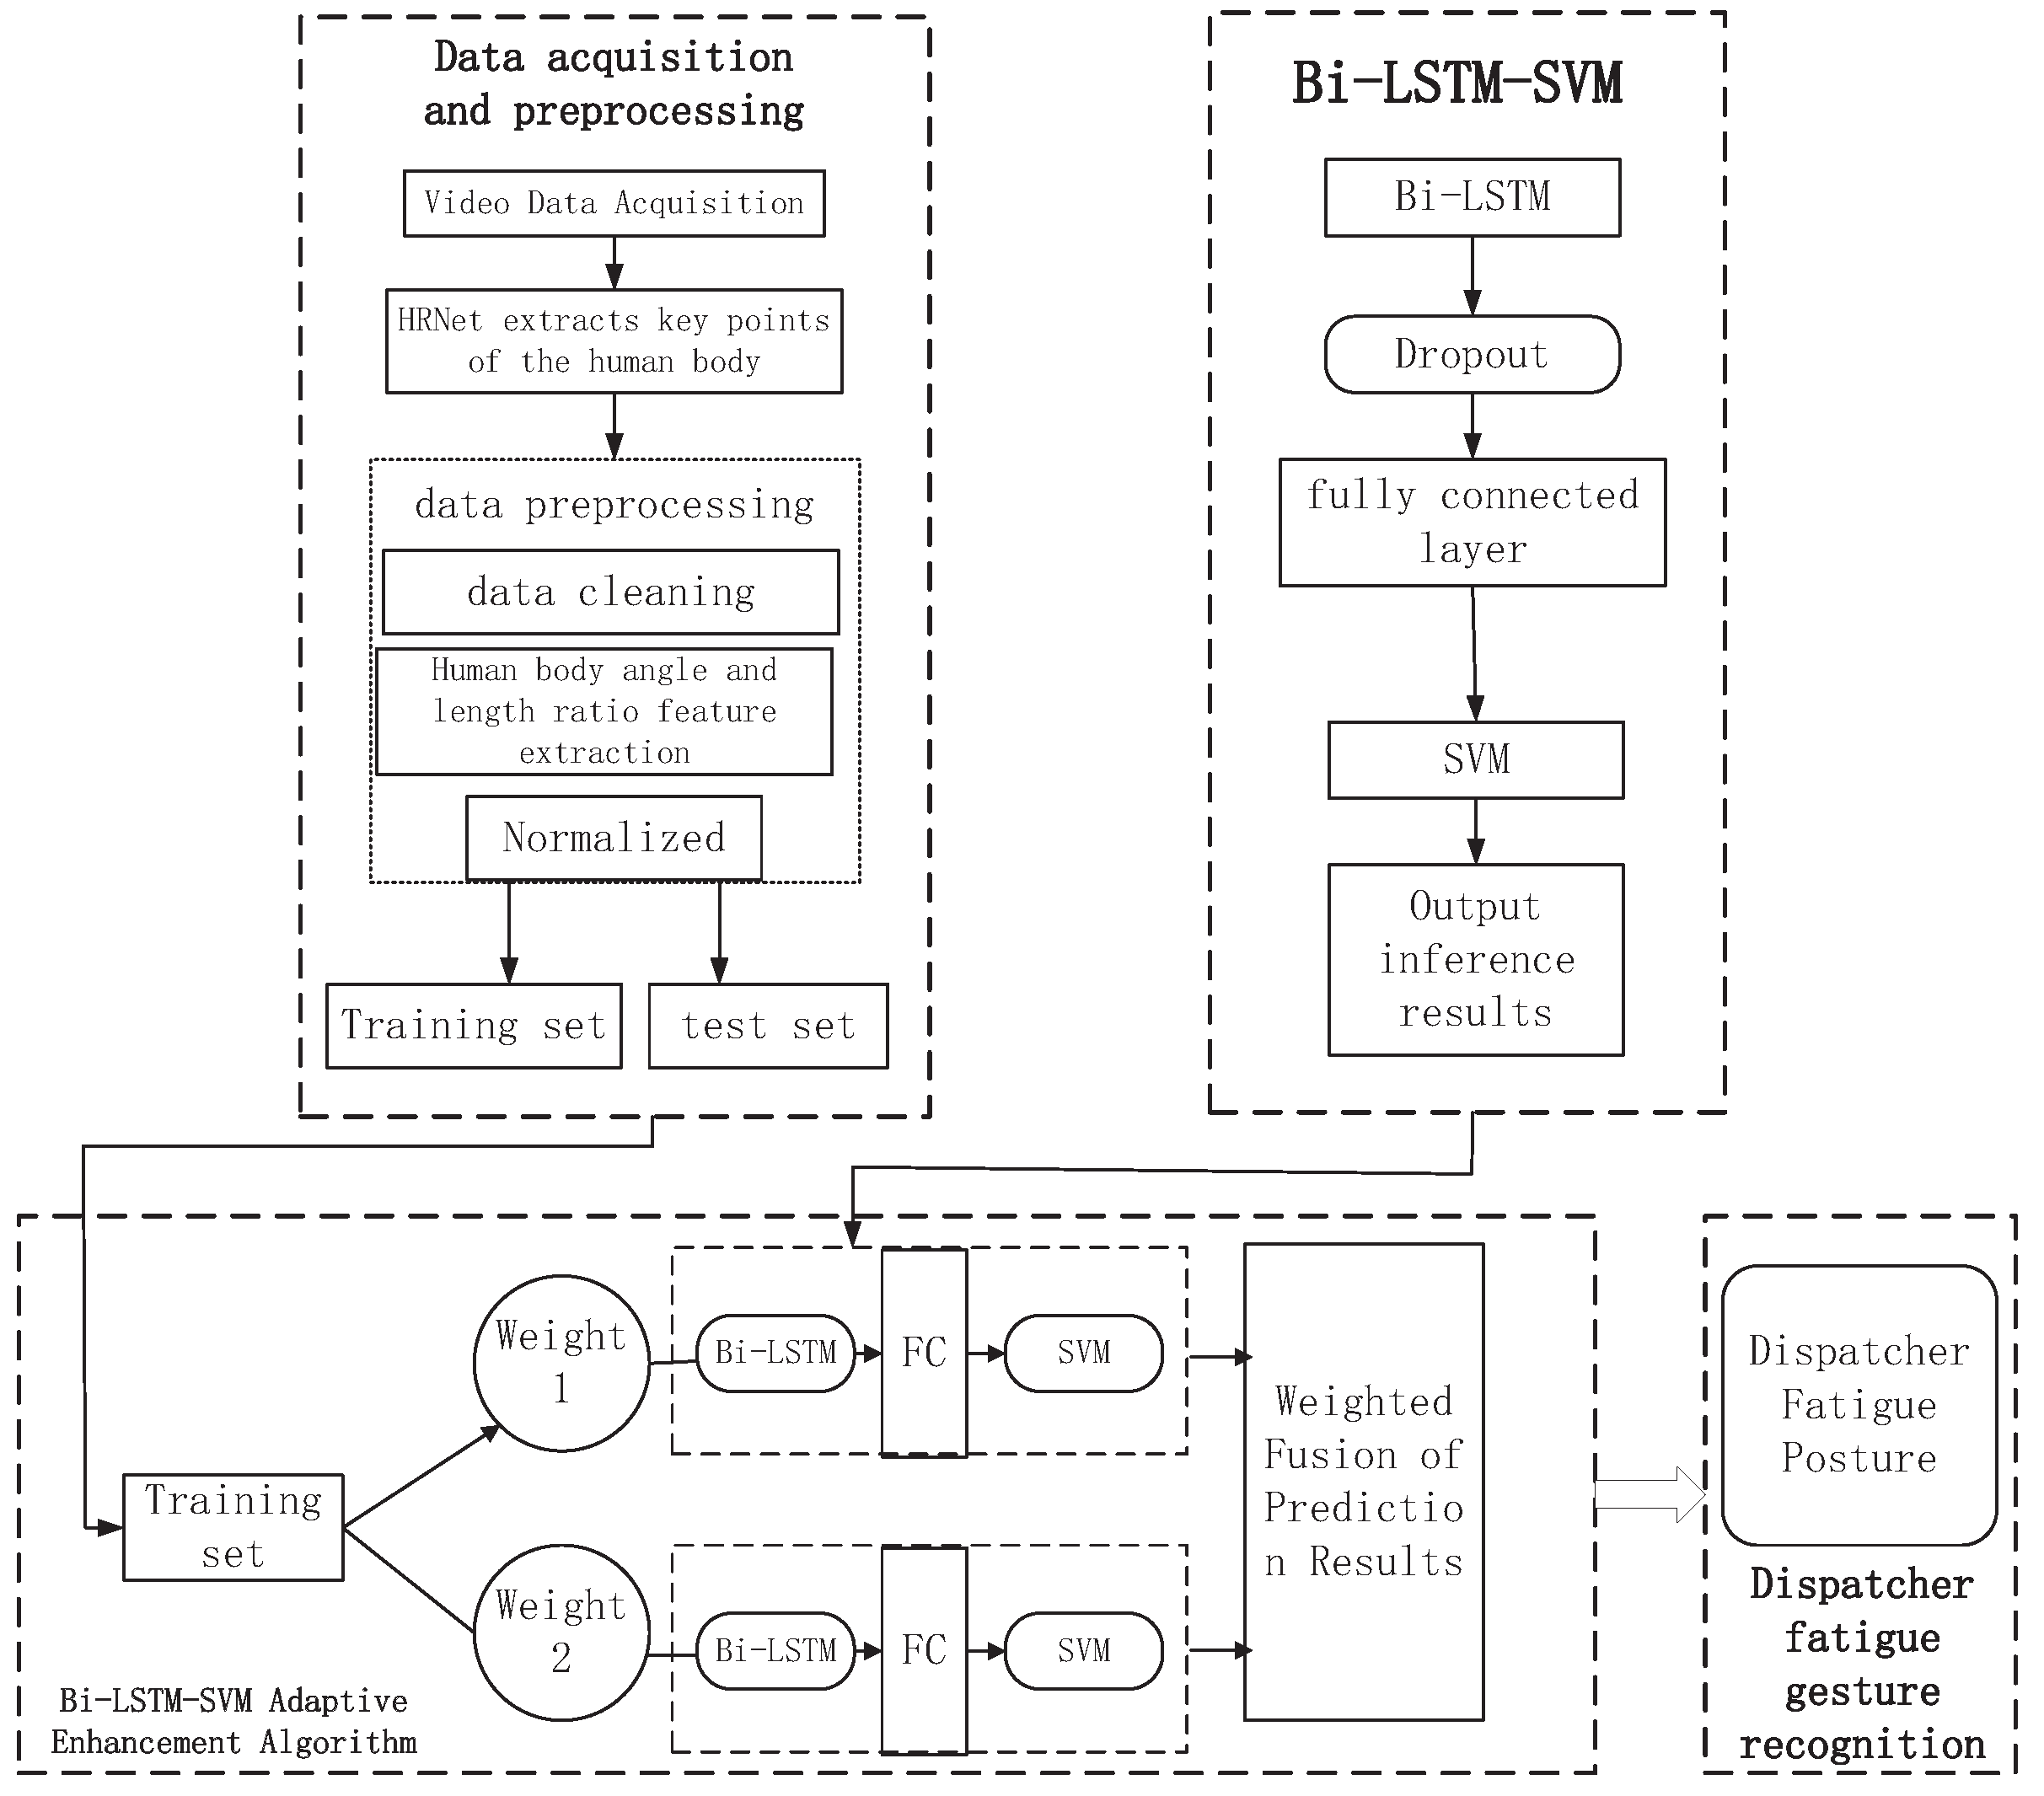
According to the position data of the eight key points of the mouth, the mouth aspect ratio (MAR) of each frame image was calculated, and a fixed threshold was used to determine the occurrence of yawning; then, the number of yawning actions in the most recent 1800 frames was also calculated. When collecting facial key points for calculation, the video data were added to the Bi-LSTM-SVM adaptive enhancement model at the same time, and the frequency of yawning, the number of sleep states (indicated by lying on the table), etc., were calculated.
The hyper-parameters that affected the classification results of the artificial neural network fatigue state classification model included the following: the number of network layers, the number of neurons in each layer, and the number of iterations. At first, we used an empirical equation to calculate the parameters and determined that the model had the following: a total of 5 input neurons; a total of 150 iterations; and two hidden layers, one with 20 neurons and the other with 30 neurons. However, this would have caused overfitting. As a result, we adopted four methods to reduce and avoid overfitting.
(1)
Appropriately reducing model complexity
By reducing the number of neurons in the two-layer network to 10 and 15, we can reduce the amount of neuron computation and avoid overfitting.
(2)
Using an optimizer and an appropriate learning rate
We used the Adam optimizer and selected an appropriate learning rate; we set 0.05 here.
(3)
Early stopping
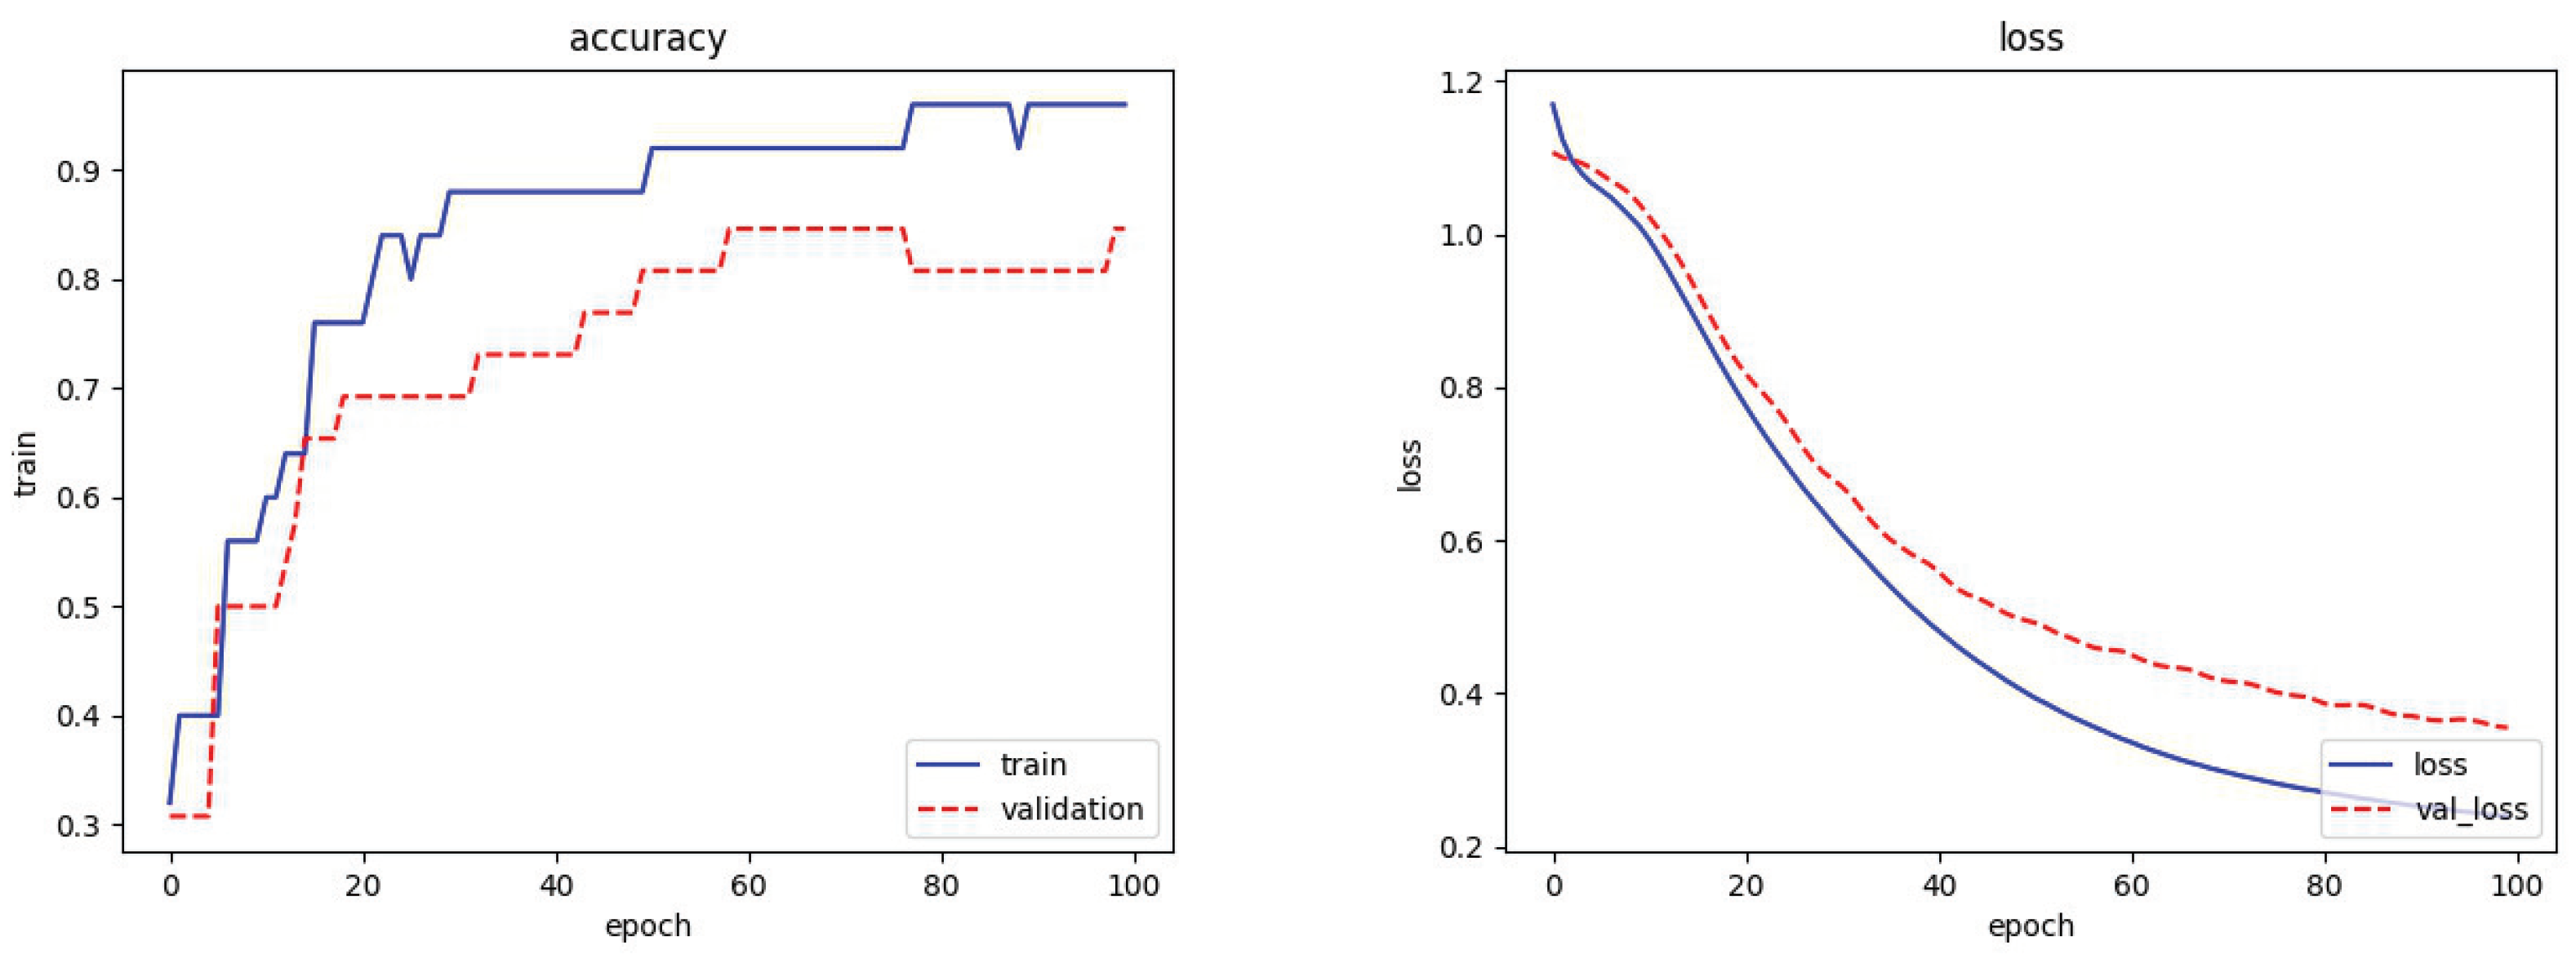
We divided the original training dataset into a training set and a validation set and only trained using the training set. We calculated the error of the model on the validation set in each cycle. When the error of the model on the validation set was worse than the previous training result, we stopped training. After training, the training epoch was stable at epoch 100. Therefore, 100 was chosen as the number of training epochs.
(4)
The batch size cannot be set too large
When training the neural network, we set a smaller batch size, 10.
After the above debugging processes, the network effect was good, and the overfitting phenomenon was avoided. The training results are shown in Figure 11.
The data and classification are shown in Table 7.

5.4. Analysis of Results

In order to provide a clearer description of the effectiveness of our proposed algorithm, we conducted ablation and comparison experiments on fatigue detection, facial detection, and posture recognition. The results are as follows.
(1)
Fatigue detection ablation test
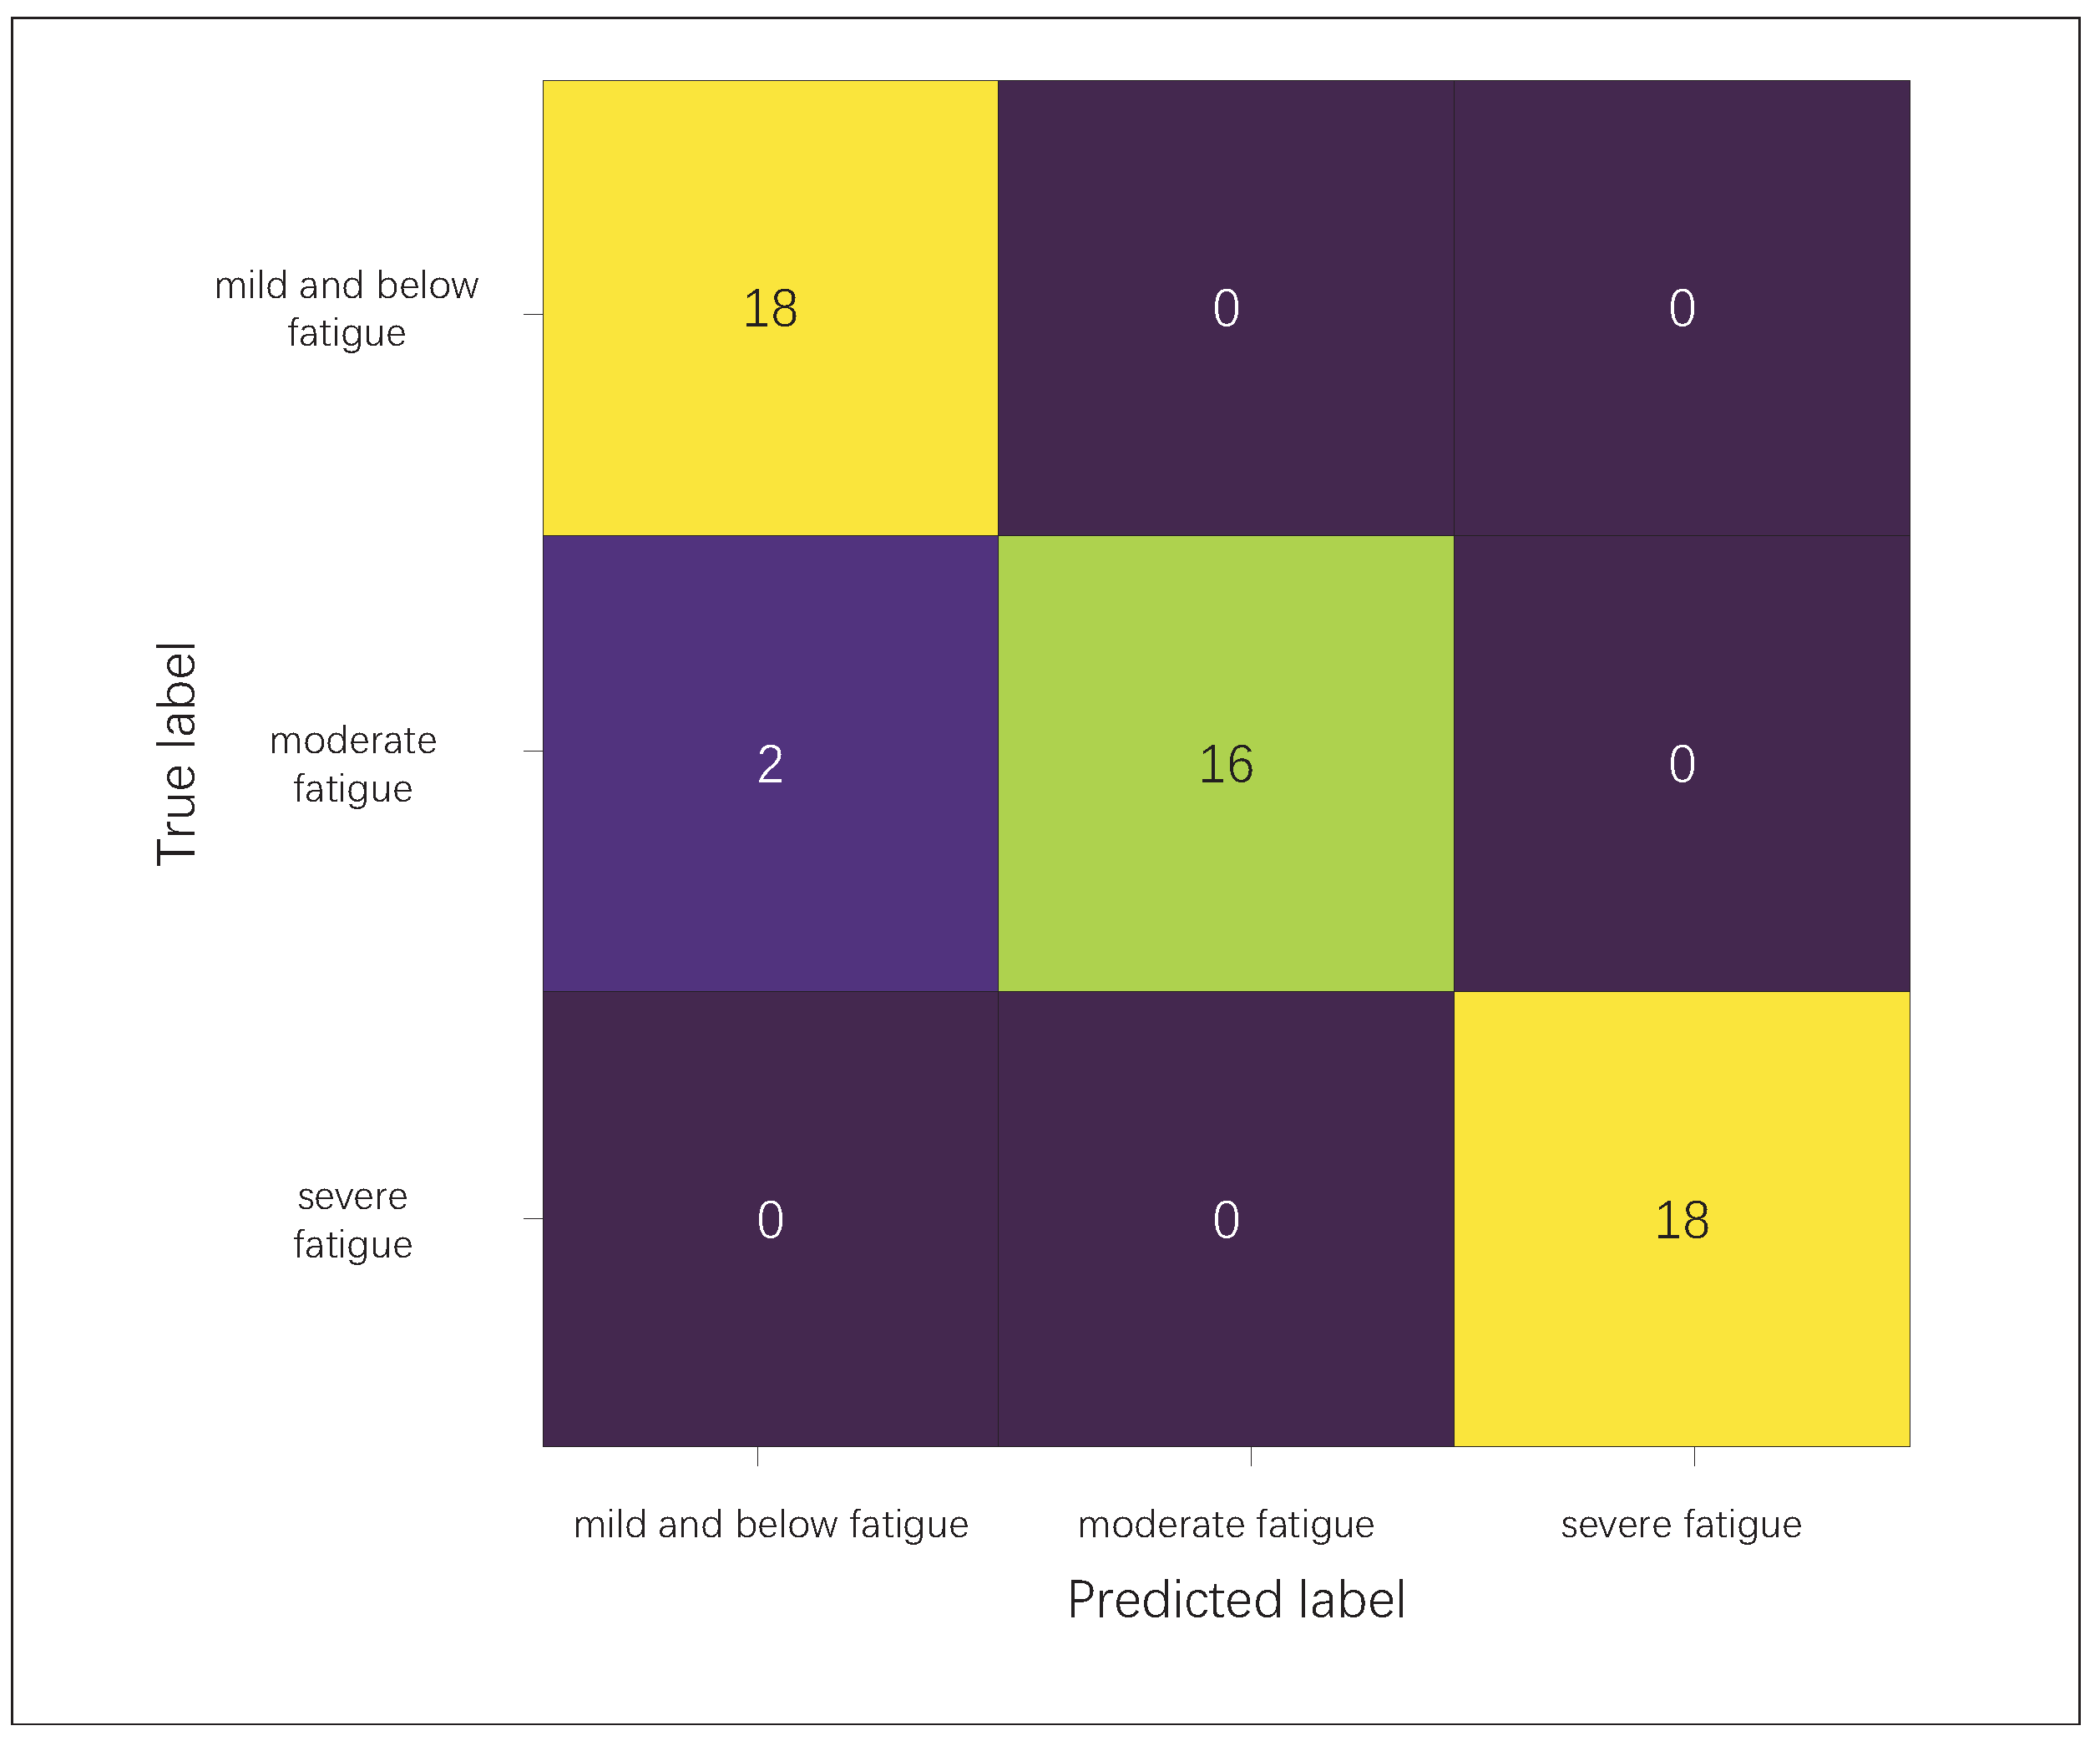
Table 8 shows the prediction results of each fatigue state, and the confusion matrix of the network model is shown in Figure 12.
In order to verify the effectiveness of multi-feature selection in this study, the accuracy of fatigue classification under three different features was selected for comparative analysis: the PERCLOS method, which is calculated by only using eye key points; only facial features (eye key points, mouth key points, etc.); and the algorithm in this paper (facial features and behavioral features). The results are shown in Table 9.
(2)
Multi-feature fusion fatigue detection method comparison
A comparison with the algorithms used in previous studies is shown in Table 10. In this study, the fatigue detection algorithm using multi-feature fusion had better accuracy than the other models, with a 3.71% higher rate than the next ranked model. The results are shown in Table 10.
In this comparison of the three methods, all were multi-feature fusion methods for fatigue detection. In reference [12], PERCLOS, eye closure duration, and mouth opening times are used as fatigue detection characteristics, and the fusion algorithm of the fatigue decision-making level is a BP neural network. Due to the relatively small number of features, the accuracy was the lowest among the three. In reference [16], five features, such as the head, the eyes, and the mouth, are used for fusion, but the fusion method is weighted with empirical values. The overall effect was better than that of the other three features. Our algorithm had the best effect, because it uses five features and also considers body posture characteristics, as shown in Table 11.
We provide a different model of behavioral and facial fusion features for fatigue state prediction. As shown in Table 8, the overall fatigue prediction effect of the model is satisfactory, and the evaluation indexes of each fatigued state are above 96%. The model made an error in the classification of mild-to-no fatigue and moderate fatigue and classified moderate fatigue as mild-to-no fatigue. The reason is that in two records, the subjects did not display behavior changes, such as yawning or eye fatigue, making their overall characteristics relatively similar. In future research, we will focus on optimizing the scoring mechanism based on the degree of subjective sleepiness and improve the distinctive characteristics of eye fatigue.
(3)
Facial key point model ablation test
In order to verify the efficiency of the research method proposed in this paper, the facial key point model was assessed with a testing set composed of a public and a hand-crafted dataset, and the normalized mean error (NME) was used for evaluation, as NME is a commonly used evaluation index for facial key point detection:
N M E = k = 1 N | | x k y k | | 2 d
where x represents the true position of the key point, y represents the value predicted by the network, and d represents the Euclidean distance between the two outer corners. The smaller NME is, the better the prediction results of the model are.
In order to verify the validity of the classification model proposed in this paper, the model was evaluated as a classification model, and the accuracy, recall, precision, and F1-score values are introduced for model classification. The accuracy rate is the proportion of accurately predicted samples out of all predicted samples; the recall rate reflects the probability of predicting a positive sample among the actually positive samples; and the precision rate is the accuracy of the model evaluation and prediction of positive samples. The F1-score considers both the precision and the recall values of the classification model. The equations for these calculations are the following:
A c c u r a c y = T P + T N T P + F P + T N + F N
P r e c i s i o n = T P T P + F P
R e c a l l = T P T P + F N
F 1 S c o r e = 2 × P × R P + R
True positive (TP): The sample is positive, and the prediction result is positive.
False positive (FP): The sample is negative, but the prediction result is positive.
True negative (TN): The sample is negative, and the prediction result is negative.
False negative (FN): The sample is positive, but the prediction result is negative.
In this paper, the commonly used public dataset 300 W was used for the quality assessment of facial key point detection. The environment for this experiment used a camera (1280 × 720), a GPU NVIDIA Geforce GTX 1080Ti, and a graphics memory of 11 GB. The training set of this dataset had a total of 3148 images, and the testing set contained 689 images. In this paper, 12 key points of the eyes, 1 key point of the tip of the nose, and 8 key points of the mouth were used.
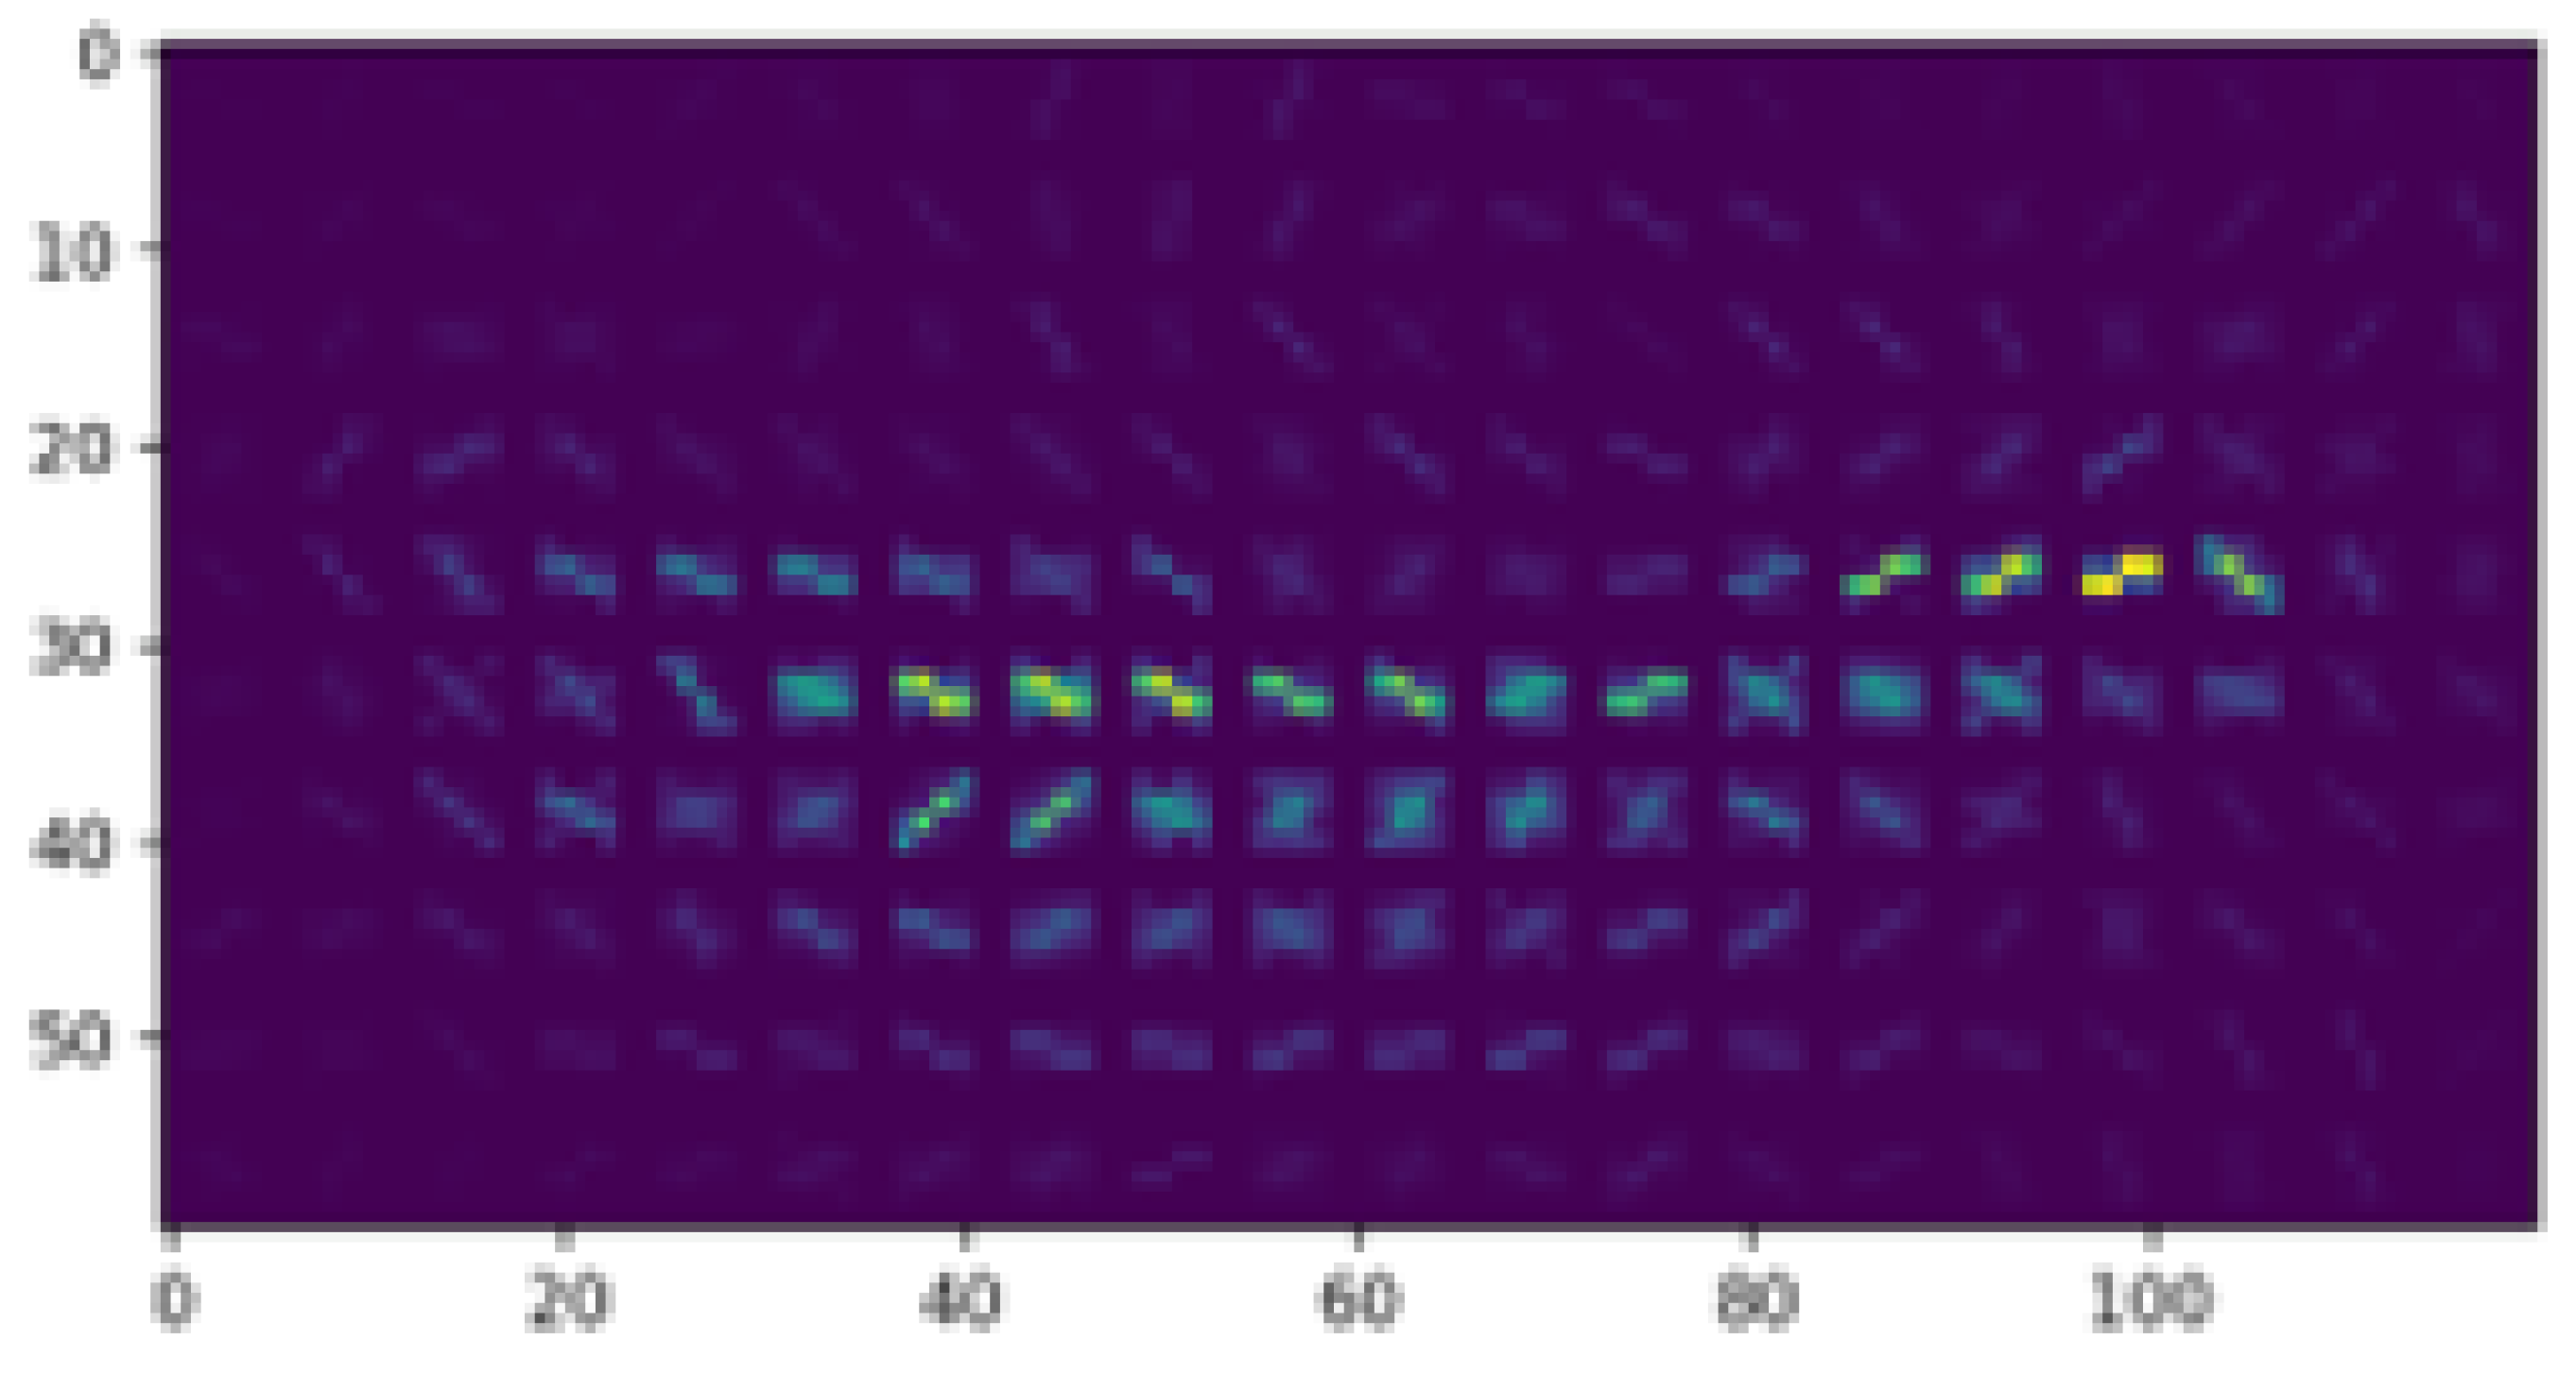
We conducted a comparative experiment. We compared the prediction accuracy (NME) of models with Gabor, without Gabor, and with LBPs. As the result show, the model with Gabor showed better performance. The Gabor filter can extract rich texture features in face images, making face feature classification and recognition more accurate, as shown in Table 12.
(4)
Facial key point model comparison
The NME results of RetinaFace-based facial key point recognition on the 300 W dataset are shown in Table 13, and the prediction speeds of the single-frame pictures are shown in Table 14.
As shown in Table 13, RetinaFace-based facial key point recognition performed well with the comparison algorithm on the 300 W dataset, and it demonstrated good prediction accuracy on the common subset, challenge subset, and full subset. As shown in Table 14, the volume of the model was very small, at only 1.84 M, and the prediction cost time was only 0.1 s, which meets the efficiency requirements of effective and efficient dispatcher fatigue detection.
(5)
Behavioral classification model ablation test
To verify the effectiveness of our proposed algorithm for behavioral features, we conducted comparative experiments. We compared the accuracy of behavioral posture using different methods, including LSTM, Bi-LSTM, Bi-LSTM-SVM, and enhanced adaptive algorithms. As the results show, our algorithm improved the accuracy of posture detection. The results are shown in Table 15.
(6)
Behavioral classification model comparison
In order to verify the superiority of model classification, comparison and verification based on other neural networks were conducted on the same dataset. In this study, the fatigue detection algorithm based on multi-feature fusion had a higher accuracy than other models, as shown in Table 16.

5.5. Discussion

In this study, we show a method for railway train dispatcher fatigue detection using the multi-feature fusion of facial cues and body postures in a deep learning model. Considering the unfavorable factors, such as facial occlusion and angle changes, that have limited single-feature fatigue state detection methods, we developed our model based on the fusion of body postures and facial features for better accuracy.
First and foremost, this study’s method detects the fatigue status not only by using facial features but also by using human postures when the face is blocked. The result of model prediction accuracy was 96.3%, and recall was 96.3%, which indicates the effectiveness of the model. Second, we used an optimized RetinaFace model to identify eye key points, obtaining NME of 3.58 and prediction cost of 100 ms, ensuring its prediction accuracy and speed. Third, we adopted the optimized Bi-LSTM to recognize human posture to identify human fatigue posture, and the prediction accuracy was 0.96.
The comparison of the findings and those of other studies confirms that this study presents an objective fatigue detection method that uses non-contact methods to detect dispatchers’ fatigue status. At present, the features used in multi-feature fatigue detection include eye closure duration, mouth movements during yawning, and vocal tonality. The most prominent difference in our study is the use of behavioral actions as fatigue features. Compared with previous research methods that are based on facial multiple features, the prediction accuracy has been improved by 5.56% and 3.71%, respectively.
Our study focuses on the accuracy of fatigue state detection during the daily working time of dispatchers; the fatigue state is a gradual process, and the fatigue state is not an instantaneous state. Therefore, the real-time requirement for the detection of the fatigue of dispatchers is not strong. In our experimental environment, we ran it three times, and it took an average of 311 ms, which meets the research needs in dispatcher fatigue detection. In order to improve the real-time performance of the algorithm, we will continue to optimize the face key point recognition algorithm, human key point extraction algorithm, and feature extraction algorithm. For example, we will continue optimizing the feature extraction method for human posture, which can reduce the computational complexity of the algorithm and improve real-time performance.
The generalizability of the results is limited by fatigue detection methods. This study can add a more accurate technical method for identifying fatigue, such as EEG detection, and then identify fatigue using multiple feature fusion methods. Due to the fixed-focus camera used for the method in this study, if the face is far from the camera, it may not be possible to capture the face, and relying solely on posture recognition is not sufficient to fully detect fatigue. Therefore, it is more suitable for work positions where the relative camera distance remains unchanged.
This is an important issue for future research. Fatigue detection can be conducted on dispatchers to detect their fatigue status in advance, providing human fatigue data support for railway regulations and operation management and further ensuring railway operation safety.

6. Conclusions

Given the complex features of face and body posture, it has been challenging to accurately predict human fatigue levels at a low computational cost when using traditional approaches that only consider a single feature. In this study, we developed a new method by fusing five key point features that comprise the face, as well as identifying critical changes in body posture.
The main conclusions of this paper are reported below.
The algorithm proposed in this paper uses the f-value of PERCLOS, blink frequency, yawning frequency, stretching, the bowing of the head (that could indicate sleep state), falling asleep on a table, and other behaviors as characteristics for determining fatigue. It can determine fatigue not only by identifying key points of the face but also using behavioral cues that indicate fatigue levels using feature fusion.
We collected a dataset for this study. There were a total of five volunteers in the dataset, which included 192 samples of available data. We could control data quality better. By confirming and verifying the integrity and accuracy of the data, the quality of the data and the credibility of the study results can be improved. In future work following up on this study, we will invite more volunteers for data collection and continuously expand the dataset.
The experimental results on the hand-crafted dataset show that the detection accuracy of our method reached 96.30%. Compared with the other methods using a single feature for fatigue determination, our multi-feature fusion algorithm had better accuracy by 7.41% and 3.71%. At the same time, the method proposed in this paper had higher accuracy than other existing algorithms even without facial expression data; thus, the effectiveness of dispatcher fatigue detection was verified.
This study’s method recognizes fatigue based on the facial and posture characteristics of dispatchers, indicating its application potential. Our next research direction will focus on improving our model by increasing the size of the experimental datasets and reducing the complexity of the model. In addition, we expect to apply dropout and regularization methods to optimize the model. Furthermore, additional research should be conducted to include other fatigue features and indicators, such as tone of voice and the total amount of continuous work hours, as integrating these could improve the model’s prediction effect.

Author Contributions

All of the authors extensively contributed to the work. Conceptualization, L.C. and W.Z.; methodology, L.C. and W.Z.; software, L.C.; investigation, L.C.; writing—original draft preparation, L.C.; writing—review and editing, L.C.; supervision, W.Z. All authors have read and agreed to the published version of the manuscript.

Funding

This work was supported in part by Science and Technology Research and Development Plan Project of China National Railway Group Co., Ltd., under grant N2021Z007; in part by Fundamental Research Funds for the Central Universities (Science and technology leading talent team project) under grant 2022JBXT003; and in part by Science and Technology Research and Development Plan Project of China Academy of Railway Sciences Group Co., Ltd., under grant 2020YJ098.

Acknowledgments

The authors are grateful to the editors and the anonymous reviewers for their insightful comments and suggestions.

Conflicts of Interest

The authors declare no conflict of interest.

References

  1. Horne, J.A.; Ostberg, O. A self-assessment questionnaire to determine morningness-eveningness in human circadian rhythms. Int. J. Chronobiol. 1976, 4, 97–110. [Google Scholar] [PubMed]
  2. Casale, C.E.; Yamazaki, E.M.; Brieva, T.E.; Antler, C.A.; Goel, N. Raw scores on subjective sleepiness, fatigue, and vigor metrics consistently define resilience and vulnerability to sleep loss. Sleep 2021, 45, zsab228. [Google Scholar] [CrossRef] [PubMed]
  3. Gaydos, S.J.; Curry, I.P.; Bushby, A.J. Fatigue assessment: Subjective peer-to-peer fatigue scoring. Aviat. Space Environ. Med. 2013, 84, 1105–1108. [Google Scholar] [CrossRef] [PubMed]
  4. Useche, S.A.; Ortiz, V.G.; Cendales, B.E. Stress-related psychosocial factors at work, fatigue, and risky driving behavior in bus rapid transport (BRT) drivers. Accid. Anal. Prev. 2017, 104, 106–114. [Google Scholar] [CrossRef]
  5. Fan, J.; Smith, A.P. A Preliminary Review of Fatigue Among Rail Staff. Front. Psychol. 2018, 7, 634. [Google Scholar] [CrossRef]
  6. Horne, J.A.; Burley, C.V. We know when we are sleepy: Subjective versus objective measurements of moderate sleepiness in healthy adults. Biol. Psychol. 2010, 83, 266–268. [Google Scholar] [CrossRef]
  7. Fatourechi, M.; Bashashati, A.; Ward, R.K.; Birch, G.E. EMG and EOG artifacts in brain computer interface systems: A survey. Clin. Neurophysiol. 2007, 118, 480–494. [Google Scholar] [CrossRef]
  8. Luo, H.; Qiu, T.; Liu, C.; Huang, P. Research on fatigue driving detection using forehead EEG based on adaptive multi-scale entropy. Biomed. Signal Process. Control 2019, 51, 50–58. [Google Scholar] [CrossRef]
  9. Fu, R.; Wang, H. Detection of driving fatigue by using noncontact EMG and ECG signals measurement system. Int. J. Neural Syst. 2014, 24, 1450006. [Google Scholar] [CrossRef]
  10. Yan, C.; Zhang, B.; Coenen, F. Driving posture recognition by convolutional neural networks. In Proceedings of the International Conference on Natural Computation, Manchester, UK, 11–15 July 2016; IEEE: Piscataway, NJ, USA, 2016; pp. 680–685. [Google Scholar]
  11. Allam, J.P.; Samantray, S.; Behara, C.; Kurkute, K.K.; Sinha, V.K. Customized deep-learning algorithm for drowsiness detection using single-channel EEG signal—ScienceDirect. In Artificial Intelligence-Based Brain-Computer Interface; Elsevier: Amsterdam, The Netherlands, 2022; Volume 1, pp. 189–201. [Google Scholar]
  12. Zhou, X.; Yao, D.; Zhu, M.; Zhang, X.; Qi, L.; Pan, H.; Zhu, X.; Wang, Y.; Zhang, Z. Vigilance detection method for high-speed rail using wireless wearable EEG collection technology based on low-rank matrix decomposition. IET Intell. Transp. Syst. 2018, 12, 819–825. [Google Scholar] [CrossRef]
  13. Xiao, Z.; Hu, Z.; Geng, L.; Zhang, F.; Wu, J.; Li, Y. Fatigue driving recognition network: Fatigue driving recognition via convolutional neural network and long short-term memory units. IET Intell. Transp. Syst. 2019, 13, 1410–1416. [Google Scholar] [CrossRef]
  14. Amira, B.G.; Zoulikha, M.M.; Hector, P. Driver drowsiness detection and tracking based on yolo with haar cascades and ERNN. IJSSE 2021, 11, 35–42. [Google Scholar] [CrossRef]
  15. Xu, L.; Ren, X.; Chen, R. Detection to fatigue driving based on eye state recognition. Sci. Technol. Eng. 2020, 20, 8292–8299. [Google Scholar]
  16. Feng, Z. Research on Driver Fatigue Detection Technology Based on Multi-Feature Fusion. Master’s Thesis, Yangzhou University, Yangzhou, China, 2022. [Google Scholar]
  17. Peng, W. A detection algorithm for the fatigue of ship officers based on deep learning technique. J. Transp. Inf. Saf. 2022, 40, 63–71. [Google Scholar]
  18. Hu, F.; Cheng, Z.; Xu, Q.; Peng, Q.; Quan, X. Research on Fatigue Driving State Recognition Method Based on Multi-feature Fusion. J. Hunan Univ. Nat. Sci. 2022, 49, 100–107. [Google Scholar]
  19. Yuan, Z.Z. Research on Locomotive Drivers’ Fatigue State Detection Based on Upper Body Postures. Master’s Thesis, Beijing Jiaotong University, Beijing, China, 2021. [Google Scholar]
  20. Guo, C.; Pleiss, G.; Sun, Y.; Weinberger, K.Q. On Calibration of Modern Neural Networks. In Proceedings of the International Conference on Machine Learning, Sydney, Australia, 6–11 August 2017. [Google Scholar]
  21. Datta, A.; Swamidass, S.J. Fair-Net: A Network Architecture For Reducing Performance Disparity between Identifiable Sub-Populations. arXiv 2021, arXiv:2106.00720. [Google Scholar]
  22. Buolamwini, J.; Gebru, T. Gender shades: Intersectional accuracy disparities in commercial gender classification. In Proceedings of the Conference on Fairness, Accountability and Transparency, New York, NY, USA, 23–24 February 2018; pp. 77–91. [Google Scholar]
  23. Li, Q. Research on Train Driver’s Fatigue Detection Based on PERCLOS. Master’s Thesis, Beijing Jiaotong University, Beijing, China, 2014. [Google Scholar]
  24. Zhu, M.L. Research on fatique detection method based on facial feature points. Appl. Res. Comput. 2020, 37, 305–307. [Google Scholar]
  25. Zou, Q.Y. Research on Fatigue-Detection Method Based on Multi Feature Fusion. Master’s Thesis, Nanjing University of Information Science and Technology, Nanjing, China, 2022. [Google Scholar]
  26. Chen, Z.L. Design and Implementation of Fatigue Driving Detection System Based on Facial Features. Master’s Thesis, Xi’an Technological University, Xi’an, China, 2022. [Google Scholar]
  27. Deng, J.; Guo, J.; Zhou, Y.; Yu, J.; Kotsia, I.; Zafeiriou, S. Retinaface: Single-stage dense face localisation in the wild. In Proceedings of the 2020 IEEE/CVF Conference on Computer Vision and Pattern Recognition (CVPR), Seattle, WA, USA, 14–19 June 2020; pp. 5202–5211. [Google Scholar]
  28. Sun, K.; Xiao, B.; Liu, D.; Wang, J. Deep high-resolution representation learning for human pose estimation. In Proceedings of the 2019 IEEE/CVF Conference on Computer Vision and Pattern Recognition (CVPR), Long Beach, CA, USA, 15–20 June 2019; pp. 5686–5696. [Google Scholar]
  29. Zhuang, F.; Qi, Z.; Duan, K.; Xi, D.; Zhu, Y.; Zhu, H.; Xiong, H.; He, Q. Survey on transfer learning research. J. Softw. 2015, 26, 14. [Google Scholar]
  30. Zhang, Y.M. Research on Face Recognition Algorithm Based on Hog and Gabor Features. Master’s Thesis, Harbin University of Science and Technology, Harbin, China, 2019. [Google Scholar]
  31. Lv, X.; Liu, X.; Bai, Y. Research on driving fatigue detection based on SSD muti-factor fusion. Electron. Meas. Technol. 2022, 45, 138–143. [Google Scholar]
  32. Li, D.; Peng, Y.G. Eye fatigue diagnosis method based on feature fusion by HSV and LBP. Process Autom. Instrum. 2016, 37, 77–82. [Google Scholar]
  33. Xin, P. Research on Face Recognition Algorithm Based on Cascaded Regression and LBP. Master’s Thesis, Nanjing University of Posts and Telecommunications, Nanjing, China, 2016. [Google Scholar]
  34. Wang, J.J. Real-time detection for eye closure feature of fatigue driving based on CNN and SVM. Comput. Syst. Appl. 2021, 30, 118–126. [Google Scholar]
  35. Song, J. A real-time detection method of human eye opening and closing state based on HOG and SVM. J. Mudanjiang Norm. Univ. Nat. Sci. Ed. 2022, 4, 36–40. [Google Scholar]
  36. Liu, J. Driver fatigue-state detection and reminder system based on eye movementand mouth tracking. Qinghai Sci. Technol. 2022, 29, 203–208. [Google Scholar]
  37. Alioua, N.; Alioua, N.; Alioua, N. Driver’s Fatigue Detection Based on Yawning Extraction. Int. J. Veh. Technol. 2014, 3, 47–75. [Google Scholar]
  38. Li, H. Research on Fatigue Detection Algorithm Based on Deep Learning with Multi-Feature Fusion. Master’s Thesis, Hu Nan University, Changsha, China, 2020. [Google Scholar]
  39. Zhang, J. Research on Evaluation Methods of Driving Risk in Different Driver Fatigued States. Master’s Thesis, ChongQing University, Chongqing, China, 2021. [Google Scholar]
  40. Jimenez-Pinto, J.; Torres-Torriti, M. Driver alert state and fatigue detection by salient points analysis. In Proceedings of the 2009 IEEE International Conference on Systems, Man and Cybernetics, Chengdu, China, 11–14 October 2009; pp. 455–461. [Google Scholar]
  41. Zontone, P.; Affanni, A.; Bernardini, R.; Piras, A.; Rinaldo, R.; Formaggia, F.; Minen, D.; Minen, M.; Savorgnan, C. Car driver’s sympathetic reaction detection through electrodermal Activity (EDA) and electrocardiogram (ECG) measurements. IEEE Trans. Biomed. Eng. 2020, 67, 3413–3424. [Google Scholar] [CrossRef] [PubMed]
Figure 1. Yawning (covering the mouth).
Electronics 12 02303 g001
Figure 2. Algorithm flow chart of multi-feature fusion fatigue detection method.
Electronics 12 02303 g002
Figure 3. Face key point detection based on RetinaFace.
Electronics 12 02303 g003
Figure 4. RetinaFace network structure designed in this paper.
Electronics 12 02303 g004
Figure 5. Eye selection method.
Electronics 12 02303 g005
Figure 6. HOG characteristic diagram visualization diagram.
Electronics 12 02303 g006
Figure 7. Key points of the mouth when yawning.
Electronics 12 02303 g007
Figure 8. MAR Change Chart.
Electronics 12 02303 g008
Figure 9. Overall flow chart of Bi LSTM-SVM adaptive enhancement algorithm.
Electronics 12 02303 g009
Figure 10. Human body key point recognition.
Electronics 12 02303 g010
Figure 11. Training history figure.
Electronics 12 02303 g011
Figure 12. Confusion matrix.
Electronics 12 02303 g012
Table 1. Abbreviations Table.
AbbreviationsFull Spelling
KSSKarolinska sleepiness scale
MEQMorning-type and evening-type questionnaire
POMS-FMood fatigue scale
POMS-VVitality scale
EEGElectro-encephalogram
EOGElectro-oculogram
ECGElectro-cardiogram
QRS WAVESCombination of Q waves, R waves, and S waves
MLPMulti-layer perceptron
PERCLOSPercentage of eyelid closure over the pupil over time
LBPLocal binary pattern
PSO-SVMParticle swarm optimization–support vector machine
HOGHistogram of oriented gradient
LSTMLong short-term memory
FPNFeature pyramid network
EAREye aspect ratio
MARMouth aspect ratio
SSMSingle-stage multi-task
SSHSingle-stage headless face detector
HRNetHigh-resolution network
NMENormalized mean error
DBNDeep Belief Networks
CNNConvolutional neural network
Table 2. Limb angle feature.
No.Angular Feature
1The angle between the line connecting the midpoint of the nose and the shoulder and the line connecting the right and left shoulders
2The angle between the right shoulder–elbow line and the right wrist–leg root line
3The angle between the right shoulder–elbow line and the right wrist–elbow line
4The angle between the left wrist–elbow line and the left elbow–shoulder line
5The angle between the left wrist–elbow line and the left elbow–shoulder line
6Angle between the line connecting the root of the right leg and the right shoulder and that connecting the root of the right leg and the right knee
7Angle between the line from the base of the left leg to the left shoulder and that from the base of the left leg to the left knee
Table 3. Proportional characteristics of key points’ relative location.
No.Position Scale and Distance Features
1Nose–shoulder midpoint distance/shoulder midpoint–thigh root midpoint distance
2Nose–elbow midpoint distance / shoulder midpoint–thigh root midpoint
3Nose–wrist midpoint distance/shoulder midpoint–thigh root midpoint
4Distance between nose–thigh root midpoint/shoulder midpoint–thigh root midpoint
5Distance between the midpoint of the right elbow and the base of the thigh
6Distance between the midpoint of the right wrist and the base of the thigh
7Distance between left elbow and thte midpoint of the thigh base
8The distance between the midpoint of the left wrist and the base of the thigh
9Distance between right wrist and nose
10Distance between left wrist and nose
Table 4. Dataset Description Table.
VolunteerAgeGender9:00–10:0015:00–16:0023:00–24:00Time (min)
A31male10102040
B37female10102040
C41male10102040
D26female10102040
E34male10102040
Total 200
Available data 192
Table 5. Training data and testing data sizes.
Fatigue StateSizeTraining DataTesting Data
Severe543618
Moderate644618
Severe745618
Table 6. KSS Sleepiness Chart.
ScoreDegree of Sleepiness
1Extremely alert
2Very alert
3Vigilance
4A little alert
5Neither alert nor drowsy
6Has some signs of drowsiness
7Drowsiness, but can stay awake
8Drowsiness, requiring effort to stay awake
9Very lethargic, requiring great effort to stay awake, struggling to stay awake
10Extreme drowsiness, inability to stay awake
Table 7. Dataset Sampling Table.
NumberPERCLOS f-ValueBlink FrequencyYawn FrequencyBowed Head/AsleepAsleep on a TableFatigued State
10.00930000
20.073200000
30.340184001
40.354200001
50.5312720002
60.7282013002
70.890205003
80.300212013
90.800104203
Table 8. Model evaluation results on self-built dataset.
Fatigue StateAccuracyPrecisionRecallF1-Score
Mild-to-no fatigue10.910.95
Moderate fatigue0.8910.890.94
Severe fatigue1111
Overall status (weighting algorithm)0.960.970.960.96
Table 9. Comparison of results of different methods on self-built dataset.
MethodPrecision (%)Remark
PERCLOS method only88.89Disadvantages: Unable to recognize facial occlusion actions such as hand occlusion, yawning, lying on the table, etc.
Facial features only (PERCLOS/Yawn)92.59Disadvantages: Unable to recognize facial occlusion actions such as hand occlusion, yawning, lying on the table, etc.
Multi-feature fusion method (facial features + behavioral features)1Fatigue can be identified using both facial features and body movements
Table 10. Evaluation index results of different models on self-built dataset.
Cited PaperMethodPrecision (%)
[13]Multi-character90.74
[15]Multi-character92.59
OursMulti-character96.30
The methods in the cited papers were reimplemented on our own dataset.
Table 11. Different model evaluation results on self-built dataset.
AlgorithmAccuracy
BP0.64
SVM0.82
LSTM0.88
Bi-LSTM-SVM adaptive enhancement algorithm0.96
Table 12. NME comparison on 300 W dataset.
MethodCommon SubsetChalleng SubsetFull Subset
With LBFs4.9511.986.32
Without Gabor3.225.803.73
With Gabor3.195.173.58
Table 13. NME comparison on 300 W dataset.
MethodCommon SubsetChallenge SubsetFull Subset
CPMs (SBR)3.287.584.10
Multi-feature fusion method (facial key points)3.195.173.58
Table 14. Model size and prediction speed on self-built datasets.
MethodModel Size (M)Prediction Speed (ms)
Multi-feature fusion method (facial key points)1.84100
Table 15. Evaluation index results of different models on self-built datasets.
MethodsAccuracy
LSTM0.78
Bi-LSTM0.89
Bi-LSTM-SVM0.93
Adaboost-Bi-LSTM-SVM0.96
Table 16. Evaluation index results of different models on self-built datasets.
AlgorithmAccuracyPrecisionRecallF1-Score
BP0.710.650.710.66
SVM0.780.830.770.76
LSTM0.840.890.840.82
Bi-LSTM-SVM adaptive enhancement algorithm0.960.970.960.96
Disclaimer/Publisher’s Note: The statements, opinions and data contained in all publications are solely those of the individual author(s) and contributor(s) and not of MDPI and/or the editor(s). MDPI and/or the editor(s) disclaim responsibility for any injury to people or property resulting from any ideas, methods, instructions or products referred to in the content.

