Article

Development and Testing of a Miniaturized Platform for Photoplethysmography

Department of Engineering and Applied Sciences, University of Bergamo, 24044 Dalmine, Italy
*
Author to whom correspondence should be addressed.
Electronics 2023, 12(10), 2230; https://doi.org/10.3390/electronics12102230
Submission received: 27 March 2023 / Revised: 10 May 2023 / Accepted: 11 May 2023 / Published: 14 May 2023

Abstract

:
This paper presents the design and characterization of a miniaturized wearable electronic system for photoplethysmography. The system is conceived with the purpose of monitoring people during their normal duties or during physical activity. An in-depth investigation of its performance has been carried out to address the main parameters affecting signal quality. Moreover, an investigation of the best body measurement location has been assessed.

1. Introduction

Photoplethysmography (PPG) is a non-invasive technique that enables the measurement of the volumetric variations in peripheral blood vessels of the tissues [1]. In the last decades, thanks to the advancement in semiconductor technology, this technique has been increasingly used in heart-rate monitoring applications [2]. In clinical practice, PPG is commonly used to estimate blood oxygen saturation (SpO2) by means of pulse oximeters [3]. Nowadays, due to its wearing comfortability and cost-effectiveness, PPG is widely embedded in wearable devices to estimate heart rate in sports and fitness applications.
Most devices use visible light (red and green) and near-infrared light. Pulse oximetry, for example, is based on the difference in absorption between oxygenated and deoxygenated hemoglobin for two different wavelengths, red and infrared, whereas most of the smartwatches of consumer electronics detect the heart rate by means of a green light [4]. The shape of the DC and AC components differs between acquisitions at different wavelengths: longer wavelengths penetrate deeper into the tissue and collect different information with respect to shorter wavelengths.
This work presents the development of a wearable system, based on a commercial-off-the-shelf (COTS) device, the MAX86916, manufactured by Maxim Semiconductor, to be used for continuous monitoring of heart-related parameters. This device implements, together with the main wavelengths used in the literature (red, infrared, and green), blue light. The latter has already been evaluated in the past [5,6], but among all wavelengths it is less studied. The aim of this work is to characterize a brand-new commercial device that could be employed in a future wearable platform if, with respect to the available state-of-the-art commercial-off-the-shelf components, it is demonstrated that the new system is able to provide better measurements thanks to the fourth wavelength integrated, and requires less power consumption. This paper describes, in Section 2, the architecture of the system and the firmware state-machine implemented in the microcontroller which controls the PPG module, and summarizes the characterization carried out in order to assess the performance of the proposed system. In Section 3, after an initial phase devoted to the optimization of the setting parameters of the device, different body sites of a group of volunteers (eight subjects) have been characterized with the main wavelengths used in the literature. Finally, Section 5 concludes the article.

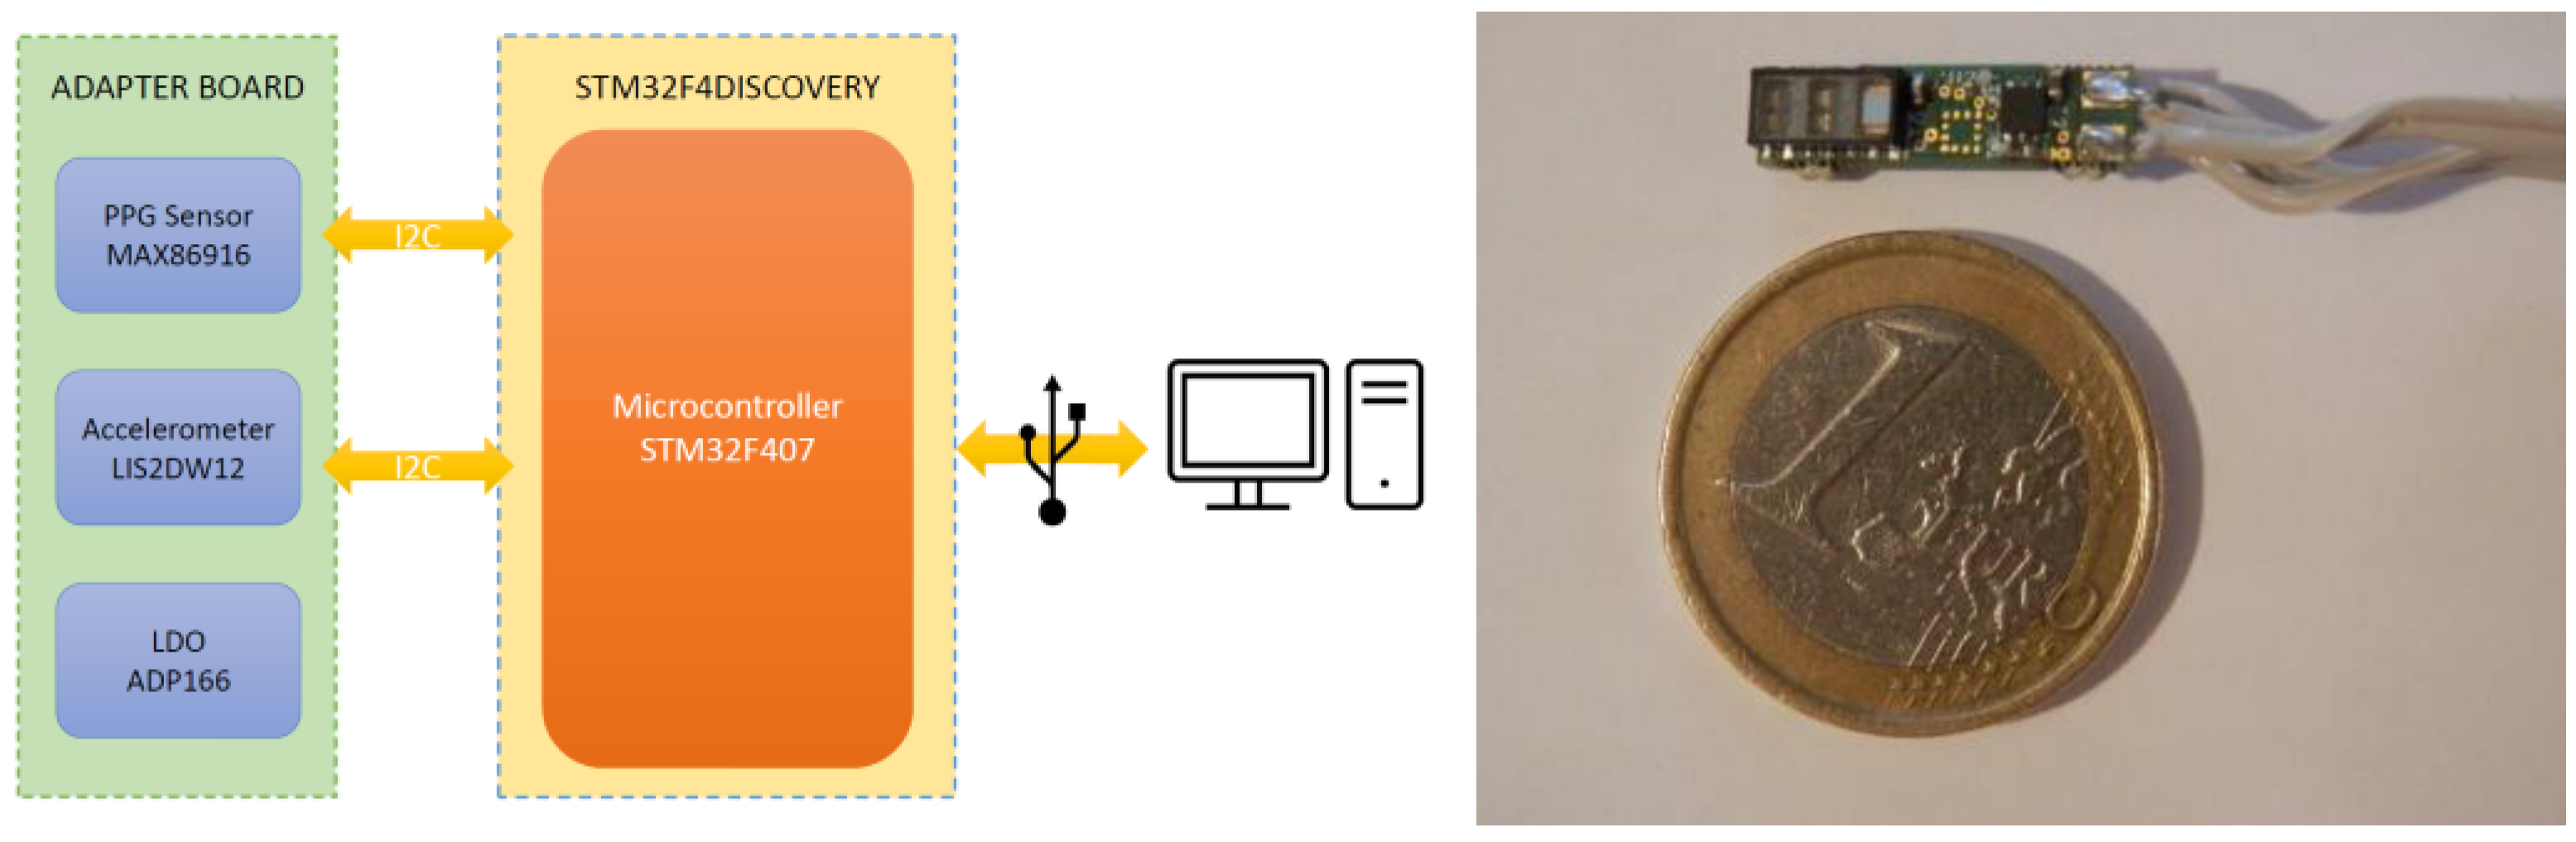
2. System Description

The block diagram of the electronic system presented in this work together with its photograph is shown in Figure 1. It is based on two systems interconnected by means of a cable providing the power supply and the serial communication signals. The main board has the purpose of controlling sensors, and acquiring and sending data to the PC by means of a USB interface. The adapter board (whose dimensions are 3.5 mm × 7 mm × 1.5 mm) integrates the PPG sensor (MAX86916), a 3D accelerometer (not mounted on this version), and a low-dropout regulator to power the digital circuitry working at 1.8 V. The ADP166 has been chosen for its low quiescent current, equal to about 890 nA with a 1 μA load [7]. The quiescent current is a characteristic of paramount importance in the design of a low-power wearable system since it is the current absorbed by the regulator (the difference between the input current and the output current) [8]. Moreover, the integrated circuit has a low shutdown current, which allows reduction of power consumption when it is disabled via the EN pin. In this version of the prototype the regulator is always active but this feature will be implemented in the next development of the board.

2.1. Hardware

As previously described, the adapter board of the system under analysis hosts the MAX86916 PPG module which allows performance of photoplethysmographic measurements thanks to the four integrated LEDs (infrared, red, green, and blue). The plethysmographic signal from the photodiode is converted by means of a 19-bit analog-to-digital converter integrated into the device. The device parameters are fully configurable through the registers, and acquisition data are stored in a FIFO inside the device which can contain up to 32 samples; in this way it is not necessary that the microcontroller, hosted on the motherboard, continuously read the data from the registers. The parameters of the MAX86916 sensor that have been regulated in the characterization work are:
  • LED supply current
  • LED pulse width
  • Integration time of the ADC
  • ADC full-scale range
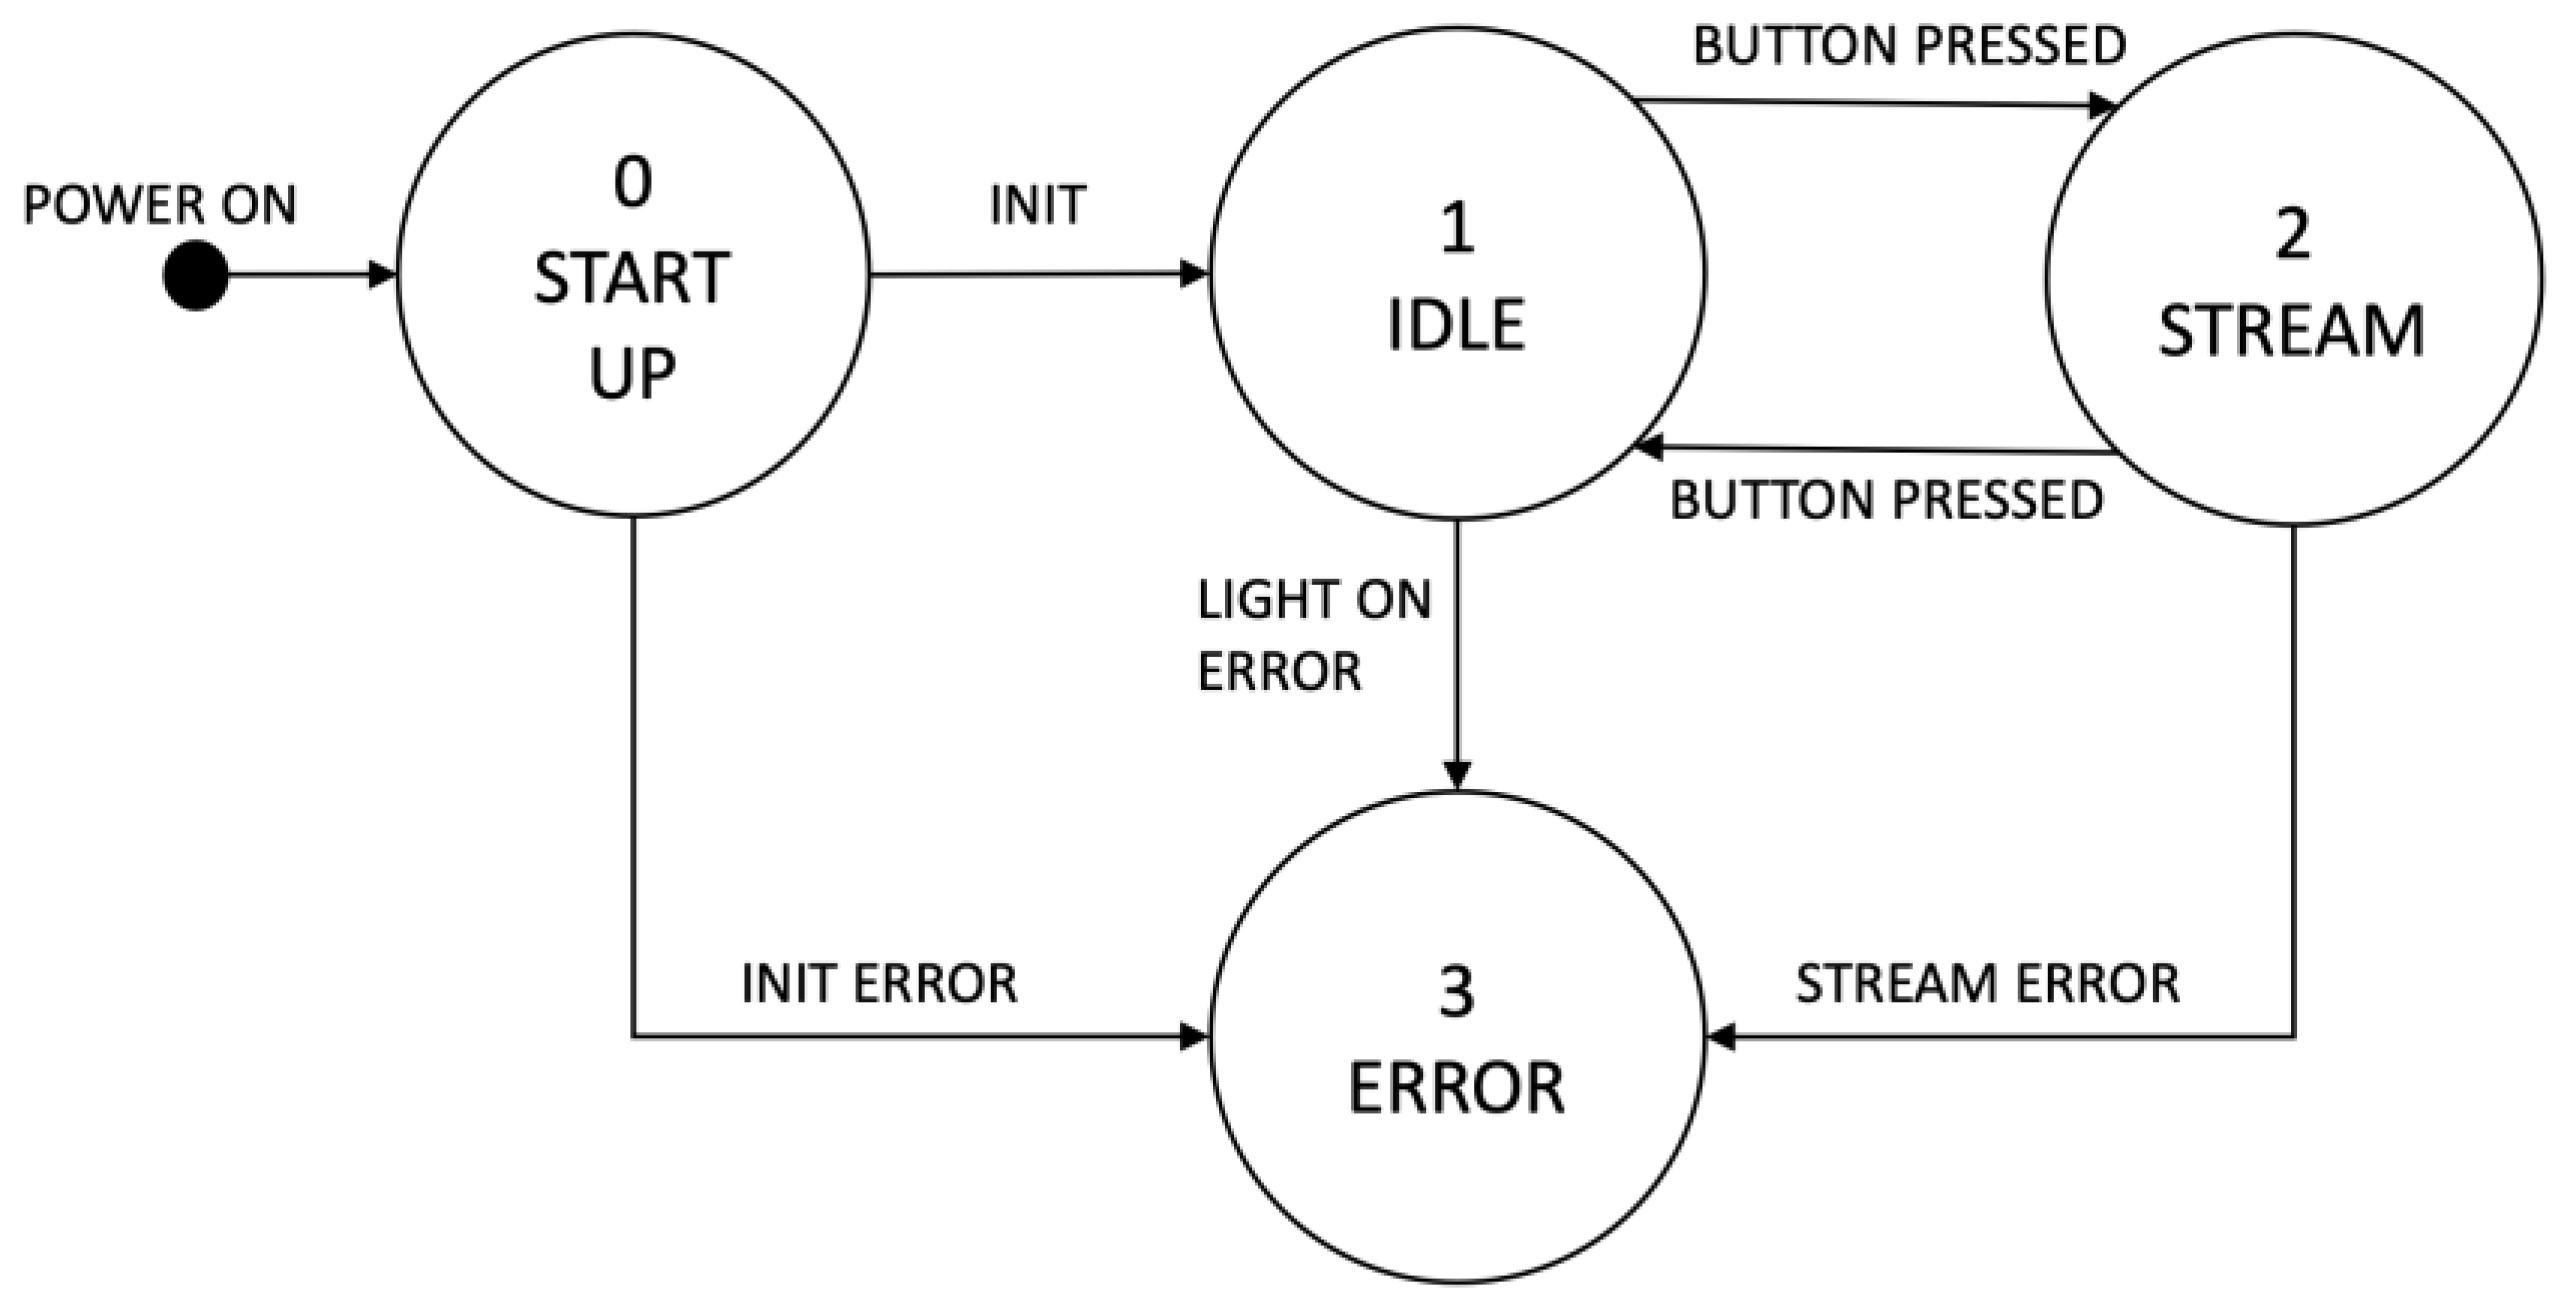
The operation of the adapter board has been controlled by the development board STM32F4DISCOVERY manufactured by STMicroelectronics. This board, by means of a STM32F407VGT6 ARM Cortex-M4 microcontroller unit (MCU), collected data from the PPG module via I2C.

2.2. Firmware

The behavior of the firmware implemented on the MCU is formalized with the finite state machine (FSM) shown in Figure 2. A finite state machine is a mathematical model through which it is possible to describe the behavior of a system with precision and in a formal way. This model consists of a finite number of states and its peculiarity lies in the fact that only one of these can be active at a given instant. The switching from one state to another takes place through transitions, which must always guarantee the uniqueness of the state. The main states for the system described in this work are:
  • Start-up: the system initialization is performed in this state. The I2C, USB peripherals and GPIO pins required for operation are configured. Subsequently, the PPG sensor on the adapter board is checked to verify communication. If an error is identified, the system moves into the Error state. At the end of the start-up, the system moves to the Idle state.
  • Idle: the system waits for the USER button to be pressed. This action generates an interrupt for the microcontroller, which turns on the PPG sensor and moves the system into the Stream state.
  • Stream: in this state, the system acquires data from the PPG sensor and transmits them to a PC connected via the USB interface. These two operations (reading and sending data) are performed periodically thanks to an interrupt which is triggered every 10 ms. Therefore, the data frequency is 100 Hz. If an error occurs in the I2C or in the USB communication, the system moves into the Error state.
  • Error: in this state all operations are disabled and the only way to recover the sensor is to reset the board.
Figure 2. Finite state machine of the developed firmware.
Electronics 12 02230 g002

3. System Characterization

3.1. Signal Quality Indexes

In order to evaluate and compare the quality of PPG signals some metrics or Signal Quality Indexes (SQIs) have been evaluated in the literature. Some of these are based on statistical characteristics of the signal, such as skewness, kurtosis, and entropy [9]. In these cases, to distinguish a reliable PPG signal from an unreliable one, it is sufficient to set a critical threshold beyond which the acquisition is not considered valid. More complex methods, however, use supervised machine learning techniques, such as K-Nearest Neighbors (K-NN) or Support Vector Machine (SVM) [10]. However, these techniques are relatively slow and cannot be used in real-time applications. Furthermore, since these are supervised algorithms, they require a particularly large dataset and an initial training phase for the classifier. Consequently, only methods based on statistical characteristics of the signal are considered for this work. Here are some of them [9]:
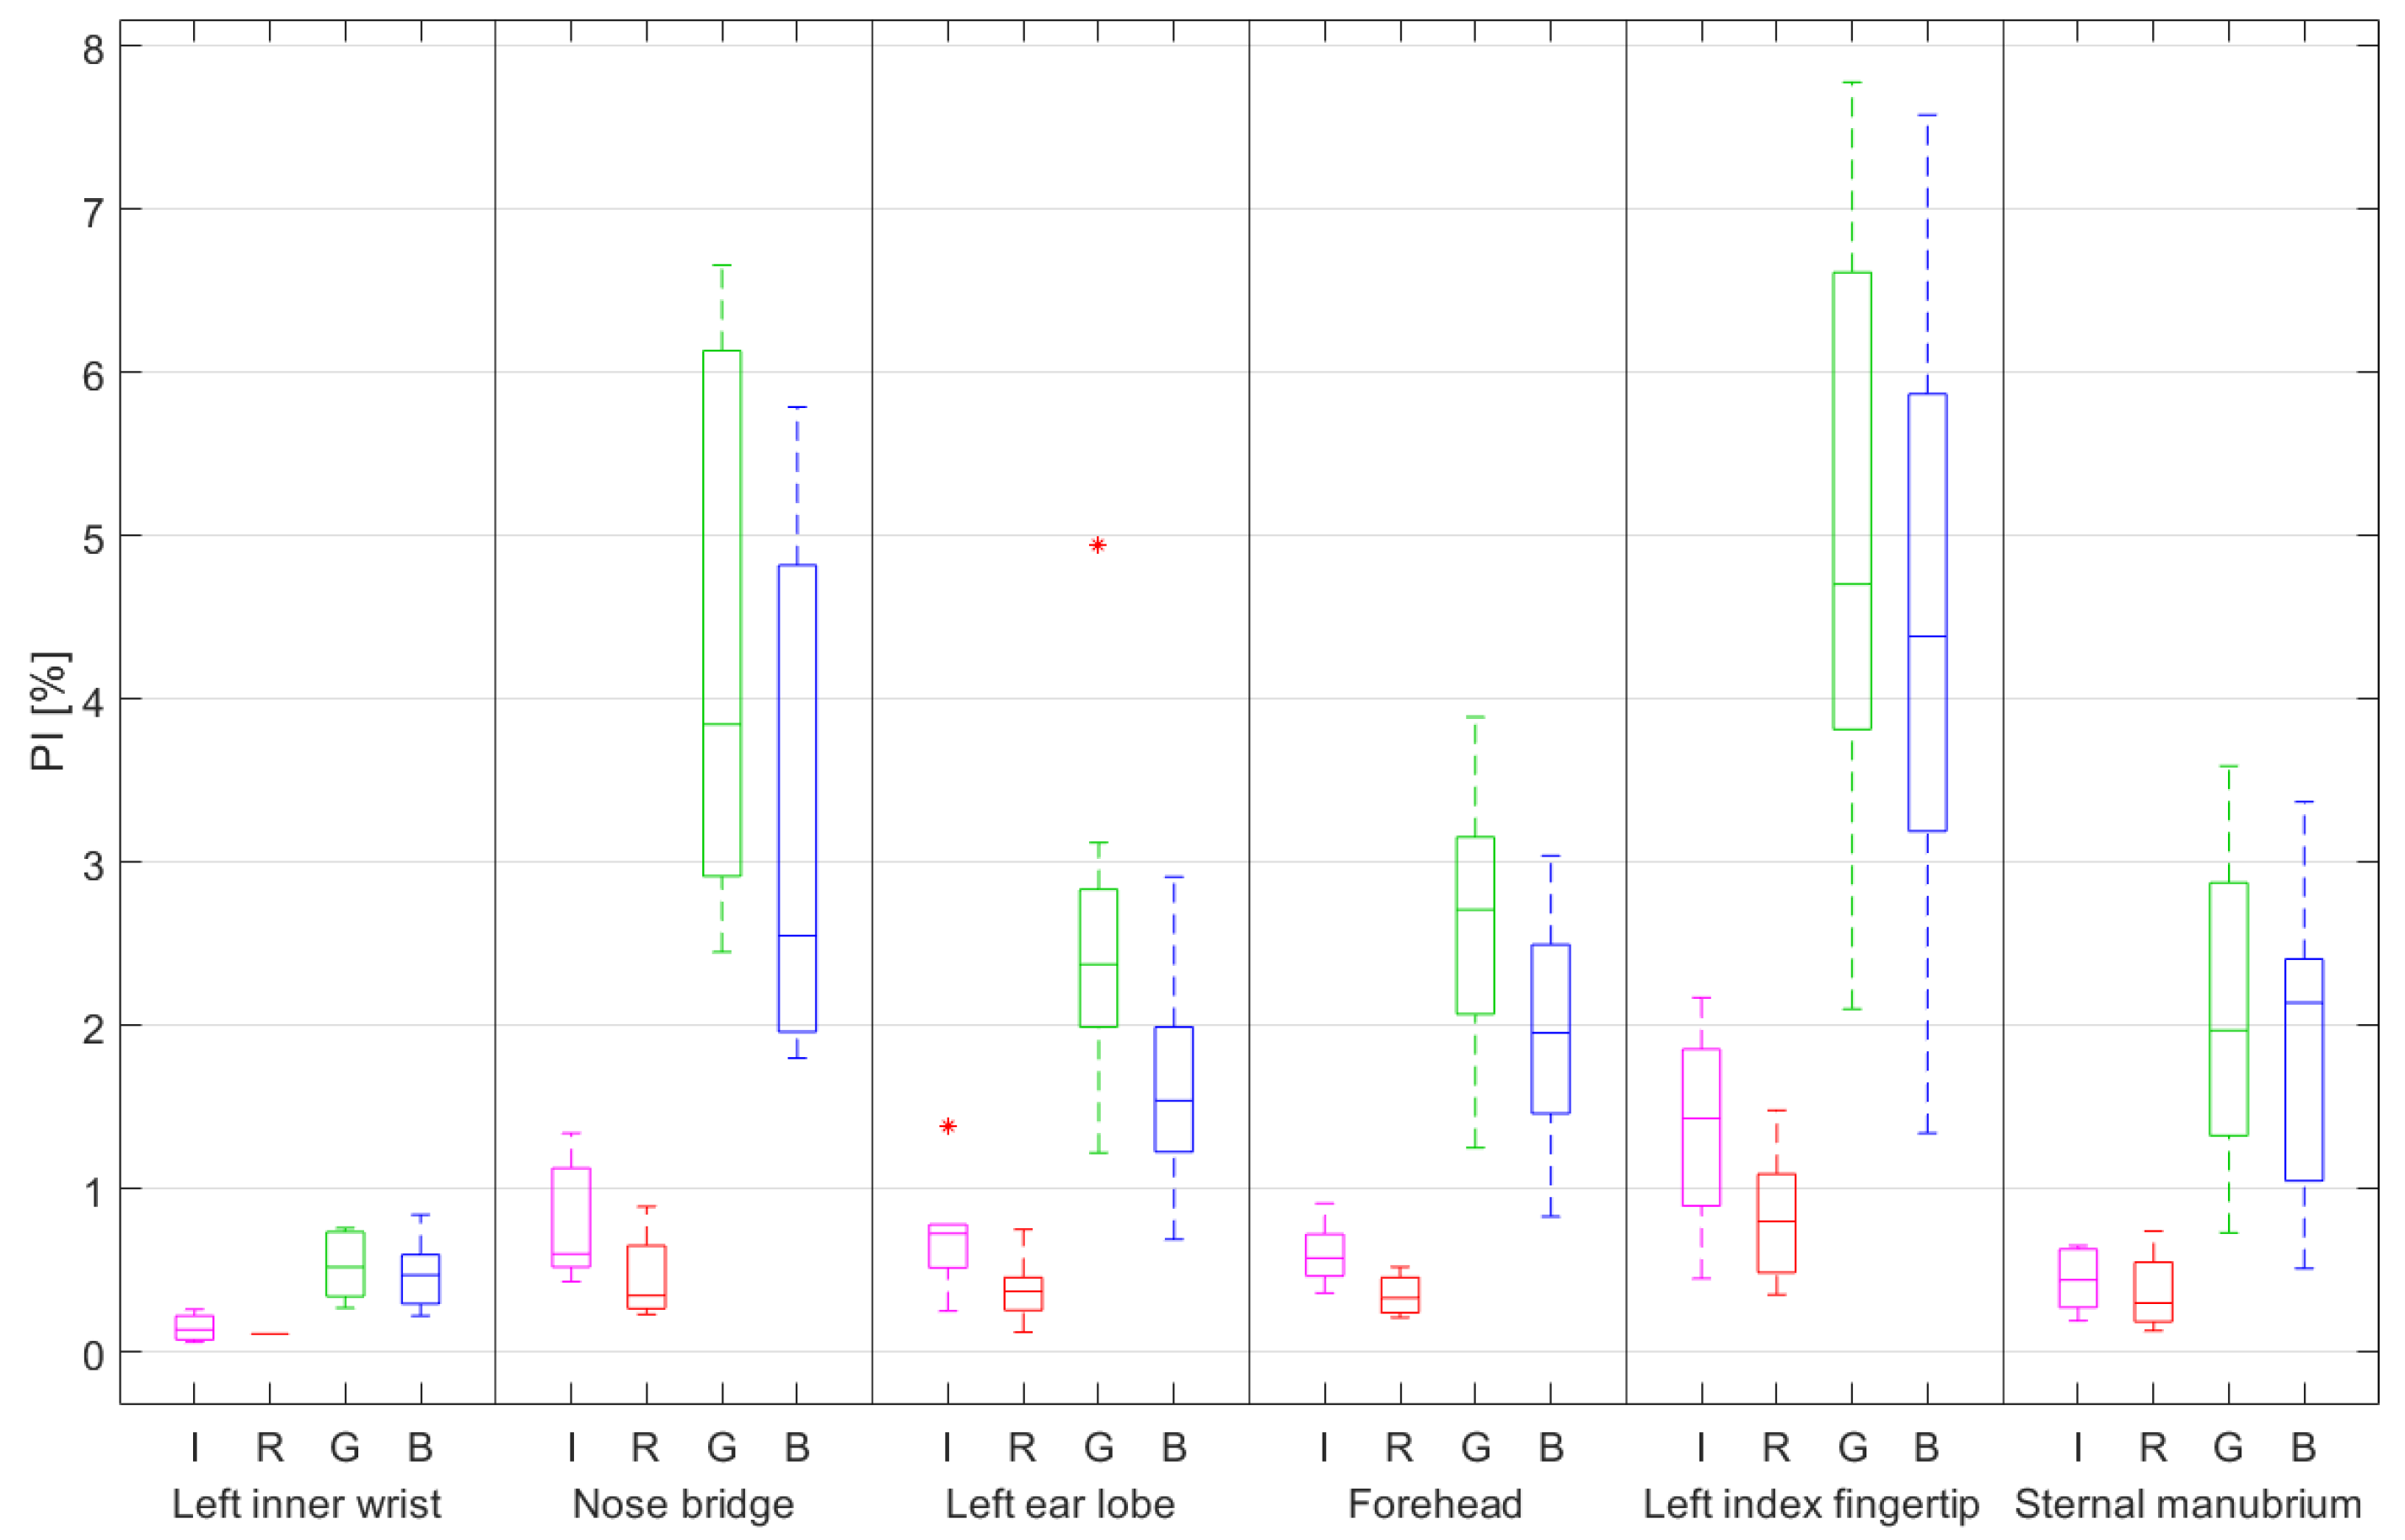
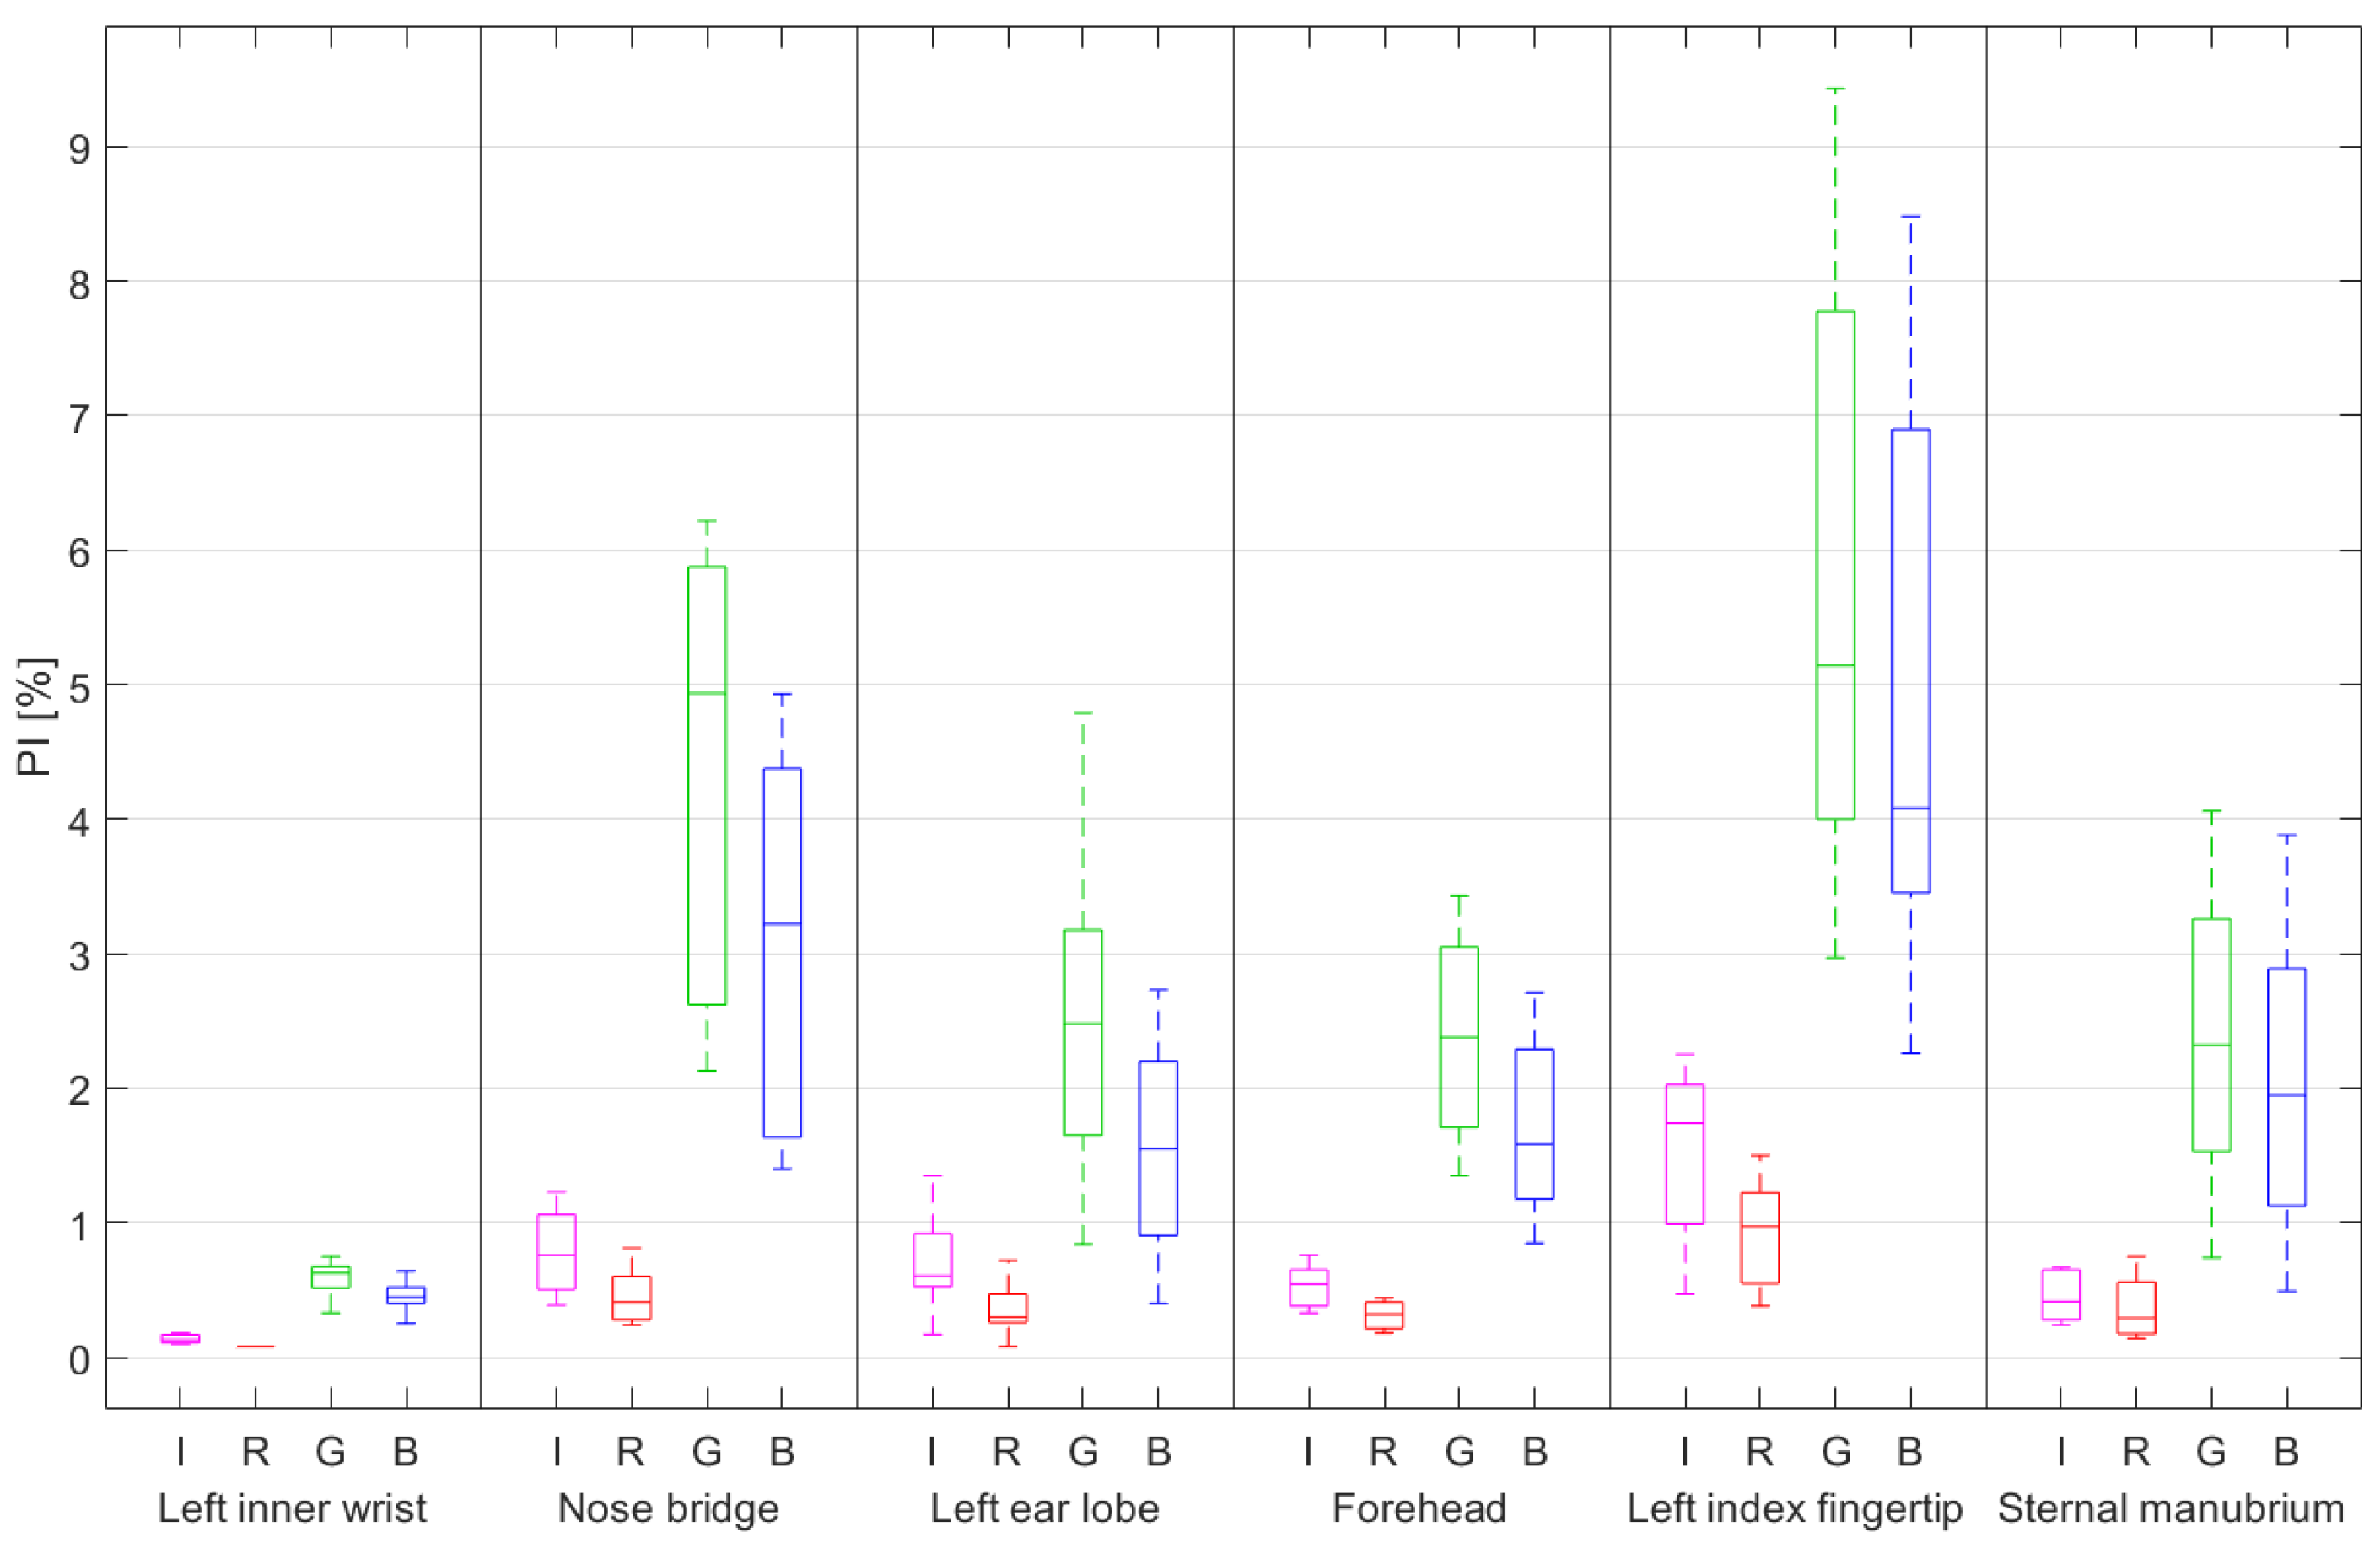
  • Perfusion Index (PI): is probably the most-used signal quality index for evaluating the quality of PPG signals. The perfusion index is the ratio of the pulsatile component of the blood to the static component. It is defined as:
P I = Amplitude   of   AC   component Level   of   DC   component 100
  • Skewness: is a statistical measure of the symmetry of a distribution density. It is defined as:
S ^ = 1 N i = 1 N x i μ x ^ 3 σ 3 ^
where μ x ^ and σ ^ are the estimates of the mean and standard deviation of x, respectively, while N is the number of samples of the PPG signal.
  • Kurtosis: is a statistical measure used to describe the distribution of observed data around the mean. It provides information about the queues of a distribution and is defined as follows:
K ^ = 1 N i = 1 N x i μ x ^ 4 σ 4 ^
  • Signal-to-Noise ratio (SNR): is a measure that compares the signal level with that of the background noise. There are different methods to define this metric. One possible definition is based on the comparison of the signal’s variance and the noise’s variance:
S N R = σ s i g n a l 2 σ n o i s e 2
where σsignal is the standard deviation of the absolute value of the filtered PPG signal while σnoise is the standard deviation of the signal when no PPG data is acquired.
  • Entropy: identifies how much the probability density of the signal differs from the uniform distribution and is defined as:
E = n = 1 N x n 2 l n x n 2
where x is the raw PPG signal and N is the number of samples.
  • Relative power: is a measurement in the frequency domain. Since most of the systolic and diastolic wave energy is concentrated in the frequency range 1–2.25 Hz, the ratio between the power spectral density (PSD) in this band and that of the entire signal (0–8 Hz) provides a measure of the quality of the acquisition. It is defined as:
R = 1 2.25 P S D 0 8 P S D
where the spectral power density is calculated using Welch’s method [11].
In this work, the perfusion index will be used as the Signal Quality Index. In order to be able to compare the acquisitions more accurately, in addition to this metric, the amplitude of the dynamic component (AC) of the signal will also be extracted.

3.2. Measurement Protocol

Although the module has an ambient light cancellation function, measurements have been carried out by covering the sensor with a black cloth, thus eliminating possible interference due to external light sources. Moreover, to avoid artifacts related to movement, the acquisitions were performed on subjects at rest with the adapter board firmly fixed. The measurement protocol is the following:
  • Fix the adapter board on the measurement site, with the subject in a stable position and at rest. For all the body locations an adhesive medical tape was used to hold the adapter board in place.
  • Turn on the PPG module, waiting at least 10 s for stabilization of the PPG signal.
  • Start recording for 60 s.
Since it is well-known that the dynamic component (AC) and the static component (DC) of the PPG signal change as a function of the pressure applied to the sensor during the measurement, the adapter board has never been removed from the measurement site for measurements with different settings of the sensor parameters. Moreover, the same operator performed all the measurements in order to apply the same pressure to the PPG sensor for all the subjects of this study.

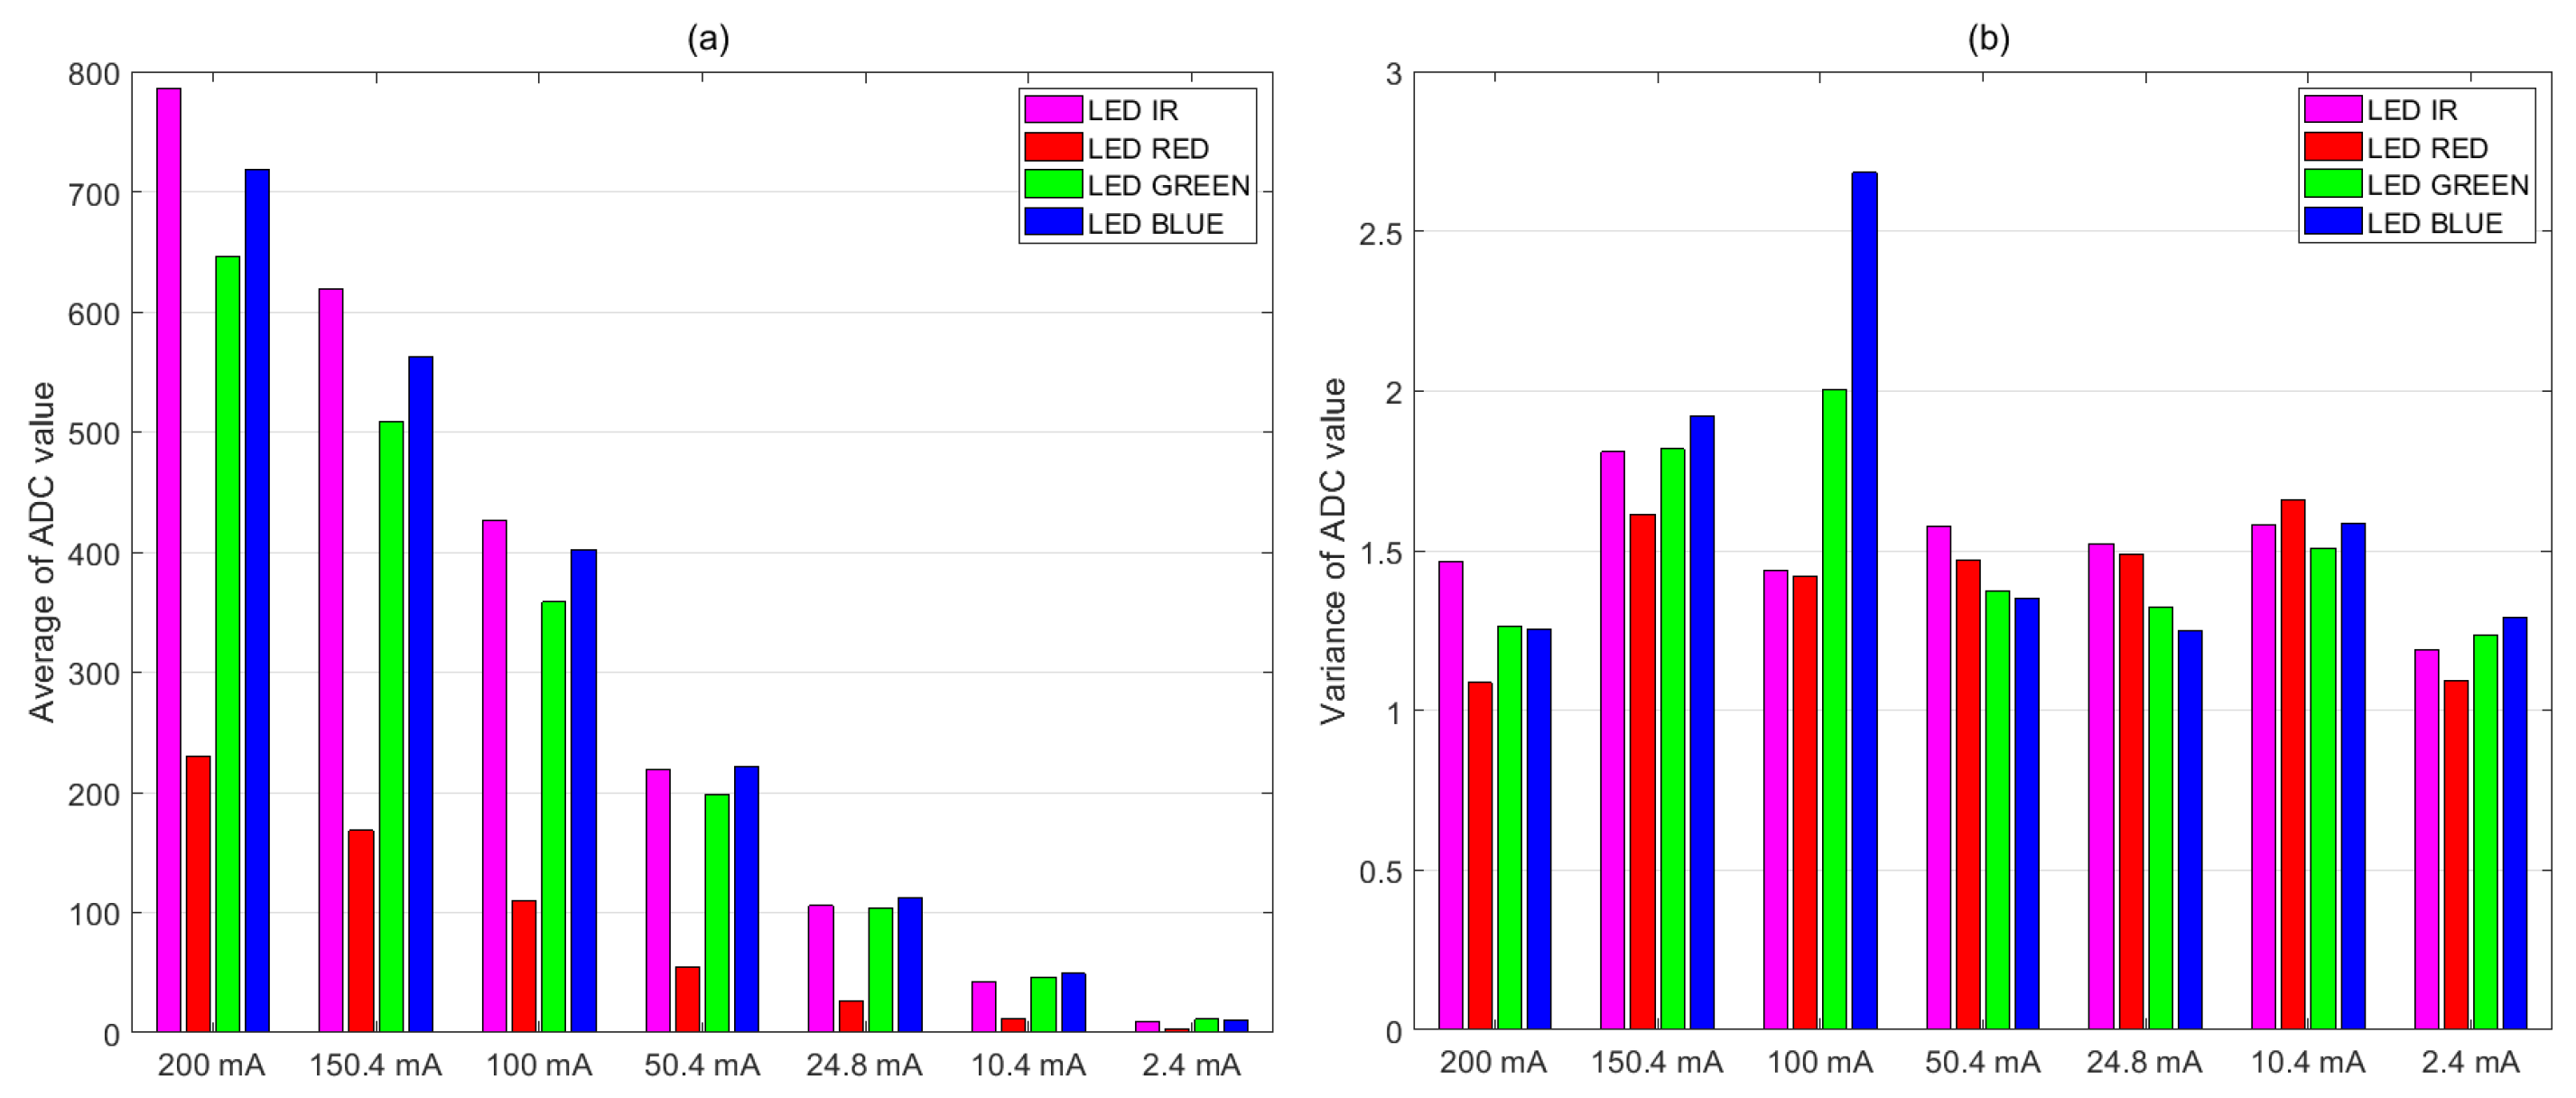
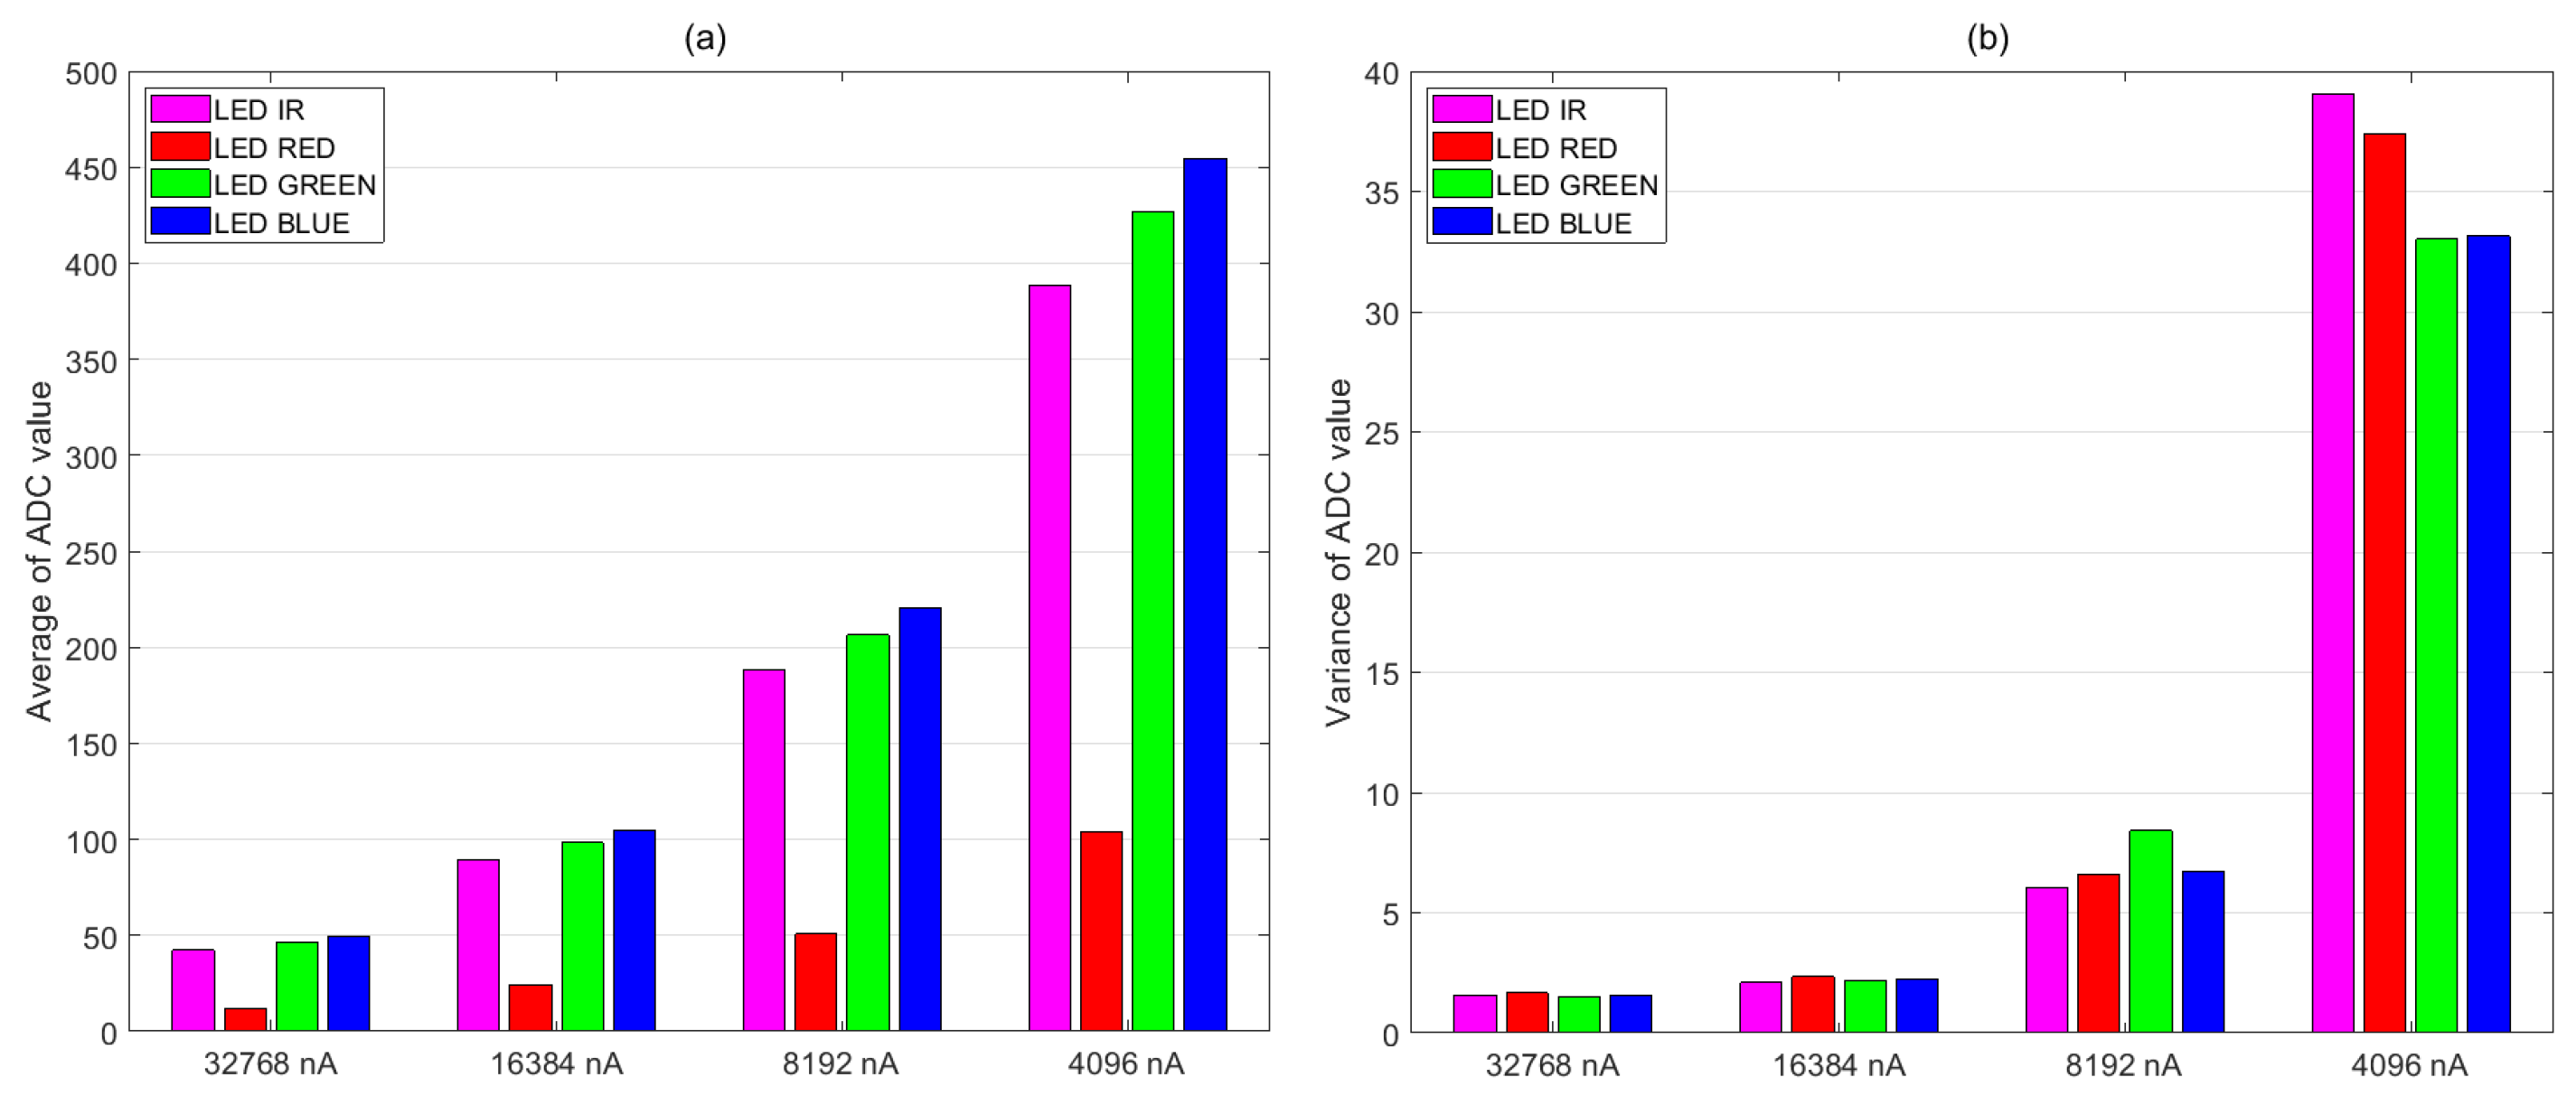
3.3. Optimization of the PPG Sensor Settings

Many parameters of the MAX86916 module are configurable by means of specific registers. The purpose of this activity carried out in the initial phase of the characterization was to find the best values that optimize the quality of photoplethysmographic measurements, and minimize the power consumption. In particular, seven different sensor configurations were considered. The module parameters that have been changed are the following:
  • Supply current of the LEDs.
  • Full-scale value of the ADC.
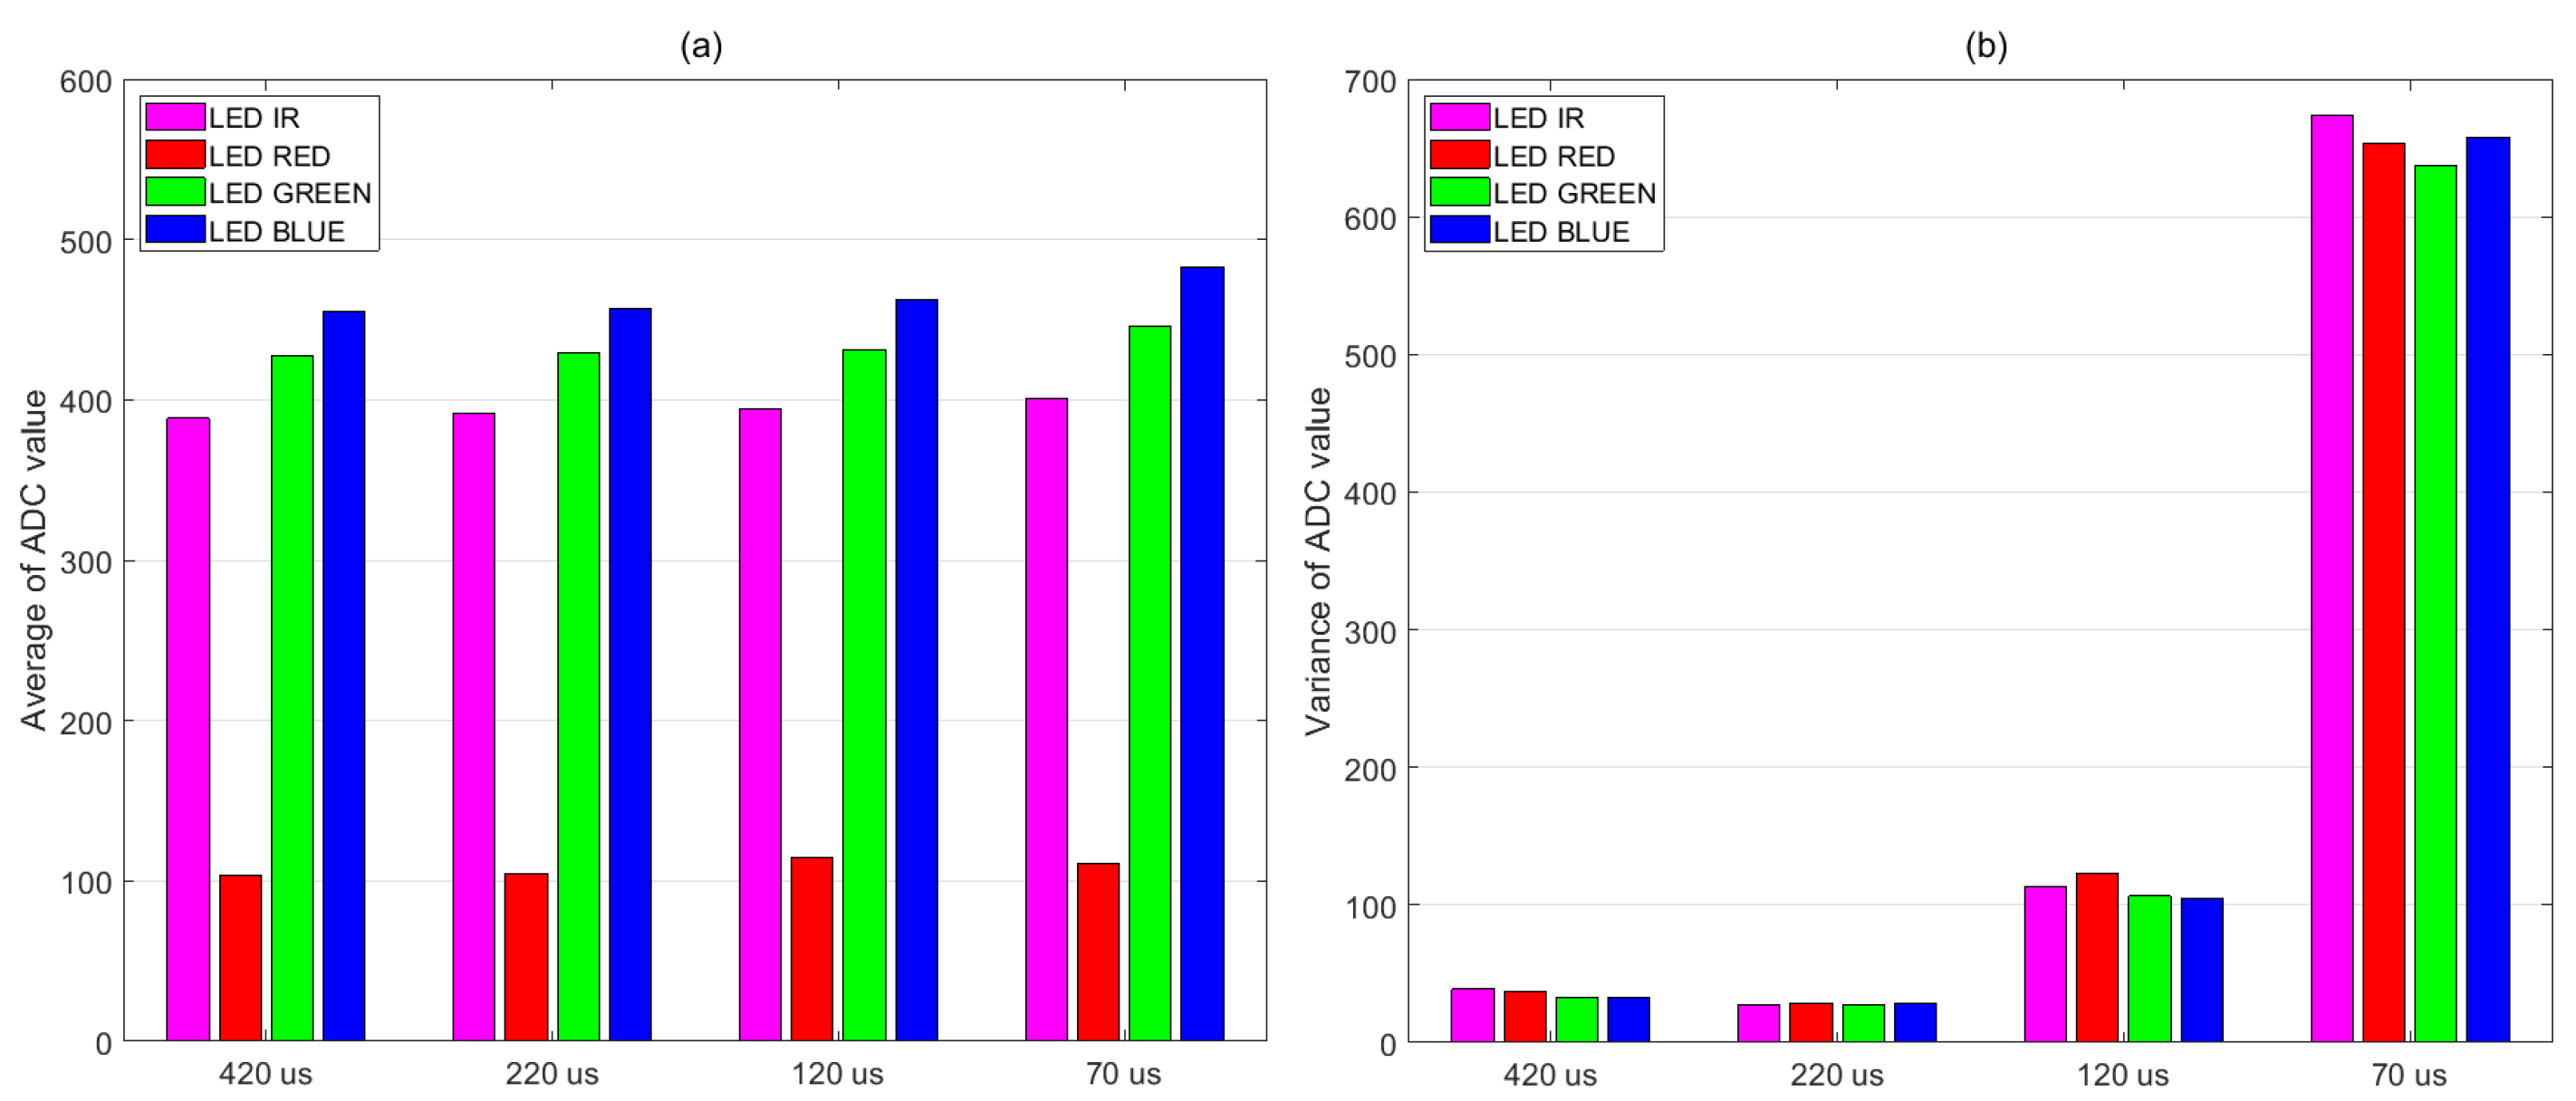
  • LED pulse width and ADC integration time.
Other settings of the sensor, such as operating mode, full-scale value of the current, and sampling frequency were kept at a constant value during all acquisitions. In particular, the FLEX mode was used which allows the sequential switching of all four LEDs on the sensor (infrared, red, green, and blue). The full scale of the current has been set to the highest possible value, which is equivalent to a maximum current of 200 mA with a step of 1 mA. The sampling frequency, on the other hand, was set at 100 Hz. All measurements were performed at rest on two subjects. Table 1 summarizes the values of the parameters used in this analysis.
Results obtained with seven different configurations showed that the AC amplitude component increases with the current but this does not always lead to an improvement in the perfusion index (due to the increase in the DC component with the supply current). In particular, it was noted that the acquisitions performed with a supply current between about 10 mA and 2 mA produced a good perfusion index and that this value represents a good tradeoff between signal quality and reduction of power consumption.
The LED with the highest perfusion index in all measurements is green, followed by blue. Red and infrared LEDs, on the other hand, have a significantly lower perfusion index.
The decrease in the full-scale value of the ADC seems to improve the quality of the measurement. In particular, with the same current, both the AC component of the signal and the PI have a higher value. Therefore, it is advisable to use the lowest full-scale value of the ADC available where the supply current of the LEDs does not saturate the signal.
Concerning the reduction of power consumption with adequate signal quality, in the system characterization a full-scale value of the ADC equal to 8192 nA and a supply current of the LEDs between 10 mA and 2 mA will be used. The pulse length is set to 420 μs with an ADC integration time of 400 μs. Table 2 shows the summary of the chosen configuration.

3.4. Measurement Location

The MAX86916 PPG module, with settings shown in Table 2, has been used to measure photoplethysmographic signals in different body locations for a group composed of 4 male and 4 female individuals with a mean age of 40 years (standard deviation 18 years) having a type II skin tone in the Fitzpatrick scale [12]. It was decided to use two different supply current values for the LEDs, 10 mA and 2 mA, in order to find which was the most suitable in the various body locations investigated.
There are many sites that are suitable for carrying out photoplethysmographic acquisitions [13]. The following areas of the body were considered in this study:
  • Forehead
  • Left ear lobe
  • Left index fingertip
  • Left inner wrist
  • Sternal manubrium
  • Nose bridge
Two acquisitions were performed for each measurement site, respectively, with a supply current of the LEDs equal to 10 mA and 2 mA. Measurements have been performed at rest with configuration parameters shown in table II and with the measurement protocol described in Section 3.2.

4. Discussion of the Measurement Results

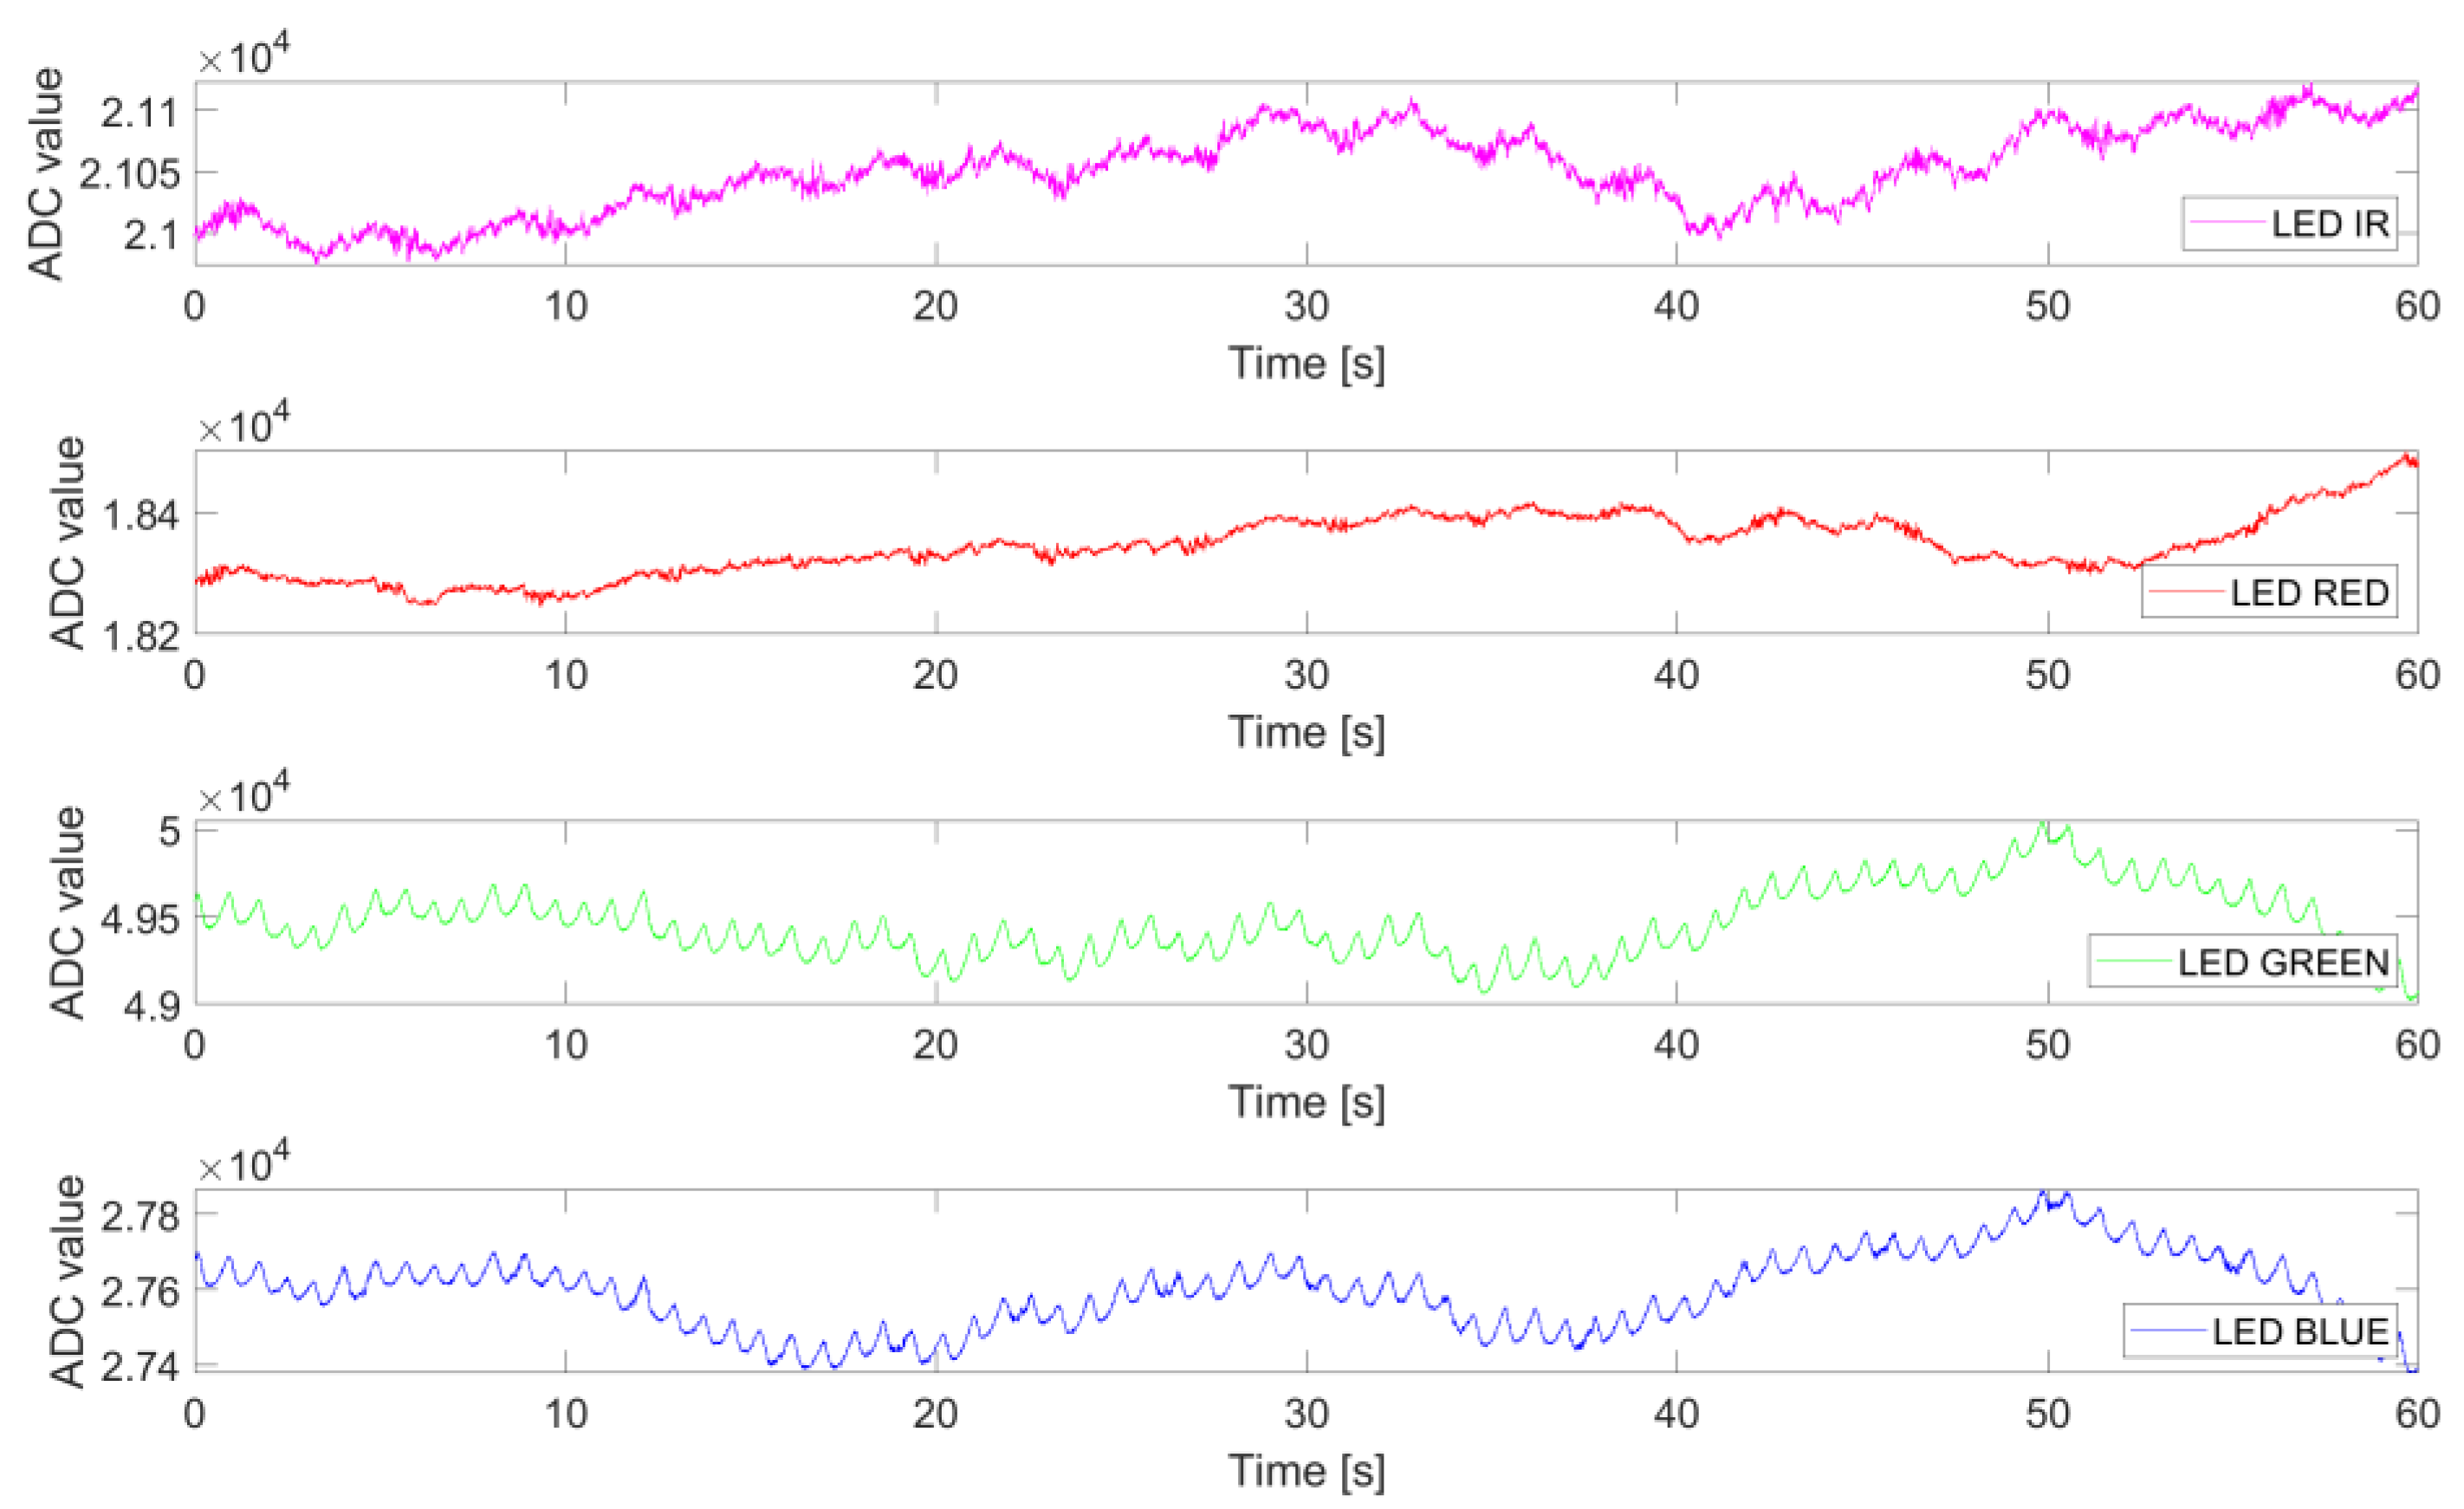
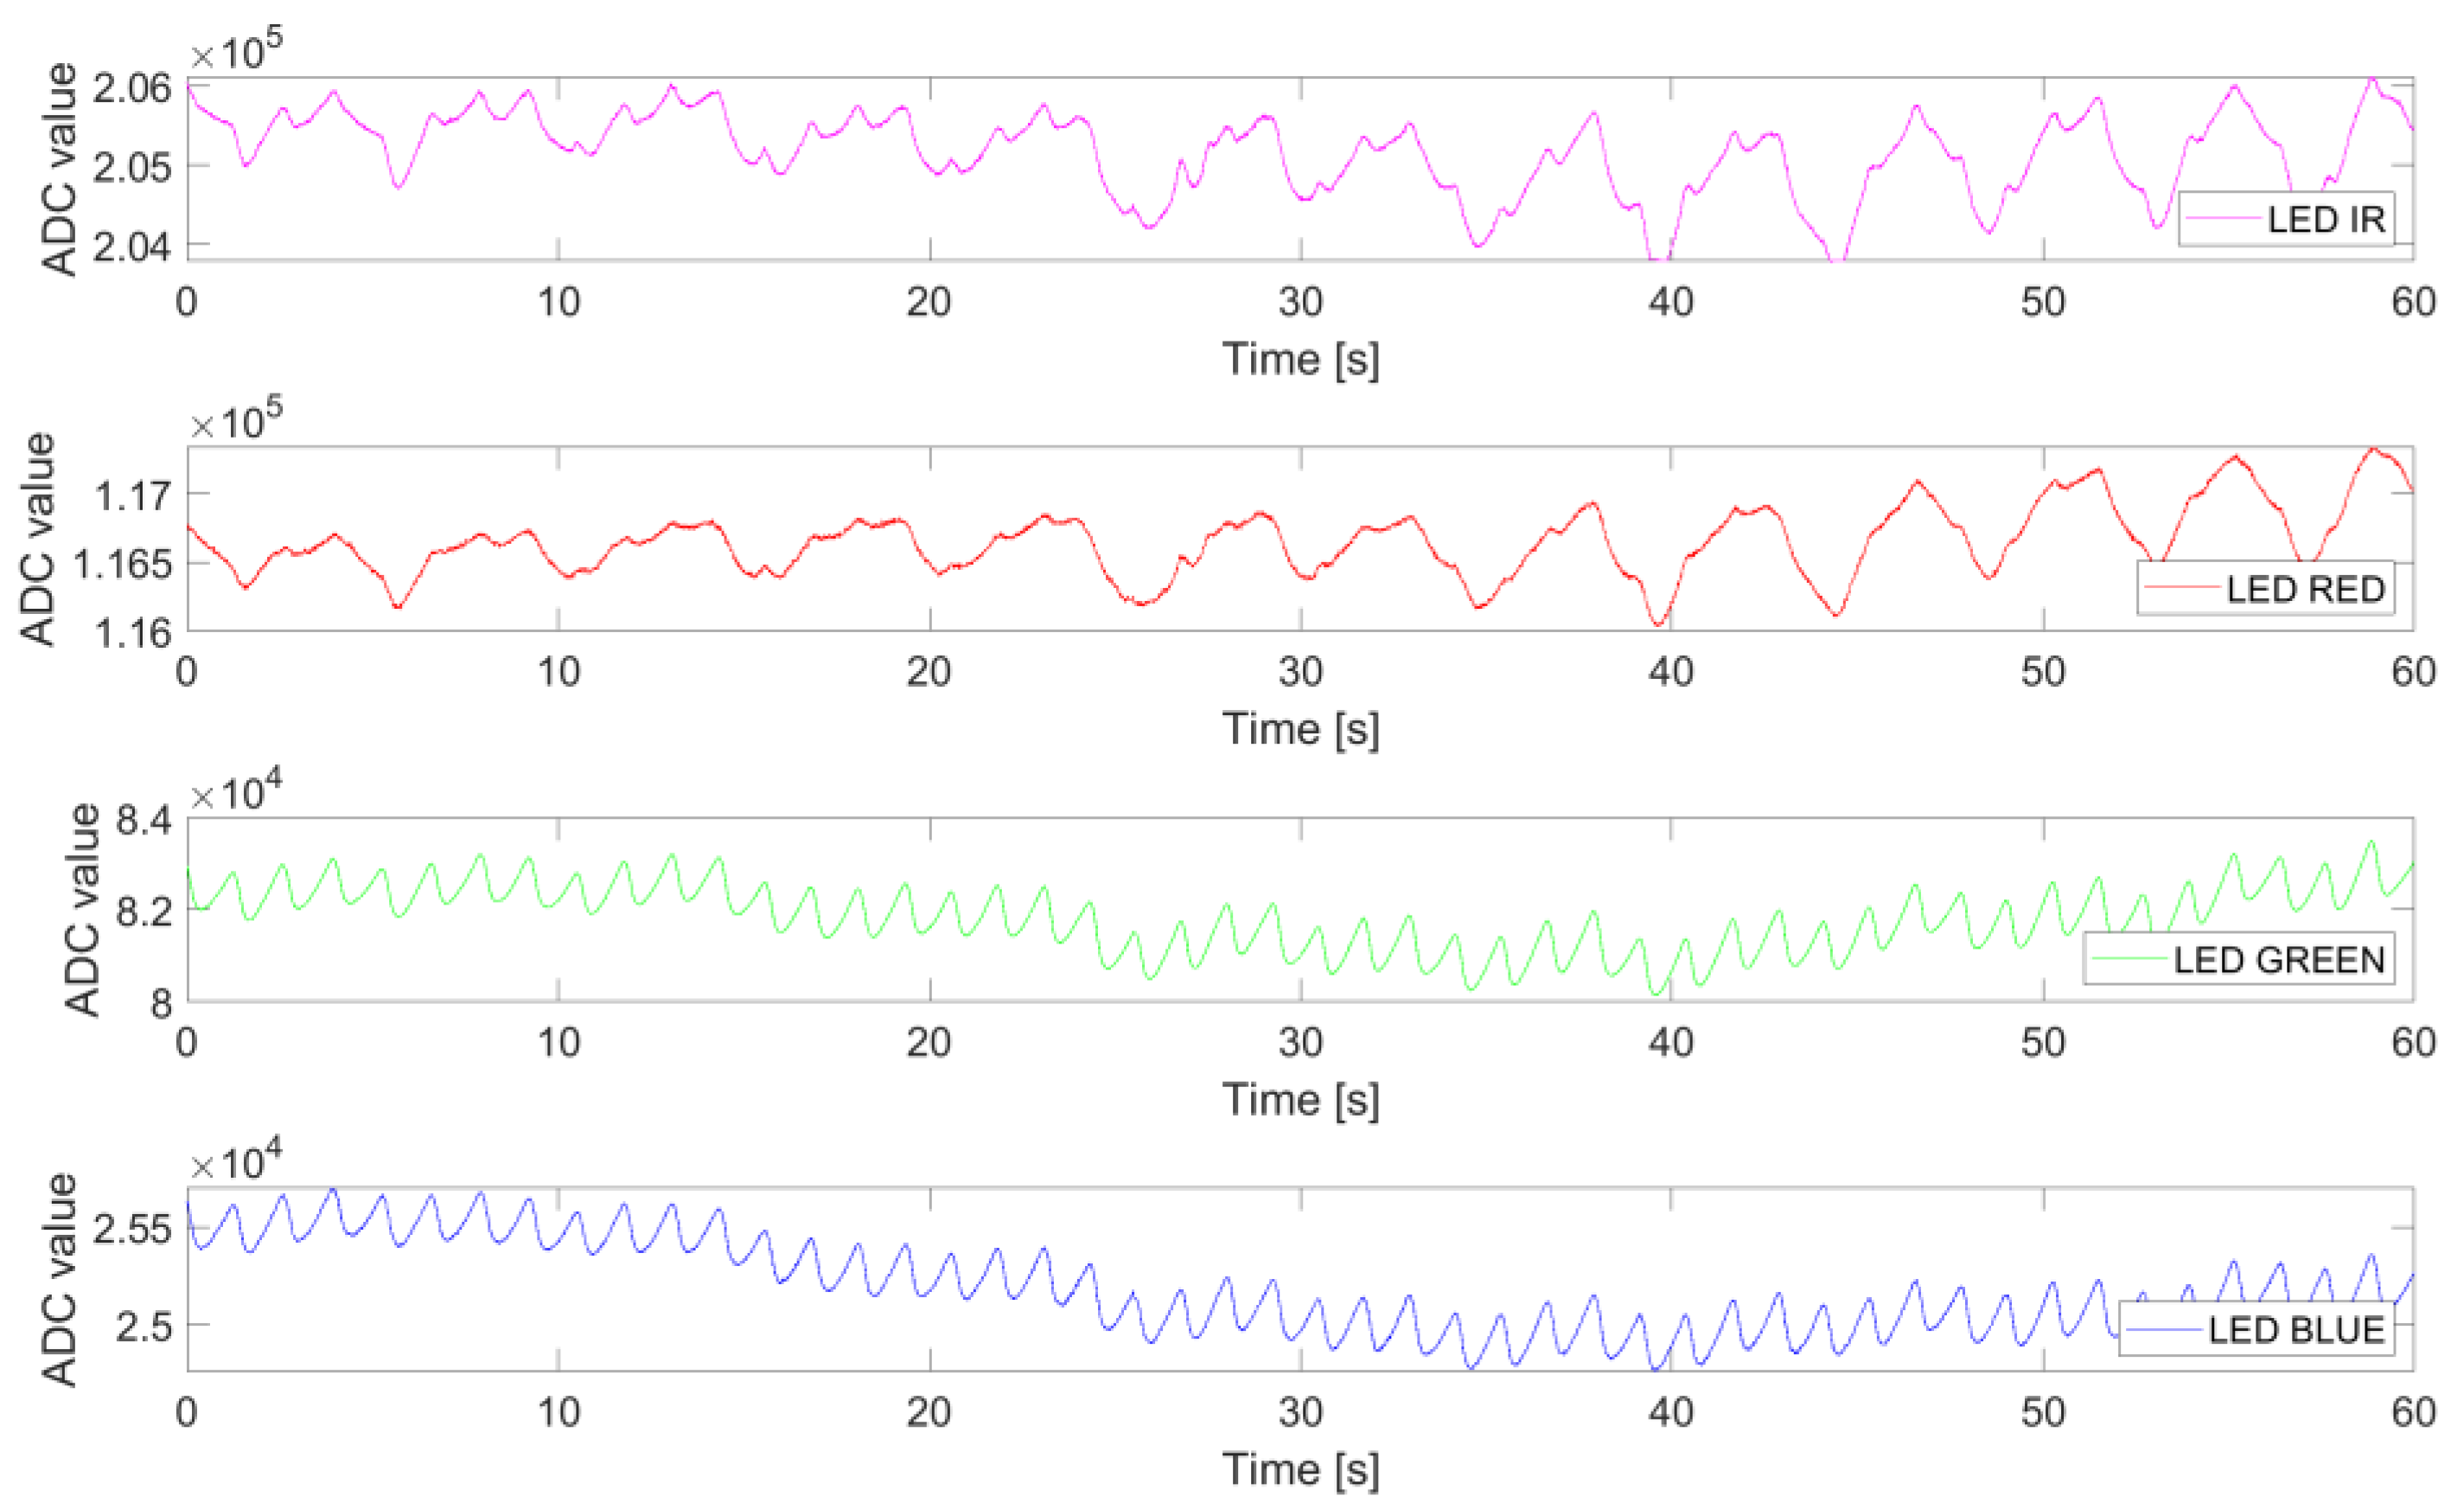
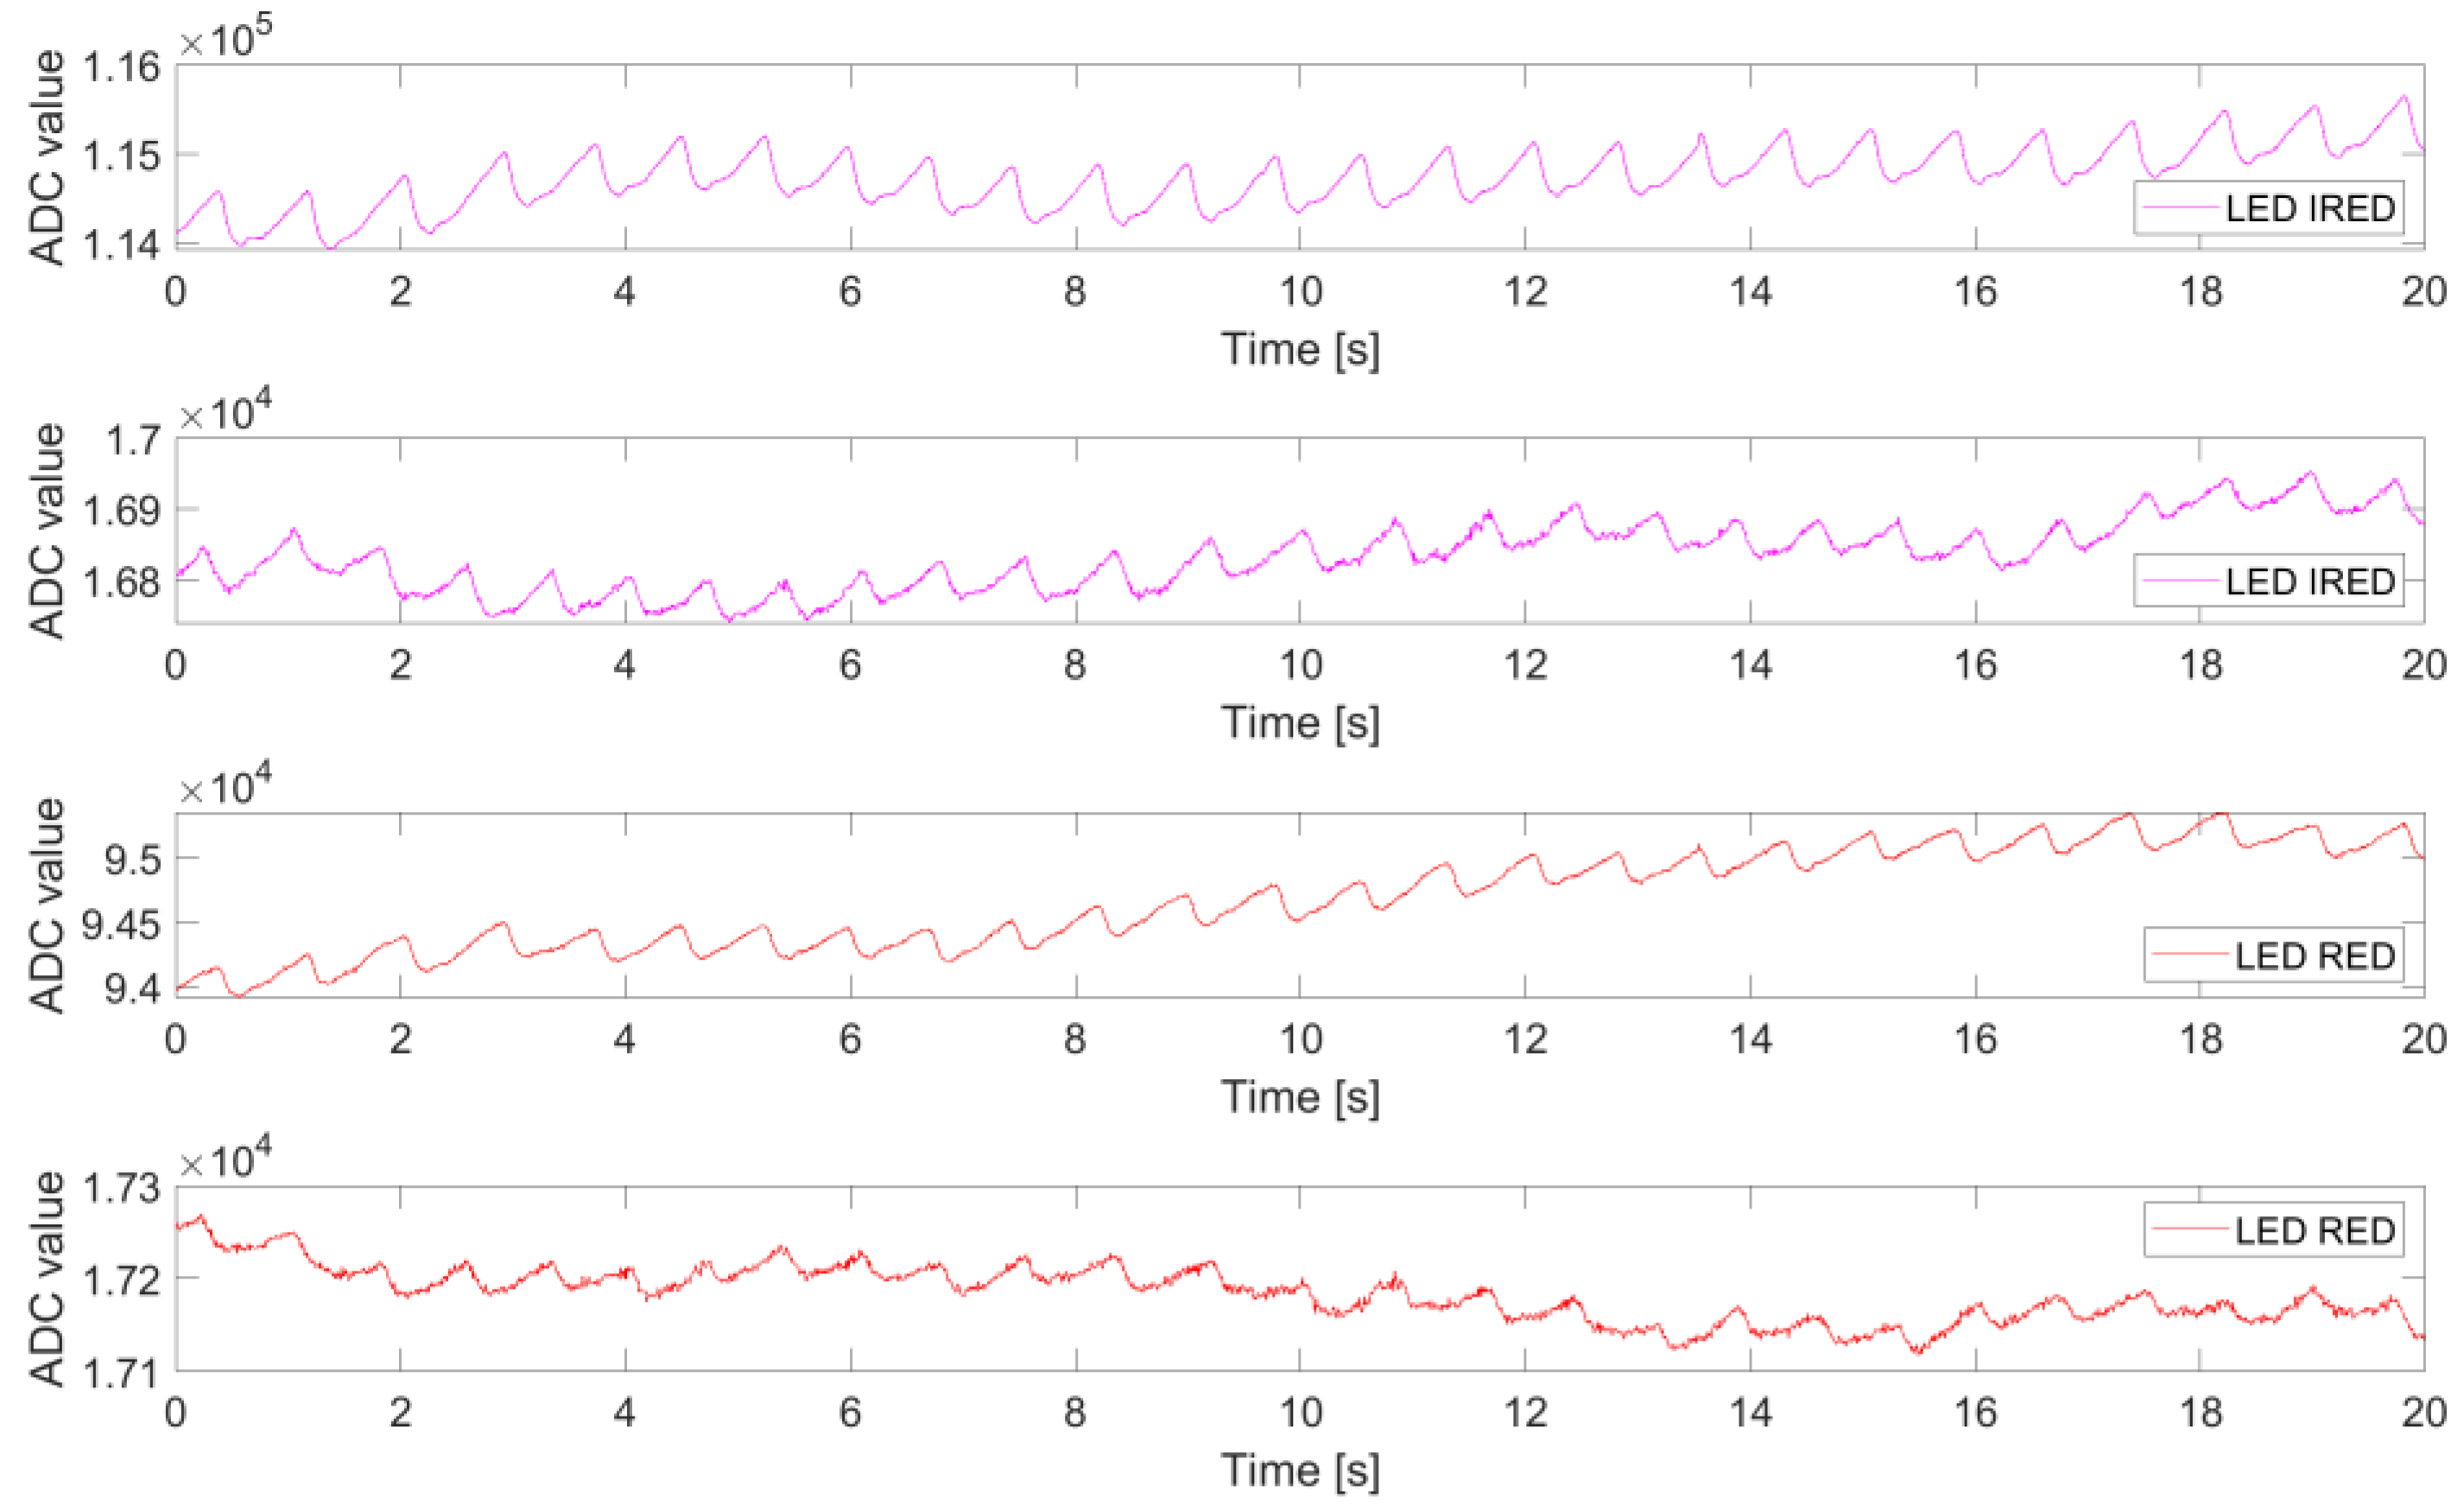
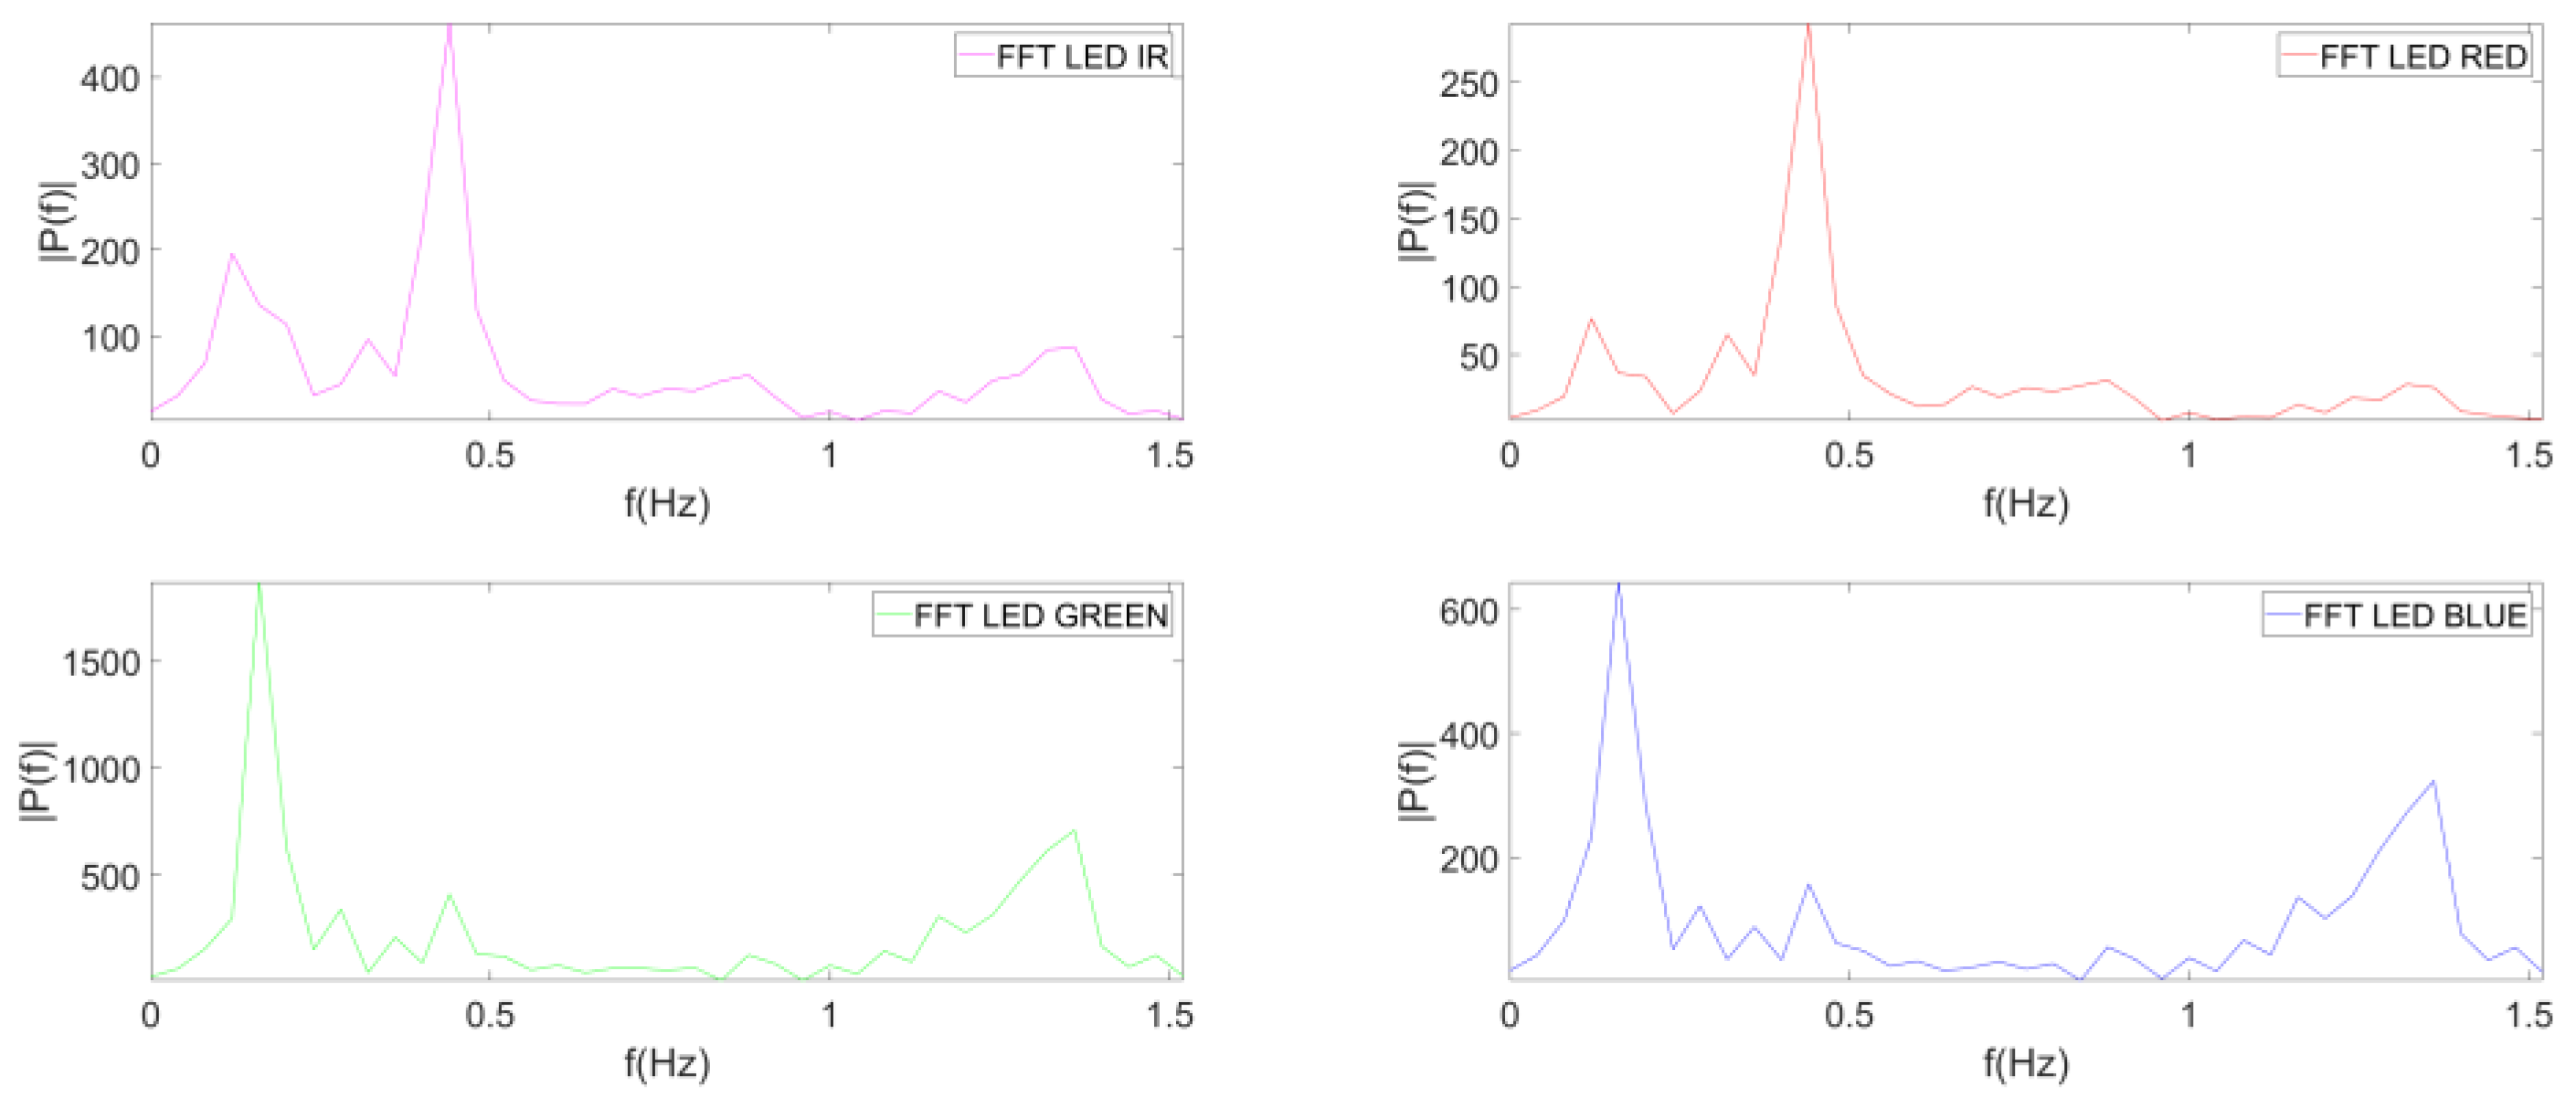
4.1. Analysis of PPG Signals for Different Measurement Sites

Figure 3 and Figure 4 show box plots of perfusion indexes gathered from all subjects measured at 2 and 10 mA in the body locations. As can be observed, the two plots have the same trend, meaning that the supply current of the LEDs does not affect the choice of a measurement site as there is no proportional increase in the perfusion index. Moreover, the green LED has the highest perfusion index at all measurement sites, followed by the blue LED. The red and infrared LEDs, on the other hand, show a significantly lower perfusion index. The measurements with the highest PI were obtained on the left index finger, followed by the nose bridge. Forehead and earlobe are also good measurement sites. On the wrist, however, the signals of the red and infrared LEDs were often so disturbed that they were unusable for identifying the heartbeat; in contrast, the green and blue LEDs produced good signals with clearly distinguishable heartbeats (Figure 5).
The manubrium is a particular measurement site that is able to produce PPG signals from which it is possible to extract, in addition to the heart rate, the respiratory rate. This fact is due to the mechanical action performed by the ribcage during respiration which modifies signals acquired by the sensor. In particular, the acquisitions coming from the red and infrared LEDs seem to highlight the respiratory acts more than the heartbeat, which in some cases cannot be distinguished (Figure 6). Those coming from the green and blue LEDs, on the contrary, do not seem to be influenced by breathing, while the heartbeats are clearly visible. Further analyses on the acquisitions from the sternal manubrium are presented in Section 4.2.
Another goal of this work is to identify the best supply current value for the LEDs (between 10 mA and 2 mA) in order to optimize both the signal quality and battery duration. From the characterization carried out, an increase in the perfusion index was not always detected with an increased LED current: in some cases the trend was the opposite, while in others it remained approximately the same. Basically, the measurements with the highest perfusion indexes in the various measurement sites derive both from acquisitions with a current equal to 10 mA (wrist, lobe, and nose bridge) and 2 mA (manubrium, forehead, and fingertip). In addition to this, when the higher current corresponds to the higher perfusion index, the PI maximum increase is 61% with a 400% increase of the supply current. It is worth adding that signals acquired at 2 mA, in some cases, appear to be slightly noisier than those acquired at 10 mA, in particular for the red LED and, to a lesser extent, the infrared one (Figure 7). However, this involves the loss of some information that can be extracted from the PPG signal, such as for example the dicrotic notch, which, in Figure 7, is very evident in the acquisition coming from the infrared LED with a supply current equal to 10 mA and which is no longer easily identifiable, due to noise, in the 2 mA one.

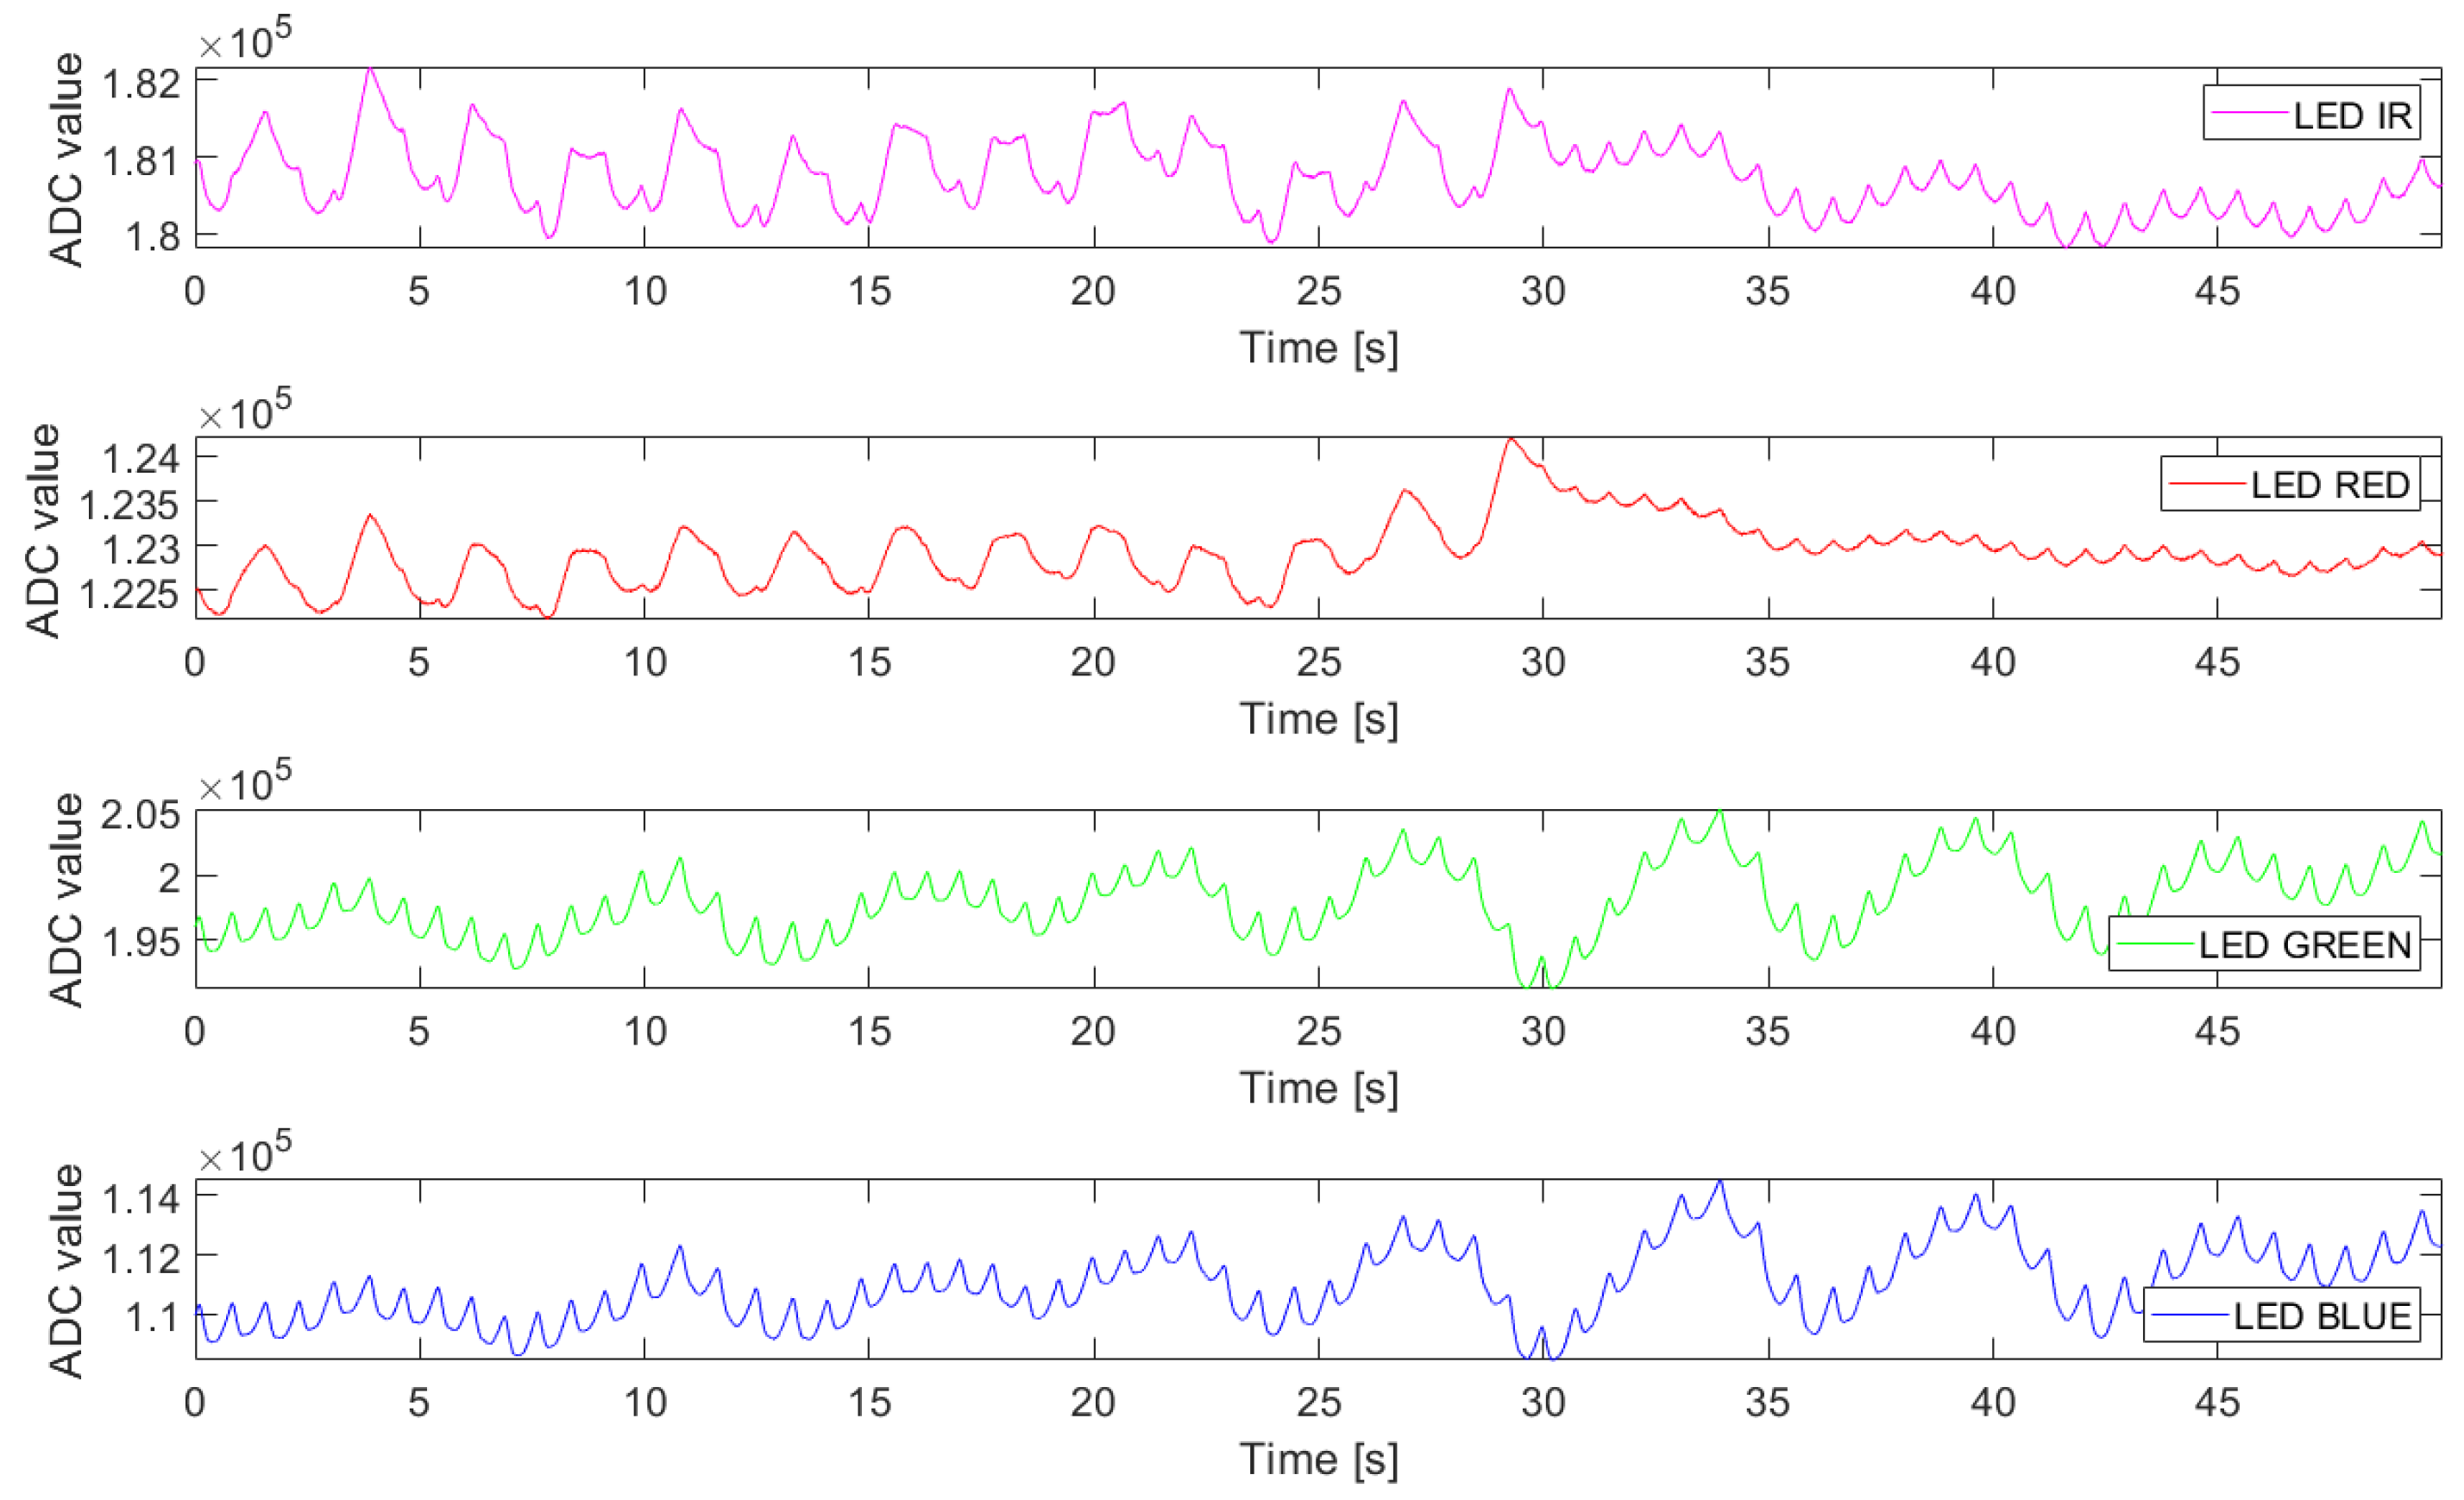
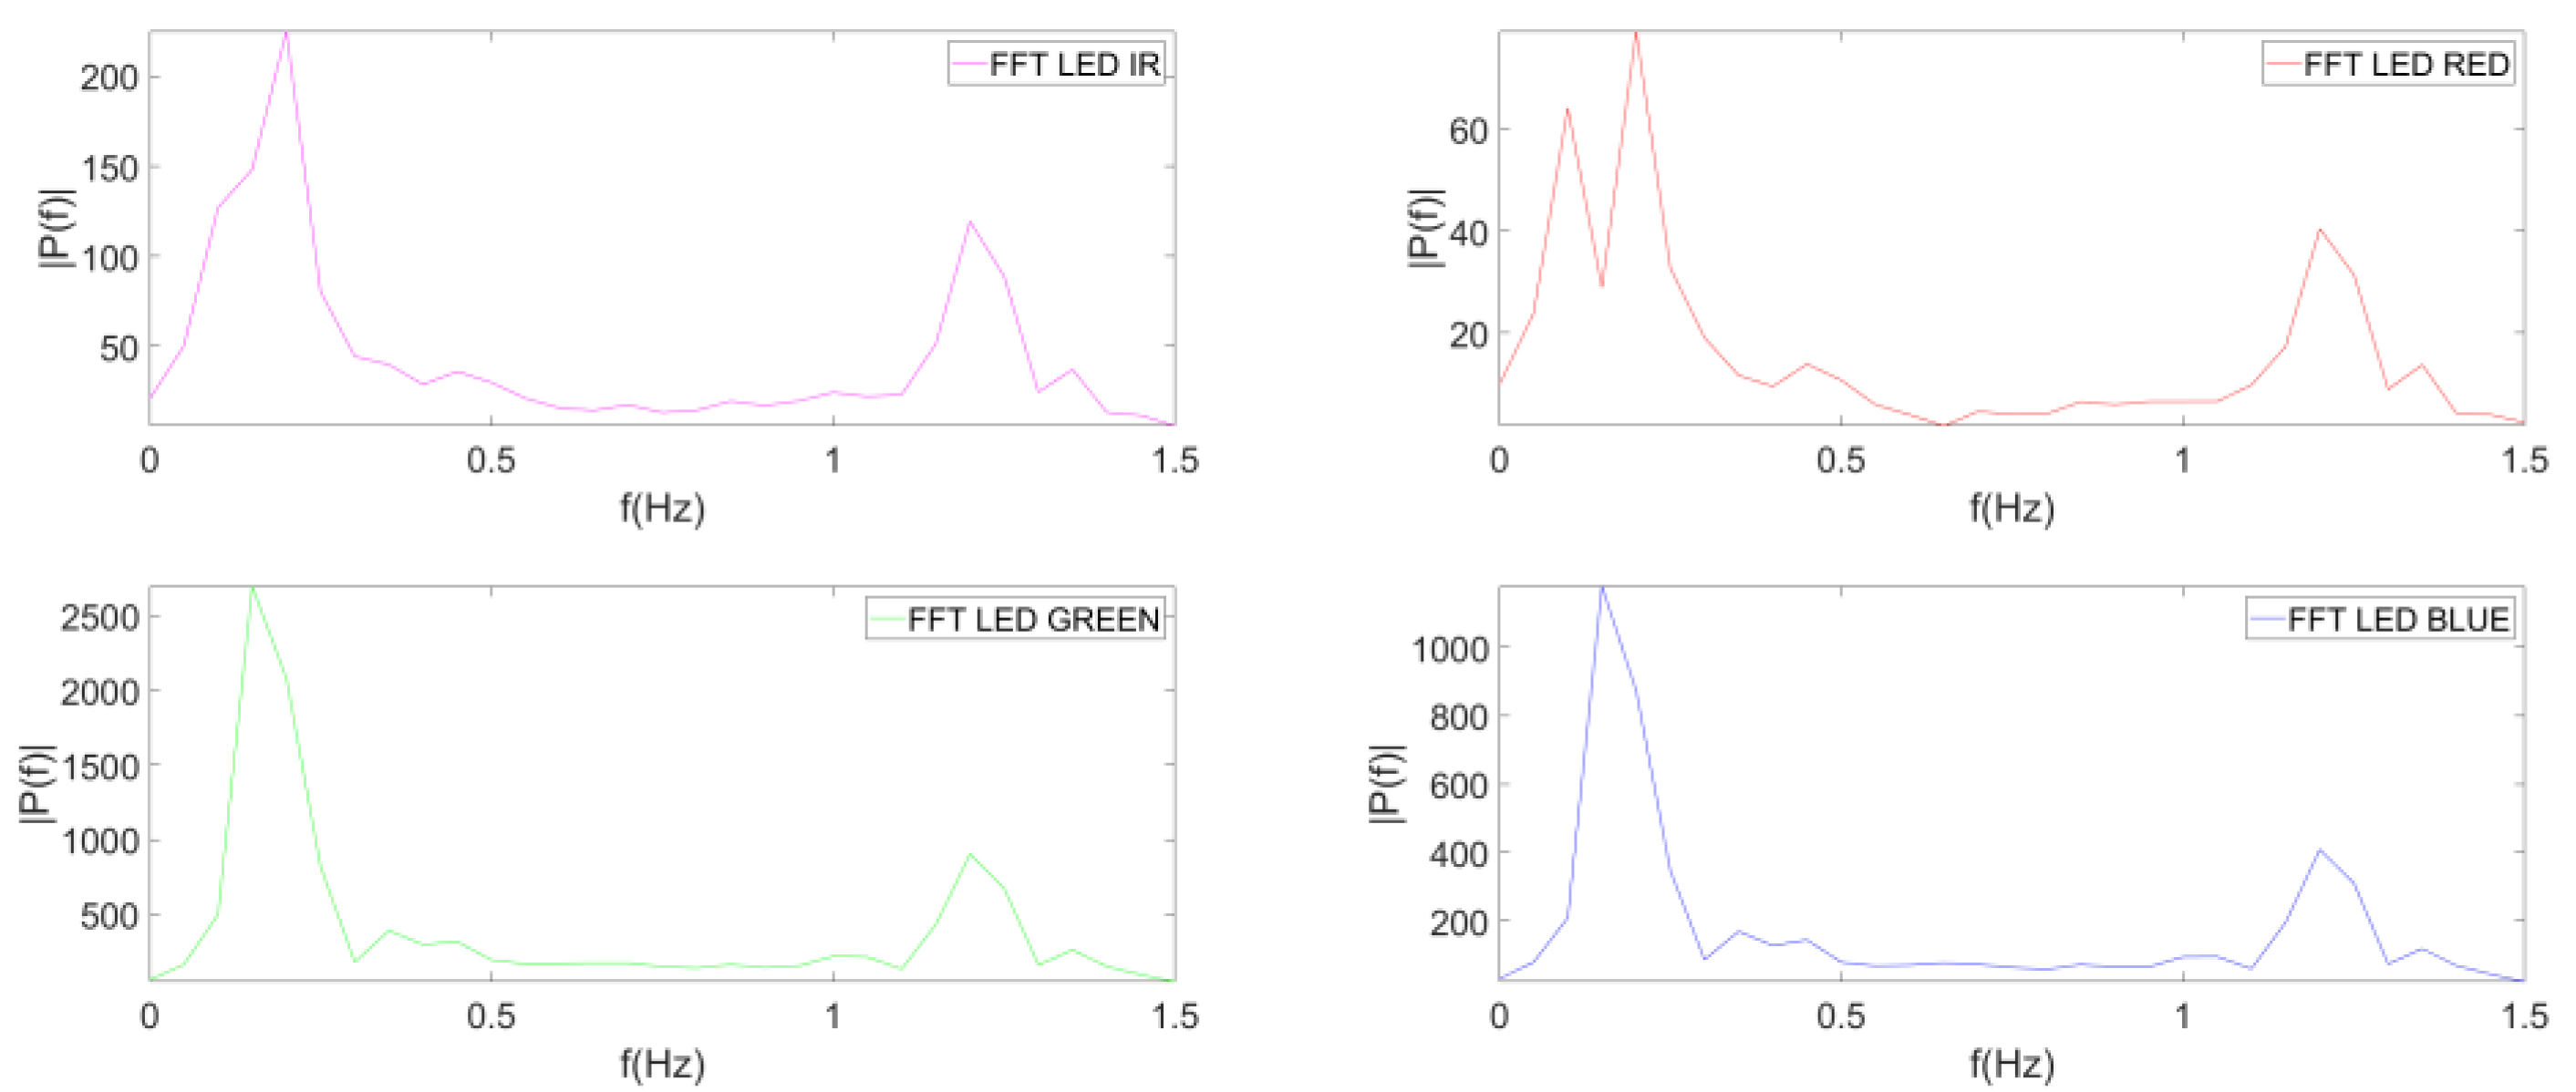
4.2. Analysis of PPG Signals from Manubrium during Apnea

As previously mentioned, the measurements from the manubrium have the particularity of providing, in addition to the heart rate, information regarding the respiratory rate. This feature is very evident in the signals deriving from the red and infrared LEDs, where, in some cases, the cardiac activity is not visible or is less visible than the respiratory activity. The acquisitions from the manubrium of a young subject (17 years of age) are presented. During measurements, subjects were asked to take deep breaths, counting the number of breaths, and then hold their breath for about 40 s. In this way it has been possible to evaluate the behavior of the signals when the subject is in the apnea phase.
Figure 8 shows PPG signals acquired on the manubrium of subject 2, in which the apnea phase starts after about 30 s. The signals from the red and infrared LEDs immediately settled down, clearly showing the heartbeat which before the apnea phase was not detectable. During measurement, the subject counted 13 breaths, which corresponds with the peaks of the signals obtained from the red and infrared LEDs but not with those deriving from the green and blue LEDs.
Figure 9 shows the spectrum of the measurement on subject 2 in the respiration phase, between zero and about 25 s. The acquisitions from the red and infrared LEDs have three peaks: the first is at a frequency of about 0.16 Hz, the second, dominant one at 0.44 Hz, and the third at 1.36 Hz. Those deriving from the green and blue LEDs, on the other hand, have only two peaks, the first at 0.16 Hz and the second at 1.36 Hz. In particular, the latter can be associated to the heartbeat while the one at 0.44 Hz is attributable to respiration.
Figure 10 shows the spectrum of the acquisition from subject 2 in the time interval of 30–50 s (apnea phase). In this case, in the signals from the red and infrared LEDs, the frequency peak of the respiration is no longer visible and the one at 0.2 Hz becomes dominant. Concerning spectra from the green and blue LEDs, however, the frequency peaks show no significant variations.
In conclusion, the green and blue LEDs do not seem to provide useful information about respiratory activity, unlike the red and infrared ones, in agreement with [14]. A possible explanation could be the different depths of penetration of the wavelengths; in fact, the green and blue LEDs are suitable for superficial measurements while the red and infrared ones are able to penetrate deeper into the skin tissue.

4.3. Noise Analysis of the MAX86916

In this section, a noise characterization of the MAX86916 module, for different configuration of the setting parameters, has been carried out in order to assess the performance of the device and find the optimal configuration. In order to measure only the sensor noise without the disturbances of the ambient light, it was decided to measure the noise by placing the sensor, facing upwards, in a dark room. The PPG setting configurations taken into account for the analysis have been described in Section 3.2. The noise acquired from the sensor in these conditions is expressed in terms of ADC counts and, represented in a time domain, is similar to a PPG signal and therefore characterized by a DC value and an AC value. These two components of the noise, named noise mean value (i.e., DC value) and noise variance (i.e., AC value), are useful to compare with the DC and AC values measured with the eight volunteers to calculate the signal-to-noise ratio.
Figure 11 shows the average value (a) and variance (b) of the MAX86916 noise for different LED supply current values in configuration 1. It can be noted that the noise mean value decreases when the LED supply current decreases, while the noise variance, on the contrary, does not seem to be correlated with the supply current. This behavior can be explained as a noneffective decoupling between the LEDs and the photodiodes inside the PPG device. In any case, it is worth pointing out that the highest DC value (about 800 ADC counts) of the noise must be compared with the DC values of the PPG signals (order 105 since the dynamic range of the ADC is from 0 to 524,287 ADC counts). This mean noise value, but also the noise variance, in the order 2 ADC counts, is negligible with respect to the signals. Figure 12 shows the average value (a) and variance (b) of the MAX86916 noise for different values of the full-scale value of the ADC with a supply current equal to 10 mA. The noise mean value and the variance increase with the reduction of the full-scale value of the ADC. In particular, the variance increases significantly from 8192 nA to 4096 nA. It is worth pointing out that the variance of the full-scale value of the ADC for the chosen configuration, Talbe 2, is 8192 nA. Figure 13 shows the average value (a) and variance (b) of the MAX86916 noise for different values of the LED pulse width with a supply current equal to 10 mA. In this case, it can be observed that the LED pulse width at which the variance is very high has not been chosen for real-world application (see Table 2).

5. Conclusions

This paper presented the development and characterization of a miniaturized wearable optoelectronic system based on the MAX86916 module. The initial activity was dedicated to the definition of the setting parameters of the PPG device in order to optimize the photoplethysmographic measurements. In particular, acquisitions with different LED supply currents, pulse widths, integration times, and full-scale ranges of the ADC have been performed to determine the optimal configuration, leading to a good tradeoff between signal quality and current consumption. Different body locations of a group of eight people have been assessed through measurements. Based on the characterization results, the MAX86916 represents a good candidate for the development of a PPG wearable system. Future activity focused on the comparison of measurements from different LED sources and on the development of a custom motherboard for the wearable system is already planned.

Author Contributions

Conceptualization, G.T. and L.G.; methodology, G.T. and L.G.; software, D.S.; measurements, D.S.; data curation, D.S.; writing—original draft preparation, G.T.; writing—review and editing, G.T. and L.G.; supervision, G.T. All authors have read and agreed to the published version of the manuscript.

Funding

This research received no external funding.

Institutional Review Board Statement

Not applicable.

Informed Consent Statement

Informed consent was obtained from all subjects involved in the study.

Data Availability Statement

The data presented in this work are not publicly available due to privacy restrictions but are available on request from the corresponding author.

Acknowledgments

The authors wish to thanks Andrea Pedrana (University of Bergamo) for his support in the development and characterization of the wearable sensor presented in this paper.

Conflicts of Interest

The authors declare no conflict of interest.

References

  1. Aymen, A.A.; Shelley, K.H. Photoplethysmography. Best Pract. Res. Clin. Anaesthesiol. 2014, 28, 395–406. [Google Scholar] [CrossRef]
  2. Tamura, T. Current progress of photoplethysmography and SPO2 for health monitoring. Biomed. Eng. Lett. 2019, 9, 21–36. [Google Scholar] [CrossRef] [PubMed]
  3. Wukitsch, M.W. Pulse oximetry: Historical review and Ohmeda functional analysis. Int. J. Clin. Monit. Comput. 1987, 4, 161–166. [Google Scholar] [CrossRef] [PubMed]
  4. Meada, Y.; Sekine, M.; Tamura, T. The advantage of green reflected photoplethysmograph. J. Med. Syst. 2011, 35, 829–834. [Google Scholar] [CrossRef] [PubMed]
  5. Lee, J.; Matsumura, K.; Yamakoshi, K.-I.; Rolfe, P.; Tanaka, S.; Yamakoshi, T. Comparison between red, green and blue light reflection photoplethysmography for heart rate monitoring during motion. In Proceedings of the Annual International Conference of the IEEE Engineering in Medicine and Biology Society, Osaka, Japan, 3–7 July 2013; pp. 1724–1727. [Google Scholar] [CrossRef]
  6. Shchelkanova, E.; Shchelkanov, A.; Shchapova, L.; Shibata, T. An Exploration of Blue PPG Signal Using a Novel Color Sensorbased PPG System. In Proceedings of the Annual International Conference of the IEEE Engineering in Medicine and Biology Society, Montreal, QC, Canada, 20–24 July 2020; pp. 4414–4420. [Google Scholar] [CrossRef]
  7. Analog Devices. ADP166 Datasheet. 2014. Available online: https://www.analog.com/media/en/technical-documentation/data-sheets/ADP165_166.pdf (accessed on 3 March 2023).
  8. Lee, B.S. Understanding the Terms and Definitions of LDO Voltage Regulators. Technical Report October. 1999. Available online: https://www.ti.com/lit/an/slva079/slva079.pdf?ts=1627289674362 (accessed on 3 March 2023).
  9. Elgendi, M. Optimal signal quality index for photoplethysmogram signals. Bioengineering 2016, 3, 21. [Google Scholar] [CrossRef] [PubMed]
  10. Pereira, T.; Gadhoumi, K.; Ma, M.; Liu, X.; Xiao, R.; Colorado, R.A.; Keenan, K.J.; Meisel, K.; Hu, X. A Supervised Approach to Robust Photoplethysmography Quality Assessment. IEEE J. Biomed. Health Inform. 2020, 24, 649–657. [Google Scholar] [CrossRef]
  11. Welch, P.D. The use of Fast Fourier Transform for the estimation of power spectra: A method based on time averaging over short, modified periodograms. IEEE Trans. Audio Electroacoust. 1967, 15, 70–73. [Google Scholar] [CrossRef]
  12. Fitzpatrick, T.B. The validity and practicality of sun-reactive skin types I through VI. Arch. Dermatol. 1988, 124, 869–871. [Google Scholar] [CrossRef]
  13. Přibil, J.; Přibilová, A.; Frollo, I. Comparative Measurement of the PPG Signal on Different Human Body Positions by Sensors Working in Reflection and Transmission Modes. Eng. Proc. 2020, 2, 69. [Google Scholar] [CrossRef]
  14. Kamal, A.A.; Harness, J.B.; Irving, G.; Mearns, A.J. Skin photoplethysmography: A review. Comput. Methods Programs Biomed. 1989, 28, 257–269. [Google Scholar] [CrossRef]
Figure 1. Block diagram of the system based on MAX86916 and photograph of the system.
Electronics 12 02230 g001
Figure 3. Box-plot of PI indexes of all the subjects for different measurement sites at 10 mA LED supply current. * Asterix in the figure is a kind of information related to the data plotted. It represents an outlier.
Electronics 12 02230 g003
Figure 4. Box-plot of PI indexes of all the subjects for different measurement sites at 2 mA LED supply current.
Electronics 12 02230 g004
Figure 5. PPG signals measured at the wrist of subject 4 with a supply current of 2 mA.
Electronics 12 02230 g005
Figure 6. PPG signals measured at the manubrium of subject 1 with a supply current of 10 mA.
Electronics 12 02230 g006
Figure 7. PPG signals measured at the forehead of subject 3; from the top, the first two plots show the signals of the IR LED with a supply current equal to 10 mA and 2 mA, while the two bottom graphs show those coming from the red LED, with supply current equal to 10 mA and 2 mA.
Electronics 12 02230 g007
Figure 8. PPG signals measured at the manubrium of subject 2 with a supply current of 10 mA.
Electronics 12 02230 g008
Figure 9. Spectrum of the measurement on subject 2 in the time interval 0–25 s.
Electronics 12 02230 g009
Figure 10. Spectrum of the measurement on subject 2 in the time interval 30–50 s.
Electronics 12 02230 g010
Figure 11. Average value (a) and variance (b) of the MAX86916 noise for different LED supply current values in configuration 1.
Electronics 12 02230 g011
Figure 12. Average value (a) and variance (b) of the MAX86916 noise for different values of the full-scale value of the ADC with supply current equal to 10 mA.
Electronics 12 02230 g012
Figure 13. Average value (a) and variance (b) of the MAX86916 noise for different values of the LED pulse width with supply current equal to 10 mA.
Electronics 12 02230 g013
Table 1. MAX86916 parameters set for 7 different configurations.
Configuration1234567
Operation frequency [Hz]100100100100100100100
Full-scale ADC [nA]32,76816,38481924096409640964096
LED current [mA]200–275–225–215–215–215–215–2
Pulse width [μs]42042042042022012070
ADC integration time [μs]40040040040020010050
Operation modeFLEXFLEXFLEXFLEXFLEXFLEXFLEX
Table 2. Configuration parameters chosen for the MAX86916 module.
Operation Frequency [Hz]100
Full-scale ADC [nA]8192
LED current [mA]10–2
Pulse width [μs]420
ADC integration time [μs]400
Operation modeFLEX
Disclaimer/Publisher’s Note: The statements, opinions and data contained in all publications are solely those of the individual author(s) and contributor(s) and not of MDPI and/or the editor(s). MDPI and/or the editor(s) disclaim responsibility for any injury to people or property resulting from any ideas, methods, instructions or products referred to in the content.

