

A Novel Power Measurement Method Using Lock-In Amplifiers with a Frequency-Locked Loop


Abstract
:1. Introduction
- Ref. [30] implemented the digital lock-in amplifier with an FFT phase-locked loop to automatically track the input signal’s frequency change. This article claimed an accuracy of less than 1%.
- Ref. [29] implemented a digital lock-in amplifier with a frequency-tracking algorithm based on the Discrete Fourier transform (DFT). This article claimed less than 0.1% accuracy for frequency tracking and voltage signal amplitude extraction. This accuracy is due to the limitation of the DFT, like spectral leakage and resolution.
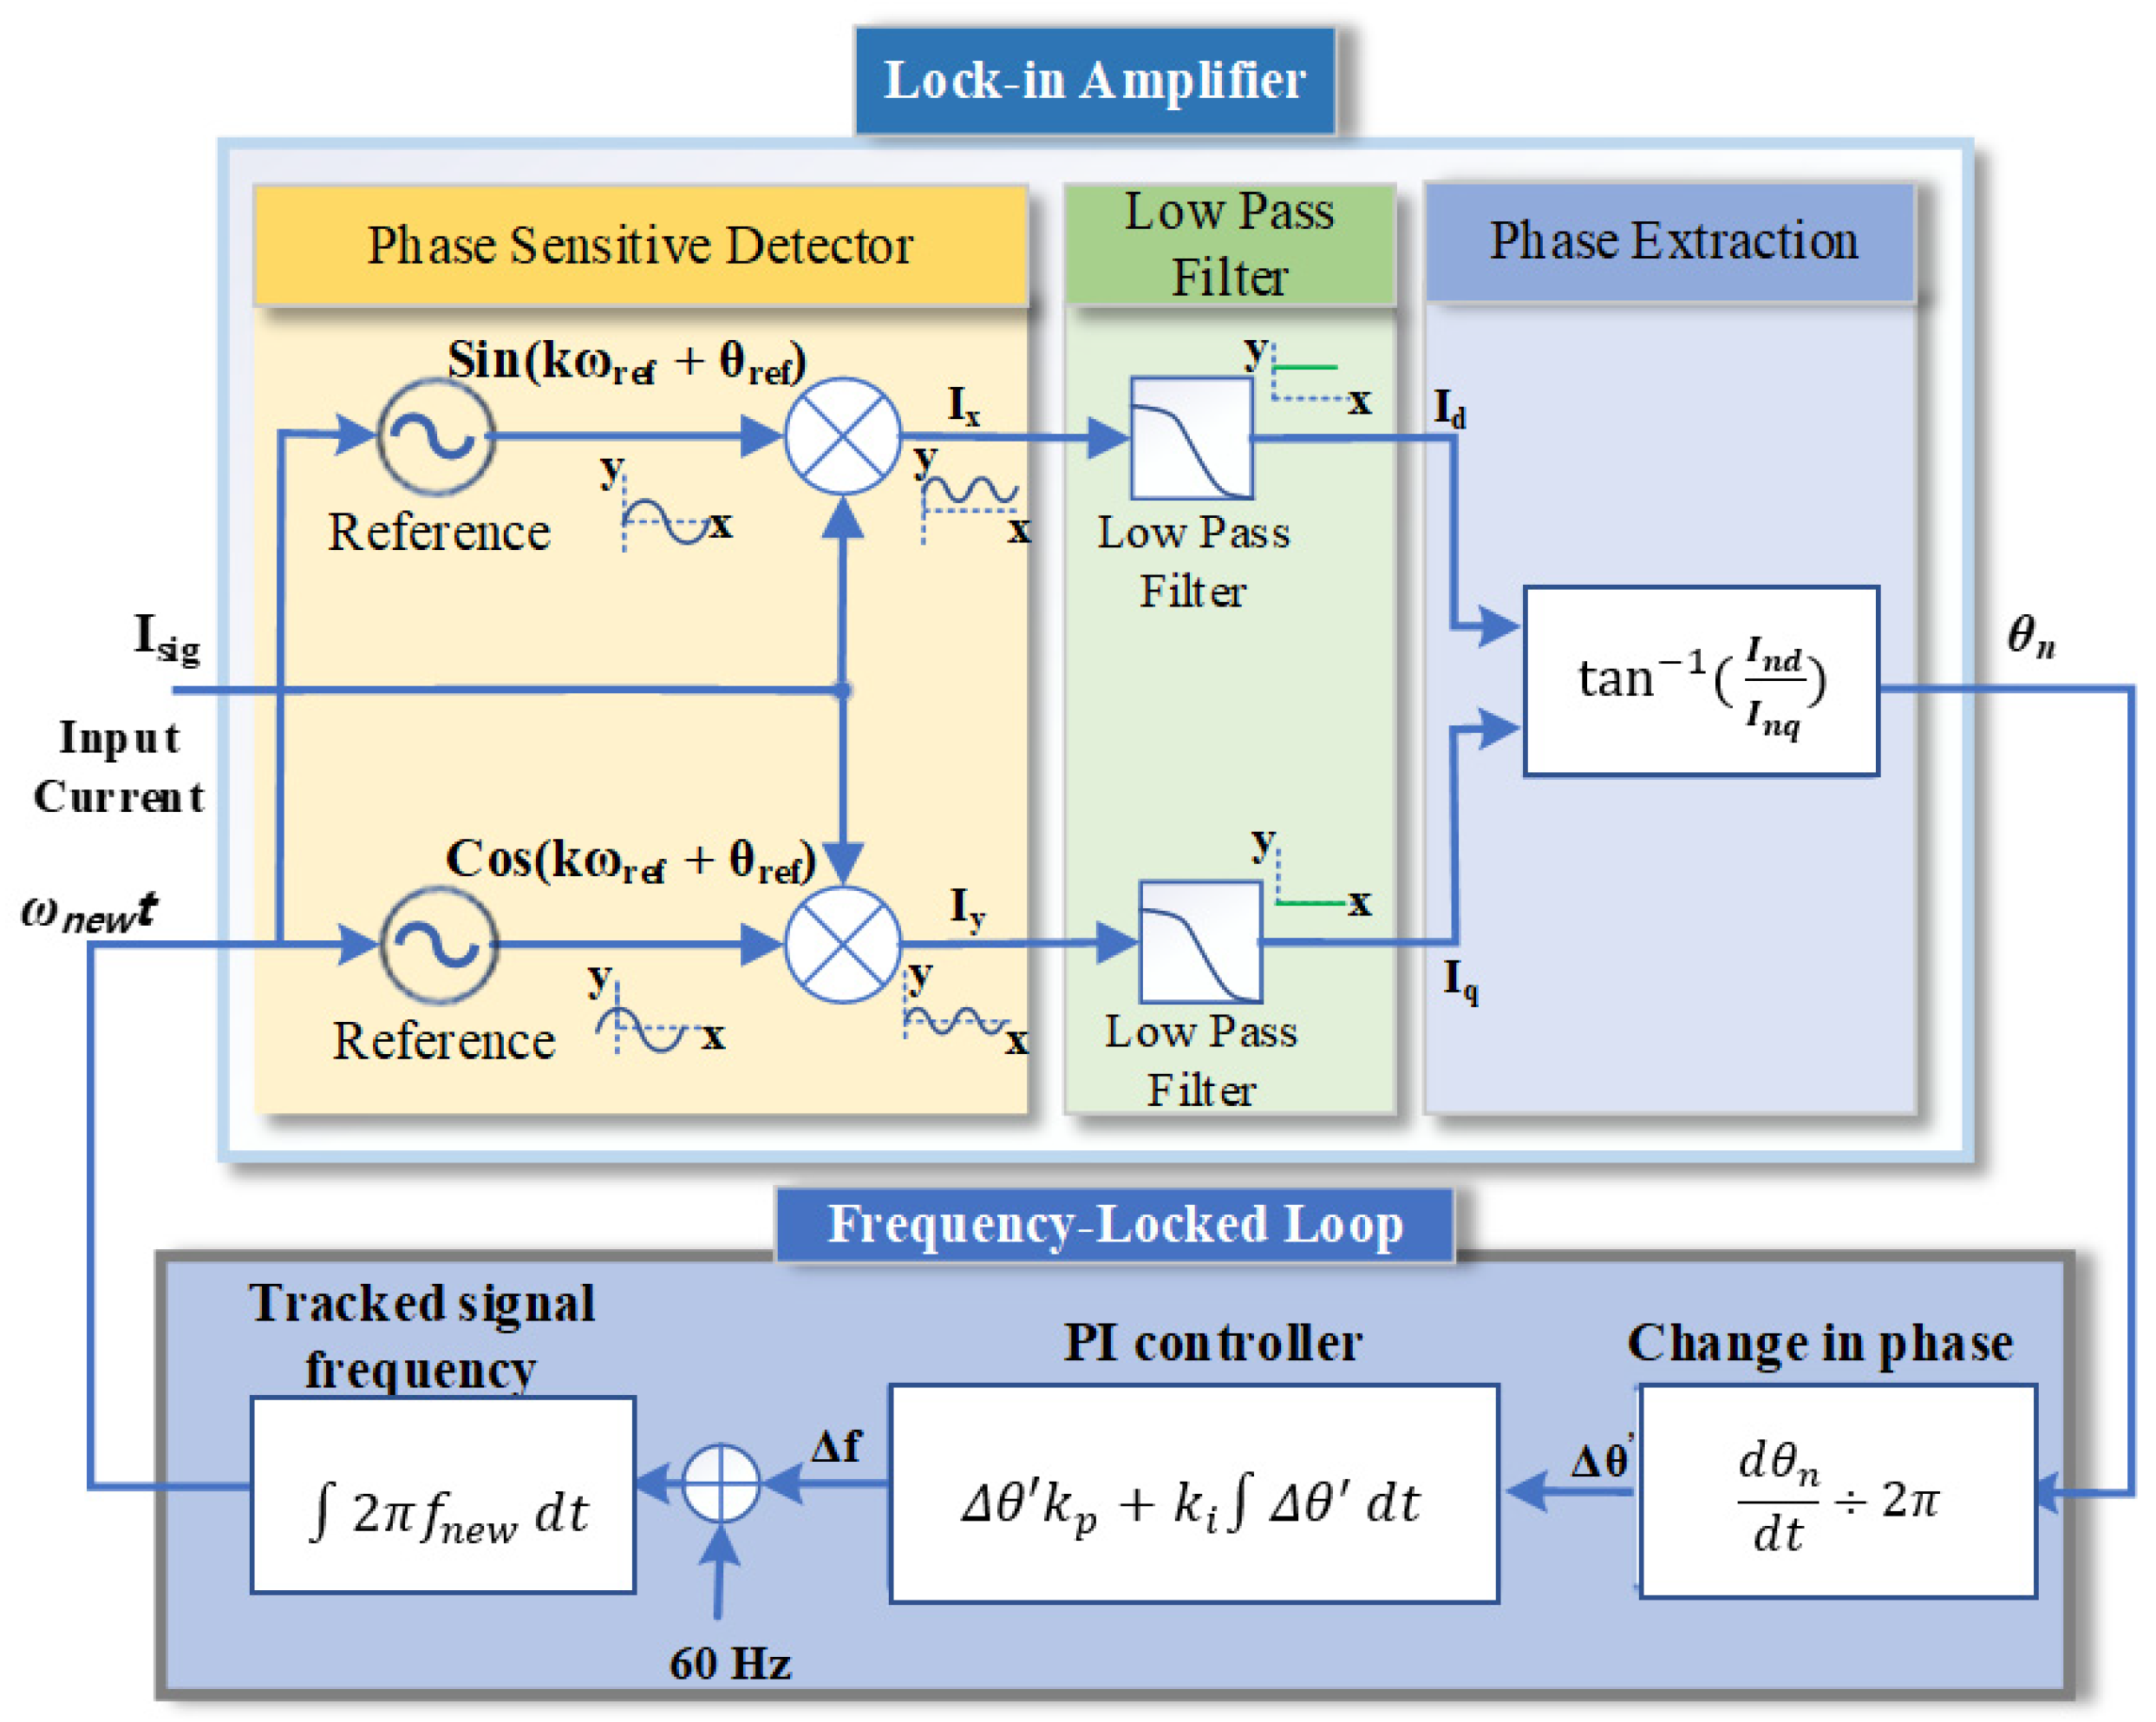
2. Proposed Power Measurement Method Using LIAs with FLL
2.1. Lock-In Amplifier (LIA)
2.1.1. Phase Sensitive Detector (PSD)
2.1.2. Low-Pass Filter (LPF)
2.1.3. Amplitude and Phase Extraction
2.2. Lock-In Amplifier Frequency-Locked Loop (LIA-FLL)
2.3. New Power Measurement Method Using LIA and LIA-FLL
3. Experimental Results and Discussion
3.1. Experimental Setup and Configuration
3.2. Frequency Tracking by Proposed LIA-FLL
3.3. Comparison of the Power Measurement by the Proposed Algorithm and ZERA Instrument
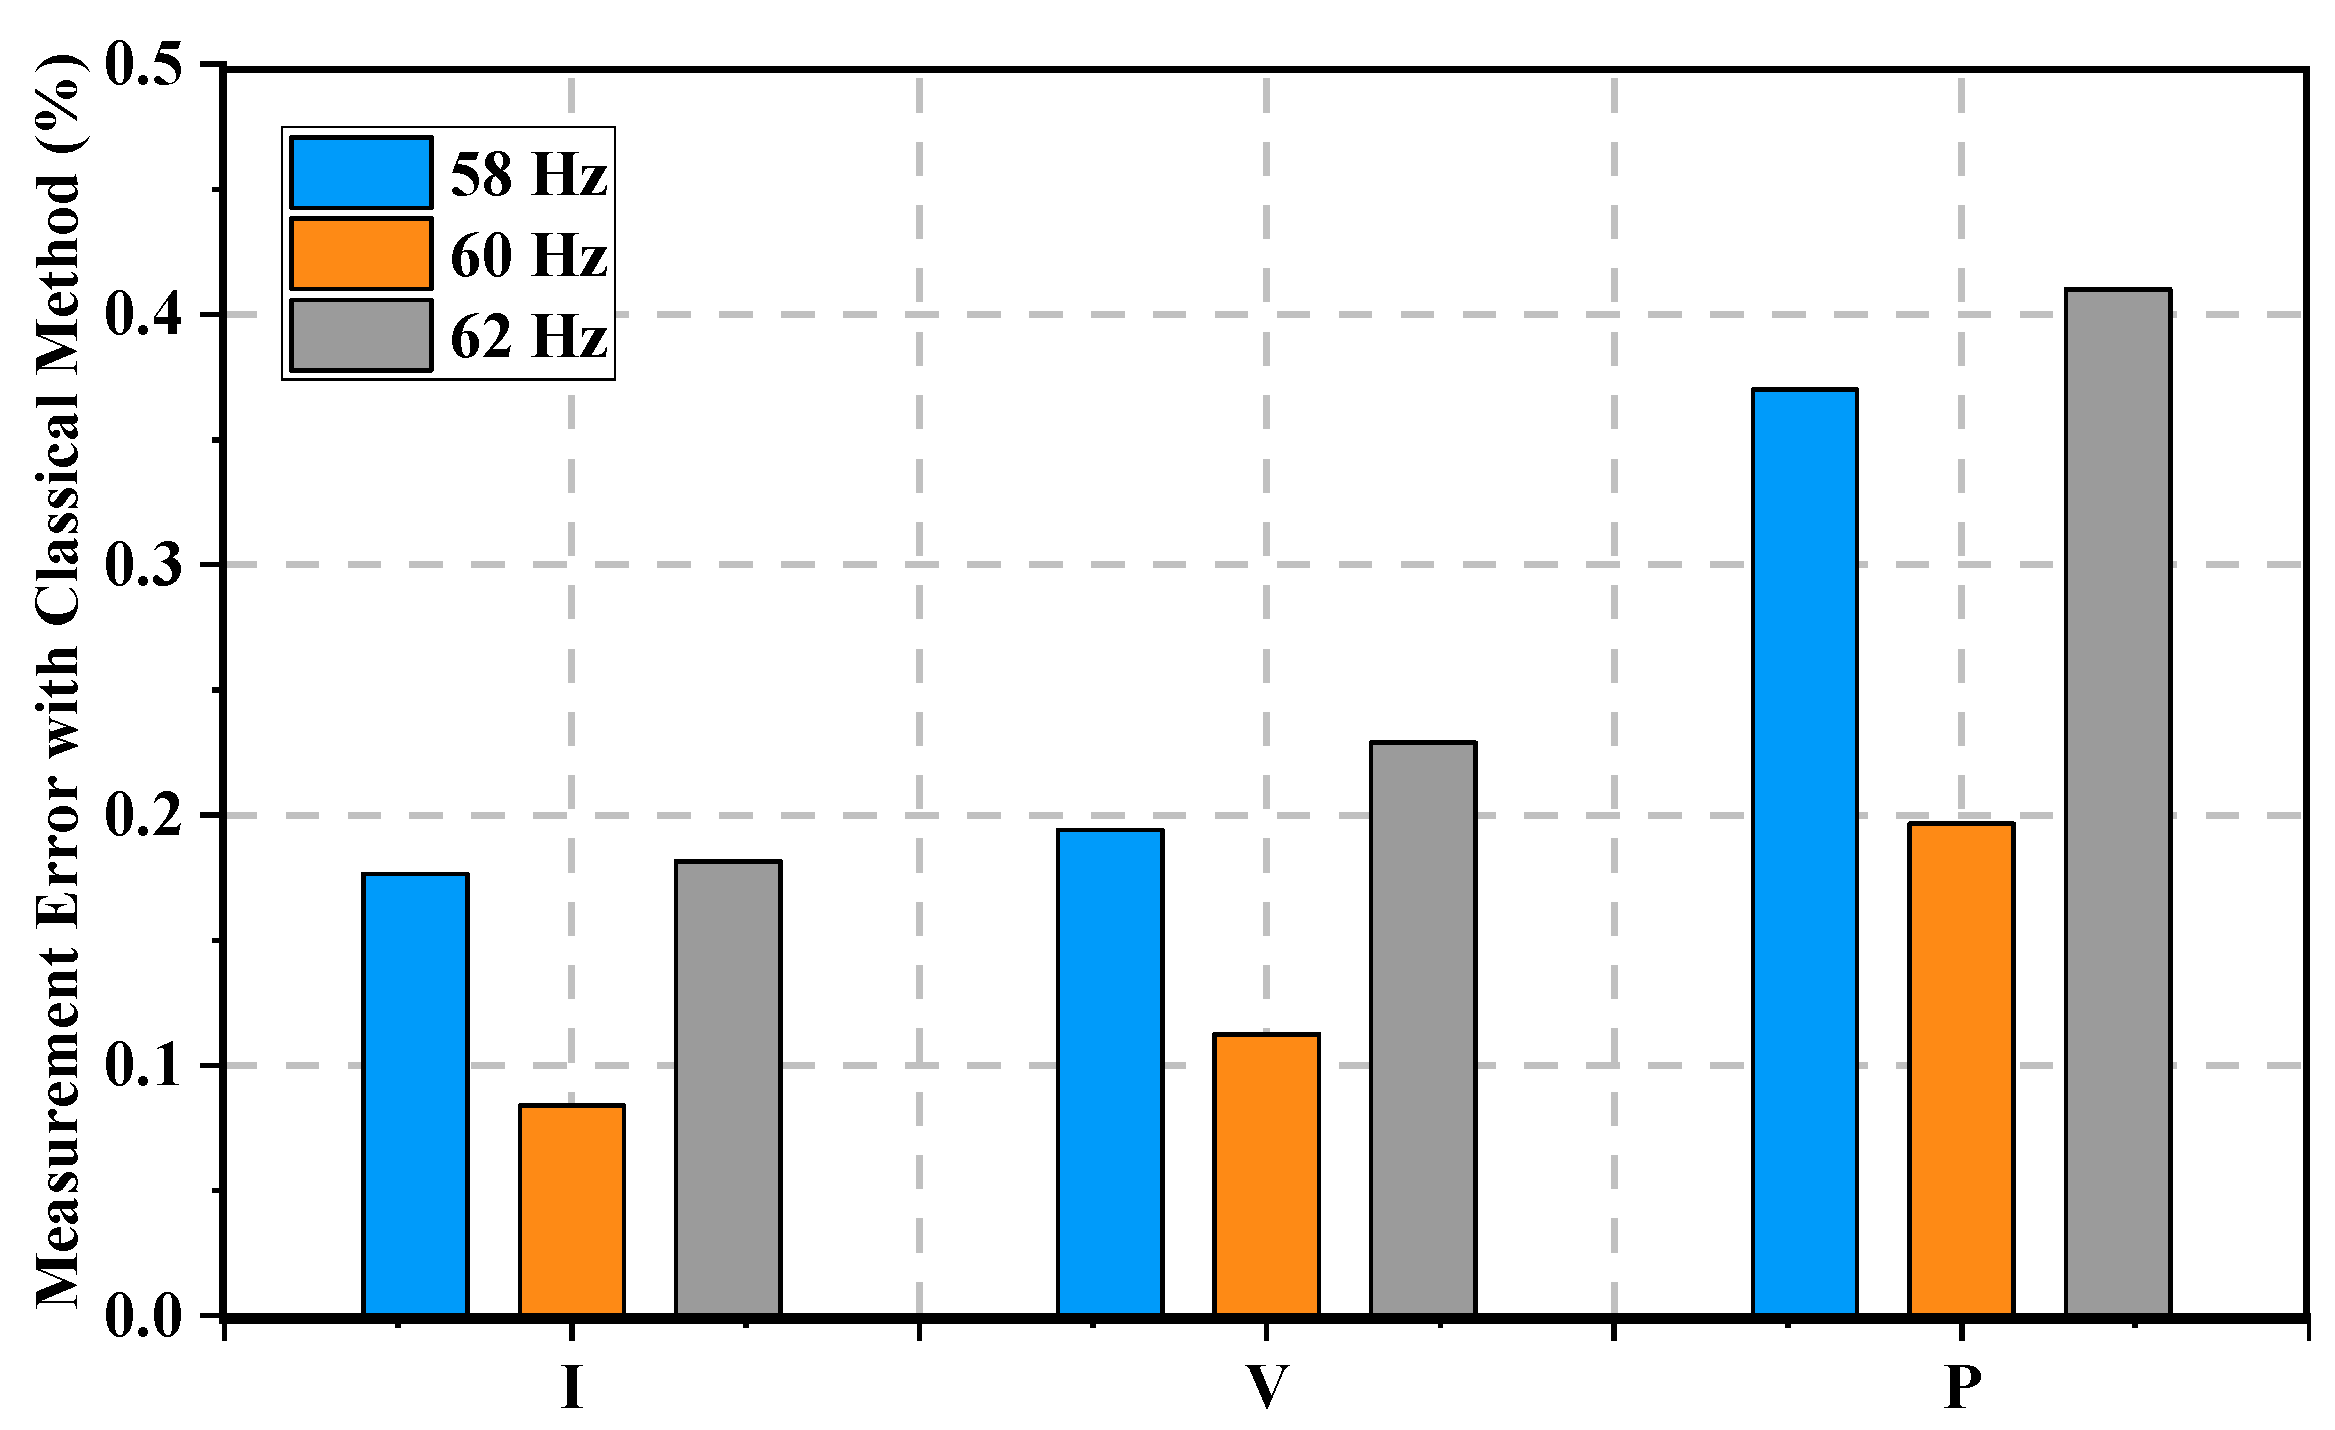
3.4. Power Measurement with FFT and Classical Method
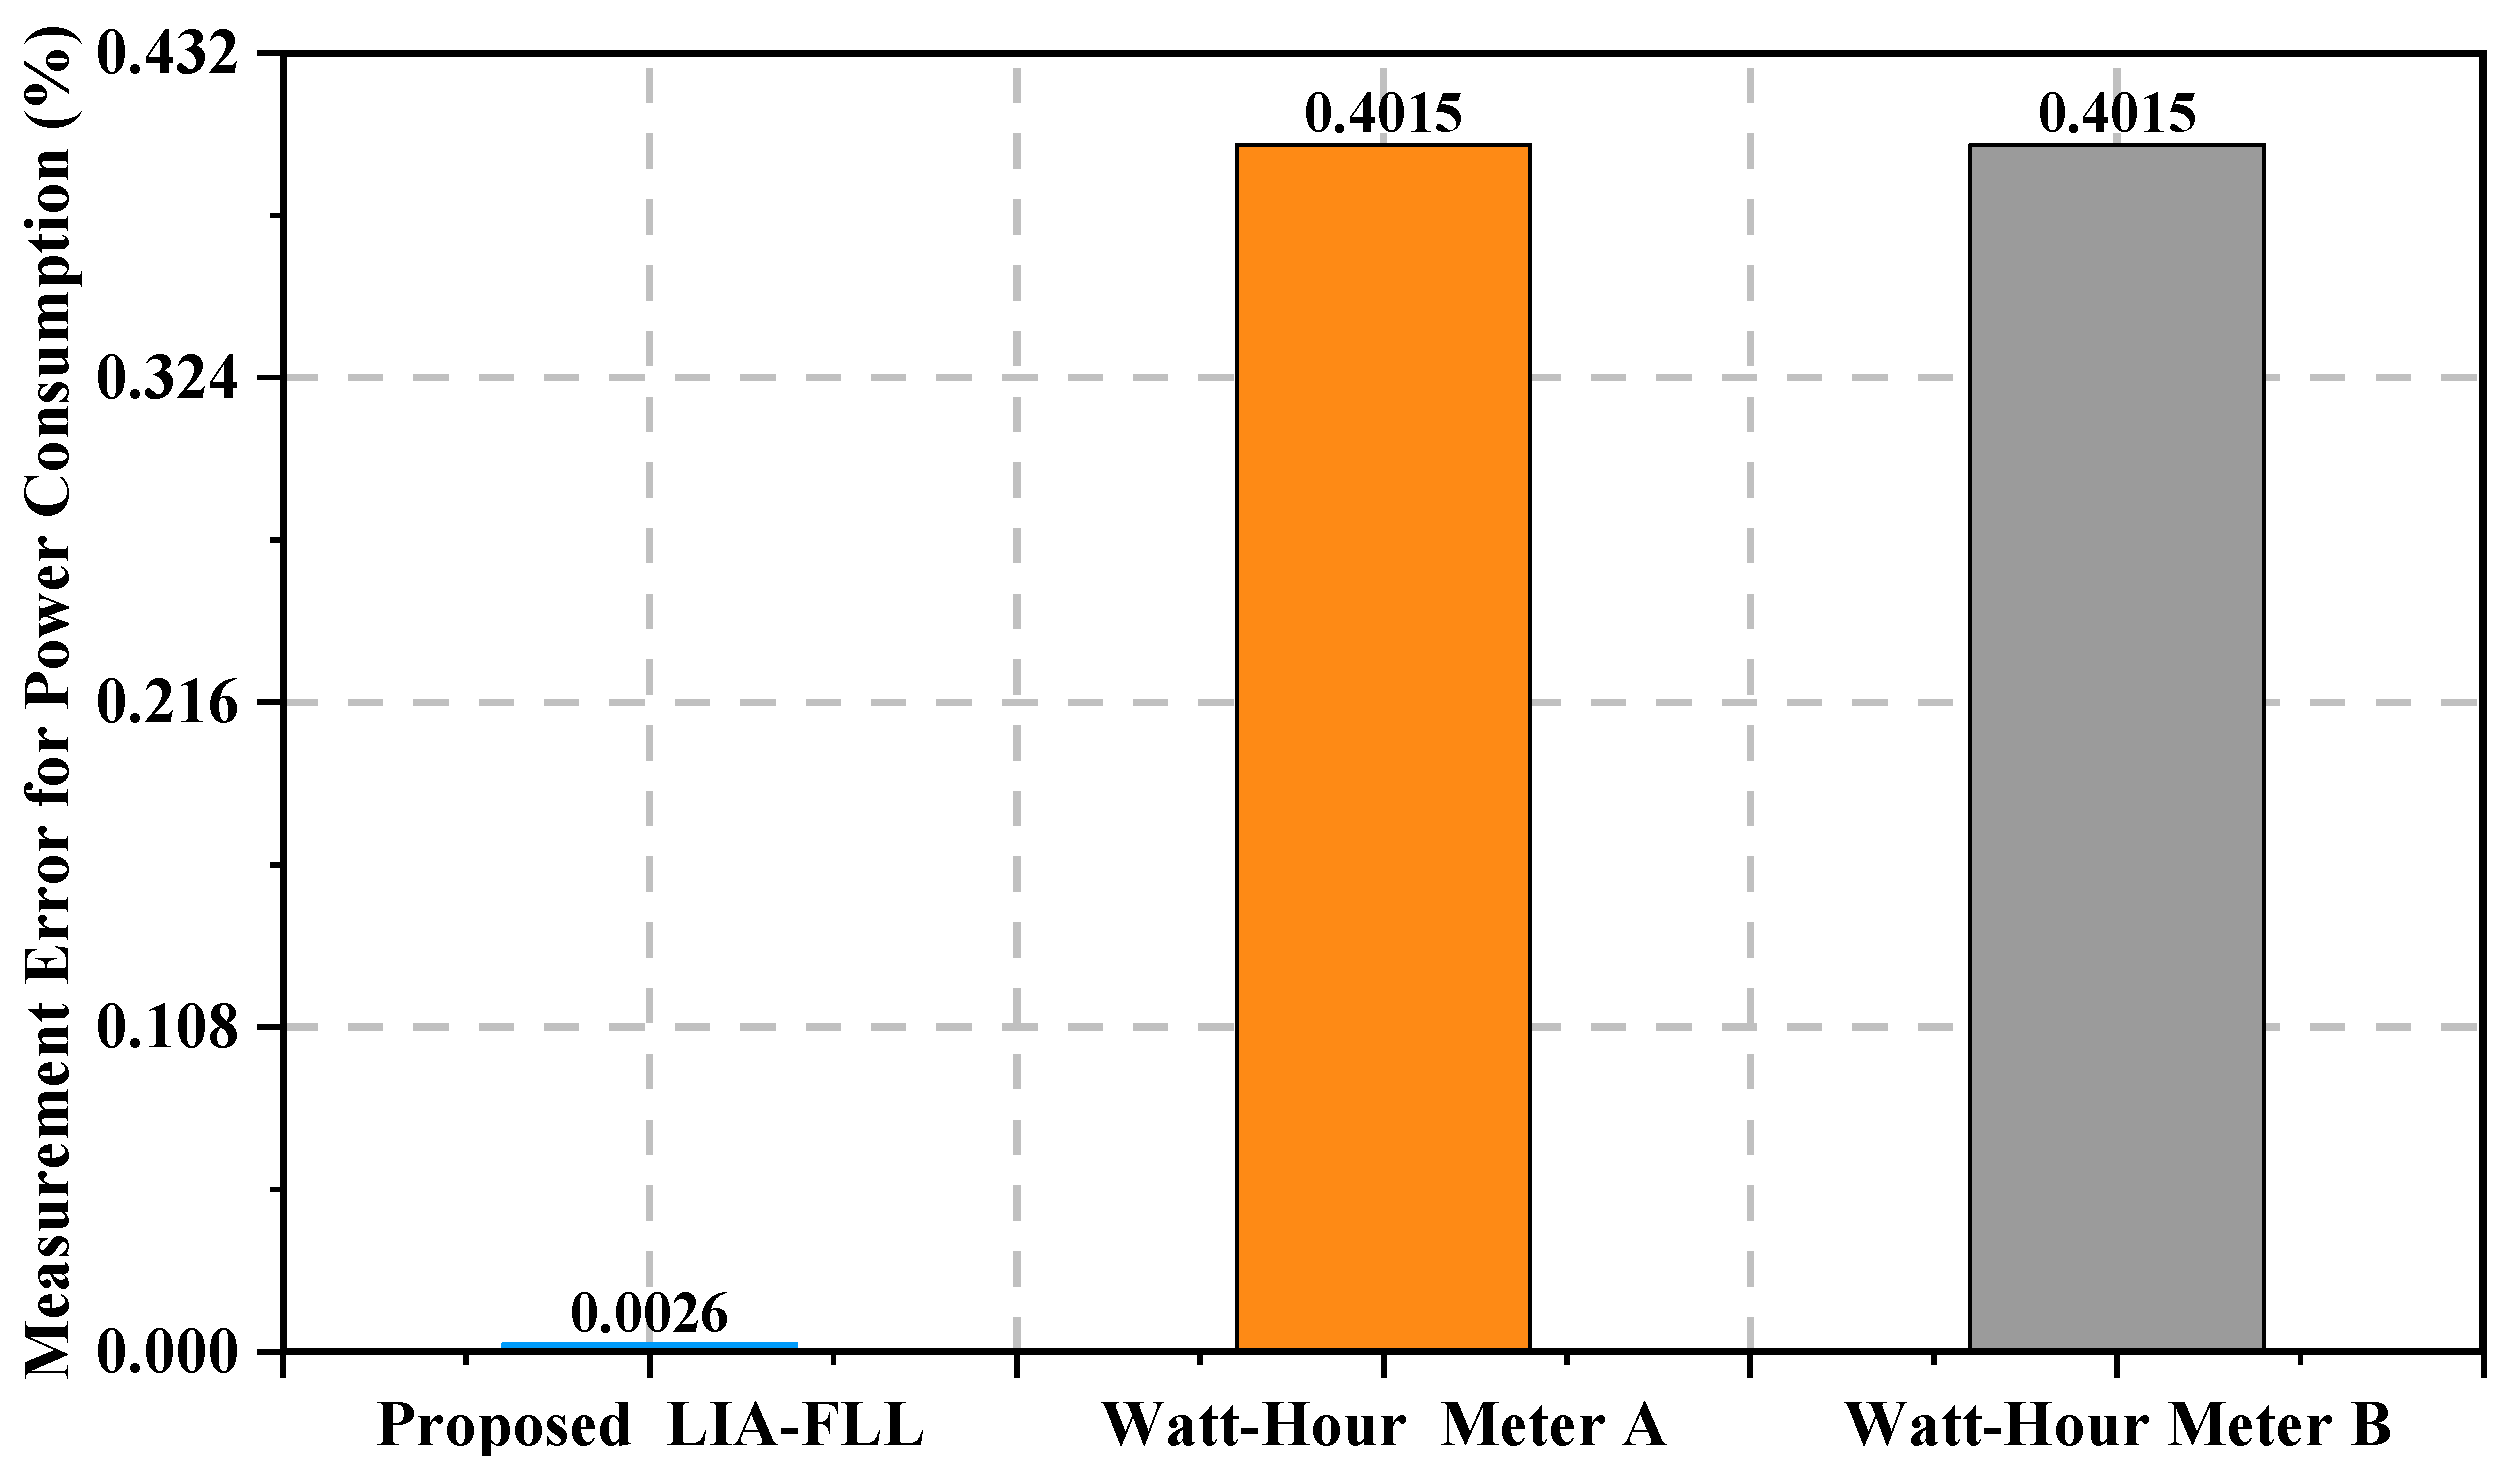
3.5. Power Consumption Measurement with LIA-FLL and Commercial Watt-Hour Meter
4. Conclusions
Author Contributions
Funding
Data Availability Statement
Conflicts of Interest
References
- Chen, X.; Qu, G.; Tang, Y.; Low, S.; Li, N. Reinforcement Learning for Selective Key Applications in Power Systems: Recent Advances and Future Challenges. IEEE Trans. Smart Grid 2022, 13, 2935–2958. [Google Scholar] [CrossRef]
- Fattaheian-Dehkordi, S.; Abbaspour, A.; Fotuhi-Firuzabad, M.; Lehtonen, M. A Distributed Framework for Intense Ramping Management in Distribution Networks. IEEE Trans. Smart Grid 2023, 14, 315–327. [Google Scholar] [CrossRef]
- Wang, Q.; Dong, Z.; Li, R.; Wang, L. Renewable energy and economic growth: New insight from country risks. Energy 2022, 238, 122018. [Google Scholar] [CrossRef]
- Santos, J.A.; Fraga, H.; Malheiro, A.C.; Moutinho-Pereira, J.; Dinis, L.-T.; Correia, C.; Moriondo, M.; Leolini, L.; Dibari, C.; Costafreda-Aumedes, S.; et al. A Review of the Potential Climate Change Impacts and Adaptation Options for European Viticulture. Appl. Sci. 2020, 10, 3092. [Google Scholar] [CrossRef]
- Natur, S.; Damri, O.; Agam, G. The Effect of Global Warming on Complex Disorders (Mental Disorders, Primary Hypertension, and Type 2 Diabetes). Int. J. Environ. Res. Public Health 2022, 19, 9398. [Google Scholar] [CrossRef] [PubMed]
- Hakuba, M.Z.; Stephens, G.L.; Christophe, B.; Nash, A.E.; Foulon, B.; Bettadpur, S.V.; Tapley, B.D.; Webb, F.H. Earth’s Energy Imbalance Measured from Space. IEEE Trans. Geosci. Remote Sens. 2019, 57, 32–45. [Google Scholar] [CrossRef]
- Khalili, S.; Breyer, C. Review on 100% Renewable Energy System Analyses—A Bibliometric Perspective. IEEE Access 2022, 10, 125792–125834. [Google Scholar] [CrossRef]
- Perera, F. Pollution from fossil-fuel combustion is the leading environmental threat to global pediatric health and equity: Solutions exist. Int. J. Environ. Res. Public Health 2018, 15, 16. [Google Scholar] [CrossRef]
- Costea, M.; Leonida, T. The Difficulty to accurately assess the Active Losses due to Harmonics. In Proceedings of the 2022 20th International Conference on Harmonics & Quality of Power (ICHQP), Naples, Italy, 29 May–1 June 2022. [Google Scholar] [CrossRef]
- Medina, A.; Segundo-Ramirez, J.; Ribeiro, P.; Xu, W.; Lian, K.L.; Chang, G.W.; Dinavahi, V.; Watson, N.R. Harmonic Analysis in Frequency and Time Domain. IEEE Trans. Power Deliv. 2013, 28, 1813–1821. [Google Scholar] [CrossRef]
- Wang, X.; Blaabjerg, F. Harmonic Stability in Power Electronic-Based Power Systems: Concept, Modeling, and Analysis. IEEE Trans. Smart Grid 2019, 10, 2858–2870. [Google Scholar] [CrossRef]
- Chen, C.-I.; Chen, Y.-C. Comparative Study of Harmonic and Interharmonic Estimation Methods for Stationary and Time-Varying Signals. IEEE Trans. Ind. Electron. 2014, 61, 397–404. [Google Scholar] [CrossRef]
- Chen, S.; Zhang, T.; Gooi, H.B.; Masiello, R.D.; Katzenstein, W. Penetration Rate and Effectiveness Studies of Aggregated BESS for Frequency Regulation. IEEE Trans. Smart Grid 2016, 7, 167–177. [Google Scholar] [CrossRef]
- Nguyen, N.; Mitra, J. An Analysis of the Effects and Dependency of Wind Power Penetration on System Frequency Regulation. IEEE Trans. Sustain. Energy 2016, 7, 354–363. [Google Scholar] [CrossRef]
- Xu, B.; Dvorkin, Y.; Kirschen, D.S.; Silva-Monroy, C.A.; Watson, J.-P. A comparison of policies on the participation of storage in U.S. frequency regulation markets. In Proceedings of the 2016 IEEE Power and Energy Society General Meeting (PESGM), Boston, MA, USA, 17–21 July 2016. [Google Scholar] [CrossRef]
- Wu, W.; Mu, X.; Xu, Q.; Mu, X.; Ji, F.; Bao, J.; Ouyang, Z. Effect of Frequency Offset on Power Measurement Error in Digital Input Electricity Meters. IEEE Trans. Instrum. Meas. 2018, 67, 559–568. [Google Scholar] [CrossRef]
- Garcia, F.D.; Marafao, F.P.; de Souza, W.A.; da Silva, L.C.P. Power Metering: History and Future Trends. In Proceedings of the 2017 Ninth Annual IEEE Green Technologies Conference (GreenTech), Denver, CO, USA, 29–31 March 2017; pp. 26–33. [Google Scholar] [CrossRef]
- Kwak, E.-S.; Moon, J.; Moon, C.-J. Analysis of Power System Stability by Deployment of Renewable Energy Resources. J. Korea Inst. Electron. Commun. Sci. 2021, 16, 1975–8170. [Google Scholar] [CrossRef]
- Barlow, H.M. Some New High-Frequency Wattmeters Operated by Forces Arising from a Rate of Change of Electromagnetic Momentum. IEEE Trans. Instrum. Meas. 1966, 15, 333–337. [Google Scholar] [CrossRef]
- Maisel, J.E.; Klingshirn, E.A. Low-Frequency Spectral Analysis Using a Dynamometer-Type Wattmeter. IEEE Trans. Educ. 1982, 25, 74–77. [Google Scholar] [CrossRef]
- Wagner, V.; Balda, J.; Griffith, D.; McEachern, A.; Barnes, T.; Hartmann, D.; Phileggi, D.; Emannuel, A.; Horton, W.; Reid, W.; et al. Effects of harmonics on equipment. IEEE Trans. Power Deliv. 1993, 8, 672–680. [Google Scholar] [CrossRef]
- Balci, M.; Hocaoglu, M. Comparison of power definitions for reactive power compensation in nonsinusoidal conditions. In Proceedings of the 2004 11th International Conference on Harmonics and Quality of Power (IEEE Cat. No.04EX951), Lake Placid, NY, USA, 12–15 September 2004; pp. 519–524. [Google Scholar] [CrossRef]
- Souza, L.R.; Godoy, R.B.; de Souza, M.A.; Junior, L.G.; de Brito, M.A.G. Sampling Rate Impact on Electrical Power Measurements Based on Conservative Power Theory. Energies 2021, 14, 6285. [Google Scholar] [CrossRef]
- Grinfogels, E.; Apse-Apsitis, P.; Senfelds, A.; Avotins, A.; Porins, R. Electrical Power Measurement Method Comparison Using Statistical Analysis. In Proceedings of the 2018 IEEE 59th International Scientific Conference on Power and Electrical Engineering of Riga Technical University (RTUCON), Riga, Latvia, 12–13 November 2018. [Google Scholar]
- Babuta, A.; Gupta, B.; Kumar, A.; Ganguli, S. Power and energy measurement devices: A review, comparison, discussion, and the future of research. Measurement 2021, 172, 108961. [Google Scholar] [CrossRef]
- Czarnecki, L.S. Budeanu and fryze: Two frameworks for interpreting power properties of circuits with nonsinusoidal voltages and currents. Electr. Eng. 1997, 80, 359–367. [Google Scholar] [CrossRef]
- Richards, G.G.; Tan, O.T.; Czarnecki, L.S. Comments on “considerations on the reactive power in nonsinusoidal situations”. IEEE Trans. Instrum. Meas. 1986, IM-35, 365–366. [Google Scholar] [CrossRef]
- Sołjan, Z.; Zajkowski, M. Extension and Correction of Budeanu Power Theory Based on Currents’ Physical Components (CPC) Theory for Single-Phase Systems. Energies 2022, 15, 8321. [Google Scholar] [CrossRef]
- Wang, Y.; Cheng, Y.; Chen, K.; Wang, L.; Wang, H. A Software Digital Lock-In Amplifier Method with Automatic Frequency Estimation for Low SNR Multi-Frequency Signal. Appl. Sci. 2022, 12, 6431. [Google Scholar] [CrossRef]
- Zhang, C.; Liu, H.; Ge, J.; Dong, H. FPGA-Based Digital Lock-in Amplifier with High-Precision Automatic Frequency Tracking. IEEE Access 2020, 8, 123114–123122. [Google Scholar] [CrossRef]
- Paz, F.; Ordonez, M. High-Performance Solar MPPT Using Switching Ripple Identification Based on a Lock-In Amplifier. IEEE Trans. Ind. Electron. 2016, 63, 3595–3604. [Google Scholar] [CrossRef]
- Kishore, K.; Akbar, S.A. Evolution of Lock-In Amplifier as Portable Sensor Interface Platform: A Review. IEEE Sens. J. 2020, 20, 10345–10354. [Google Scholar] [CrossRef]
- Maya-Hernandez, P.M.; Sanz-Pascual, M.T.; Calvo, B. Low-power analog lock-in amplifier for high-resolution portable sensing systems. In Proceedings of the 2016 IEEE International Symposium on Circuits and Systems (ISCAS), Montreal, QC, Canada, 22–25 May 2016; pp. 486–489. [Google Scholar] [CrossRef]
- Ferreira, J.A.; Petraglia, A. Analog integrated lock-in amplifier for optical sensors. IEEE Instrum. Meas. Mag. 2017, 20, 43–50. [Google Scholar] [CrossRef]
- Choudhury, B.K.; Jena, P. A Digital Lock-In Amplifier Assisted Active Islanding Detection Technique for DC Microgrids. IEEE Trans. Ind. Appl. 2023, 59, 377–391. [Google Scholar] [CrossRef]
- Khan, R.A.; Ashraf, M.N.; Choi, W. A Harmonic Compensation Method Using a Lock-In Amplifier under Non-Sinusoidal Grid Conditions for Single Phase Grid Connected Inverters. Energies 2021, 14, 597. [Google Scholar] [CrossRef]
- Ashraf, M.N.; Khan, R.A.; Choi, W. A Novel Selective Harmonic Compensation Method for Single-Phase Grid-Connected Inverters. IEEE Trans. Ind. Electron. 2021, 68, 4848–4858. [Google Scholar] [CrossRef]
- IEEEXplore. Available online: https://ieeexplore.ieee.org/iel7/9848438/9848439/09848440.pdf (accessed on 8 March 2023).
- CyberKEPCO. Available online: https://cyber.kepco.co.kr/ckepco/front/jsp/CO/H/htmlView/COHAHP00908.jsp# (accessed on 8 March 2023).


| Parameter | Measurement |
|---|---|
| Voltage | 220.121 |
| Current | 4.5249 |
| Power | 996.03 |
| Parameter | Voltage | Current |
|---|---|---|
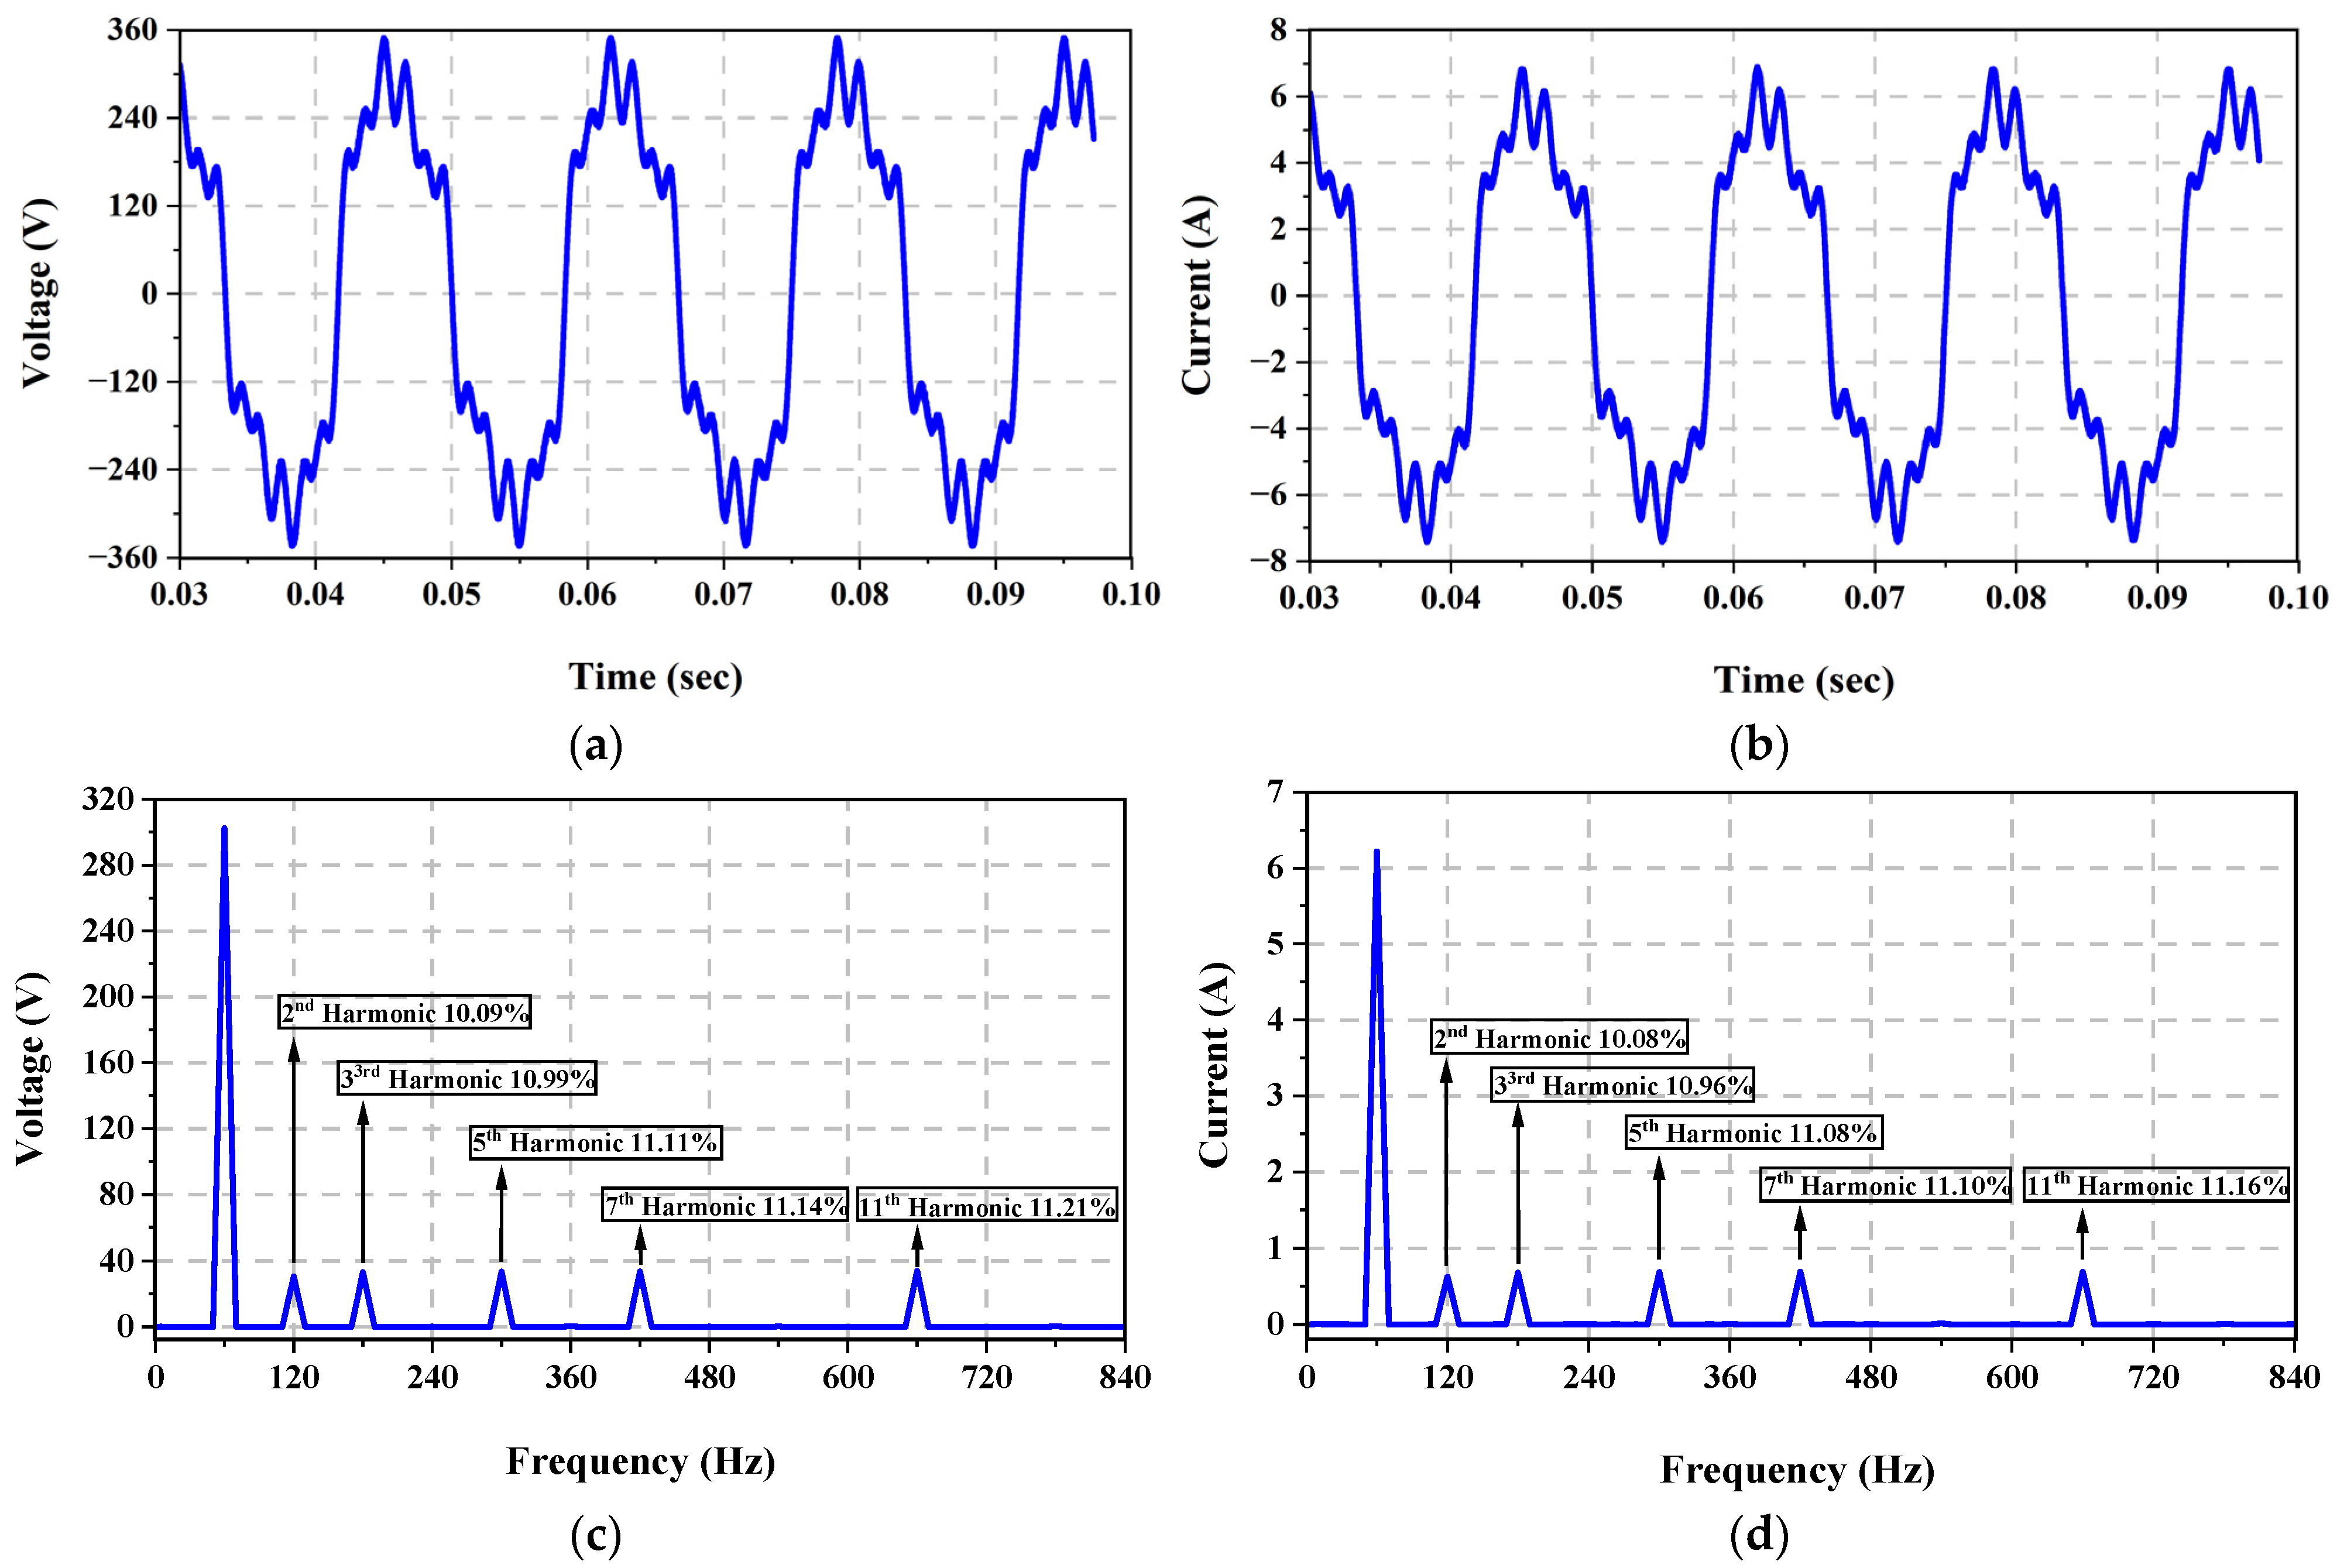
| Fundamental Wave | 100% | 100% |
| 2nd Harmonic | 10.09% | 10.08% |
| 3rd Harmonic | 10.99% | 10.96% |
| 5th Harmonic | 11.11% | 11.08% |
| 7th Harmonic | 11.14% | 11.10% |
| 11th Harmonic | 11.21% | 11.16% |
| THD | 24.41% | 24.33% |
| Parameter | ZERA | |
|---|---|---|
| Voltage [V] | Fundamental Wave | 213.8697 |
| 2nd Harmonic | 21.5794 | |
| 3rd Harmonic | 23.5042 | |
| 5th Harmonic | 23.7609 | |
| 7th Harmonic | 23.8250 | |
| 11th Harmonic | 23.9748 | |
| Current [A] | Fundamental Wave | 4.3959 |
| 2nd Harmonic | 0.4431 | |
| 3rd Harmonic | 0.4818 | |
| 5th Harmonic | 0.4870 | |
| 7th Harmonic | 0.4879 | |
| 11th Harmonic | 0.4905 | |
| Power [W] | Fundamental Wave | 940.1676 |
| 2nd Harmonic | 9.5634 | |
| 3rd Harmonic | 11.3243 | |
| 5th Harmonic | 11.5733 | |
| 7th Harmonic | 11.6255 | |
| 11th Harmonic | 11.7618 | |
| PT | Total Power | 996.0162 |
| Parameter | Proposed LIA-FLL | |
|---|---|---|
| Voltage [V] | Fundamental Wave | 213.8611 |
| 2nd Harmonic | 21.5789 | |
| 3rd Harmonic | 23.5026 | |
| 5th Harmonic | 23.7599 | |
| 7th Harmonic | 23.8239 | |
| 11th Harmonic | 23.9736 | |
| Current [A] | Fundamental Wave | 4.3960 |
| 2nd Harmonic | 0.4431 | |
| 3rd Harmonic | 0.4818 | |
| 5th Harmonic | 0.4870 | |
| 7th Harmonic | 0.4879 | |
| 11th Harmonic | 0.4906 | |
| Power [W] | Fundamental Wave | 940.1430 |
| 2nd Harmonic | 9.5633 | |
| 3rd Harmonic | 11.3236 | |
| 5th Harmonic | 11.5730 | |
| 7th Harmonic | 11.6247 | |
| 11th Harmonic | 11.7614 | |
| PT | Total Power | 995.9894 |
| Parameter | FFT | |
|---|---|---|
| Voltage [V] | Fundamental Wave | 213.8394 |
| 2nd Harmonic | 21.5410 | |
| 3rd Harmonic | 23.4410 | |
| 5th Harmonic | 23.7023 | |
| 7th Harmonic | 23.7186 | |
| 11th Harmonic | 23.8180 | |
| Current [A] | Fundamental Wave | 4.3948 |
| 2nd Harmonic | 0.4414 | |
| 3rd Harmonic | 0.4805 | |
| 5th Harmonic | 0.4850 | |
| 7th Harmonic | 0.4868 | |
| 11th Harmonic | 0.4902 | |
| Power [W] | Fundamental Wave | 939.7826 |
| 2nd Harmonic | 9.5094 | |
| 3rd Harmonic | 11.2650 | |
| 5th Harmonic | 11.4961 | |
| 7th Harmonic | 11.5481 | |
| 11th Harmonic | 11.6771 | |
| PT | Total Power | 995.2785 |
| Parameter | Classical Method |
|---|---|
| Voltage [V] | 219.9010 |
| Current [A] | 4.5204 |
| Power [W] | 994.0581 |
| Method | Power Consumption | %Error |
|---|---|---|
| ZERA | 498.000 Wh | - |
| Proposed LIA-FLL | 498.013 Wh | 0.0027% |
| Commercial Watt-Hour Meter A | 500.000 Wh | 0.4015% |
| Commercial Watt-Hour Meter B | 500.000 Wh | 0.4015% |
Disclaimer/Publisher’s Note: The statements, opinions and data contained in all publications are solely those of the individual author(s) and contributor(s) and not of MDPI and/or the editor(s). MDPI and/or the editor(s) disclaim responsibility for any injury to people or property resulting from any ideas, methods, instructions or products referred to in the content. |
© 2023 by the authors. Licensee MDPI, Basel, Switzerland. This article is an open access article distributed under the terms and conditions of the Creative Commons Attribution (CC BY) license (https://creativecommons.org/licenses/by/4.0/).
Share and Cite
Rehman, A.; Cho, K.; Choi, W. A Novel Power Measurement Method Using Lock-In Amplifiers with a Frequency-Locked Loop. Electronics 2023, 12, 2219. https://doi.org/10.3390/electronics12102219
Rehman A, Cho K, Choi W. A Novel Power Measurement Method Using Lock-In Amplifiers with a Frequency-Locked Loop. Electronics. 2023; 12(10):2219. https://doi.org/10.3390/electronics12102219
Chicago/Turabian StyleRehman, Abdur, Kangcheoul Cho, and Woojin Choi. 2023. "A Novel Power Measurement Method Using Lock-In Amplifiers with a Frequency-Locked Loop" Electronics 12, no. 10: 2219. https://doi.org/10.3390/electronics12102219