1. Introduction
Multi-class classification is a fundamental task in Machine Learning (ML), with applications in various domains such as healthcare, finance, and transportation [
1]. With the increasing availability of resources and the growing amount of data being produced, we have seen the development of successful models and algorithms for multi-class classification. An example of a fuzzy-based algorithm that can be utilized to address the multi-class classification problem is the Fuzzy Random Forest (FRF), which is an ensemble of many Fuzzy Decision Trees (FDTs) [
2,
3]. This algorithm combines the advantages of fuzzy logic and random forests to provide a powerful and accurate tool for classification tasks.
However, as these models become more accurate, they also become more complex, harder to understand, and can be viewed as black boxes. This can be a major issue when it comes to gaining insight into how the model makes its predictions and building trust in its decision-making process. In critical domains such as healthcare, the ability to explain and understand the model’s predictions is essential for gaining the trust of stakeholders and ensuring the safety and well-being of individuals and society [
4,
5].
In response to the increasing need for explainable and interpretable models in Machine Learning, the research community has begun to develop methods and algorithms to increase the transparency of ML models and make them more accessible to a broader range of stakeholders. The techniques for achieving explainability in Machine Learning can be divided into native and post-hoc approaches. The first ones involve using ML models that are inherently interpretable and transparent, such as linear/logistic regression, decision trees, and association rules [
6,
7]. These models are easy to interpret and understand as they have a simple mathematical structure. The decisions made by these models are usually based on a small number of features.
On the other hand, post-hoc approaches involve generating explanations for the predictions made by black-box models, such as random forests and neural networks. These models are challenging to interpret and comprehend due to their complex mathematical structures, and the decisions generated by these models are commonly based on a multitude of features. Consequently, these post-hoc approaches use techniques such as feature importance analysis, model distillation, and local interpretable model-agnostic explanations. These last techniques aim to find a local explanation of a decision for a particular instance x. Typically, these methods generate a set of inputs (neighbours of x), analyse the answers provided by the system to be explained, and then create a simpler model from which a local explanation can be derived [
8,
9,
10]. Such explanations are beneficial for understanding the decision-making process of black-box models and can provide valuable insights into the factors that influence the predictions.
One of the most renowned post-hoc explanation methods is Local Rule-Based Explanations (LORE, [
11]). This method generates a set of interpretable and human-readable rules that describe the reasoning behind the model’s decision for a specific input. LORE first identifies the input features (or a subset of them) that are most essential for the model’s decision on the vicinity of the point to be explained, and then creates a set of “if-then” rules (in the form of a decision tree) that describe the relationships between those features and the model’s output. Furthermore, the method also generates a set of “counterfactual” rules, which illustrate the minimal changes in feature values that would alter the model’s decision for a given input. These counterfactual explanations are particularly useful in domains such as healthcare, as they can help practitioners decide which actions to take in order to achieve a desired outcome, rather than just providing a list of important features that led to the decision. Although LORE has been demonstrated to be effective in explaining classical Machine Learning-based systems [
11], there may be room for improvement when it comes to explaining fuzzy-based systems, which are characterized by their utilization of fuzzy logic and uncertainty.
In previous works, we proposed two LORE-inspired methods for explaining the decisions made by fuzzy-based systems, called C-LORE-F [
12] and Fuzzy-LORE [
13]. C-LORE-F is an extension of LORE that incorporates additional information about the fuzzy sets that define the meaning of the linguistic values of the fuzzy attributes, and uses this information in the generation of neighbours of the studied instance. However, C-LORE-F has some limitations, such as the low quality of the obtained counterfactual instances, the limited scope of the basic explanation, and the rigidity of the method. On the other hand, Fuzzy-LORE addresses the shortcomings of standard LORE-based methods by employing fuzzy decision trees as an alternative to classical decision trees. Nevertheless, these methods can only be used to explain binary-class classifiers.
In this work, we propose a novel method, called multi-class Fuzzy-LORE (mcFuzzy-LORE), which extends Fuzzy-LORE to provide explanations for multi-class fuzzy-based classifiers such as fuzzy random forests. It could also be applied to explain binary fuzzy-based classifiers, as they are a special case of the multi-class classifiers. mcFuzzy-LORE is a model-agnostic method, meaning it can be applied to any machine-learning model without requiring knowledge of its internal structure or parameters. We evaluated the proposed method on a private dataset that was utilized to train an FRF-based multi-class classifier that assesses the risk of developing diabetic retinopathy in diabetic patients. The experimental results indicate that, according to several metrics, mcFuzzy-LORE outperforms the prior classical LORE-based methods, mainly in the generation of counterfactual instances.
The rest of this article is structured as follows. First,
Section 2 provides an overview of the related works. Then,
Section 3 defines and formulates the problem.
Section 4 explains the proposed method.
Section 5 describes the experimental setup and discusses the obtained results. Finally, in
Section 6, we conclude the paper and list some points for future work.
2. Related Work
Explainable Artificial Intelligence (XAI) has become an increasingly important field of research in recent years, particularly as complex Machine Learning models are used more frequently in decision-making processes with significant real-world consequences. Understanding and interpreting the decisions made by these systems is critical for ensuring transparency, fairness, and accountability. In the literature, numerous works focus on providing local explanations by constructing an interpretable model that mimics the behaviour of the system to be explained for a given instance. This approach is called post-hoc, model-surrogate explanation [
7,
10]. It can be model-agnostic or model-specific. Model-agnostic methods aim to provide explanations that are independent of the underlying mathematical model. In contrast, the model-specific explanation methods aim to explain how a specific ML model arrived at a particular decision [
7]. Most proposed post-hoc methods use crisp interpretable ML models (e.g., linear regression, decision tree). For example, the LIME (Local Interpretable Model-agnostic Explanations) method [
9] creates a linear regression model that approximates the behaviour of the underlying system for a specific instance. SHAP (Shapley Additive Explanations) [
5] uses decision trees to develop an explanation method to assign feature importance scores to each input attribute by determining their Shapley values from coalition game theory. It is beneficial, in some cases, to generate not only factual explanations for the decisions made by black-box models, but also counterfactual explanations, which describe how the decision would have changed if the value of the input attributes had been different. Counterfactual explanations can help users understand why a certain decision was made and provide insights into how the outcome of the decision-making process could be changed. As mentioned in the introduction, one popular method for generating factual and counterfactual explanations is LORE [
11], which uses decision trees to derive local explanations for individual instances.
Recently, there has been growing interest in using fuzzy logic to develop explanation methods [
14]. The linguistic modeling and similarity to human reasoning make fuzzy logic [
15] a useful formalism for providing explanations. Alonso et al. Alonso Moral [
16] explore the potential of fuzzy logic in advancing the field of XAI. They discuss how fuzzy logic can be applied to develop explainable models, such as fuzzy rule-based systems and fuzzy clustering, which provide interpretable and transparent representations of the decision-making process. They also highlight important research directions for applying fuzzy logic in XAI, such as developing techniques for combining fuzzy logic with other XAI approaches, exploring new applications of fuzzy logic in XAI, and developing methods for validating and testing fuzzy logic-based models. Mencar and Alonso [
17] provide an overview of how fuzzy modeling can be used to facilitate the development of XAI systems. They highlight the advantages of fuzzy logic in effectively representing uncertain and imprecise information, making it a valuable tool for decision-making in complex systems. Mendel and Bonissone [
18] argued that rule-based fuzzy inference systems are well-suited for XAI due to their inherent interpretability. They explained that fuzzy logic allows for representing imprecise and uncertain information in a way similar to human reasoning, making it a valuable tool for decision-making in complex and uncertain environments. The authors in [
19] proposed an adaptation of the LIME method by replacing the local linear regression model with a fuzzy rule-based one constructed using a two-steps method: weighted fuzzy clustering and parameter estimation for local fuzzy rules. They showed that their adapted method outperforms the original LIME method in terms of fidelity. Additionally, the fuzzy rules generated by their method are more interpretable and semantically sound.
As aforementioned, this work focuses on developing a method for extracting local factual and counterfactual explanations for multi-class fuzzy-based systems using fuzzy decision trees. The related works most relevant to our research are those presented in [
20,
21,
22]. The authors in [
20] proposed a method for generating factual and counterfactual rules from decision trees. Initially, they identify all the rules that resulted in a label different than the one produced by the system to be explained and considered them as candidate counterfactual rules. Then, they rank these rules based on their distance to the rule with the same label as the instance being explained and the highest confidence. The authors in [
21] introduced CF-MABLAR, a rule generation framework for Mamdani fuzzy classification systems, which is an extension of the MARkov BLAnket Rules (MABLAR) framework. By approximating the causal links between inputs and outputs of fuzzy systems, CF-MABLAR can generate counterfactual rules based on these approximations. The authors of [
22] presented a method similar to the proposed method in this work for generating factual and counterfactual explanations from fuzzy decision trees. They emphasized the benefits of using fuzzy decision trees, which can activate multiple branches during inference and allow for factual explanations incorporating multiple rules rather than just one. Moreover, they suggested a method for generating counterfactual instances based on the given instance and the obtained factual rules. In contrast, our approach involves generating counterfactual rules and using them along with the given instance to generate counterfactual instances, as detailed in
Section 4.
3. Problem Formulation
In this section, we first recall the basic notations used in the classification of tabular data. Subsequently, we outline the problem of explaining the outcomes produced by black box models and introduce the concept of explanation, for which we offer a proposed solution.
Consider a tabular data classification problem where the input data is represented by a set of instances, X, and each instance has a set of features . Y represents the output labels, and each instance is associated with a label . The goal of a classifier is to learn a mapping from instances to labels, represented by a function . In this context, Y can either be nominal or ordinal. Nominal labels are categorical values with no inherent order or ranking. On the other hand, ordinal labels are categorical values with a defined order.
The problem of providing an explanation for a black box multi-class classifier is defined as follows.
A black box classifier, b, is a type of fuzzy machine learning model that utilizes a specific method to fuzzify the input attributes. It takes in a set of input features, x, and produces an output, y, while keeping its internal workings or decision-making process undisclosed. Therefore, we have access to the input features and the classifier’s outputs. The goal is to provide an explanation, e, for the decision . The approach considered to solve this problem in this work is to learn a fuzzy decision tree (FDT) classifier, t, that accurately mimics the behavior of the black-box classifier in a neighborhood of x. The explanation for the decision is then derived from the fuzzy decision tree. This method focuses on the local behavior of the black box rather than trying to understand the whole black box model, b.
Hence, we define the explanation e as a triplet , where:
is the set of decision rules of the FDT that are applicable to the instance x and have y as output. Each rule tells which conditions are satisfied by the object x for being classified as y. Thus, they indicate several minimal sets of conjunctive conditions on the attributes values necessary for assigning x to that label.
is the set of counterfactual rules, formed by the decisions rules of the FDT that lead to different labels.
is a set of counterfactual instances, which represent examples of objects that do not belong to class y and have minimum changes in the attributes values with respect to the original input object x.
4. Proposed Method
We propose mcFuzzy-LORE, an extension of the binary method Fuzzy-LORE [
13], for obtaining explanations of multi-class black box classification systems based on fuzzy linguistic variables.
The first step of mcFuzzy-LORE is to generate a set of synthetic neighbours of the instance of interest based on the method proposed in C-LORE-F [
23]. Second, it constructs a local interpretable FDT model using the induction algorithm proposed in [
24]. Finally, mcFuzzy-LORE constructs an explanation, which contains the rules used to classify the instance of interest, as well as counterfactual rules and counterfactual instances extracted by analysing the FDT. The following subsections explain the steps of mcFuzzy-LORE in detail.
4.1. Neighbours Generation
Algorithm 1 outlines the procedure for generating neighbors of a given instance. The algorithm takes as input the instance to be explained (x), the black box system (b), the class (y) assigned to x by the black box, the set of labels (or classes) of interest (), an auxiliary set (T), and the maximum depth of analysis (d).
The choice of the labels of interest, , to consider in the generation of the explanation depends on the nature of Y. It could be determined by the user, but in general, if Y is nominal, may contain all labels in Y. However, if Y is ordinal, should contain y and its previous and next labels. Thus, if y is the k-th label in Y, then . This set will only contain two elements if y is the first or the last label in Y. The rationale for this definition is that, in the case of having a set of ordered labels, the individuals near x will probably belong to y or similar classes, not to distant classes, so it would not make sense to look for close neighbours of x that belong to all classes.
The auxiliary set T is used to generate examples that are classified with labels in . It can be a subset of the original training set for b or another dataset with a similar distribution. The maximum depth parameter d restricts the exploration of the space around x during the generation process.
The result of the algorithm is a set that contains synthetic neighbours of x, which are labelled by b with the classes of interest.
The key part of the generation process is the
function, which is based on the C-LORE-F method [
23]. It defines the neighbours’ generation as a search problem and explores the neighbourhood space of a point
x by applying a Uniform Cost Search algorithm. The
function receives an instance
x, a label
y, a black box system
b, and a maximum depth
d and returns a set of neighbours to
x which are assigned to the label
y using the black box
b.
| Algorithm 1: Neighbours Generation. |
![Electronics 12 02215 i001]() |
The algorithm starts by initializing the set of neighbours, , as an empty set. The function gives a set of neighbours ( ) of the instance x that are assigned by b to y, the same label as x. After that, for each label different from y in the set of labels of interest , we find the closest example to x in the auxiliary set T with that label. We denote this instance by . Subsequently, we use the function to generate neighbours of that belong to the class (according to b). We then add these neighbors to . Thus, at the end this set contains individuals similar to x that belong to all the classes of interest. The resulting synthetic and multi-class dataset, , can be used to construct a fuzzy decision tree, as elaborated in the following section.
4.2. FDT Construction
The second step in the mcFuzzy-LORE method involves constructing a multi-class fuzzy decision tree (FDT) based on the neighbours of x obtained in the first step. This stage aims to create a concise and understandable model that emulates the behaviour of the black-box classifier and facilitates the derivation of explanations.
We consider that the black-box model
b has a set of input attributes, where each attribute
is a linguistic variable with terms
, with associated fuzzy sets
that define a strong fuzzy partition. These same terms and fuzzy sets will be used in the generation of the explanations in order to facilitate their interpretation.
Figure 1 shows as an example the linguistic variable EVOL with its terms and membership functions defined on a numerical reference scale.
The algorithm for constructing the FDT in mcFuzzy-LORE is based on the classic ID3 method of induction of trees. In particular, we have considered the fuzzified version proposed by Yuan and Shaw [
24] for its simplicity and good performance [
25]. The induction procedure has two key parameters: the significance level (
) and the truth level threshold (
). These parameters guide the tree construction process, with
filtering out evidence that is not significant enough and
regulating the growth of the tree by setting a minimum threshold for ending a branch. Empirical results suggest that
and
are appropriate values for these parameters [
26].
The main steps to construct the FDT are the following:
- 1.
Select the best attribute as the root of the tree, based on the ambiguity function [
3].
- 2.
For each linguistic term of the selected attribute, create a branch with examples that have support at least equal to , and compute the truth level of classification for each class.
- 3.
If the truth level of classification is above for at least one class, the branch is terminated, and the label is set as the class with the highest truth level.
- 4.
Otherwise, check if an additional attribute will further reduce the classification ambiguity. If that is the case, select the best one as a new decision node of the branch and repeat step 2 until no further growth is possible.
- 5.
If no further growth is possible, the branch is terminated as a leaf with a label corresponding to the class with the highest truth level.
Once the tree has been constructed, each branch can be considered as a classification rule, with a degree of support equal to the truth level of its conclusion. These rules have the following structure:
when a given individual
x has to be classified with the FDT, the Mamdani inference procedure is used in the following way:
- 1.
Calculate the activation level of the conditions of each rule using the t-norm minimum, and determine the membership of
x to the conclusion class
y by multiplying the satisfaction level of the premises and the degree of support, i.e.,
, of the rule. This value
will also be called the
confidence of the rule.
- 2.
Combine the memberships for the same class given by different rules using the t-conorm maximum, obtaining the degree of membership of
x to each class
y.
is the set of rules of the FDT with conclusion
y.
- 3.
Select the class with the highest value as the final decision class.
4.3. Explanation Extraction from a FDT
The goal of mcFuzzy-LORE is to generate an explanation e in the form of . To this end, the rules generated by the FDT induction algorithm are categorized into two distinct groups, namely and . The former refers to rules with the conclusion y, the label assigned to the input x by the black box system. Conversely, the latter refers to rules having a label belonging to the set of labels of interest but different from y, i.e., . Therefore, we denote as the candidate decision rules and as the candidate counterfactual rules. Then, we can derive the explanation components as follows.
4.3.1. Decision Rules
The decision rules
are the rules used to explain the classification of an instance,
x, into a specific label,
y. The rules in
provide the foundation for the decision rules of the explanation. Unlike the classical LORE method [
11] that only has a single activated crisp rule, mcFuzzy-LORE allows for a more flexible explanation by including a subset of
in
. First, we sort the rules in
in descending order according to their confidence scores. Then, depending on the application and user preference,
can consist of all rules in
, the top
k rules with the highest confidence scores, or the set of rules with confidence above a certain threshold. In the experiments described in the next section, the top 3 rules with the highest confidence were included in
.
4.3.2. Counterfactual Rules and Instances
This step aims to identify alternative decision rules that are similar to those in , but lead to different outcomes. The final purpose is to generate counterfactual instances, which are individuals similar to x but that belong to a different class.
Algorithm 2 outlines the process for generating counterfactual explanations, which involves three inputs: x, the instance whose classification has to be explained; , the set of decision rules; and , the set of candidate counterfactual rules. The algorithm returns a tuple consisting of the set of counterfactual rules, , and the set of counterfactual instances, .
The algorithm first identifies the rule r with the highest confidence score v from the set of rules in using the function . The sets and are then initialized as empty sets.
For each rule
in the set of candidate counterfactual rules, the algorithm determines the label of this rule using the function
, i.e.,
. Then, the function
returns the set of conditions
in
that have an activation of less than
for
x. These are the conditions which could have a higher activation if the values of the corresponding attributes in
x were different. This higher activation would then lead to a different classification of
x.
| Algorithm 2: Extraction of counterfactual rules and instances. |
![Electronics 12 02215 i002]() |
Next, the function takes as input x and to generate a candidate counterfactual instance . To generate , a clone of x is first made to find an instance that is as similar as x. Afterwards, for each condition in , the value of in the cloned version of x is set to the center of the term . The center of the term is taken to obtain the maximum activation of the condition.
Finally, the confidence score
of the rule
is then recalculated using Equation (
2) for the instance
and the label
. If
, the rule
and the corresponding instance
are added to the sets
and
, respectively. If this is the case, we have found a counterfactual rule that would be activated with high confidence if some of the values of
x were different. These values are precisely those shown in the associated counterfactual instance.
4.4. Illustrative Example
The procedure for generating decision rules, counterfactual rules, and counterfactual instances can be illustrated with an example involving the diagnosis of diabetic retinopathy, which is the application that will be described in the experimental section. A random instance from the dataset is selected, denoted by x = (:65, :0, :10, :1, :10.5, :85.05, :160.0, :30.3, :0.0). This instance belongs to Class1. The membership degrees for each fuzzy variable in the form of ::, for all linguistic terms of , are the following:
: :0, :0, :0, :0, :1, :0, :0
: :1, :0
: 5:0, 5 10:0.5, 10 15:0.5, 15 20:0, 20:0
: :0, :1, :0
: 6:0, 6 7:0, 7 8:0, 8 9:0, 9:1
: :0, :0, :0, :0.9, :0.1
: :0, :1
: : 0, : 0, : 0, : 0,
:0.5, :0.5, :0
: :1, :0
The meaning of these attributes is described in the experimental section. Just to follow the example, please note that (treatment) is a discrete attribute, and its values are encoded as 0: Diet, 1: OralAntidiab, and 2: Insuline. Therefore, the condition , for example, would be activated with a degree of membership of 1 if the value of in x were 2.
In this example, the top rule from the set of rules that concludes with “Class1” is selected as the only decision rule, denoted by the set . The rule is the following:
:
Thus, will return and .
The following two rules are considered from the set of candidate counterfactual rules:
:
:
In the case of , by invoking the function, the value of would be . Applying the function to would result in a candidate counterfactual instance, = ::::::::. Consequently, the new confidence score for the the rule would be 0.5 instead of 0.0. As it is greater than , and its associated counterfactual instance would be added to the set of counterfactual rules and instances, respectively. Note that the only difference between the counterfactual instance and x is the value of the treatment attribute .
For , would take the value . Applying the function to this rule would return :: :::::, where the values in bold represent the modified attributes. The resulting confidence score for would now be 0.5. Since this score is higher than the value of v, i.e., 0.36, we would add and its corresponding counterfactual instance to their respective sets.
5. Experiments and Results
We have considered two separate evaluations. In the first one, explained in
Section 5.1, we compare the performance of mc-FuzzyLORE with LORE [
11] and C-LORE-F [
23]. In the second evaluation, described in
Section 5.2, we evaluate the quality of the generated counterfactual instances.
In this work, we conducted experiments using the Diabetic-Retinopathy (DR) dataset. It is a private dataset obtained from the Sant Joan de Reus Hospital. These data were used to construct a multi-class fuzzy random forest classifier for DR identification, with four distinct levels: NoDR, Mild, Moderate, and Severe. Each instance in the dataset is characterized by nine attributes (six numerical and three categorical): current age, sex, years since diabetes detection, type of diabetes treatment, control of arterial hypertension, HbA1c level, glomerular filtration rate estimated by the CKD-EPI value, microalbuminuria, and body mass index.
Table 1 provides information about the dataset. It was split into training (80%) and testing (20%) subsets. In this study we have used the testing subset to perform the experiments.
5.1. Evaluation of the Explanation Results
In this subsection, we compare the performance of the proposed method with the LORE and C-LORE-F methods. Since these two methods were initially designed for binary classifiers, we adapted them to work with multi-class classifiers using the one-vs-all multi-classification method. This adaptation involved treating each class as the positive class and all the other classes as the negative class. The results of these two methods are the average of the results of the four cases.
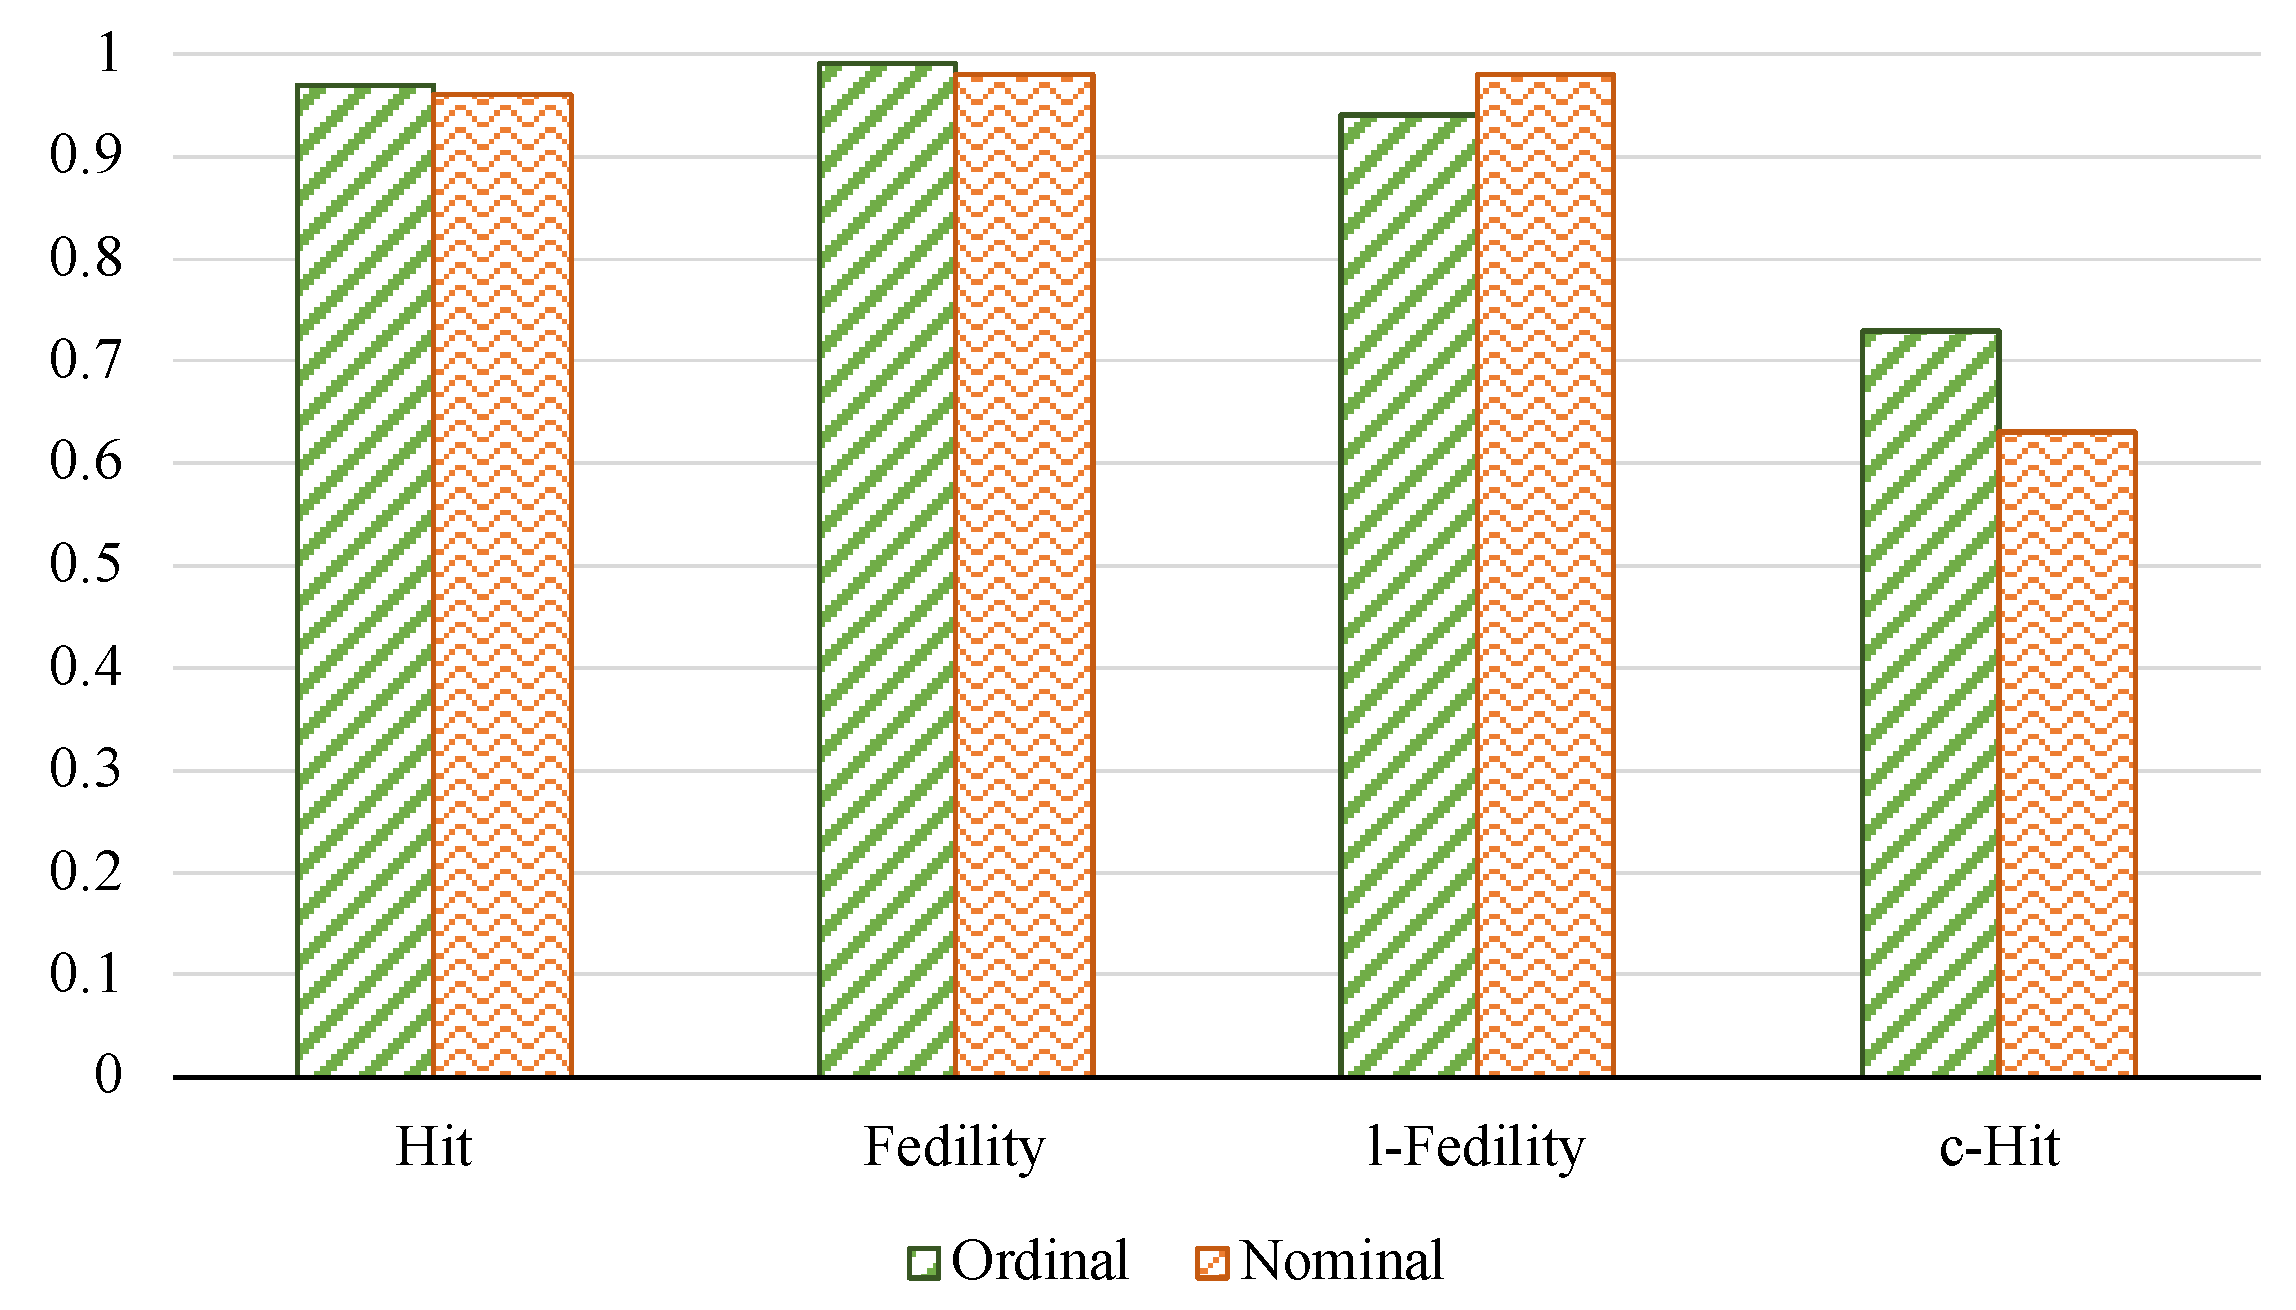
The following evaluation metrics have been considered:
Hit: this metric assesses how similar the output of the explanation model (FDT) is to the black box model, b, for all test instances. It returns 1 if they are equal and 0 otherwise.
Fidelity: it measures how well the explanation model can replicate the black-box model’s behaviour for a specific input, x. It assesses how well the explanation model can imitate the black box by comparing its predictions to those of the black box for the generated neighbours, .
l-Fidelity: it is similar to the fidelity, but it is calculated on a subset of , which are the neighbours that belong to the same class than x and activate at least one of the explanation rules, . It is used to measure to what extent these rules are good at mimicking the blackbox model on similar data of the same class.
c-Hit: evaluates the similarity between the predictions made by the explanation model and the black box model on all counterfactual instances of x, .
Table 2 presents the results of the evaluation of the explanation model, considering the case in which the class labels are nominal. The results indicate that C-LORE-F and mcFuzzy-LORE outperform LORE in terms of the Hit metric. This finding suggests that C-LORE-F is a more advantageous neighbour generation method than LORE. In terms of the Fidelity and l-Fidelity metrics, the performance is very similar, with C-LORE-F showing a slightly better performance. Regarding the c-Hit metric, mcFuzzy-LORE offers more significant counterfactual explanations than LORE and C-LORE-F.
Furthermore, we investigated the performance of mcFuzzy-LORE under two different scenarios, considering that the labels in the DR dataset are nominal or ordinal, as explained in
Section 4.1. For the nominal case, we generated neighbours from all labels in
Y, while for the ordinal case, we generated neighbours for the classes
, where
. The results of this analysis are presented in
Figure 2. We did not observe any significant differences in the hit, fidelity, and l-fidelity metrics. However, the c-Hit metric improves in the ordinal case, indicating that the proposed method generated more focused and precise counterfactual explanations. In conclusion, the results suggest that mcFuzzy-LORE performs consistently and robustly under both nominal and ordinal label assumptions.
5.2. Evaluation of the Counterfactual Instances
Counterfactual instances are important for understanding the modifications required to obtain a different outcome, especially in healthcare applications. Therefore, it is crucial to have a variety of counterfactual instances that represent a broad range of possible modifications. Moreover, the suggested modifications should ideally be actionable, making them feasible to implement in real-world scenarios. For instance, age and race cannot be altered, and thus proposing them as modifications would not be actionable.
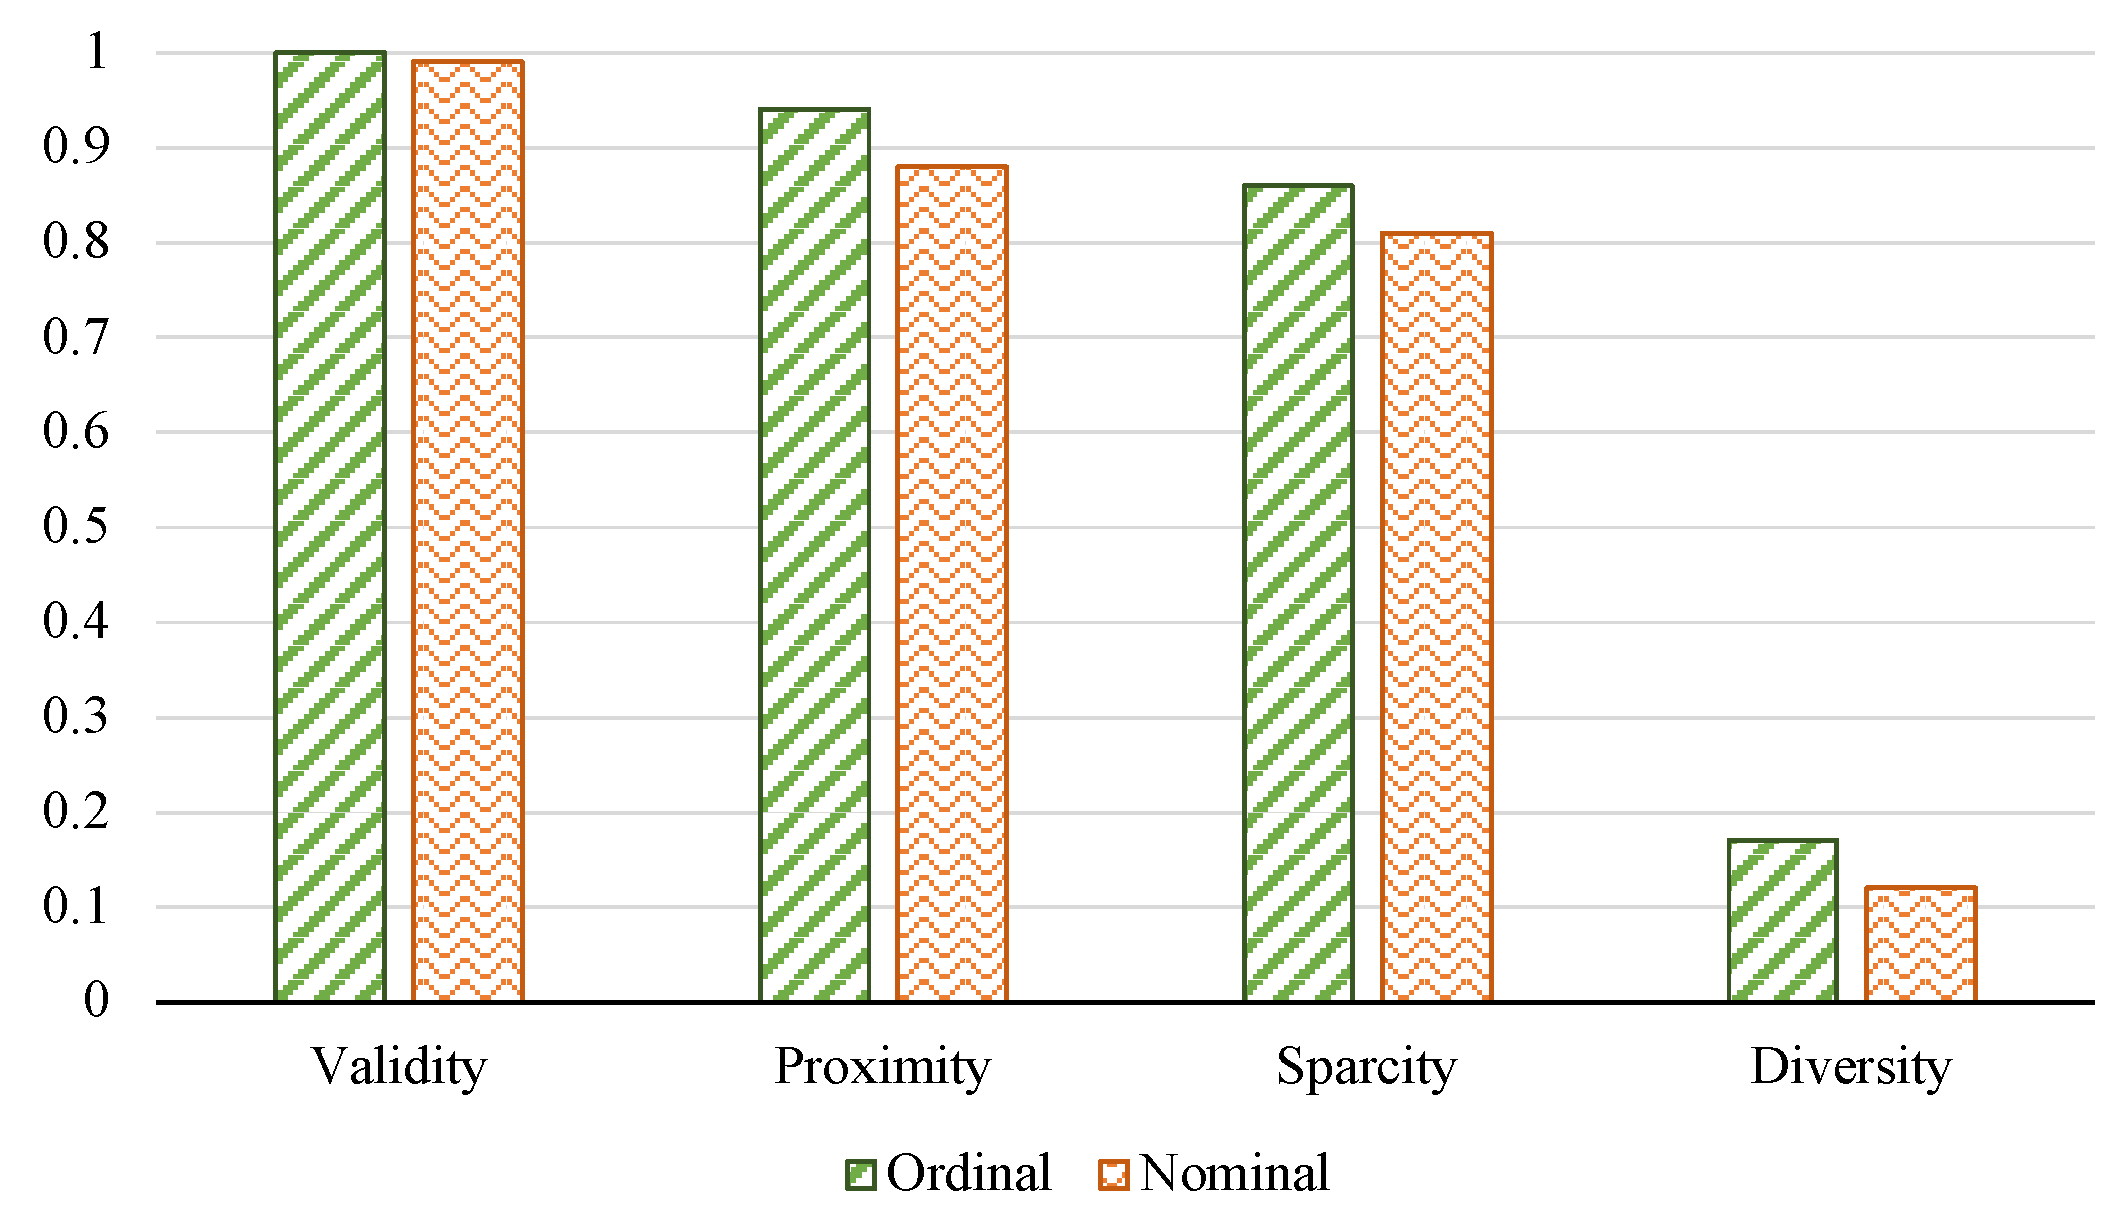
In this subsection, we assess the effectiveness of mcFuzzy-LORE in the generation of actionable and diverse counterfactual instances in the nominal and ordinal label scenarios. We use the following evaluation metrics [
27]:
Validity: it is the percentage of counterfactual instances with a different outcome than the original input
x.
Here refers to the set of returned counterfactual instances and b is the black-box model.
Proximity: it is the average feature-wise normalized distance between all counterfactual instances
and the original input
x.
where
is defined as the sum of differences between the corresponding feature values of
c and
x for each feature
:
The function
returns the difference between the values of
c and
x at the
i-th feature, taking into consideration whether it is categorical or continuous:
where
and
denote the number of categorical and continuous features, respectively. The indicator function
returns 1 if the condition is true, and 0 otherwise. The term
represents the median absolute deviation for the
i-th continuous feature [
28].
Sparsity: it quantifies the average number of changes in attribute values between a counterfactual instance and the original input (no change = sparsity 1, all values changed = sparsity 0).
Here, is the set of features, and is the indicator function.
Diversity: it is similar to proximity, but it measures the average distance between all pairs of counterfactual instances.
where
is the distance function defined in Equation (
7).
The results displayed in
Figure 3 reveal that the proposed method consistently constructs valid counterfactual instances regardless of whether the output variable is considered ordinal or nominal. In both cases, nearly all of the generated counterfactual instances have labels different from the one assigned to the input
x. In addition, the method’s performance is better in the ordinal case than in the nominal case in terms of the Proximity, Sparsity, and Diversity metrics. The obtained results for the Proximity and Sparsity metrics are significant for both nominal and ordinal cases, with scores surpassing 80% for both metrics, which indicates that the counterfactual instances produced by the proposed method show a high level of similarity to the original input (Proximity), and require minimal modifications to attribute values (Sparsity) to reach a counterfactual decision. The observed performance of both metrics suggests that the proposed method effectively generates meaningful and relevant counterfactual explanations that closely resemble the original input while minimizing the number of changes required to achieve a different decision. Overall, these findings highlight the promising potential of the proposed method in generating accurate and close counterfactual instances with minimal sparsity, which could be valuable for explaining and interpreting model predictions. Such findings are confirmed in the example shown in
Figure 4.
Considering the diversity scores, mcFuzzy-LORE shows a low average diversity score of less than 20%, which can be attributed to the proposed method’s goal of making minimal changes to alter the black box’s decision, resulting in dense and very similar counterfactual instances.
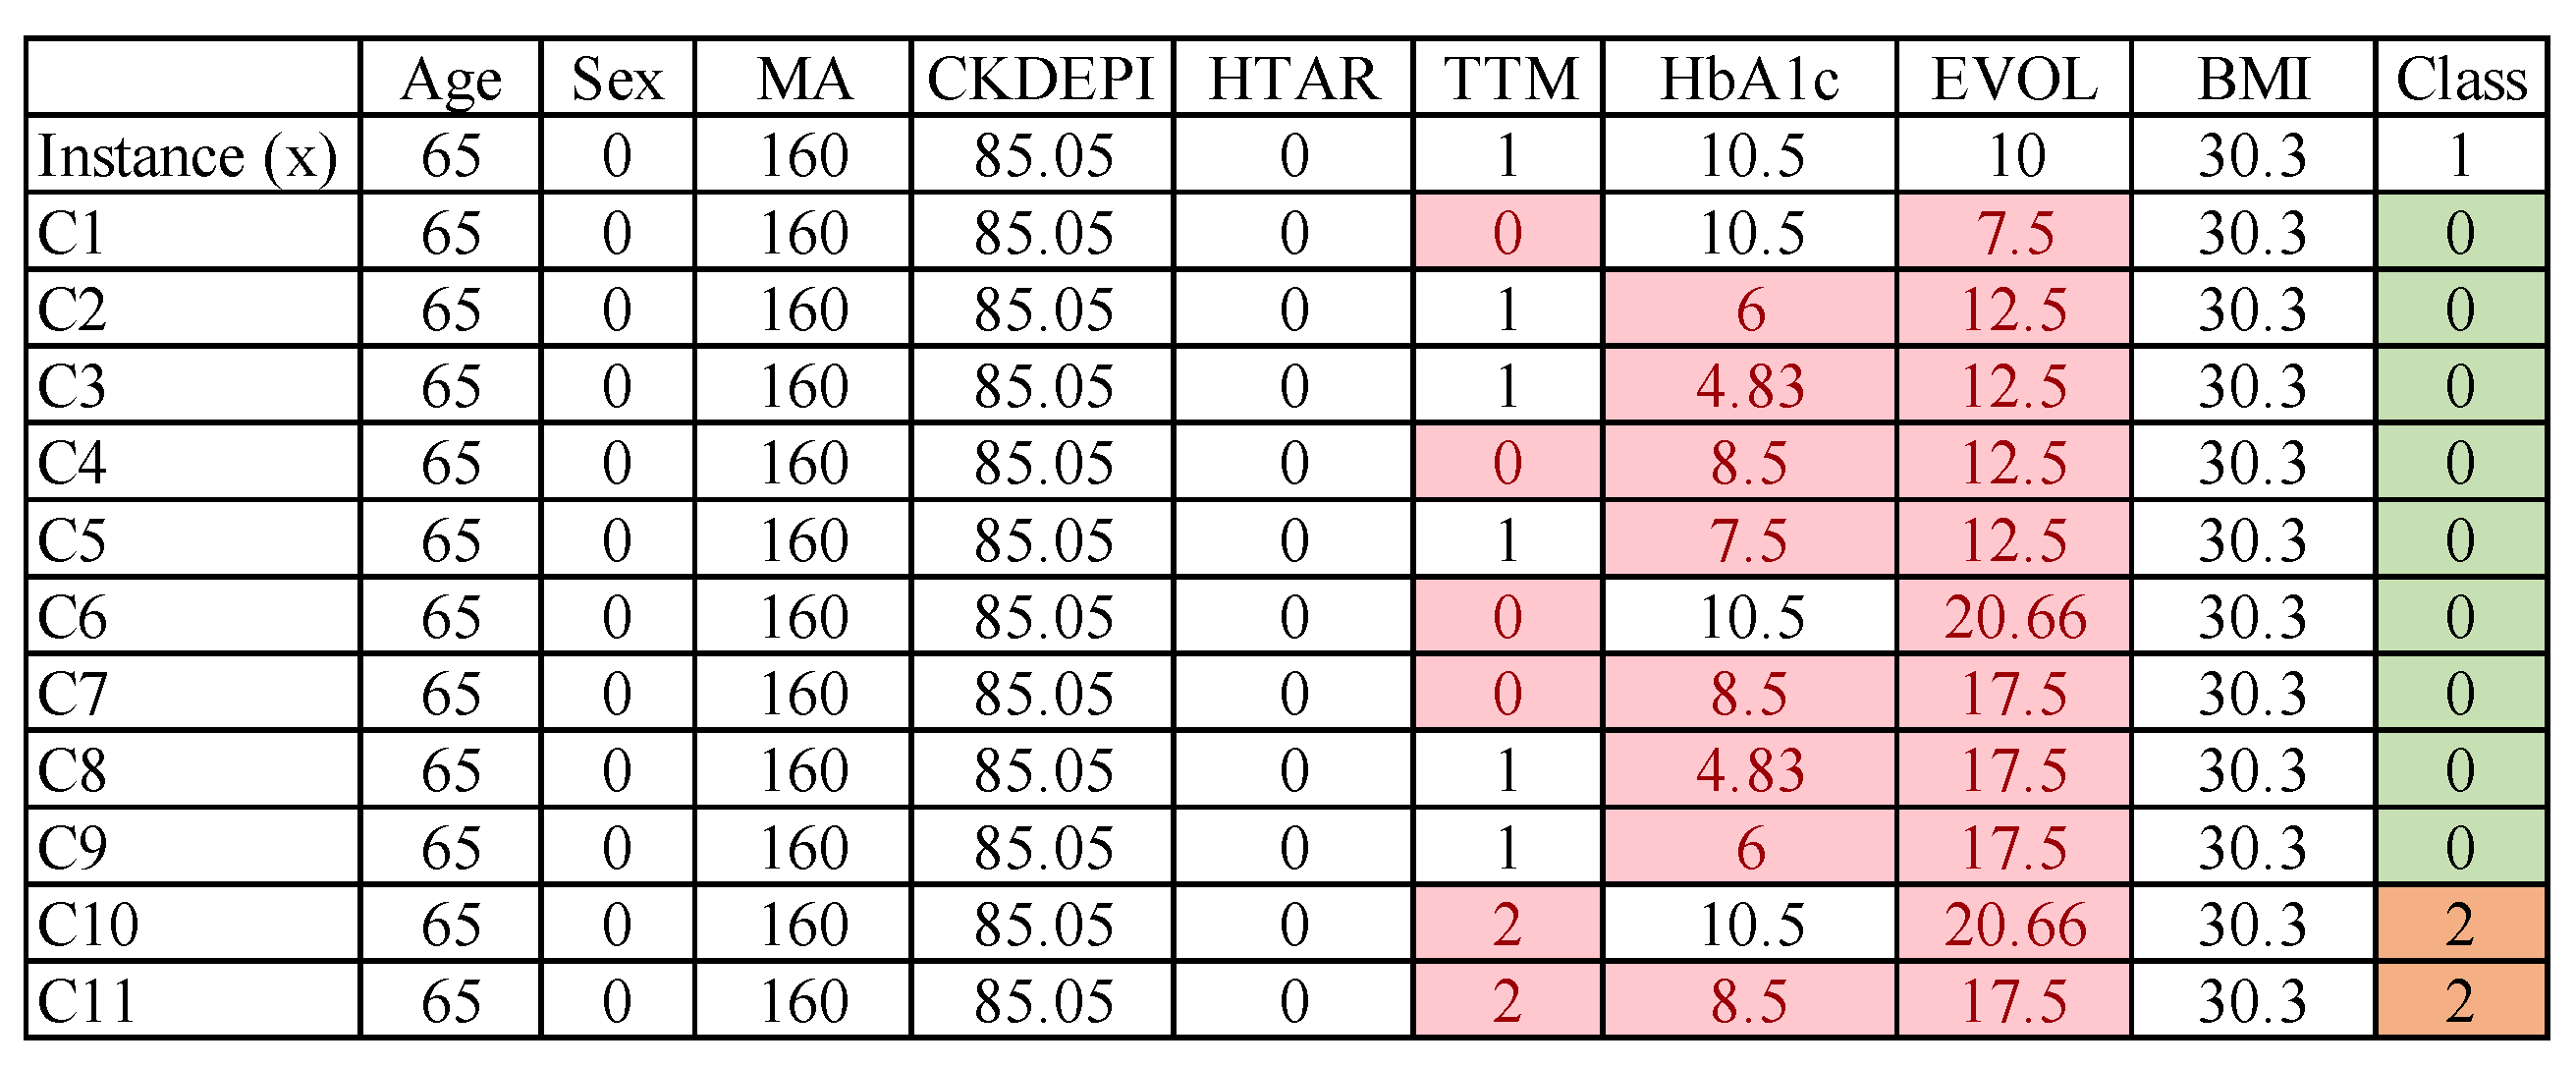
The table in
Figure 4 shows as an example an instance (
x), in the first row, and its generated counterfactual instances C1–C11. Highlighted cells refer to the features that have been changed in each counterfactual instance with respect to the original instance.
Figure 5 shows the scatter plot of the instance (
x) and its generated counterfactual instances. We utilized Principal Component Analysis (PCA) and k-Nearest Neighbors (k-NN) to plot a set of counterfactual instances in addition to the instance to explain, in a 2D plane, and draw the class boundaries. Initially, we performed PCA to reduce the dimensionality of the data to 2 dimensions. Next, we plotted the transformed data on a 2D scatterplot, with the first principal component on the
x-axis and the second principal component on the
y-axis. Subsequently, we employed k-NN as a classifier to segregate the classes and delineate the decision boundaries on the scatterplot.Improving the diversity of the generated counterfactual instances while retaining the main goal of making minimal changes is an area for future work.

 ,
, 


