Article

Photoplethysmography Data Reduction Using Truncated Singular Value Decomposition and Internet of Things Computing

by
Abdulrahman B. Abdelaziz
,
Mohammad A. Rahimi
,
Muhammad R. Alrabeiah
,
Ahmed B. Ibrahim
*,
Ahmed S. Almaiman
,
Amr M. Ragheb
and
Saleh A. Alshebeili
Electrical Engineering Department, King Saud University, Riyadh 11421, Saudi Arabia
*
Author to whom correspondence should be addressed.
Electronics 2023, 12(1), 220; https://doi.org/10.3390/electronics12010220
Submission received: 16 November 2022 / Revised: 23 December 2022 / Accepted: 26 December 2022 / Published: 2 January 2023
(This article belongs to the Topic Electronic Communications, IOT and Big Data)

Abstract

:
Biometric-based identity authentication is integral to modern-day technologies. From smart phones, personal computers, and tablets to security checkpoints, they all utilize a form of identity check based on methods such as face recognition and fingerprint-verification. Photoplethysmography (PPG) is another form of biometric-based authentication that has recently been gaining momentum, because it is effective and easy to implement. This paper considers a cloud-based system model for PPG-authentication, where the PPG signals of various individuals are collected with distributed sensors and communicated to the cloud for authentication. Such a model incursarge signal traffic, especially in crowded places such as airport security checkpoints. This motivates the need for a compression–decompression scheme (or a Codec for short). The Codec is required to reduce the data traffic by compressing each PPG signal before it is communicated, i.e., encoding the signal right after it comes off the sensor and before it is sent to the cloud to be reconstructed (i.e., decoded). Therefore, the Codec has two system requirements to meet: (i) produce high-fidelity signal reconstruction; and (ii) have a computationallyightweight encoder. Both requirements are met by the Codec proposed in this paper, which is designed using truncated singular value decomposition (T-SVD). The proposed Codec is developed and tested using a publicly available dataset of PPG signals collected from multiple individuals, namely the CapnoBase dataset. It is shown to achieve a 95% compression ratio and a 99% coefficient of determination. This means that the Codec is capable of delivering on the first requirement, high-fidelity reconstruction, while producing highly compressed signals. Those compressed signals do not require heavy computations to be produced as well. An implementation on a single-board computer is attempted for the encoder, showing that the encoder can average 300 milliseconds per signal on a Raspberry Pi 3. This is enough time to encode a PPG signal prior to transmission to the cloud.

1. Introduction

Identity authentication is essential for many modern devices and applications, from using smart phones and tablets to accessing sensitive applications such as banking and medical records. Authentication methods are generally classified into biometric or non-biometric. The former, such as the name suggests, relies entirely on a person’s biometric features, whereas theatter depends on software (e.g., personal passwords, a one-time password (OTP), and personal answers) or hardware tools (e.g., cards, keys, and radio frequency identification (RFID)). Although non-biometric methods are currently used everywhere, they are still unsafe because they can be stolen, forgotten, and forged. Such issues are not as relevant to biometric methods as non-biometric ones, spiking recent interest in fingerprint technology, face recognition [1,2,3,4], and PhotoPlethysmoGram (PPG) technology [5,6,7].
Authentication based on PPG signals has recently gained much attention [8,9,10,11,12,13,14,15]. This could be rooted in its practicality; PPG sensors are quite cheap, and authentication based on PPG is quite effective and accurate. Theatter has been empirically shown in a few studies conducted in theast six years, e.g., [8,10,11]. These studies show that PPG authentication can achieve something in the neighborhood of 99% authentication accuracy, suggesting it is quite a reliable approach. However, it is worth noting that its accuracy depends on the matching algorithm implemented, which is usually a machineearning algorithm.
The authentication process can either be performedocally (within the device holding the sensor) or in the cloud. The former is a common authentication model on smart phones, tablets, and computers, where there is enough processing power. On the other hand, the cloud authentication model is quite effective for scenarios where the sensors are deployed in a distributed andightweight manner. Examples include, but are notimited to, security checkpoints in airports, government buildings, and financial institutions. The sensors in this model are deployed in compact, computationallyimited, and distributed devices. They formed a cloud-connected network, making them part of the Internet of Things (IoT).

1.1. Problem Statement

As an IoT system, the cloud model for PPG authentication relies on its core to establish communicationinks between the distributed PPG sensors and the cloud. Those communicationinks vary inatency, reliability, and throughput (i.e., quality of service (QoS)), depending on the communication infrastructure (could be wireless, e.g., 5G/4G/3G cellular networks, which are popular for IoT applications because these support the dynamic and mobile nature of many applications; or wired, e.g., Ethernet and coaxial cable) used to set up thoseinks. The variability in QoS means that, in some cases, the communication infrastructure might not be able to handle the traffic generated by the distributed PPG sensors, which, in turn, translates into degradation in the authentication performance.
One interesting way to tackle the aforementioned issue is to reduce the traffic associated with the PPG sensors by compressing the PPG signals. The compression is performed using a Codec that has two components, the encoder and decoder. The former resides in the device where the sensor is deployed, and the other resides in the cloud. In principle, choosing to compress the PPG signals should be performed in a way that does not impact the IoT architecture and the performance of the authentication system. More specifically, it must comply with the following criteria: (i) the encoder should be computationallyight-weight so it can run on the device carrying the sensor; and (ii) the reconstruction fidelity must be high such that the recovered PPG signals could attain similar (if not the same) authentication performance of the raw uncompressed signals. Designing a Codec that meets the two criteria for a PPG-based cloud-authentication model is the main problem that this paper addresses.

1.2. Related Work

Most of the relevantiterature focuses on the authentication problem and how it is tackled [8,9,10,11,13,15]. In particular, previously proposed authentication algorithms rely on feature engineering and shallow machineearning. For example, Ref. [8] utilizes the discrete wavelet transform to extract features, and then applies support vector machines (SVMs) to identify individuals (authentication). Refs. [9,15] choose to extract features from the first and second derivatives of the PPG signal, but Ref. [15] augments those features with statistical feature extraction (e.g., median, mean... etc.). Ref. [9] applies the K-Nearest Neighbor (K-NN) on the extracted features to recognize individuals, while Ref. [15] compares several classifiers and picks a Gaussian regression process algorithm for the authentication task. Ref. [10] attempts to avoid the shortcomings of extracting features from the first and second derivatives. It proposes a dynamical-system model by which the PPG temporal signal is transformed into aimited-cycle signal. Then, inear and quadratic discriminant analysis (LDA and QDA) algorithms are compared to classify PPG signals. Ref. [13] applies a suite of classifiers on PPG signals filtered with empirical mode decomposition (EMD). A change of pace from the previous work is that done in Ref. [11], where the authors applied a deep feedforward neural network to classify handcrafted features.
On the other hand, PPG signal compression has also been addressed in theiterature, where there are two types of techniques, namelyossless andossy compression. Inossless compression techniques, the compressed signal could be reconstructed into its original form with the difference between the compressed signal and its reconstructed form being very minimal, whereas inossy compression techniques, the original signal is compressed such that it to removes the redundant and irrelevant data so that the reconstructed signal cannot be precisely reconstructed back into its original form [16]. In [17], the authors developed an improved segmented weak orthogonal matching pursuit (OMP) algorithm to compress and reconstruct ECG and PPG signals. Then, they used an SVM classifier to validate their method. In [18], the authors used a signal quality assessment method before using a gain-shape vector quantization technique to compress the PPG signal. In [19], the authors introduced an autoencoder as a deepearning algorithm along with a feature selection method to compress the PPG signal. In [20], the authors proposed aossy compression technique, namely a directightweight temporal compression method, to compress the data collected by wearable sensors. They validated the proposed method using both PPG and atmospheric pressure data.

1.3. Contribution and Paper Organization

This paper aimed to address the PPG signal compression problem in a way that meets the two conditions mentioned in Section 1.1, namely the computationallyight-weight encoder and the high-reconstruction fidelity. It proposes a T-SVD-based Codec and implements the Codec on a single-board computer. In particular, the contribution of this paper is two-fold:
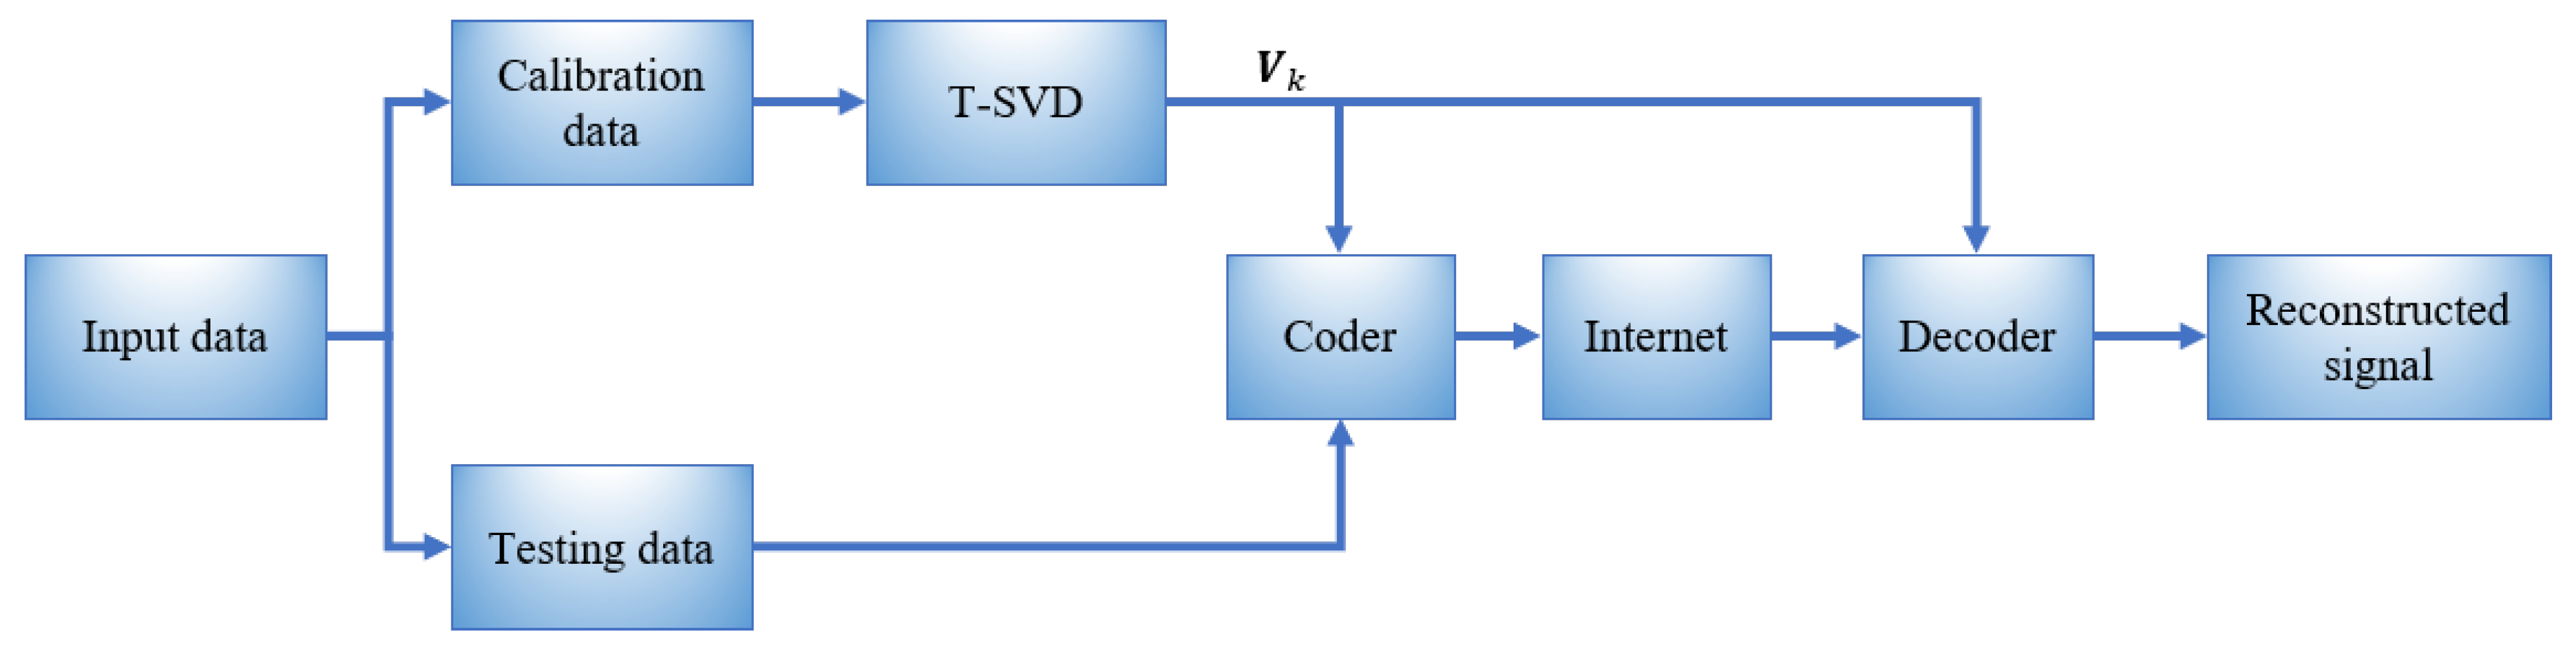
  • Designing a PPG signal codec using T-SVD. The decomposition is ainear technique that helps identify vector spaces for a non-square matrix. The PPG signals of various individuals are used to construct a reference non-square matrix. This matrix is decomposed using T-SVD to extract the singular values and construct two truncated projection matrices, one for compression and the other for reconstruction.
  • Implement and test the designed codec on an IoT setup. The compression matrix is deployed on a single-board computer, specifically a Raspberry Pi, and the reconstruction matrix is deployed on a personal computer (PC). The Raspberry Pi emulates the type of processing power commonly available in IoT devices, while the PC plays the role of the cloud. The purpose is to evaluate the applicability of the designed Codec.
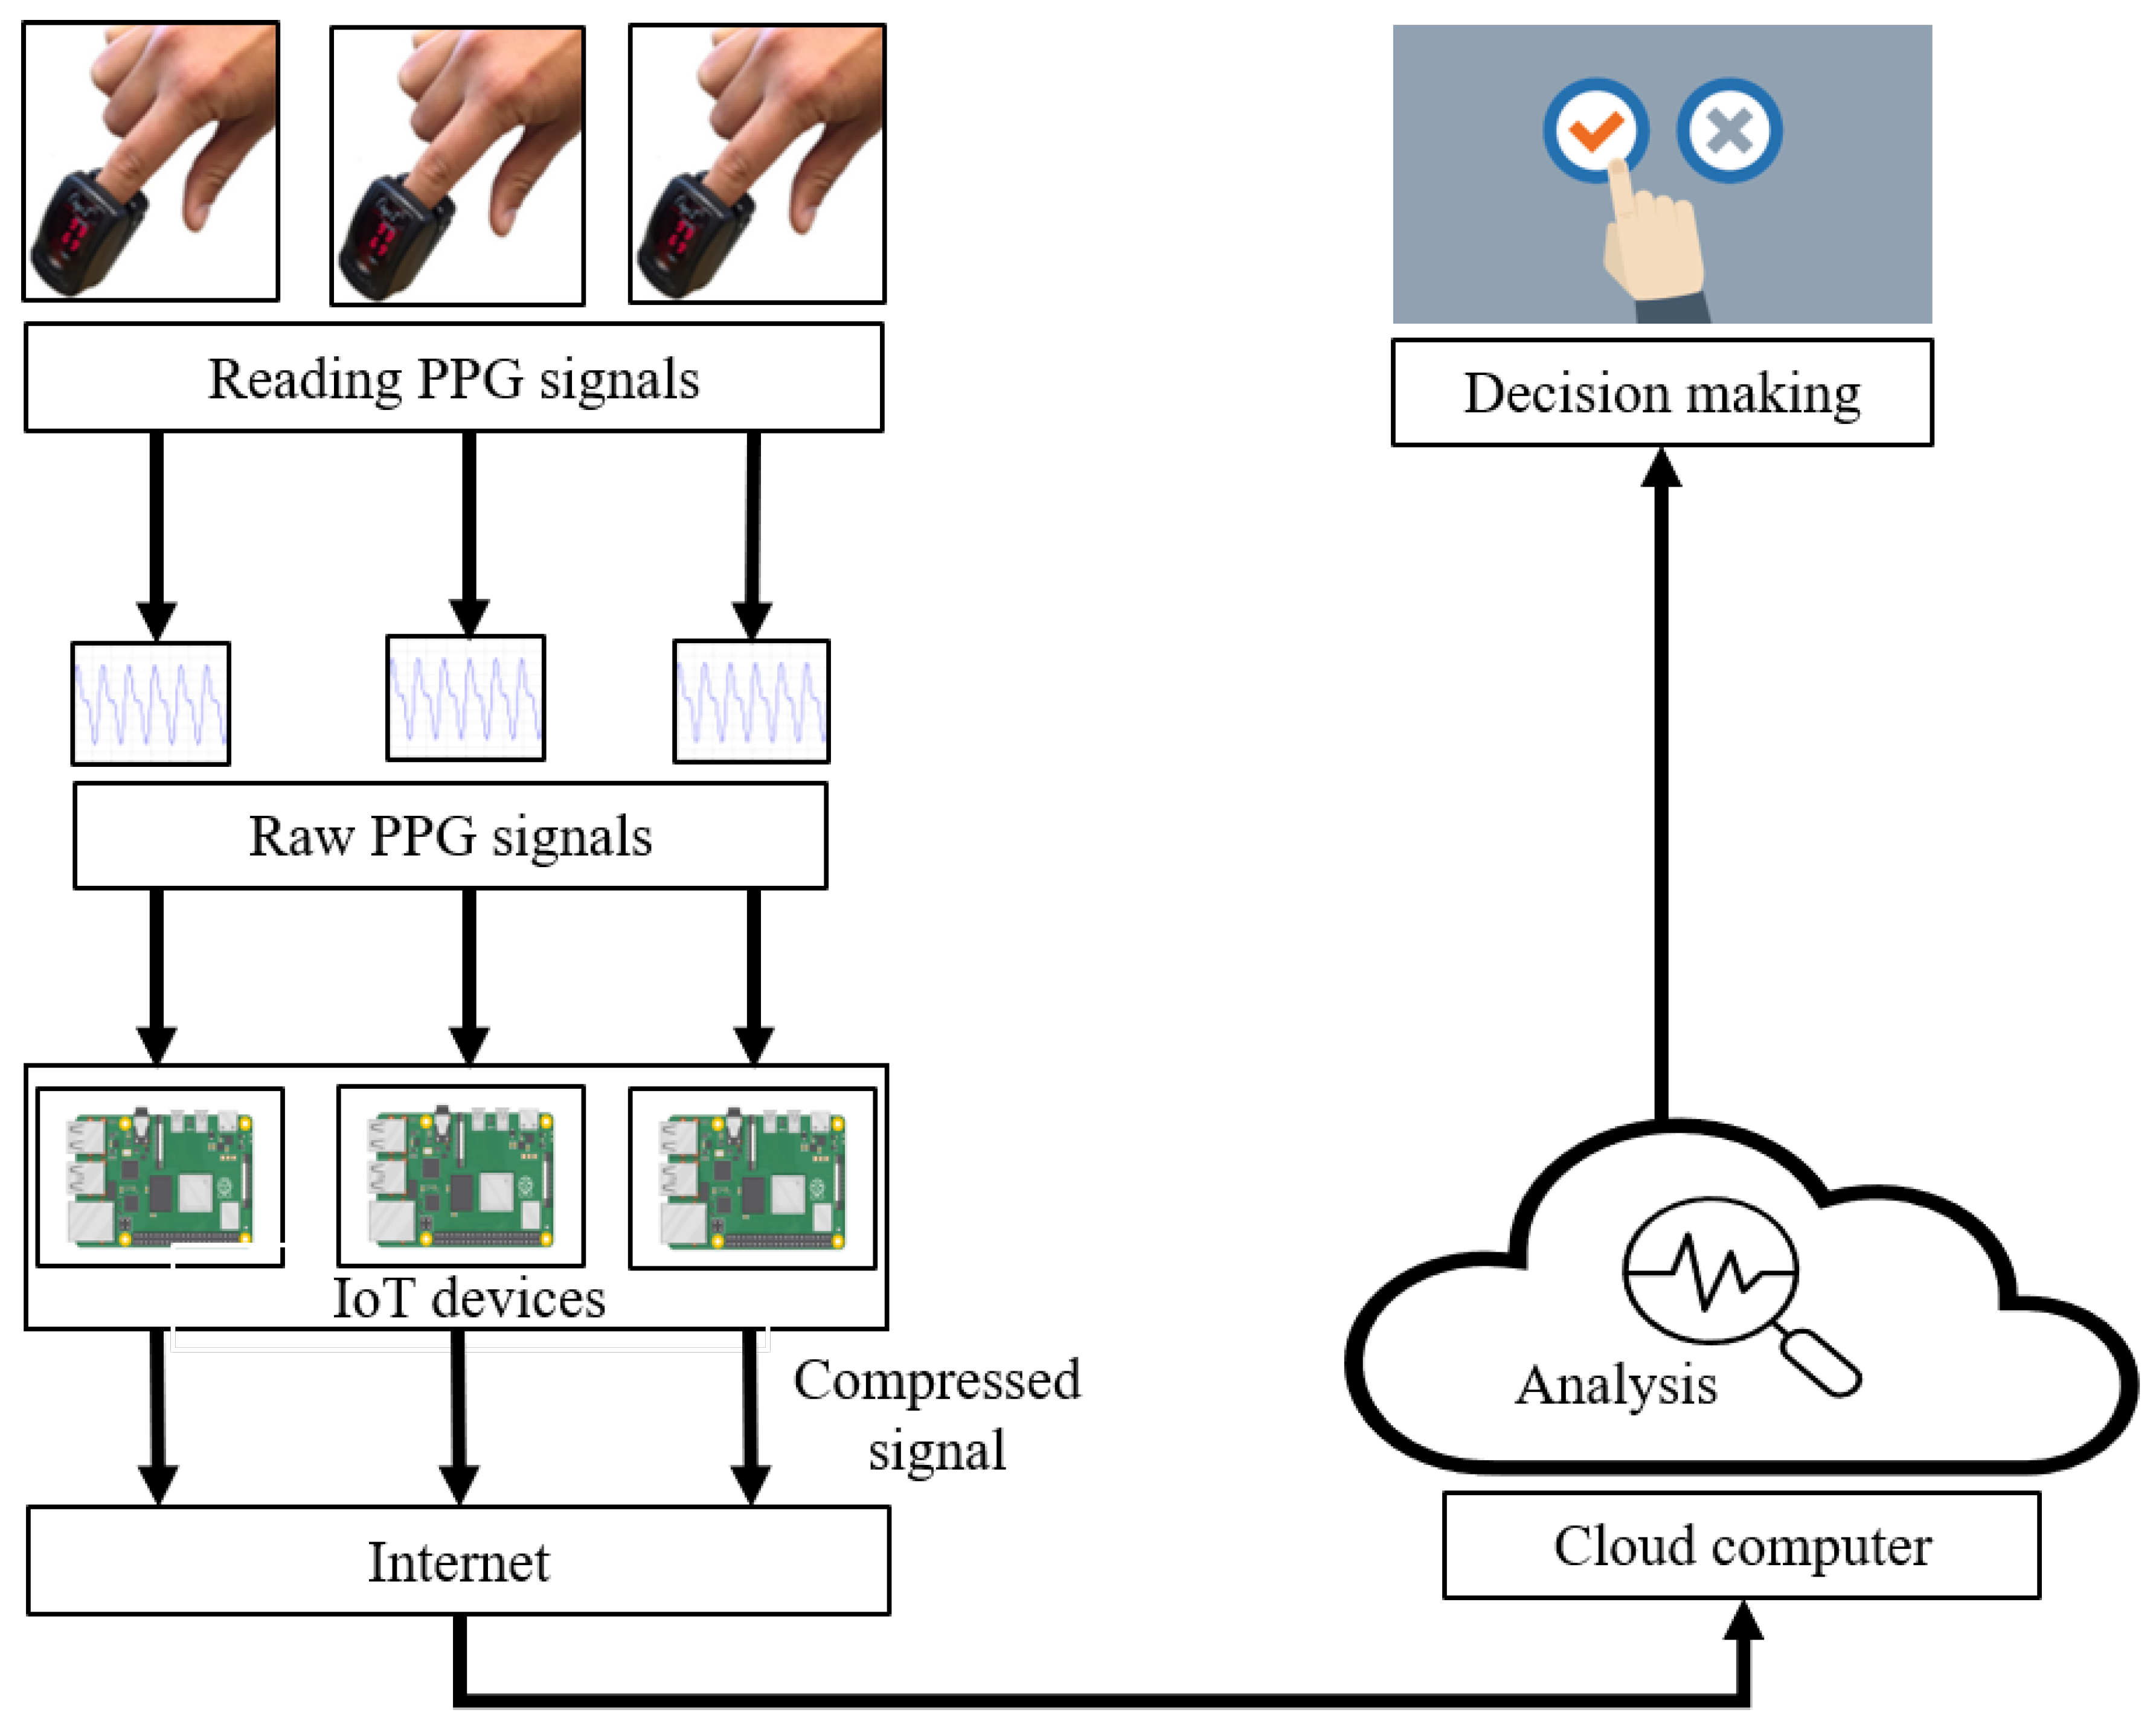
This paper is organized as follows. Section 2 presents the system model adopted in this paper. Section 3 discusses the details of the proposed Codec. Section 4 describes the experimental setup used to evaluate the proposed Codec. Section 5 evaluates the performance of the Codec and its implementation. Finally, Section 6 concludes this paper with some final remarks.

2. System Model

The main concept of the proposed PPG signal compression system is shown in Figure 1. The proposed block diagram is composed of three components, namely the distributed PPG sensors, a computing unit, and a cloud server. The three are described below:
  • The distributed sensors are the main source of PPG signals. They are usually distributed across a dedicated region where biometrics are used for identity authentication, e.g., at an airport security checkpoint or a building floor. A PPG sensor comprises two main elements: aight source and a photodetector. The source emits aight signal towards the skin tissue (usually the tip of a finger). Thatight becomes reflected from the skin in a pattern that depends on the blood volume flowing through the tissue. Such a pattern is detected by the photodetector and converted into a digital pulse signal, i.e., the PPG signal.
  • The distributed sensors generate multiple independent PPG streams. Those streams are sent to a computing unit. This unit is assumed to be realized using single-board computers or microcontrollers, for they are suitable for power-limited and space-constrained IoT applications. The computing unit is responsible for processing the received signal and communicating the processed signal to the cloud server through the Internet.
  • The cloud server is a remote computing facility where sophisticated authentication algorithms are run to verify the individual’s identity. Advance analytics could also be performed in the cloud.
The three components are illustrated in Figure 1, which also shows the signal flow.
The proposed system model is well suited for applications where a possibly encrypted database is hosted on the cloud and accessible from anywhere. Therefore, the PPG signals are first compressed by the computing unit and reconstructed in the cloud. The compressed PPG signal could also be encrypted for securing the communication and preserving the privacy of the transmitted data [21,22]. Compressing the signals alleviates the communication burden, and as such, it is critical to developing an encoder–decoder (or Codec for short) that attains two important properties: (i) ight-weight computations; and (ii) high-fidelity reconstruction. Theatter is essential when the authentication algorithm is developed with the original PPG signal as its input. On the other hand, the former is necessary for IoT settings; usually the computing unit hasimited computational power, which necessitates a simple compression algorithm. More precisely, it requires an algorithm with a simple encoder withow computational and storage demands.

3. Proposed Codec

To design a Codec that meets the two system requirements described in Section 2, this paper utilizes the T-SVD algorithm. T-SVD generates two transformation matrices. One projects the PPG signal onto aower dimensional space, encoding the PPG signal. The second projects the compressed signal back to its original space, reconstructing the PPG signal. T-SVD has been widely used in different fields, includingocalization in power transformers [23], radar imaging [24,25], magnetic resonance imaging [26], error control in wireless sensor networks [27], heart rate monitoring [28], andatent semantic analysis [29].
The process ofearning the two encoding and decoding matrices is described as follows.et AR q × p be the reference dataset matrix, where q represents the number of independent realizations of the PPG signal (i.e., different PPG signal readings from different individuals), and p is the number of PPG samples of each realization. The singular value decomposition (SVD) of a given reference dataset matrix A is simply expressed as [30]:
A = U Λ V T
where matrices UR q × q and VR p × p are theeft and right singular vectors of matrix A, respectively, and Λ R q × p is a diagonal matrix containing the singular values. The two matrices U and V are orthonormal, i.e., U T U = U U T = I and V T V = V V T = I where I is the identity matrix. In (1), the singular values of A are arranged in descending order. Therefore, aow-rank approximation of matrix A can be produced using the singular vectors of matrices U and V corresponding to the first k argest singular values. That is
A A ˜ = U k Λ k V k T
where U k R q × k , Λ k R k × k , and V k R k × p , and k(< p ) is the number of non-zero singular values. Multiplying both sides of (2) by V k , we obtain [28,30]:
A ˜ V k = U k Λ k
A ¯ = U k Λ k
where A ¯ R q × k is aow-dimensional version of A ˜ . This multiplication encodes the reference matrix by projecting its rows onto the R k space, and hence, the projection matrix V k is referred to as the truncated basis matrix.
When a new matrix of PPG signals T × p with l realizations is available, it is encoded using V k as follows [28,31]:
T ¯ = T V k
The new matrix T ¯ has k-dimensional rows, i.e., compressed PPG signals. At the cloud, the PPG signal is reconstructed from T ¯ using the same truncated basis matrix as follows [30]:
T ˜ = T ¯ V k T
where T ˜ R q × p has the same dimensions as those of the original matrix of PPG signals. Please note that the truncated basis matrix V k is onlyearned once from the reference data matrix (i.e., A ). Figure 2 presents a conceptual diagram for the proposed Codec.

4. Experimental Setup
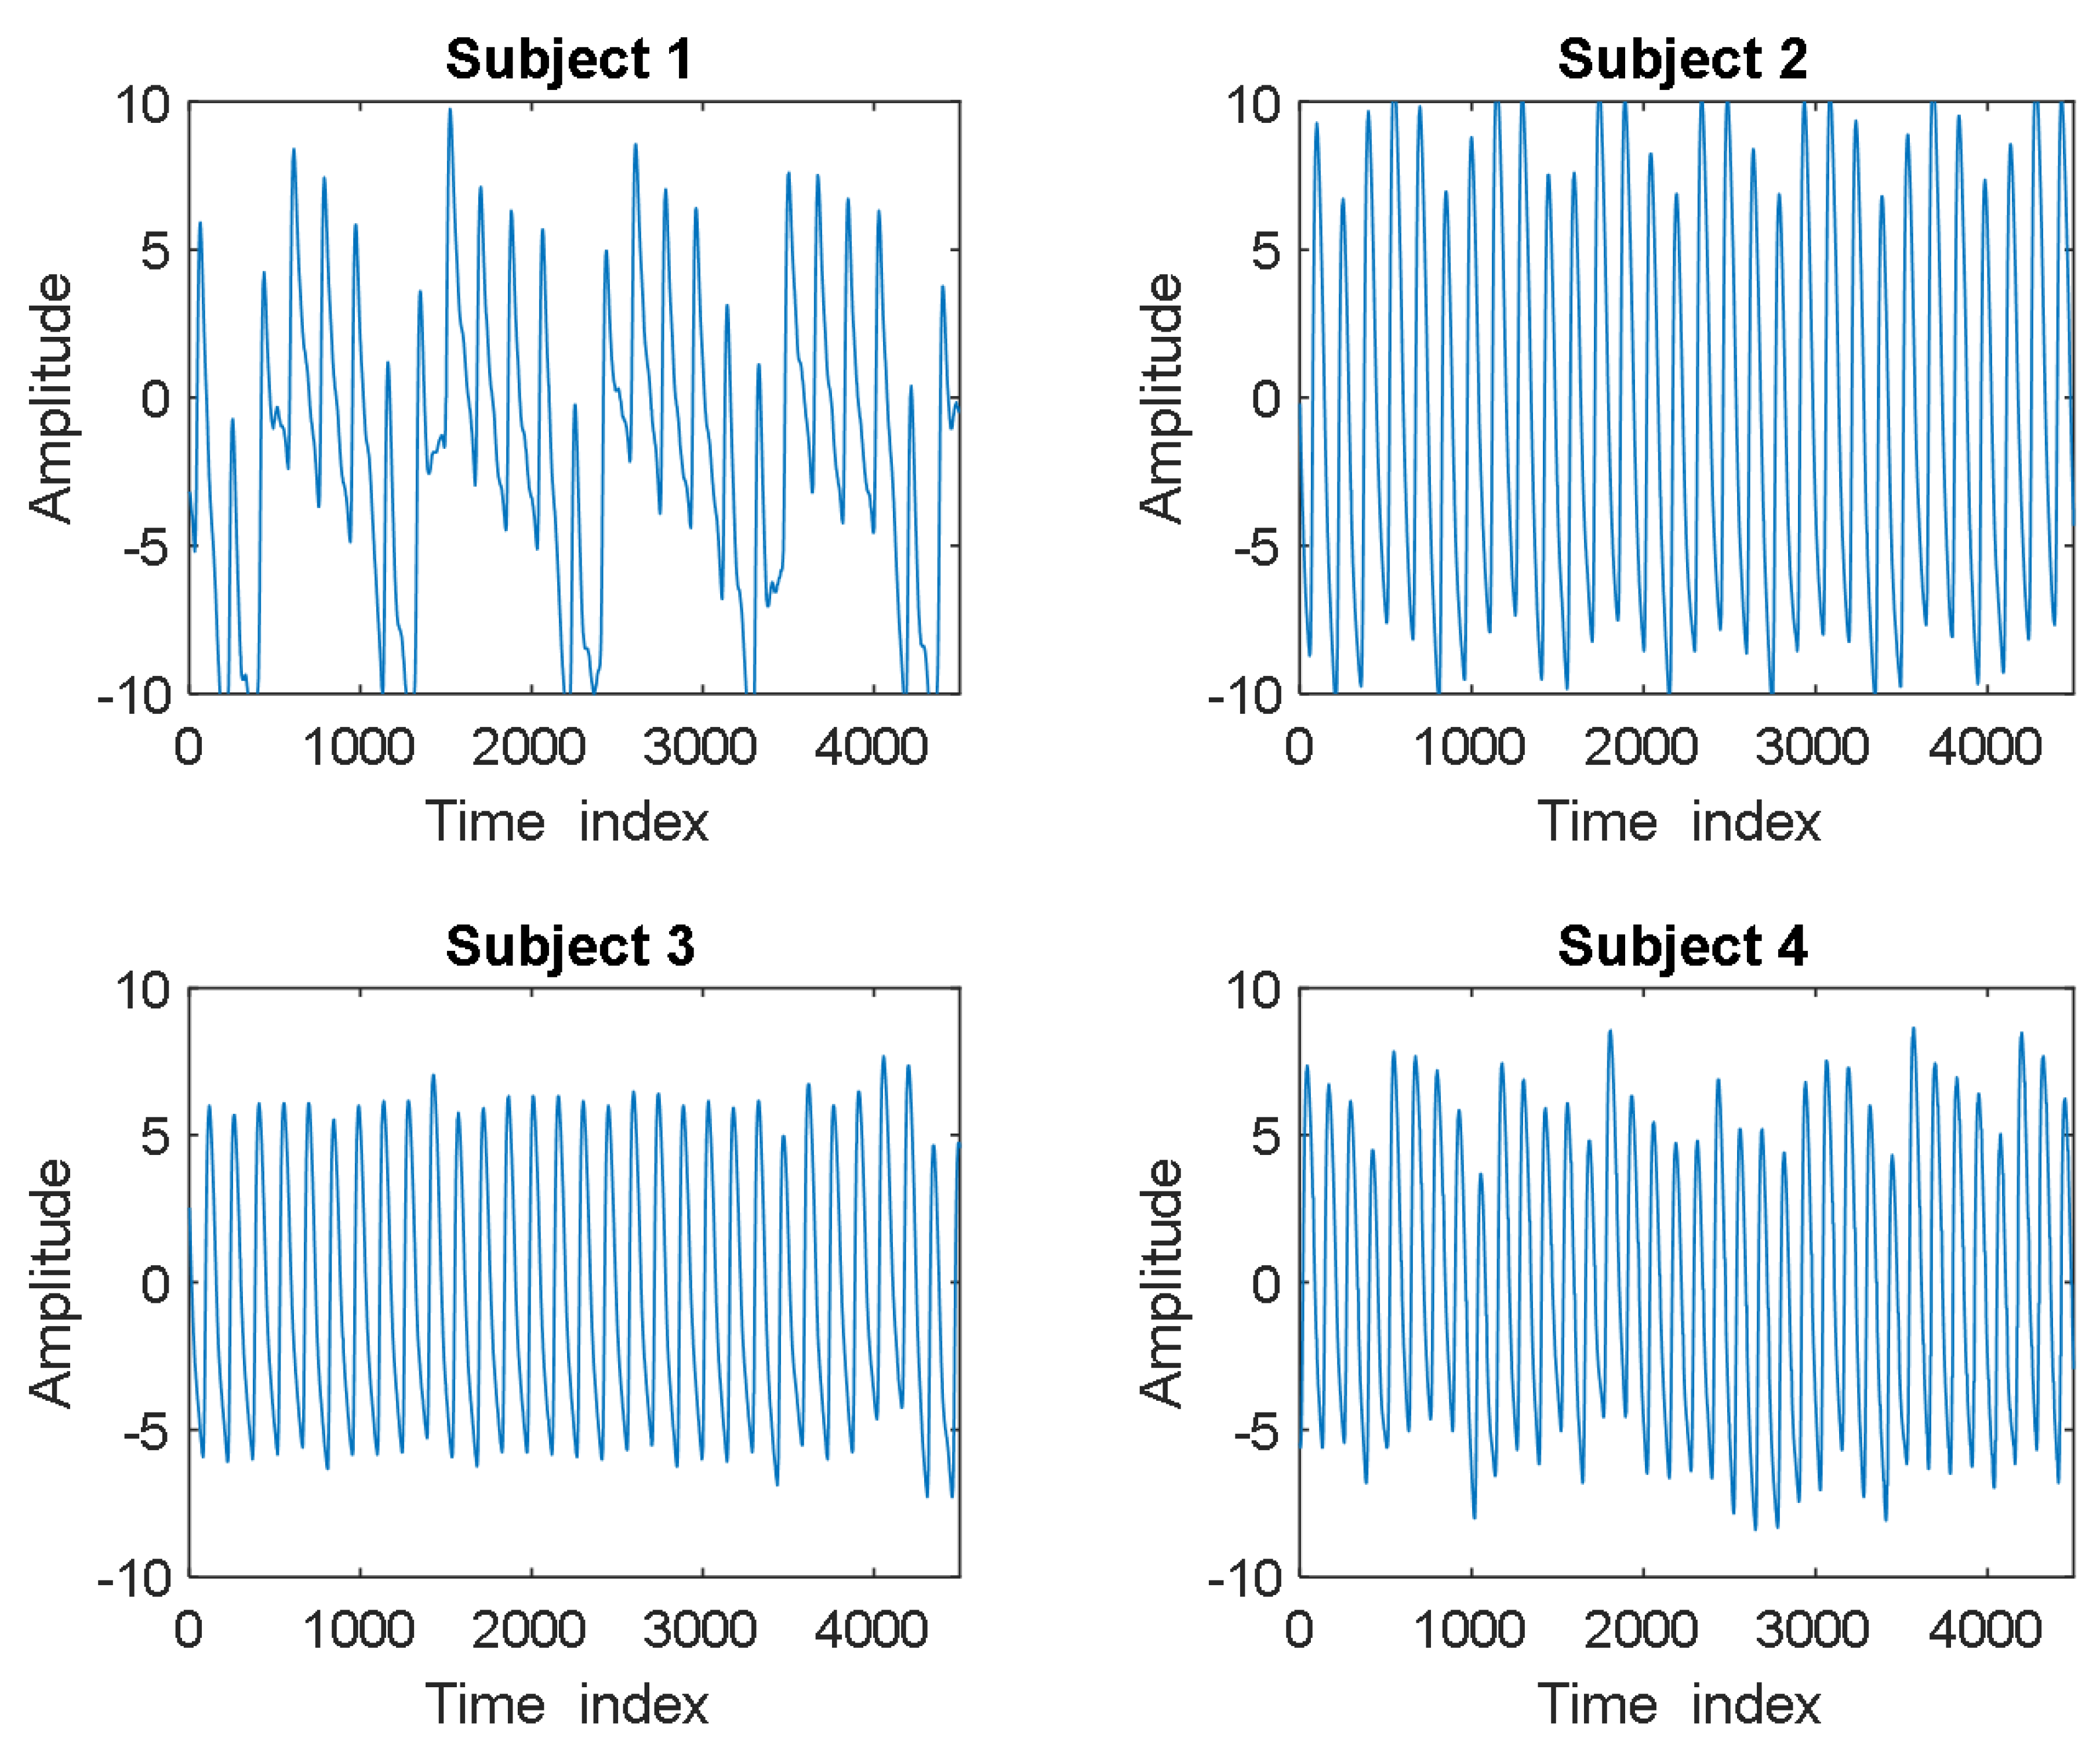
The proposed T-SVD Codec will be developed and evaluated on a diverse dataset of PPG signals belonging to several individuals. This section will present the experimental setup assumed to do that. More precisely, it will present the development dataset, the development procedure, and the performance evaluation metric.

4.1. Dataset

This work makes use of the CapnoBase database which is available on the website “capnobase.org”. CapnoBase is a collaborative research work conducted at the University of the British Columbia, Vancouver, Canada, between 2009 and 2010. The database currently contains six annotated datasets. It is mainly introduced for the sake of estimating the respiratory rate in real time from the PPG signal;ater on, it is widely used in validating and benchmarking algorithms—see [32,33], for more details. In our development, we used the PPG dataset containing 42 different PPG signals collected from 42 different subjects: 29 children (median age: 8.7, range: 0.8–16.5 years) and 13 adults (median age: 52.4, range: 26.2–75.6 years). Each signal has a duration of 8 min with a sampling rate of 300 Hz. As a pre-processing step, each 8 min signal is divided into 15 s segments. This is based on the result reported in [8], where it is shown that a 15 s segment yields the highest accuracy as far as subject authentication is concerned. Figure 3 shows examples of four different waveforms of 15 s PPG segments.

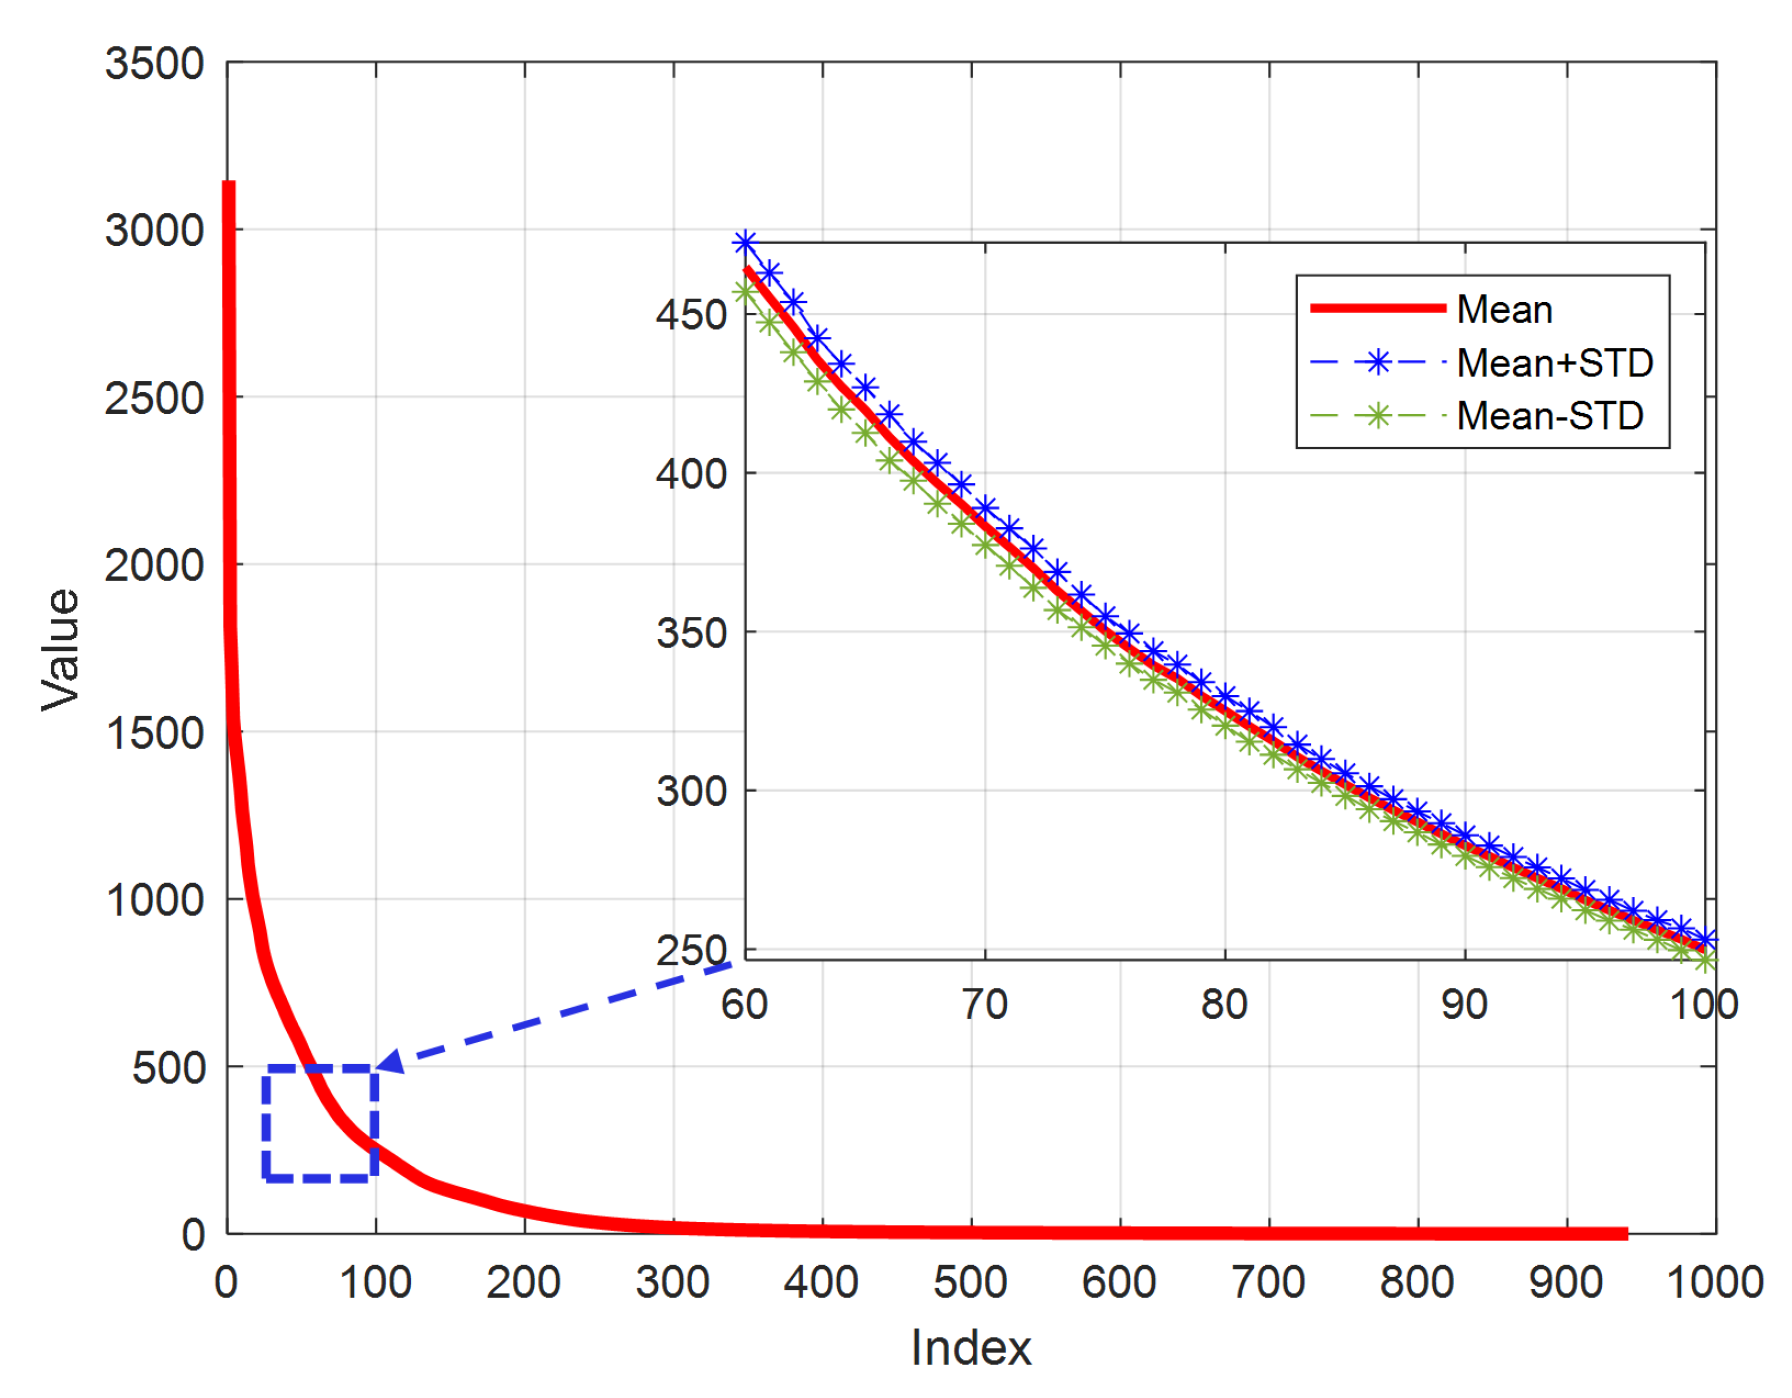
4.2. Codec Development

The T-SVD Codec presented in Section 3 needs toearn the truncated basis matrix. In particular, it is required to determine the minimum value of k (i.e., the number of singular values to consider) such as theow-rank representation for the reference dataset matrix A can attain as much information from the original matrix as possible. In our development, the mean-squared-error (MSE) would be used as a metric and it is defined as follows [34]:
MSE = i = 1 U ( a i t i ) 2 U
where a i is a PPG signal representing the i-th row of the reference matrix A , t i is a reconstructed PPG signal representing the i-th row of matrix T ˜ , and U is the total number of reference PPG signals.
The CapnoBase dataset is divided into two sets. One is used to develop the T-SVD Codec and identify the dimensionality of the truncated basis matrix, specifically the parameter (k). The second, on the other hand, is dedicated to validating the performance of the designed Codec. As stated previously, the dataset has 42 subjects; each has a PPG signal of a duration of 8 min, which we divided into 15-second segments. Therefore, each PPG signal has 32 segments, resulting in a total number of dataset segments equal to 1344. We used a random 70–30% split to obtain the reference and validation sets. This means that, out of the 1344 segments, 941 segments were randomly selected to serve as a reference set, while the other 403 segments served as a testing set. Therefore, the size of reference matrix A is 941 × 4500 and that of validation matrix A v a l is 403 × 4500 . Note that the selection of reference and testing datasets is randomly performed.
The reference matrix is constructed 100 times by randomly splitting the dataset as mentioned above. Each time the reference matrix is decomposed, singular values are identified. Figure 4 shows the mean of each singular value computed from the different A matrices. This also shows the deviation of the mean by a single standard deviation in each direction (mean ± one standard deviation). An immediate conclusion from the figure is that different dataset splits result in almost the same singular values. This indicates that the dataset size is rather good and could produce consistent results. To determine the value of k, the MSE is computed between the original reference matrix A and different approximation T ˜ obtained by varying k, i.e., sweeping the set { 1 , 2 , 3 , 4 , , 941 } . Figure 5 plots the MSE versus k with a step of 5 across the x axis. It could be concluded that using approximately 200 singular values achieves high reconstruction fidelity, i.e., driving MSE to 0.106, while compressing the PPG signal by approximately 95% (compressed signal is 4.4% of the PPG signal size). Hence, the value of k is hereafter set to 200.

5. Codec Evaluation and Implementation

The performance of the developed Codec in Section 4.2 is evaluated and its implementation on a single-board computer is discussed and analyzed.

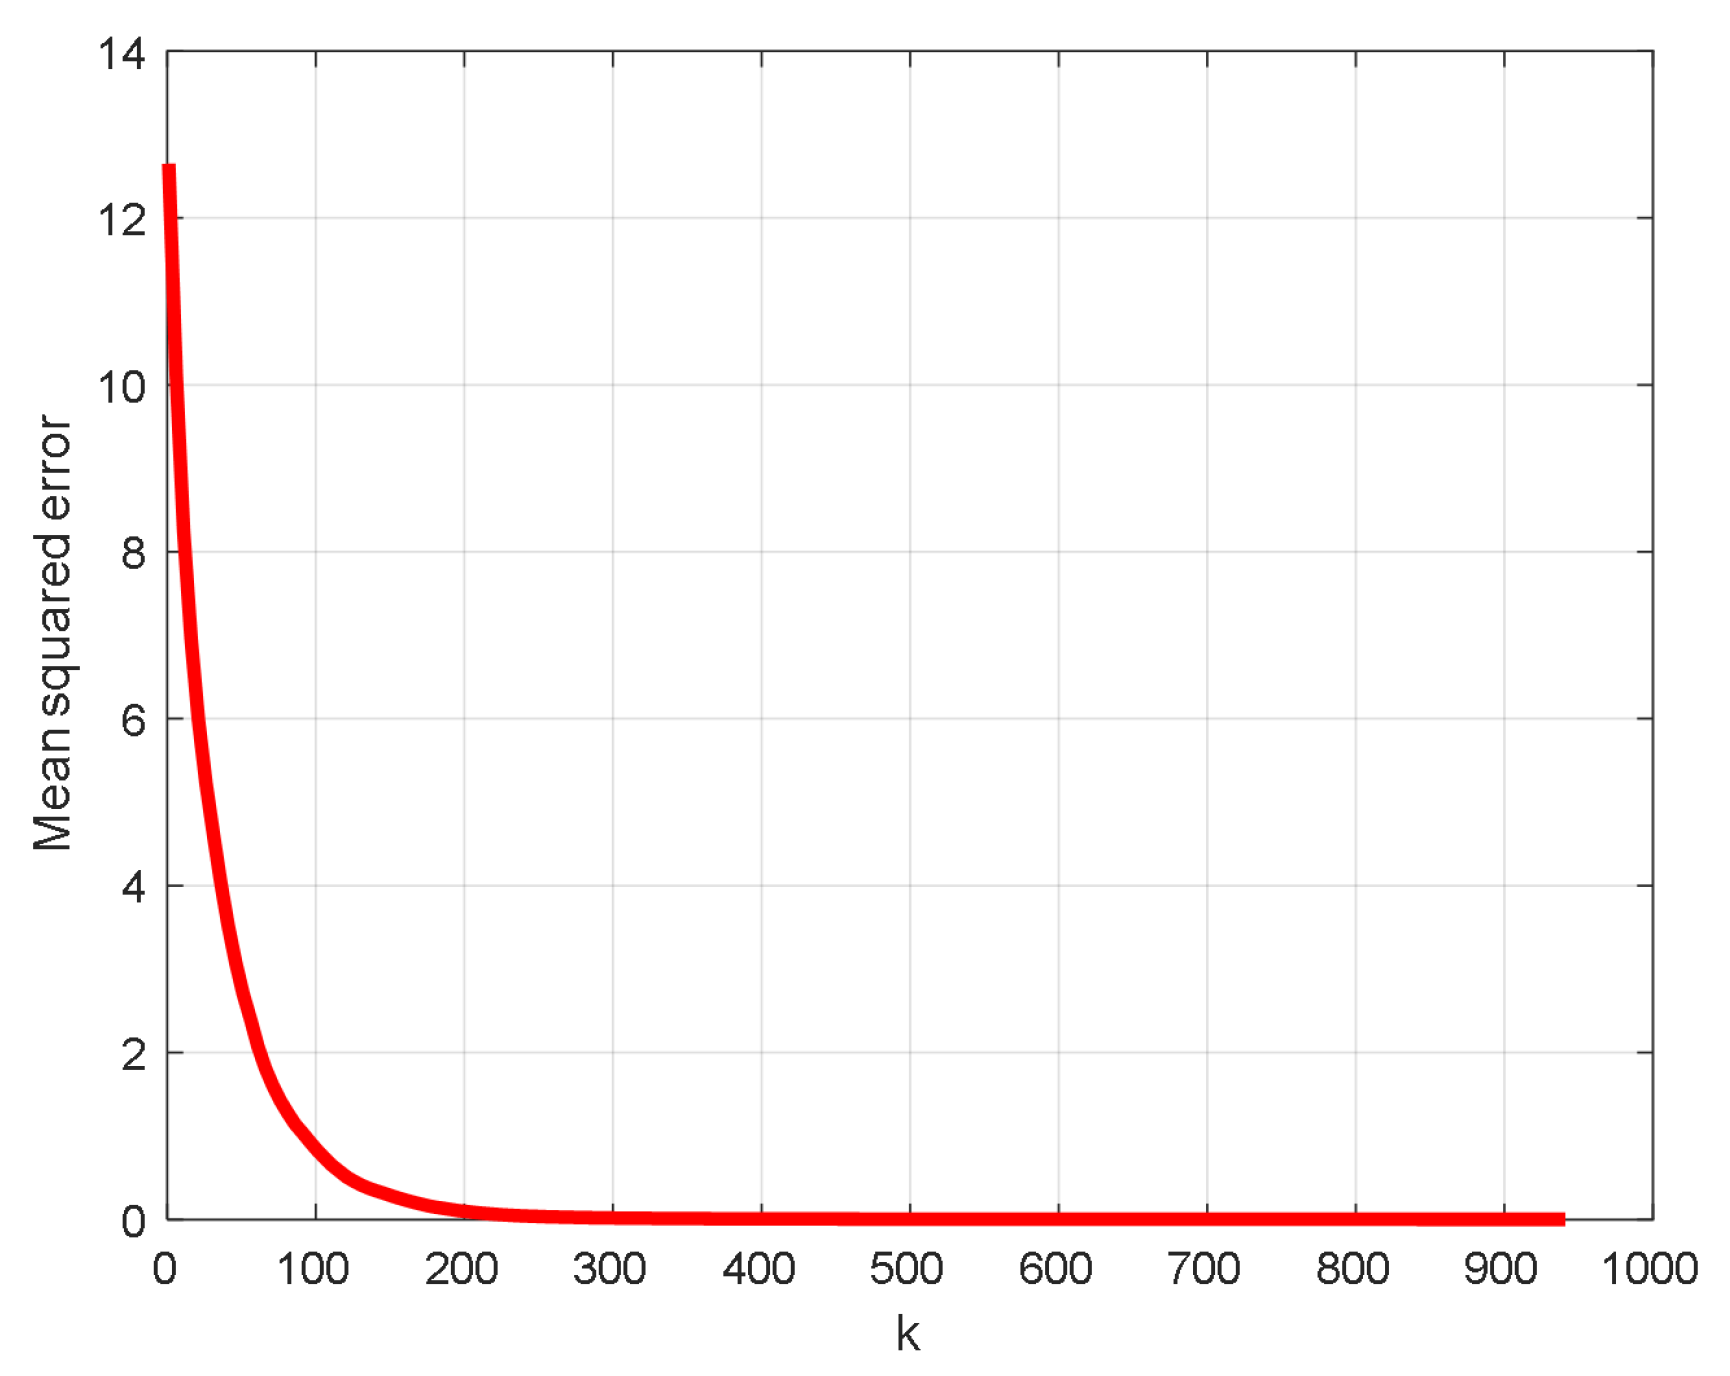
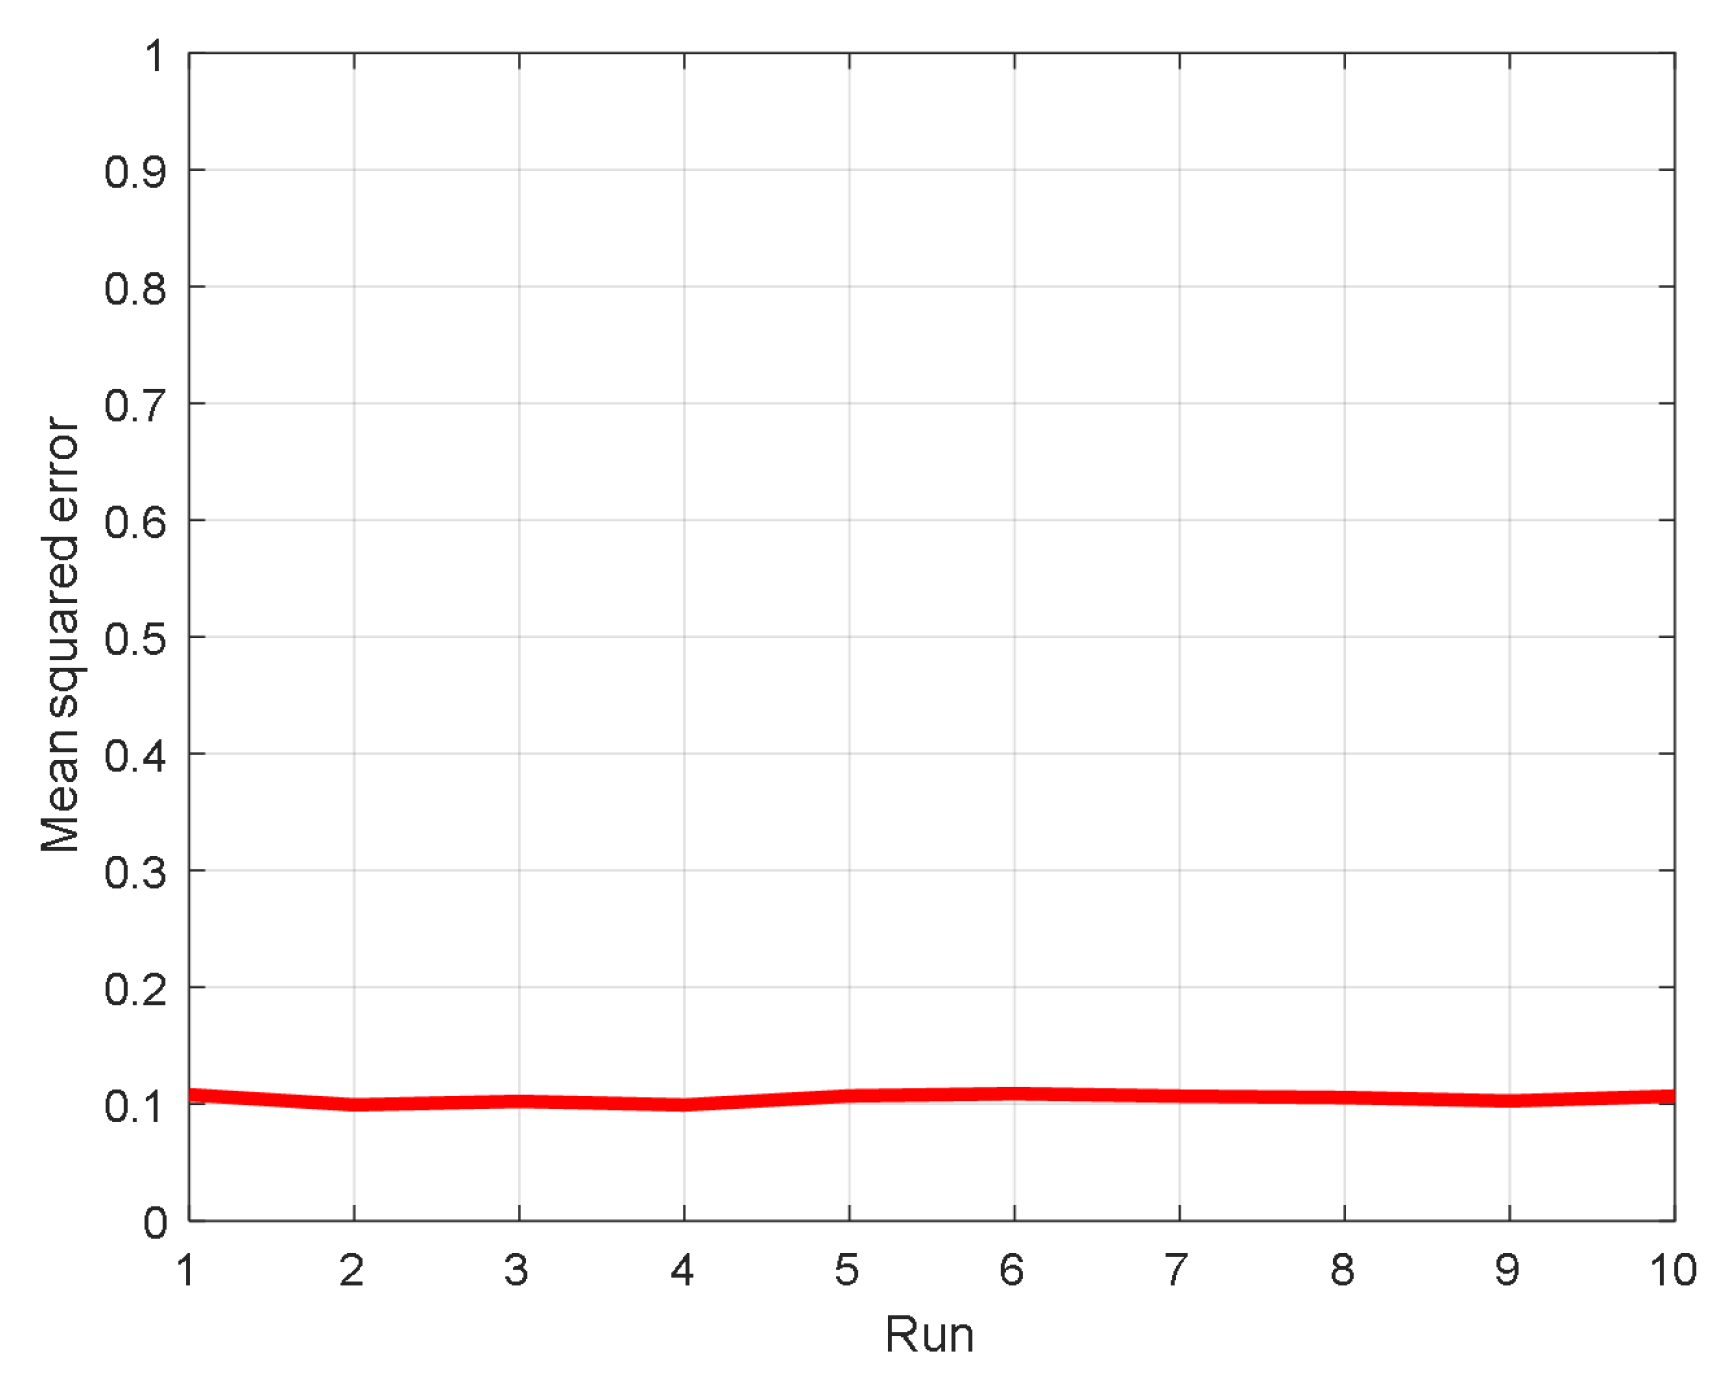
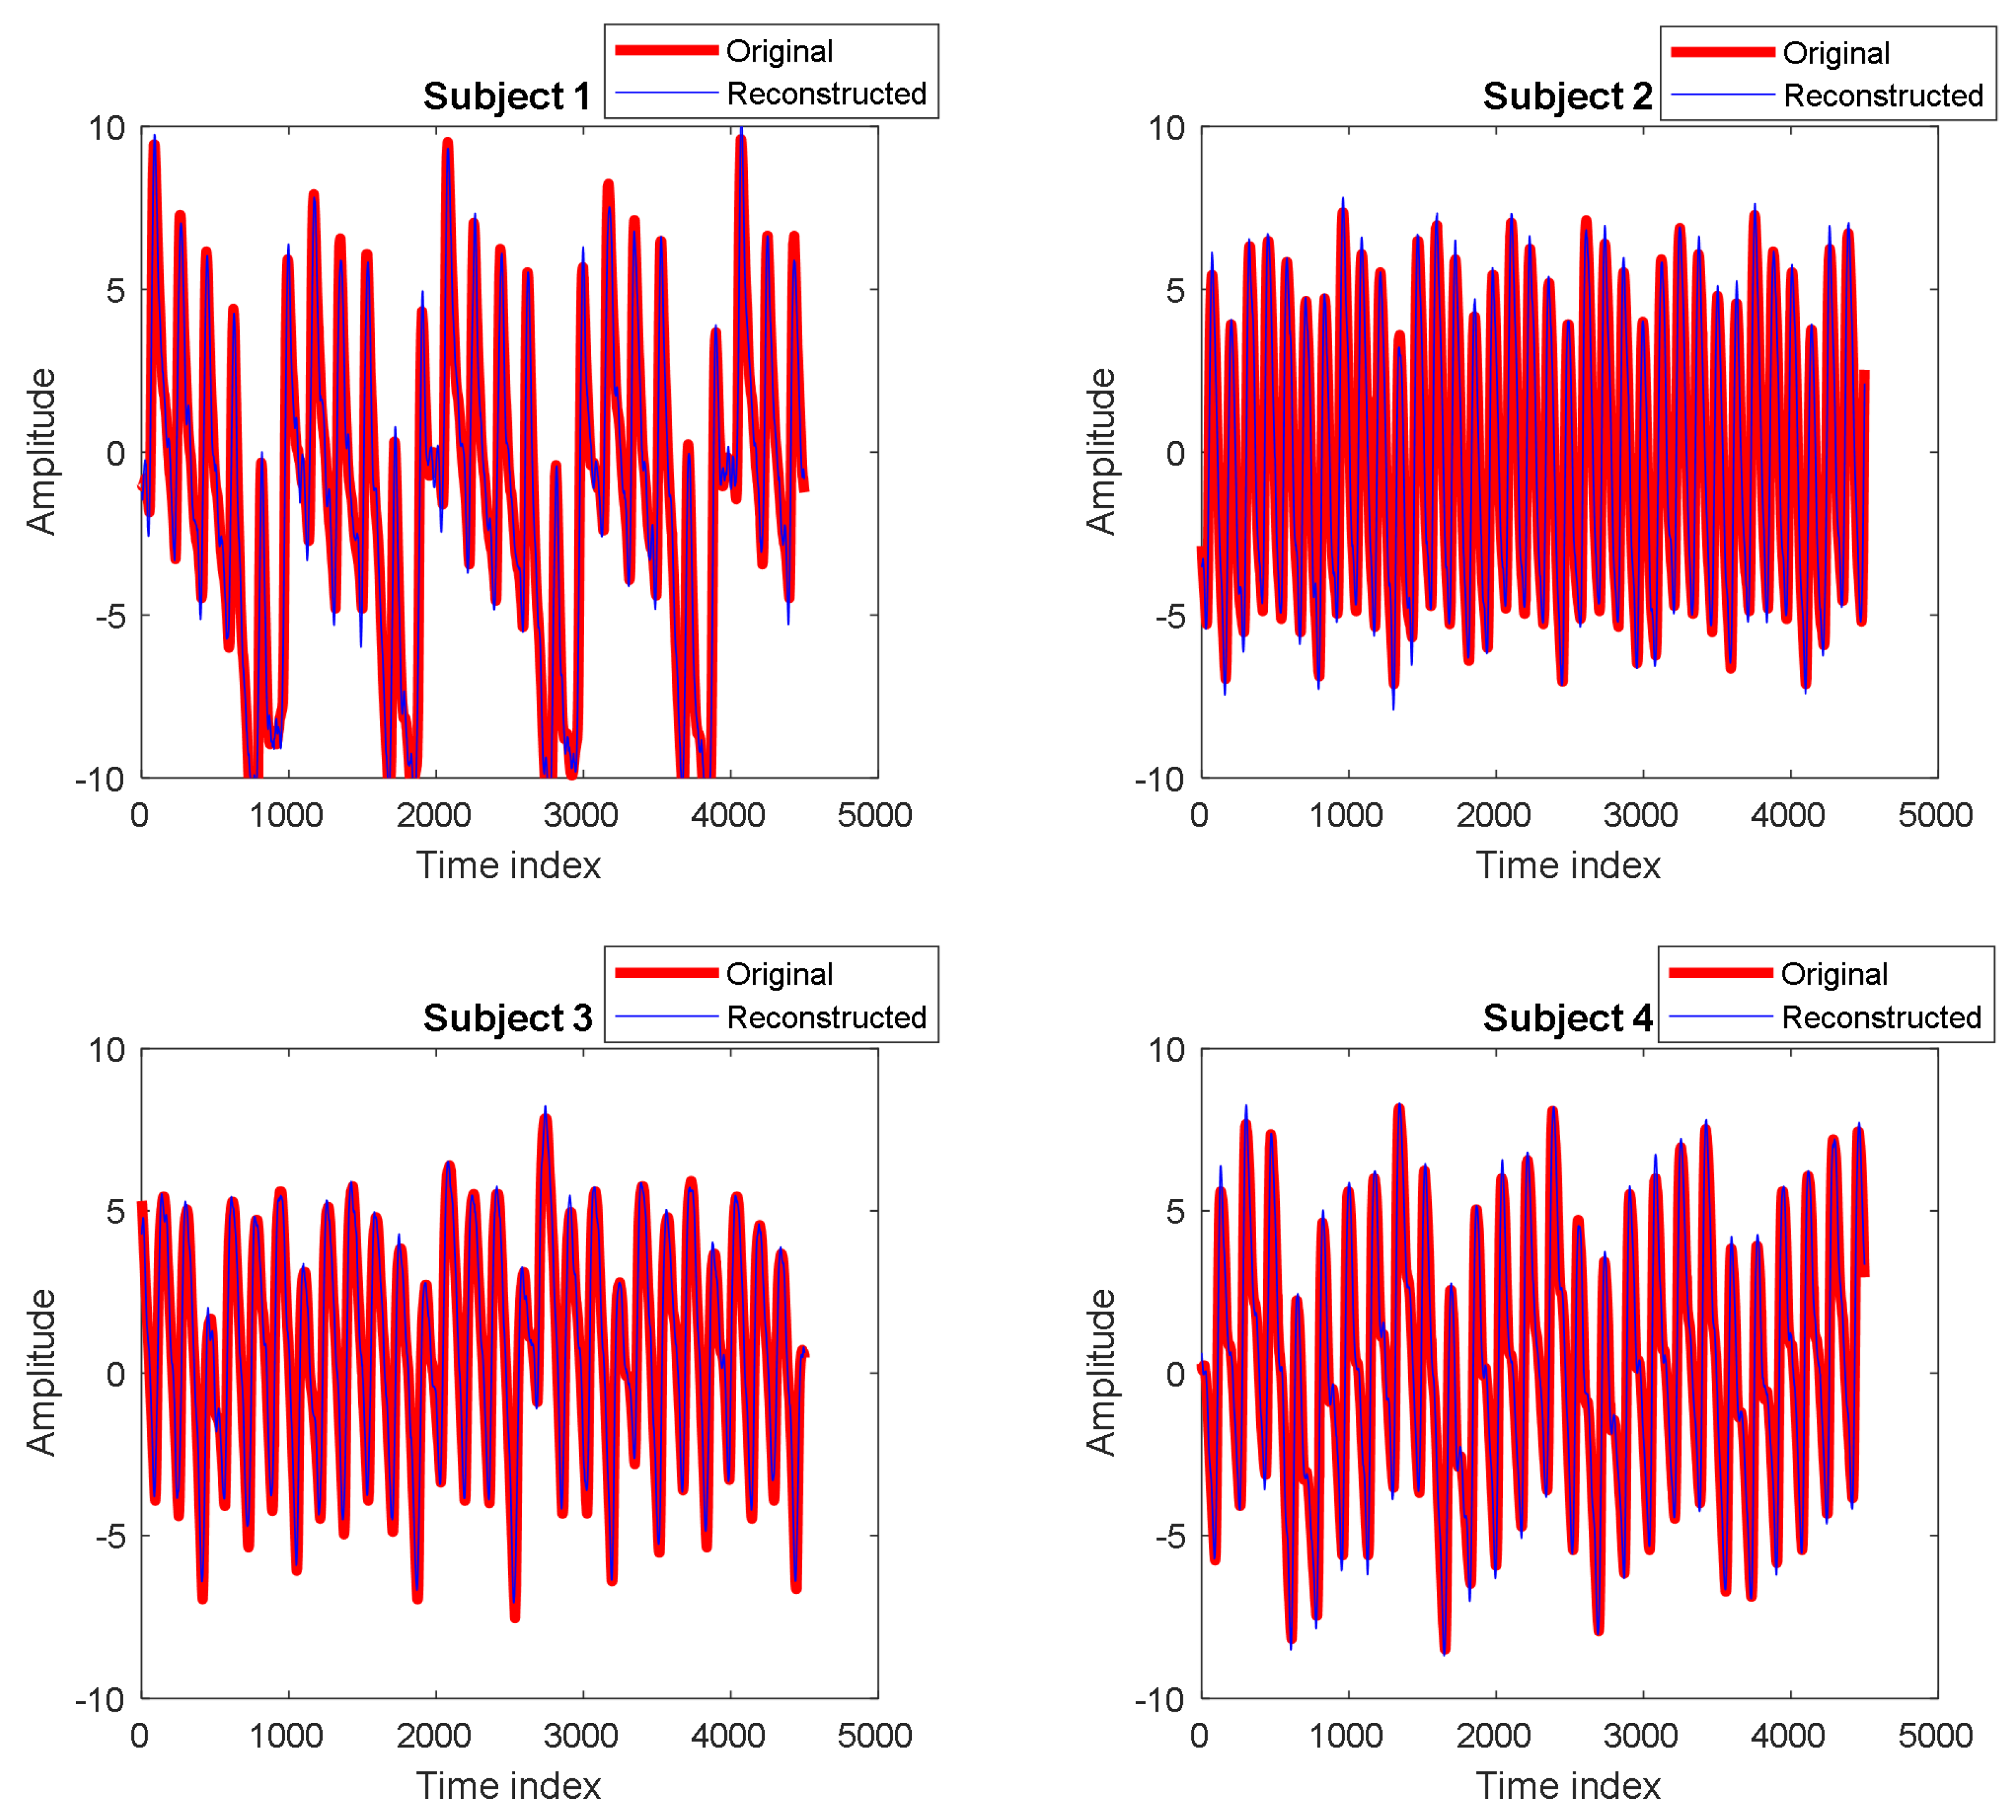
5.1. Reconstruction Performance

The MSE between the original reference matrix A and the reconstructed matrix T ˜ is not enough to quantify how well the reconstructed signal assimilates the original one. Therefore, the same metric (MSE) is computed for the validation matrix A v a l and its reconstructed version T ˜ v a l . This is performed on 10 different data splits to quantify how stable the validation performance is, i.e., the compression fidelity on the validation set. Figure 6 plots the value of MSE versus the number of times that the data are split. The values of MSE are stable at approximately 0.106, which confirms the effectiveness of the code. Qualitatively, Figure 7 shows examples of the original and reconstructed PPG signals from four different subjects (all picked from the validation set). As the two signals are identical to each other, they are plotted in two different colors; the original signal is set in the back in red and in thick color, while the constructed signal is set in the front in blue and thin color. It has clearly been shown that it is difficult to distinguish between them, indicating how similar they are, which reflects the high accuracy of the proposed algorithm.
As another quantitative measure for evaluating the performance of the proposed PPG Codec, the coefficient of determination ρ is considered. This measure is defined as follows [35]:
ρ = 1 u = 1 U | | a u t ˜ u | | 2 u = 1 U | | a u a ¯ | | 2
where a u is the original PPG signal, t ˜ u is the reconstructed signal, U is the number of samples in the validation set, and a ¯ is the average PPG signal computed as follows:
a ¯ = 1 U u = 1 U a u ,
and finally | | . | | is the Euclidean distance. This measure provides information about the goodness-of-fit of a model. In particular, ρ expresses how well the reconstructed results approximate the true target values. When ρ = 1 , this means that the model’s output exactly matches the target (ground truth) values. When ρ = 0 , the model cannot predict the true target values.
Figure 8 shows the value of ρ versus the number of times that the data are split. It is observed that ρ has an excellent average value of 0.992 and a standard deviation of 0.00022. This high value of ρ means that the original and reconstructed PPG signals are almost identical.
The reconstruction performance is also evaluated by comparing the values of MSE and ρ of the proposed Codec with those obtained by the approach of [19], which utilizes the autoencoder to compress the PPG signal. The autoencoder consists of three main parts: the encoder, code, and decoder [36]. The encoder produces an encoded representation (code) of input data that are ordinarily numerous orders of magnitude smaller than the size of the original PPG signal. The decoder utilizes the code to reconstruct the input data. Furthermore, this code can be used as features to be immediately exploited for authentication.
The values of MSE and ρ of autoencoder are 0.246 and 0.99, respectively, computed from the PPG dataset at the same compression ratio utilized by the proposed Codec. These results reveal the superiority of the proposed Codec and its effectiveness to reconstruct the PPG signal from the code with smaller MSE and a higher value of ρ . Furthermore, as will be demonstrated in the following sections, the proposed Codec is capable of producing recognition accuracy in the authentication process by utilizing the features extracted from the reconstructed signal very close to the recognition accuracy produced by the features extracted from the original PPG signal. In addition, the proposed Codec is amenable to efficient hardware implementation as its coder and decoder simply employ multiplication by a matrix; see Equations (5) and (6).

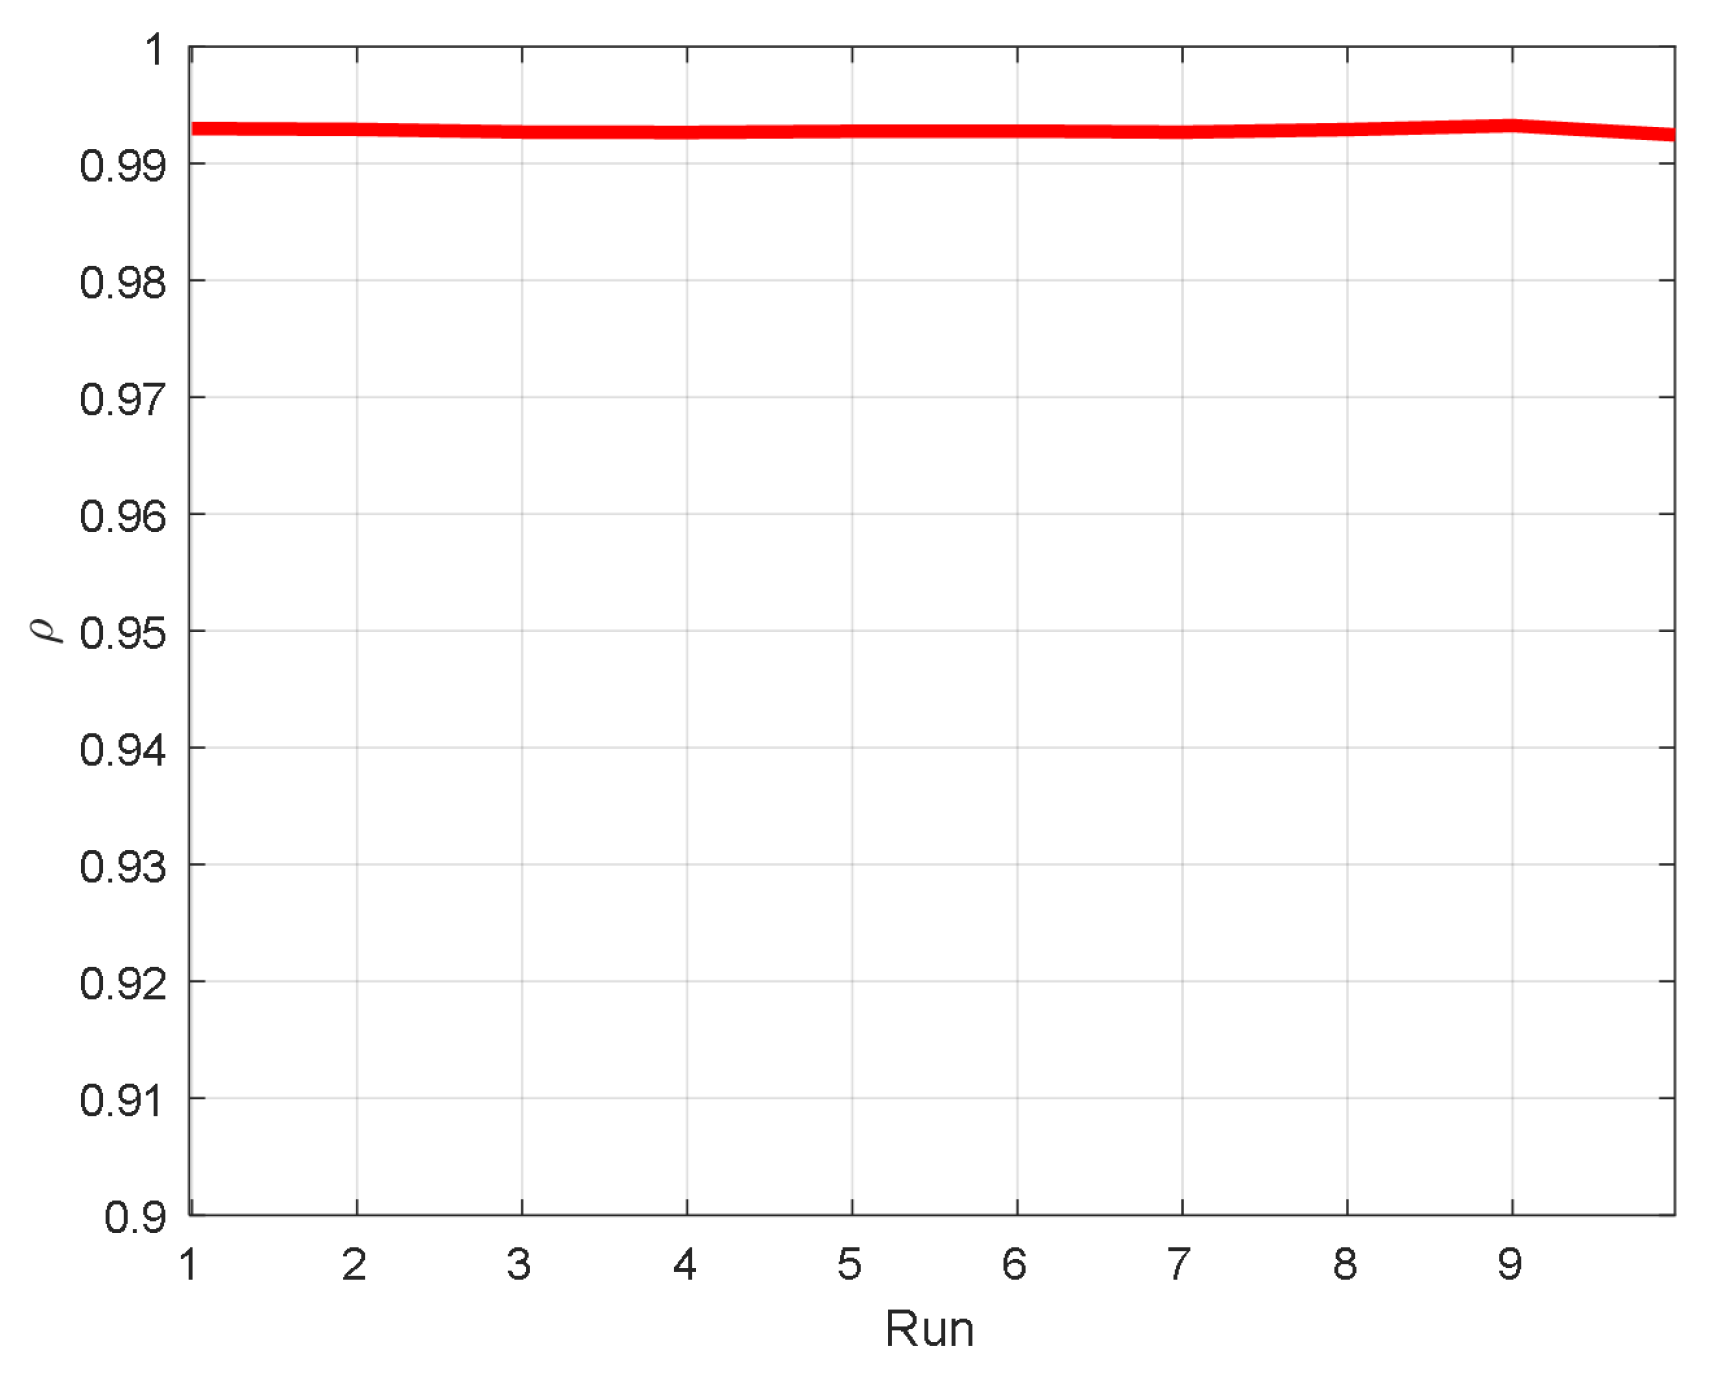
5.2. Authentication Performance

A way to quantify the ability of the Codec to support identity authentication is to integrate it with an authentication algorithm. Here, we consider the algorithm of [8], which extracts 10 features from the different domains of PPG signal. These features include the mean, median, variance, standard deviation, interquartile range, the interquartile first quarter (Q1), the interquartile third quarter (Q3), kurtosis, skewness, and entropy. In [8], eight cases have been considered to form the feature vector. For demonstration, in this study, we implemented the approach of [8] which utilizes the features directly extracted from the time domain of a PPG signal. An SVM model is trained to classify the feature vectors and authenticate the individuals.
To test the quality of the Codec reconstructed signal, the feature vectors of four random independent subjects are extracted from the reconstructed and original PPG signals and compared. Table 1 depicts those extracted features. One could immediately observe that the two signals are almost the same; each feature extracted from one almost matches the other. Furthermore, an SVM classifier is designed with a radial basis kernel to test the performance of authentication process. As in [8], the CapnoBase dataset is divided into two parts: 70% for training and 30% for testing. The features extracted from the original PPG test signals and corresponding features extracted from the reconstructed PPG signals are then applied to the designed SVM. The results were averaged over 10 independent runs and showed that 94.0952% recognition accuracy is achieved using the features extracted from the original PPG signals while 93.5714% recognition accuracy is achieved using the features extracted from the reconstructed PPG signals. The difference between the two results is insignificant; it is only approximately 0.5%, which affirms the effectiveness of the proposed Codec.

5.3. Hardware Implementation

The proposed PPG Codec is designed to meet the two main conditions or system requirements, as stated in Section 2. The two above sections, namely Section 5.1 and Section 5.2, have investigated the reconstruction quality, which relates to the high-fidelity requirement. However, they did not touch upon the first requirement, which is that ofightweight computations. This is the focus of this section. In particular, it will investigate how computationally suitable the encoder is to implementation.
The computational complexity of the proposed Codec is empirically quantified by implementing the encoder on a single-board computer—one of the types which is usually used in IoT systems—and measuring its average encoding time. We used Raspberry Pi 3 as aow-cost IoT device to implement the encoder. Since its first release in 2012, Raspberry Pi has undergone numerous updates and tweaks. The original Pi had a single-core 700 MHz processor and 256 MB of RAM, whereas the most recent model has a quad-core 1.4 GHz processor and 4 GB of RAM. The Raspberry Pi 3 is aow-cost single-board computer with advanced processing capabilities that could be hooked up to a monitor or integrated into aarger system.
The procedure to estimate the average encoding time is described as follows. The T-SVD encoder is first downloaded into the Raspberry Pi device. Raspberry Pi is then connected to aaptop where the CapnoBase dataset resides. Then, 1344 15 s PPG samples are uploaded from theaptop to the Raspberry Pi device. These segments are processed sequentially to encode for transmission to the cloud. Following that procedure, it has been found that the average processing time needed by the Raspberry Pi to encode the PPG signal is approximately 300 ms, and the file size is reduced from 26.5 megabytes for the original PPG signal to 1.12 Megabytes for the compressed one. Such speed of compression is enough to satisfy the practical requirements of an IoT authentication system.

6. Conclusions

A PPG compression–decompression algorithm (a Codec) is proposed for a cloud-based identity authentication model. The Codec is designed using truncated singular-value decomposition (T-SVD) to meet two main system requirements: (i) be able to reconstruct compressed PPG signals with high-fidelity such that authentication performance is not jeopardized; and (ii) have a computationallyight-weight encoder that fits into a single-board computer or micro-controller. The T-SVD algorithm relies on identifying aow-dimensional vector subspace to which a PPG signal is projected for compression. The subspace is guaranteed to retain most of the information of the PPG signal to allow for high-fidelity reconstruction.
The T-SVD enables the proposed Codec to meet both requirements, and this has been empirically verified by developing and testing the Codec on a popular open source PPG dataset, namely the CapnoBase dataset. The Codec encoder can achieve a 95.5 % compression rate on the validation set drawn randomly from the CapnoBase dataset. A high-fidelity decoder accompanies such a high-compression encoder. It is able to reconstruct the PPG signals such that the reconstructed and original signals have a high goodness-of-fit index. In particular, the decoder has a 99 % coefficient of determination on the validation set, reflecting a high reconstruction quality. The proposed Codec encoder has also been implemented on a single-board computer to verify that it meets the second requirement, namelyight-weight computations. The compression time of the encoder averages 300 ms on a Raspberry Pi 3 computer, a processing time that is suitable for a cloud-based authentication model. Note that although the output of the proposed compression algorithm transmits the code waveform, which has no resemblance with the original PPG signal, for sensitive applications, this compression technique needs to be complemented by an encryption algorithm, to ensure the privacy and security of communication with the cloud.

Author Contributions

Conceptualization, A.B.A., M.A.R. and S.A.A.; methodology, A.B.A., M.A.R. and S.A.A.; software, A.B.A., M.A.R. and A.B.I.; validation, M.R.A. and A.B.I.; formal analysis, M.R.A. and A.B.I.; investigation, A.B.A. and M.A.R.; resources, A.B.A. and M.A.R.; data curation, A.B.A. and M.A.R.; writing—original draft preparation, A.B.A., M.A.R. and S.A.A.; writing—review and editing, M.R.A., A.S.A., A.M.R. and S.A.A.; visualization, A.B.A., M.A.R., M.R.A. and A.B.I.; supervision, M.R.A., A.S.A., A.M.R. and S.A.A.; project administration, S.A.A.; funding acquisition, S.A.A. and A.B.I. All authors have read and agreed to the published version of the manuscript.

Funding

This work was supported by the Researchers Supporting Project, King Saud University, Riyadh, Saudi Arabia, under Grant RSP2023R46.

Conflicts of Interest

The authors declare no conflict of interest.

Abbreviations

The following abbreviations are used in this manuscript:
PPGPhotoplethysmogram
SVDSingular Value Decomposition
T-SVDTruncated Singular Value Decomposition
OTPOne-Time Password
RFIDRadio Frequency Identification
IoTInternet of Things
QoSQuality of Service
SVMSupport Vector Machines
K-NNK-Nearest Neighbor
LDAinear Discriminant Analysis
QDAQuadratic Discriminant Analysis
EMDEmpirical Mode Decomposition
PCPersonal Computer
MSEMean Squared Error

References

  1. Bonissi, A.; Labati, R.D.; Perico, L.; Sassi, R.; Scotti, F.; Sparagino, L. A preliminary study on continuous authentication methods for photoplethysmographic biometrics. In Proceedings of the 2013 IEEE Workshop on Biometric Measurements and Systems for Security and Medical Applications, Napoli, Italy, 9 September 2013; pp. 28–33. [Google Scholar]
  2. Fratini, A.; Sansone, M.; Bifulco, P.; Cesarelli, M. Individual identification via electrocardiogram analysis. Biomed. Eng. Online 2015, 14, 1–23. [Google Scholar] [CrossRef] [PubMed] [Green Version]
  3. Ranjan, R.; Bansal, A.; Zheng, J.; Xu, H.; Gleason, J.; Lu, B.; Nanduri, A.; Chen, J.C.; Castillo, C.D.; Chellappa, R. A fast and accurate system for face detection, identification, and verification. IEEE Trans. Biom. Behav. Identity Sci. 2019, 1, 82–96. [Google Scholar] [CrossRef] [Green Version]
  4. Lai, J.H.; Yuen, P.C.; Feng, G.C. Face recognition using holistic Fourier invariant features. Pattern Recognit. 2001, 34, 95–109. [Google Scholar] [CrossRef]
  5. Tamura, T.; Maeda, Y.; Sekine, M.; Yoshida, M. Wearable photoplethysmographic sensors—Past and present. Electronics 2014, 3, 282–302. [Google Scholar] [CrossRef]
  6. Zhou, K.; Yin, Z.; Peng, Y.; Zeng, Z. Methods for Continuous Blood Pressure Estimation Using Temporal Convolutional Neural Networks and Ensemble Empirical Mode Decomposition. Electronics 2022, 11, 1378. [Google Scholar] [CrossRef]
  7. Han, J.; Ou, W.; Xiong, J.; Feng, S. Remote Heart Rate Estimation by Pulse Signal Reconstruction Based on Structural Sparse Representation. Electronics 2022, 11, 3738. [Google Scholar] [CrossRef]
  8. Alotaiby, T.N.; Aljabarti, F.; Alotibi, G.; Alshebeili, S.A. A nonfiducial PPG-based subject Authentication Approach using the statistical features of DWT-based filtered signals. J. Sens. 2020, 2020, 8849845. [Google Scholar] [CrossRef]
  9. Kavsaoğlu, A.R.; Polat, K.; Bozkurt, M.R. A novel feature ranking algorithm for biometric recognition with PPG signals. Comput. Biol. Med. 2014, 49, 1–14. [Google Scholar] [CrossRef]
  10. Sarkar, A.; Abbott, A.L.; Doerzaph, Z. Biometric authentication using photoplethysmography signals. In Proceedings of the 2016 IEEE 8th International Conference on Biometrics Theory, Applications and Systems (BTAS), Niagara Falls, NY, USA, 6–9 September 2016; pp. 1–7. [Google Scholar]
  11. Jindal, V.; Birjandtalab, J.; Pouyan, M.B.; Nourani, M. An adaptive deepearning approach for PPG-based identification. In Proceedings of the 2016 38th Annual International Conference of the IEEE Engineering in Medicine and Biology Society (EMBC), Orlando, FL, USA, 16–20 August 2016; pp. 6401–6404. [Google Scholar]
  12. Nagaraju, S.; Rege, V.; Gudino, J.; Ramesha, C. Realistic directional antenna suite for cooja simulator. In Proceedings of the 2017 Twenty-third National Conference on Communications (NCC), Chennai, India, 2–4 March 2017; pp. 1–6. [Google Scholar]
  13. Yadav, U.; Abbas, S.N.; Hatzinakos, D. Evaluation of PPG biometrics for authentication in different states. In Proceedings of the 2018 International Conference on Biometrics (ICB), Gold Coast, QLD, Australia, 20–23 February 2018; pp. 277–282. [Google Scholar]
  14. Nishimoto, Y.; Imaizumi, H.; Mita, N. Integrated digital rights management for mobile IPTV using broadcasting and communications. IEEE Trans. Broadcast. 2009, 55, 419–424. [Google Scholar] [CrossRef]
  15. Gu, Y.; Zhang, Y.; Zhang, Y. A novel biometric approach in human verification by photoplethysmographic signals. In Proceedings of the 4th International IEEE EMBS Special Topic Conference on Information Technology Applications in Biomedicine, Birmingham, UK, 24–26 April 2003; pp. 13–14. [Google Scholar]
  16. Abdulkader, S.S.; Qidwai, U.A. A review on PPG compression techniques and implementations. In Proceedings of the 2020 IEEE-EMBS Conference on Biomedical Engineering and Sciences (IECBES), Langkawi Island, Malaysia, 1–3 March 2021; pp. 511–516. [Google Scholar]
  17. Xiao, J.; Hu, F.; Shao, Q.; Li, S. Aow-complexity compressed sensing reconstruction method for heart signal biometric recognition. Sensors 2019, 19, 5330. [Google Scholar] [CrossRef]
  18. Alam, S.; Gupta, R.; Sharma, K.D. On-board signal quality assessment guided compression of photoplethysmogram for personal health monitoring. IEEE Trans. Instrum. Meas. 2021, 70, 1–9. [Google Scholar] [CrossRef]
  19. Sunil Kumar, K.N.; Shankar, S.; Keshavamurthy. Compression of PPG Signal through Joint Technique of Auto-encoder and Feature Selection. Int. J. Healthc. Inf. Syst. Inform. 2021, 16, 1–15. [Google Scholar]
  20. Klus, L.; Klus, R.; Lohan, E.S.; Granell, C.; Talvitie, J.; Valkama, M.; Nurmi, J. Directightweight temporal compression for wearable sensor data. IEEE Sens. Lett. 2021, 5, 1–4. [Google Scholar] [CrossRef]
  21. Golec, M.; Gill, S.S.; Bahsoon, R.; Rana, O. BioSec: A biometric authentication framework for secure and private communication among edge devices in IoT and industry 4.0. IEEE Consum. Electron. Mag. 2020, 11, 51–56. [Google Scholar] [CrossRef]
  22. Yang, W.; Wang, S.; Sahri, N.M.; Karie, N.M.; Ahmed, M.; Valli, C. Biometrics for Internet-of-Things security: A review. Sensors 2021, 21, 6163. [Google Scholar] [CrossRef]
  23. Ning, S.; He, Y.; Farhan, A.; Wu, Y.; Tong, J. A method for theocalization of partial discharge sources in transformers using TDOA and truncated singular value decomposition. IEEE Sens. J. 2020, 21, 6741–6751. [Google Scholar] [CrossRef]
  24. Zhang, S.; Zhu, Y.; Dong, G.; Kuang, G. Truncated SVD-based compressive sensing for downward-looking three-dimensional SAR imaging with uniform/nonuniforminear array. IEEE Geosci. Remote Sens. Lett. 2015, 12, 1853–1857. [Google Scholar] [CrossRef]
  25. Zhang, Y.; Tuo, X.; Huang, Y.; Yang, J. A TV forward-looking super-resolution imaging method based on TSVD strategy for scanning radar. IEEE Trans. Geosci. Remote Sens. 2020, 58, 4517–4528. [Google Scholar] [CrossRef]
  26. Abe, M.; Shibata, K. Consideration on current and coil block placements with good homogeneity for MRI magnets using truncated SVD. IEEE Trans. Magn. 2012, 49, 2873–2880. [Google Scholar] [CrossRef]
  27. Alam, M.K.; Abd Aziz, A.; Abd Latif, S.; Abd Aziz, A. Error-Control Truncated SVD Technique for In-Network Data Compression in Wireless Sensor Networks. IEEE Access 2021, 9, 13829–13844. [Google Scholar] [CrossRef]
  28. Lee, H.; Chung, H.; Ko, H.; Lee, J. Wearable multichannel photoplethysmography framework for heart rate monitoring during intensive exercise. IEEE Sens. J. 2018, 18, 2983–2993. [Google Scholar] [CrossRef]
  29. Pilato, G.; Vassallo, G. TSVD as a statistical estimator in theatent semantic analysis paradigm. IEEE Trans. Emerg. Top. Comput. 2014, 3, 185–192. [Google Scholar] [CrossRef] [Green Version]
  30. Klema, V.; Laub, A. The singular value decomposition: Its computation and some applications. IEEE Trans. Autom. Control 1980, 25, 164–176. [Google Scholar] [CrossRef] [Green Version]
  31. Al-lahham, A.; Theeb, O.; Elalem, K.; Alshawi, T.A.; Alshebeili, S.A. Sky imager-based forecast of solar irradiance using machineearning. Electronics 2020, 9, 1700. [Google Scholar] [CrossRef]
  32. Karlen, W.; Turner, M.; Cooke, E.; Dumont, G.; Ansermino, J.M. CapnoBase: Signal database and tools to collect, share and annotate respiratory signals. In Proceedings of the 2010 Annual Meeting of the Society for Technology in Anesthesia, West Palm Beach, FL, USA, 13–16 January 2010; Society for Technology in Anesthesia: Milwaukee, WI, USA, 2010; p. 27. [Google Scholar]
  33. Karlen, W.; Raman, S.; Ansermino, J.M.; Dumont, G.A. Multiparameter respiratory rate estimation from the photoplethysmogram. IEEE Trans. Biomed. Eng. 2013, 60, 1946–1953. [Google Scholar] [CrossRef]
  34. Ahmed, A.N.; Othman, F.B.; Afan, H.A.; Ibrahim, R.K.; Fai, C.M.; Hossain, M.S.; Ehteram, M.; Elshafie, A. Machineearning methods for better water quality prediction. J. Hydrol. 2019, 578, 124084. [Google Scholar] [CrossRef]
  35. Kva°Lseth, T.O. Note on the R2 measure of goodness of fit for nonlinear models. Bull. Psychon. Soc. 1983, 21, 79–80. [Google Scholar]
  36. Sewak, M.; Sahay, S.K.; Rathore, H. An overview of deepearning architecture of deep neural networks and autoencoders. J. Comput. Theor. Nanosci. 2020, 17, 182–188. [Google Scholar] [CrossRef]
Figure 1. System model.
Electronics 12 00220 g001
Figure 2. Conceptual diagram for the proposed Codec.
Electronics 12 00220 g002
Figure 3. Samples of four different waveforms of 15-second PPG segments.
Electronics 12 00220 g003
Figure 4. The mean ± standard deviation of singular values of A.
Electronics 12 00220 g004
Figure 5. MSE versus k.
Electronics 12 00220 g005
Figure 6. MSE versus number of runs.
Electronics 12 00220 g006
Figure 7. Examples of original and reconstructed signals of four different subjects.
Electronics 12 00220 g007
Figure 8. ρ versus number of runs.
Electronics 12 00220 g008
Table 1. Statistical features of the original and reconstructed PPG segments of four individuals.
FeatureSubject 1Subject 2Subject 3Subject 4
OriginalReconstructedOriginalReconstructedOriginalReconstructedOriginalReconstructed
Mean0.0670.0670.0240.0240.0520.052−2.569−2.569
Median−1.480−1.468−0.210−0.212−0.990−0.970−3.920−3.872
Variance6.8376.8280.8000.7975.6785.67312.34012.273
Standard deviation2.6152.6130.8940.8932.3832.3823.5133.503
Interquartile range4.1104.0841.0901.0964.2704.2334.1604.187
Q1−1.910−1.919−0.600−0.598−2.010−2.006−5.250−5.235
Q22.2002.1660.4900.4972.2602.228−1.090−1.049
Kurtosis2.2672.2863.1143.1261.9321.9463.0513.036
Skewness0.9360.9360.7750.7710.6910.6911.1571.135
Entropy1.4431.5292.2582.5651.6201.7251.0271.130
Disclaimer/Publisher’s Note: The statements, opinions and data contained in all publications are solely those of the individual author(s) and contributor(s) and not of MDPI and/or the editor(s). MDPI and/or the editor(s) disclaim responsibility for any injury to people or property resulting from any ideas, methods, instructions or products referred to in the content.

