

Behavior of 3D Printed Stretchable Structured Sensors

Abstract
:1. Introduction
2. Methodology
3. Results
4. Discussions
5. Conclusions
Author Contributions
Funding
Data Availability Statement
Conflicts of Interest
Abbreviations
| CRE | Curved Re-Entrant |
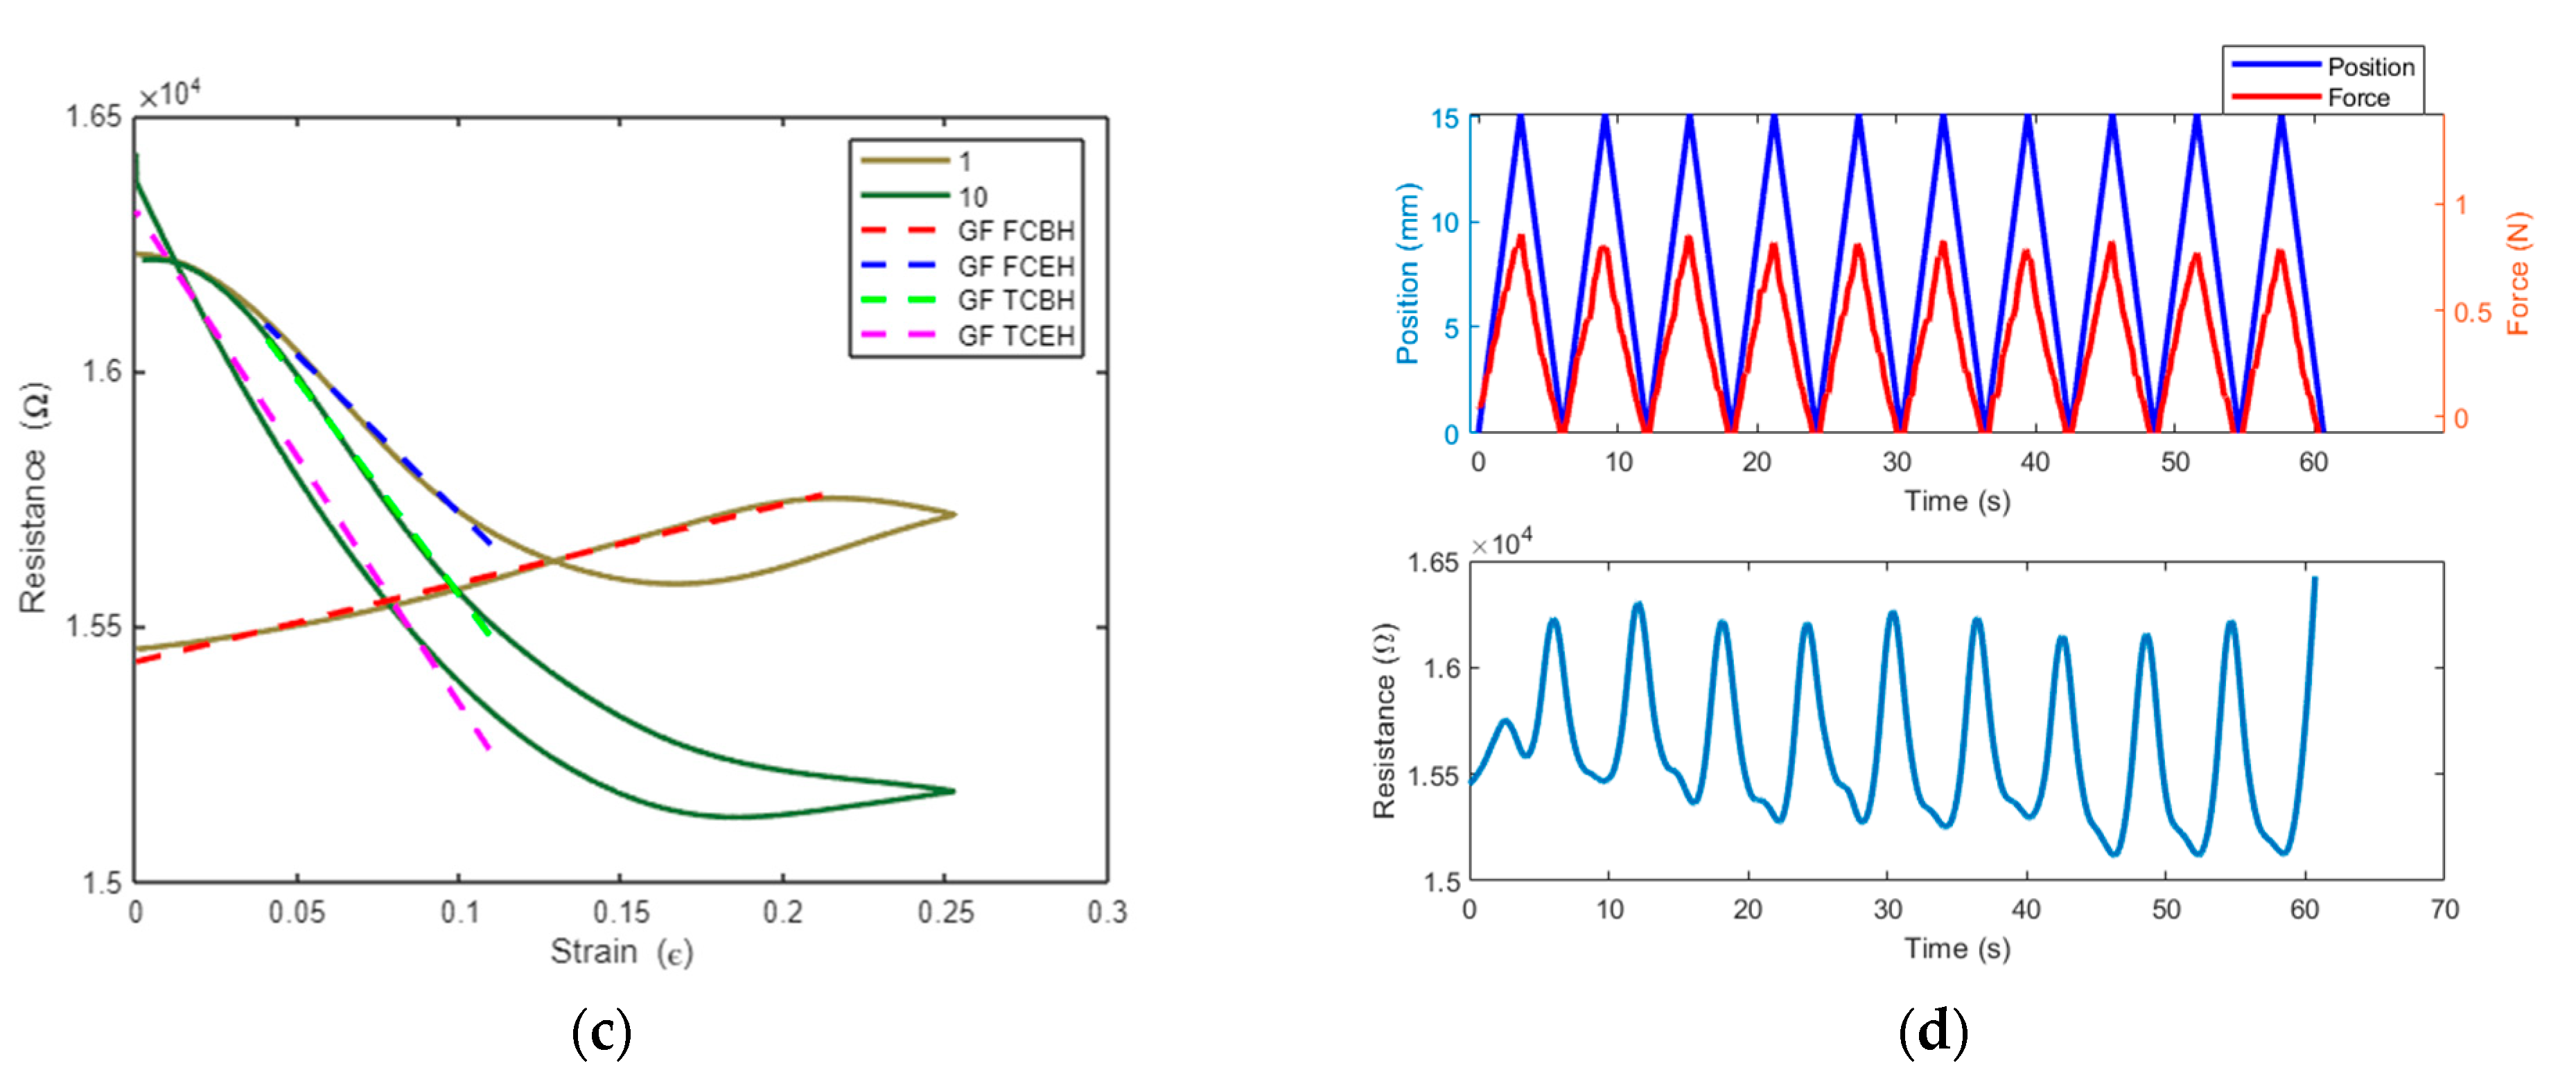
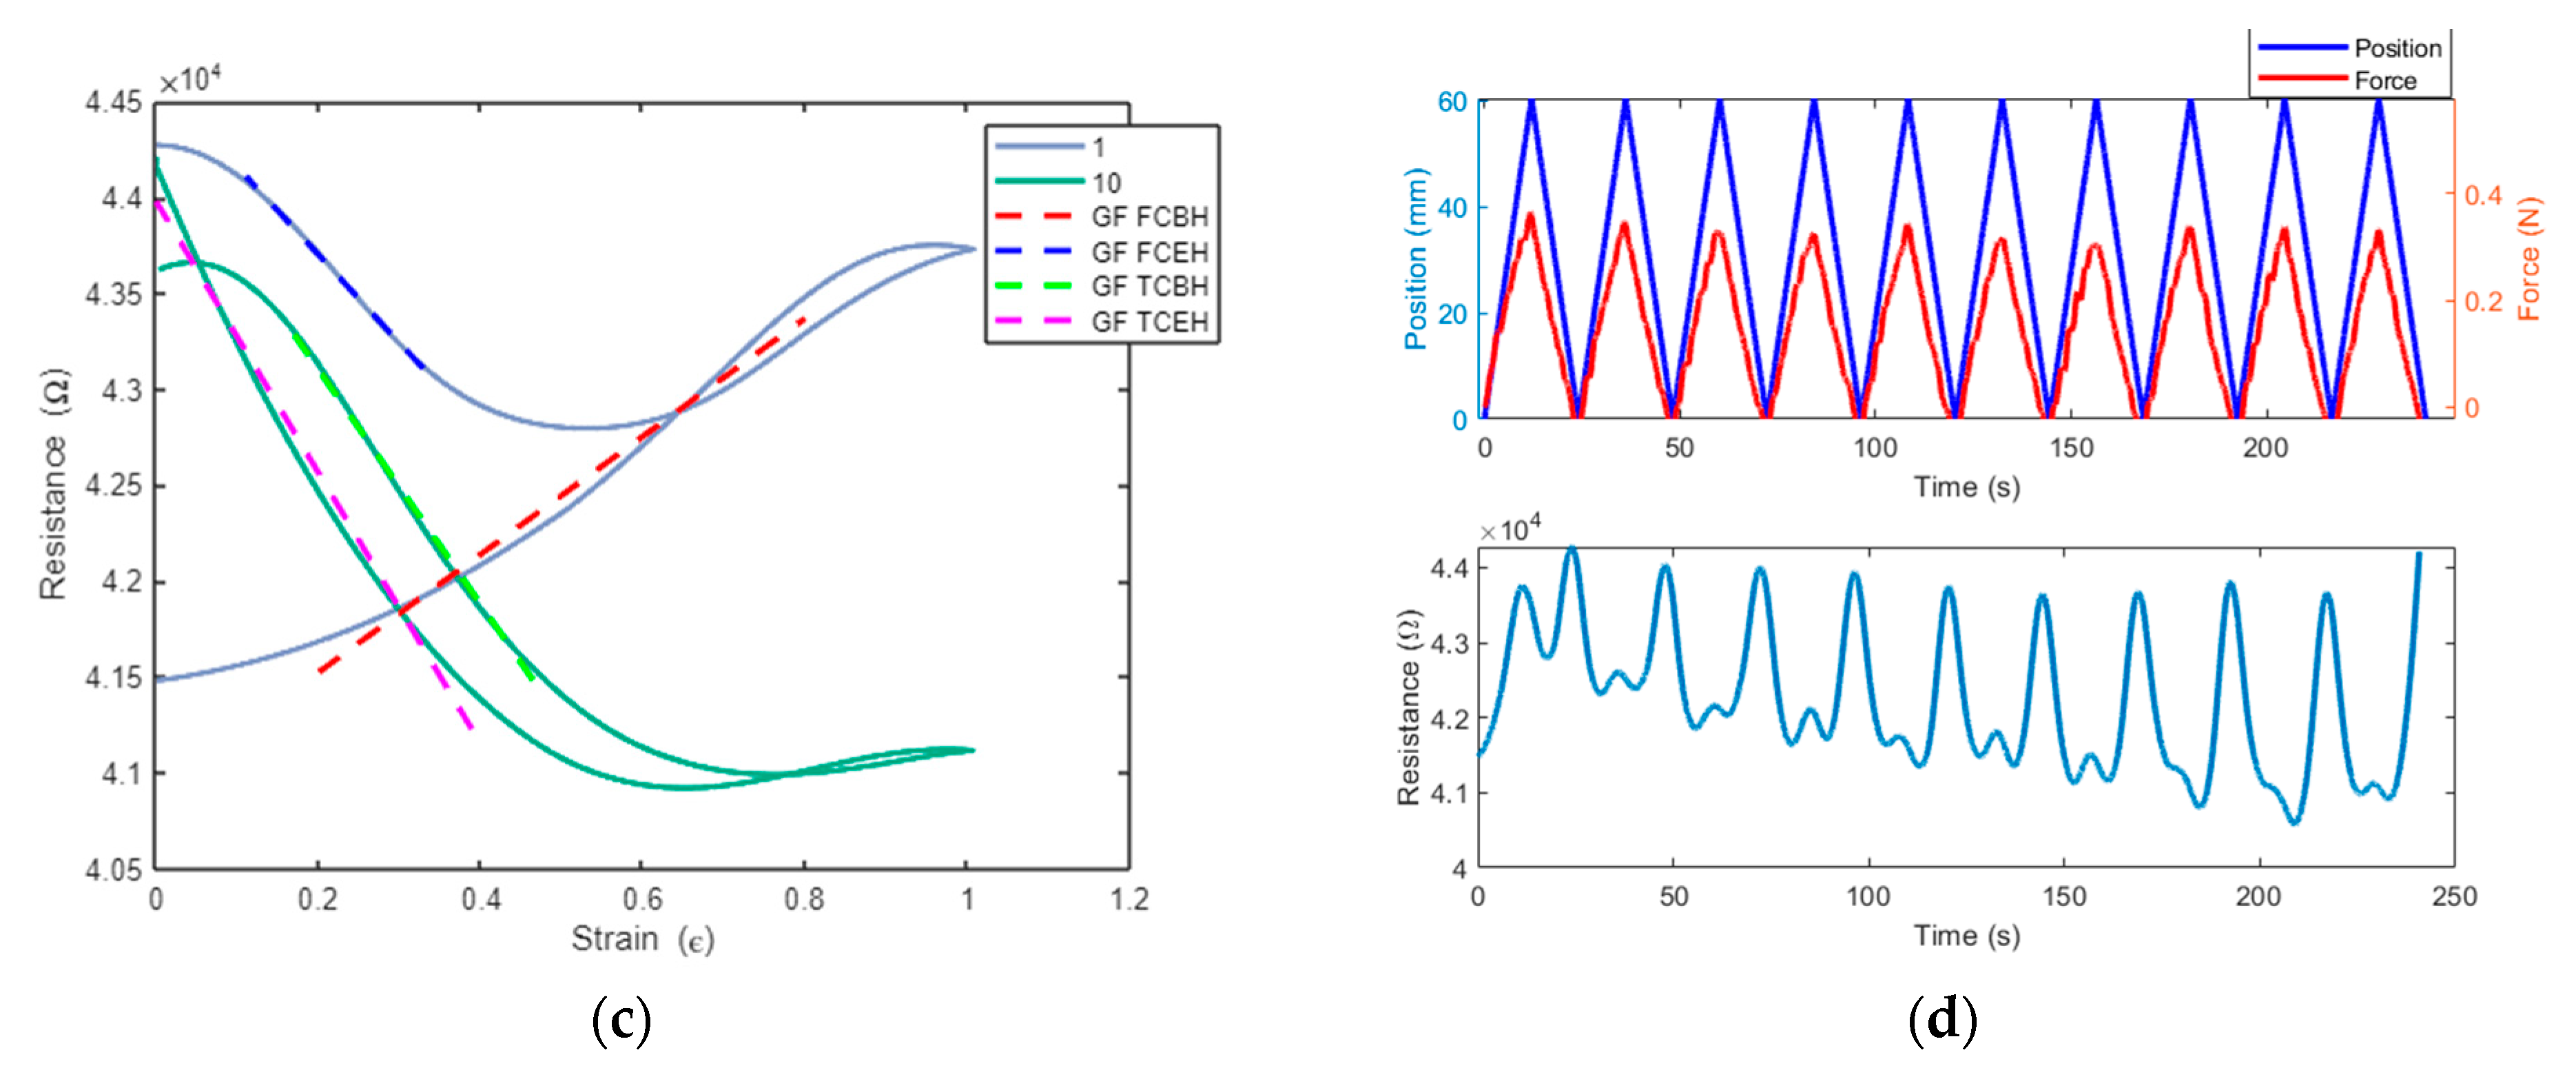
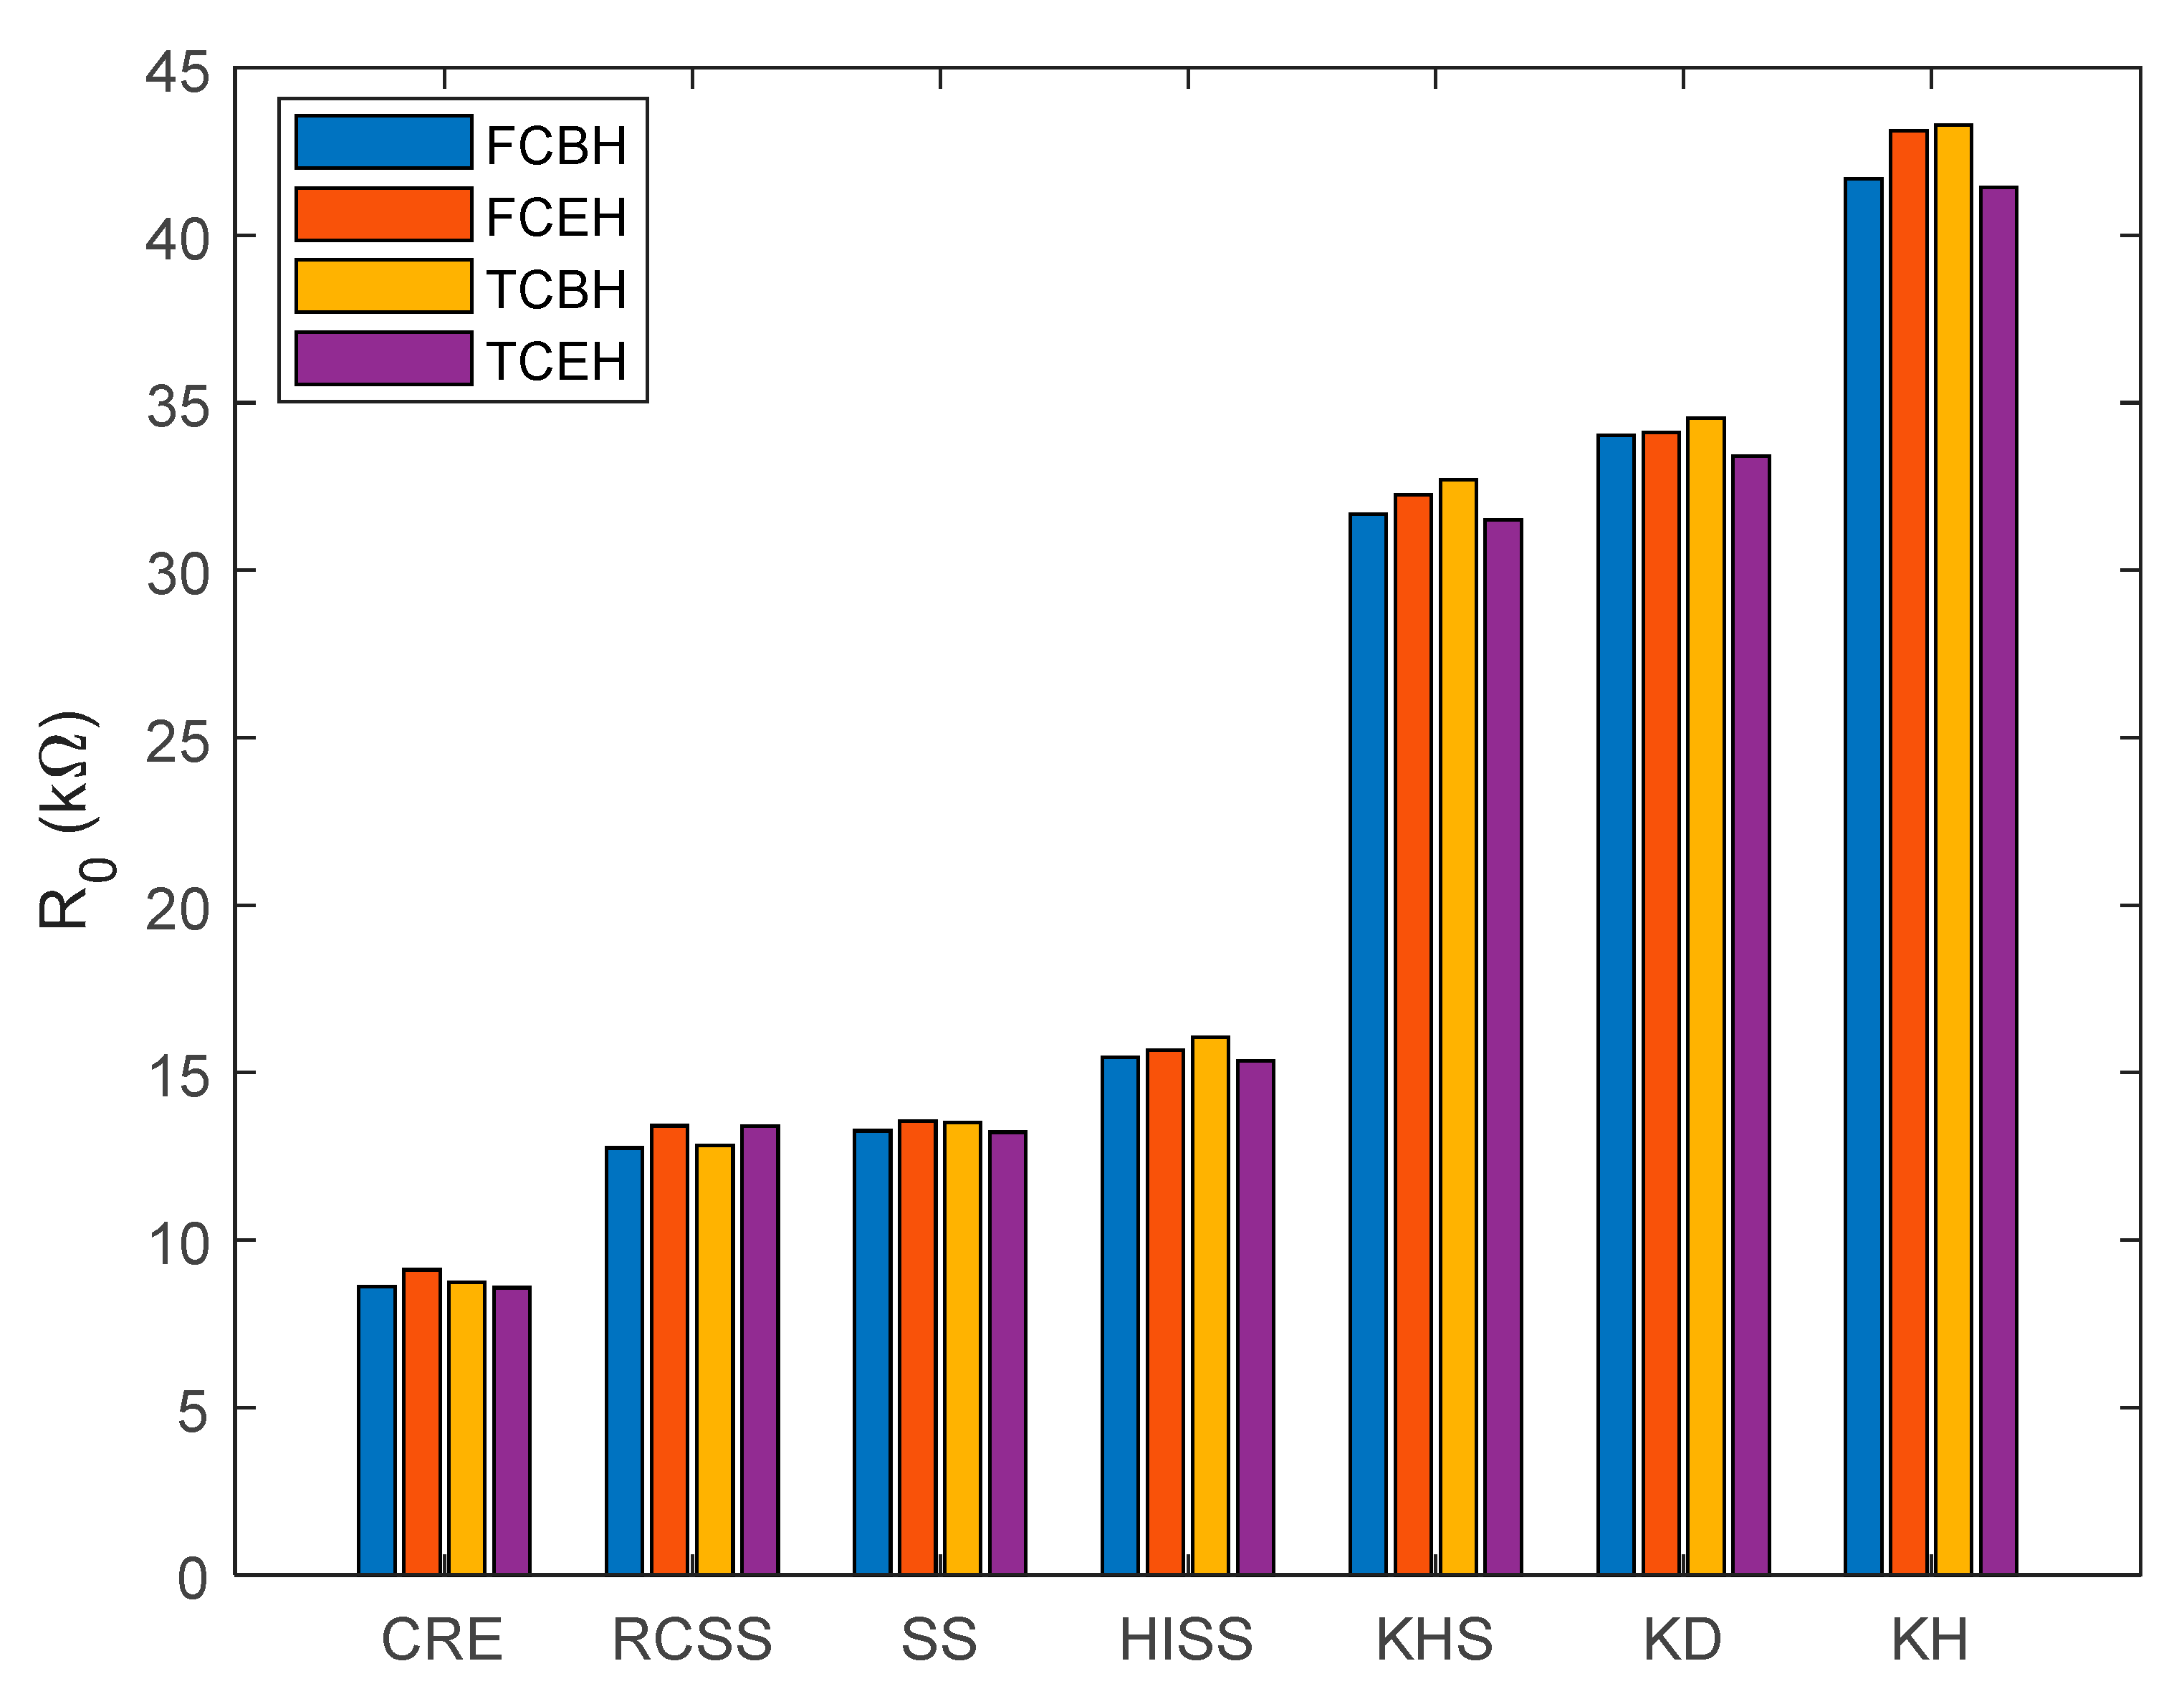
| FCBH | First Cycle Before Halfway |
| FCEH | First Cycle End of Halfway |
| FDM | Fused Deposition Modeling |
| HISS | Hourglass Inspired Serpentine Shape |
| KD | Kirigami Dumbbell |
| KH | Kirigami Hybrid |
| KHS | Kirigami H-Shape |
| RCSS | Reduced Curve Serpentine Shape |
| SS | Serpentine Shape |
| TCBH | Tenth Cycle Before Halfway |
| TCEH | Tenth Cycle End of Halfway |
| TPU | Thermoplastic Polyurethane |
References
- Liu, H.; Wang, L.; Lin, G.; Feng, Y. Recent progress in the fabrication of flexible materials for wearable sensors. Biomater. Sci. 2022, 10, 614–632. [Google Scholar] [CrossRef] [PubMed]
- Zhang, H.; He, R.; Niu, Y.; Han, F.; Li, J.; Zhang, X.; Xu, F. Graphene-enabled wearable sensors for healthcare monitoring. Biosens. Bioelectron. 2022, 197, 113777. [Google Scholar] [CrossRef] [PubMed]
- Sng, C.M.N.; Wee, L.M.C.; Tang, K.C.; Lee, K.C.J.; Wu, Q.H.; Yeo, J.C.; Bhagat, A.A.S. Wearable Soft Microtube Sensors for Quantitative Home-Based Erectile Dysfunction Monitoring. Sensors 2022, 22, 9344. [Google Scholar] [CrossRef] [PubMed]
- Tang, X.; Yang, W.; Yin, S.; Tai, G.; Su, M.; Yang, J.; Shi, H.; Wei, D.; Yang, J. Controllable graphene wrinkle for a high-performance flexible pressure sensor. ACS Appl. Mater. Interfaces 2021, 13, 20448–20458. [Google Scholar] [CrossRef]
- Hopkins, M.; Vaidyanathan, R.; Mcgregor, A.H. Examination of the performance characteristics of velostat as an in-socket pressure sensor. IEEE Sens. J. 2020, 20, 6992–7000. [Google Scholar] [CrossRef]
- Zhu, Y.; Li, X.; Zhao, Z.; Liang, Y.; Wang, L.; Liu, Y. Highly Stretchable, Transparent and Adhesive Ionogel Based on Chitosan-Poly (acrylic acid) Double Networks for Flexible Strain Sensors. Gels 2022, 8, 797. [Google Scholar] [CrossRef]
- Yang, D.; Yang, W.; Li, L.; Zhou, K.; Hao, M.; Feng, X.; Zhang, T.; Liu, Y. Highly Sensitive Microstructure-Based Flexible Pressure Sensor for Quantitative Evaluation of Motor Function Recovery after Spinal Cord Injury. Sensors 2019, 19, 4673. [Google Scholar] [CrossRef] [Green Version]
- Sundaram, S.; Kellnhofer, P.; Li, Y.; Zhu, J.-Y.; Torralba, A.; Matusik, W. Learning the signatures of the human grasp using a scalable tactile glove. Nature 2019, 569, 698–702. [Google Scholar] [CrossRef]
- Oh, D.; Seo, J.; Kim, H.G.; Ryu, C.; Bang, S.-W.; Park, S.; Kim, H.J. Multi-height micropyramids based pressure sensor with tunable sensing properties for robotics and step tracking applications. Micro Nano Syst. Lett. 2022, 10, 1–7. [Google Scholar] [CrossRef]
- Zhong, M.; Zhang, L.; Liu, X.; Zhou, Y.; Zhang, M.; Wang, Y.; Yang, L.; Wei, D. Wide linear range and highly sensitive flexible pressure sensor based on multistage sensing process for health monitoring and human-machine interfaces. Chem. Eng. J. 2021, 412, 128649. [Google Scholar] [CrossRef]
- Salo, T.; Di Vito, D.; Halme, A.; Vanhala, J. Electromechanical Properties of 3D-Printed Stretchable Carbon Fiber Composites. Micromachines 2022, 13, 1732. [Google Scholar] [CrossRef] [PubMed]
- Tang, Z.; Jia, S.; Zhou, C.; Li, B. 3D printing of highly sensitive and large-measurement-range flexible pressure sensors with a positive piezoresistive effect. ACS Appl. Mater. Interfaces 2020, 12, 28669–28680. [Google Scholar] [CrossRef] [PubMed]
- Verma, P.; Ubaid, J.; Varadarajan, K.M.; Wardle, B.L.; Kumar, S. Synthesis and Characterization of Carbon Nanotube-Doped Thermoplastic Nanocomposites for the Additive Manufacturing of Self-Sensing Piezoresistive Materials. ACS Appl. Mater. Interfaces 2022, 14, 8361–8372. [Google Scholar] [CrossRef] [PubMed]
- Lanzolla, A.M.L.; Attivissimo, F.; Percoco, G.; Ragolia, M.A.; Stano, G.; Di Nisio, A. Additive manufacturing for sensors: Piezoresistive strain gauge with temperature compensation. Appl. Sci. 2022, 12, 8607. [Google Scholar] [CrossRef]
- Widlund, T.; Yang, S.; Hsu, Y.-Y.; Lu, N. Stretchability and compliance of freestanding serpentine-shaped ribbons. Int. J. Solids Struct. 2014, 51, 4026–4037. [Google Scholar] [CrossRef] [Green Version]
- Sim, K.; Li, Y.; Song, J.; Yu, C. Biaxially stretchable ultrathin Si enabled by serpentine structures on prestrained elastomers. Adv. Mater. Technol. 2019, 4, 1800489. [Google Scholar] [CrossRef]
- Meena, K.; Singamneni, S. A new auxetic structure with significantly reduced stress concentration effects. Mater. Des. 2019, 173, 107779. [Google Scholar] [CrossRef]
- Jiang, Y.; Liu, Z.; Matsuhisa, N.; Qi, D.; Leow, W.R.; Yang, H.; Yu, J.; Chen, G.; Liu, Y.; Wan, C. Auxetic mechanical metamaterials to enhance sensitivity of stretchable strain sensors. Adv. Mater. 2018, 30, 1706589. [Google Scholar] [CrossRef]
- Zhou, X.; Parida, K.; Halevi, O.; Liu, Y.; Xiong, J.; Magdassi, S.; Lee, P.S. All 3D-printed stretchable piezoelectric nanogenerator with non-protruding kirigami structure. Nano Energy 2020, 72, 104676. [Google Scholar] [CrossRef]
- Lee, H.C.; Hsieh, E.Y.; Yong, K.; Nam, S. Multiaxially-stretchable kirigami-patterned mesh design for graphene sensor devices. Nano Res. 2020, 13, 1406–1412. [Google Scholar] [CrossRef]
- Wang, L.; Chiang, W.-H.; Loh, K.J. Topological design of strain sensing nanocomposites. Sci. Rep. 2022, 12, 9179. [Google Scholar] [CrossRef] [PubMed]
- Taherkhani, B.; Azizkhani, M.B.; Kadkhodapour, J.; Anaraki, A.P.; Rastgordani, S. Highly sensitive, piezoresistive, silicone/carbon fiber-based auxetic sensor for low strain values. Sens. Actuators A Phys. 2020, 305, 111939. [Google Scholar] [CrossRef]
- Liu, H.; Kollosche, M.; Yan, J.; Zellner, E.M.; Bentil, S.A.; Rivero, I.V.; Wiersema, C.; Laflamme, S. Numerical investigation of auxetic textured soft strain gauge for monitoring animal skin. Sensors 2020, 20, 4185. [Google Scholar] [CrossRef] [PubMed]
- Shui, X.; Chung, D. A new electromechanical effect in discontinuous-filament elastomer-matrix composites. Smart Mater. Struct. 1997, 6, 102. [Google Scholar] [CrossRef]
- Lu, N.; Lu, C.; Yang, S.; Rogers, J. Highly sensitive skin-mountable strain gauges based entirely on elastomers. Adv. Funct. Mater. 2012, 22, 4044–4050. [Google Scholar] [CrossRef]
- Johnson, O.K.; Kaschner, G.C.; Mason, T.A.; Fullwood, D.T.; Hansen, G. Optimization of nickel nanocomposite for large strain sensing applications. Sens. Actuators A Phys. 2011, 166, 40–47. [Google Scholar] [CrossRef]
- Li, S.; Park, J.G.; Wang, S.; Liang, R.; Zhang, C.; Wang, B. Working mechanisms of strain sensors utilizing aligned carbon nanotube network and aerosol jet printed electrodes. Carbon 2014, 73, 303–309. [Google Scholar] [CrossRef]
- Yan, Y.; Sencadas, V.; Zhang, J.; Zu, G.; Wei, D.; Jiang, Z. Processing, characterisation and electromechanical behaviour of elastomeric multiwall carbon nanotubes-poly (glycerol sebacate) nanocomposites for piezoresistive sensors applications. Compos. Sci. Technol. 2017, 142, 163–170. [Google Scholar] [CrossRef]


| Name | Resistance (kΩ) |
|---|---|
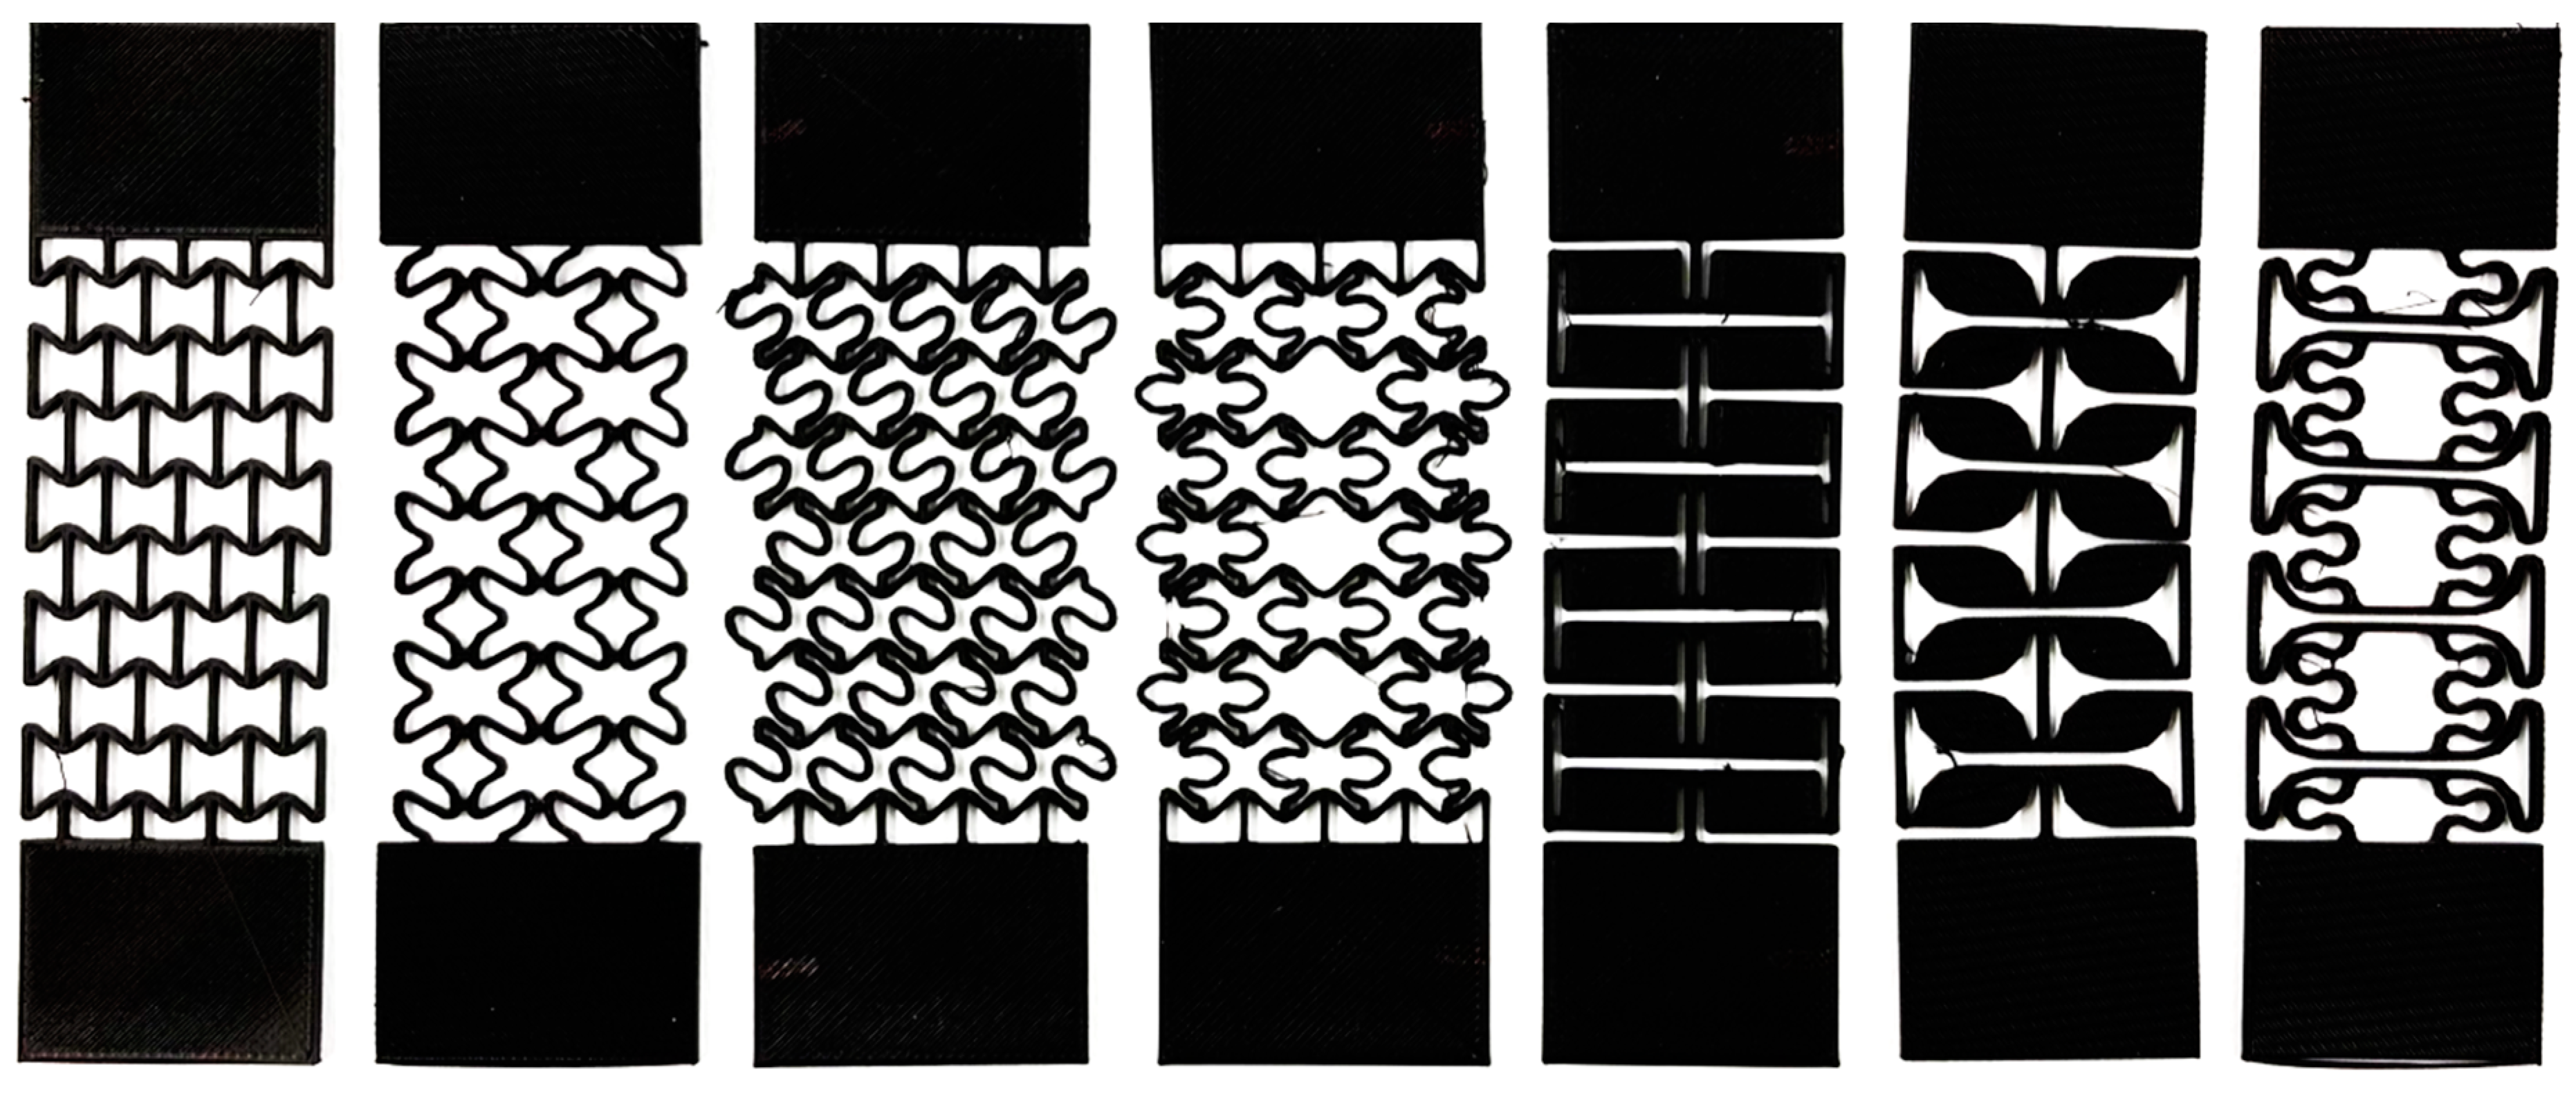
| Curved Re-Entrant (CRE) | 10.84 |
| Reduced Curve Serpentine Shape (RCSS) | 17.12 |
| Serpentine Shape (SS) | 15.41 |
| Hourglass Inspired Serpentine Shape (HISS) | 19.52 |
| Kirigami H-Shape (KHS) | 34.94 |
| Kirigami Dumbbell (KD) | 36.64 |
| Kirigami Hybrid (KH) | 45.9 |
| Name | Lower Position Limit (mm) | Upper Cyclic Position Limit (mm) | Gripper Displacement Rate (mm/min) | Sample Rate (sample/s) |
|---|---|---|---|---|
| CRE | 0.00 | 10.00 | 300.00 | 100.00 |
| RCSS | 0.00 | 15.00 | 300.00 | 100.00 |
| SS | 0.00 | 15.00 | 300.00 | 100.00 |
| HISS | 0.00 | 15.00 | 300.00 | 100.00 |
| KHS | 0.00 | 30.00 | 300.00 | 100.00 |
| KD | 0.00 | 30.00 | 300.00 | 100.00 |
| KH | 0.00 | 60.00 | 300.00 | 100.00 |
Disclaimer/Publisher’s Note: The statements, opinions and data contained in all publications are solely those of the individual author(s) and contributor(s) and not of MDPI and/or the editor(s). MDPI and/or the editor(s) disclaim responsibility for any injury to people or property resulting from any ideas, methods, instructions or products referred to in the content. |
© 2022 by the authors. Licensee MDPI, Basel, Switzerland. This article is an open access article distributed under the terms and conditions of the Creative Commons Attribution (CC BY) license (https://creativecommons.org/licenses/by/4.0/).
Share and Cite
Kim, E.; Khaleghian, S.; Emami, A. Behavior of 3D Printed Stretchable Structured Sensors. Electronics 2023, 12, 18. https://doi.org/10.3390/electronics12010018
Kim E, Khaleghian S, Emami A. Behavior of 3D Printed Stretchable Structured Sensors. Electronics. 2023; 12(1):18. https://doi.org/10.3390/electronics12010018
Chicago/Turabian StyleKim, Eugene, Seyedmeysam Khaleghian, and Anahita Emami. 2023. "Behavior of 3D Printed Stretchable Structured Sensors" Electronics 12, no. 1: 18. https://doi.org/10.3390/electronics12010018