Article

Mobile Robot Gas Source Localization Using SLAM-GDM with a Graphene-Based Gas Sensor

by
Wan Abdul Syaqur Norzam
1,*,
Huzein Fahmi Hawari
1,
Kamarulzaman Kamarudin
2,
Zaffry Hadi Mohd Juffry
2,
Nurul Athirah Abu Hussein
1,
Monika Gupta
1 and
Abdulnasser Nabil Abdullah
2
1
Department of Electrical & Electronic Engineering, Universiti Teknologi PETRONAS (UTP), Seri Iskandar 32610, Malaysia
2
Faculty of Electrical Engineering Technology, Universiti Malaysia Perlis (UniMAP), Arau 02600, Malaysia
*
Author to whom correspondence should be addressed.
Electronics 2023, 12(1), 171; https://doi.org/10.3390/electronics12010171
Submission received: 25 October 2022 / Revised: 16 November 2022 / Accepted: 19 November 2022 / Published: 30 December 2022
(This article belongs to the Special Issue Recent Advances in Industrial Robots)

Abstract

:
Mobile olfaction is one of the applications of mobile robots. Metal oxide sensors (MOX) are mobile robots’ most popular gas sensors. However, the sensor has drawbacks, such as high-power consumption, high operating temperature, and long recovery time. This research compares a reduced graphene oxide (RGO) sensor with the traditionally used MOX in a mobile robot. The method uses a map created from simultaneous localization and mapping (SLAM) combined with gas distribution mapping (GDM) to draw the gas distribution in the map and locate the gas source. RGO and MOX are tested in the lab for their response to 100 and 300 ppm ethanol. Both sensors’ response and recovery times show that RGO resulted in 56% and 54% faster response times, with 33% and 57% shorter recovery times than MOX. In the experiment, one gas source, 95% ethanol solution, is placed in the lab, and the mobile robot runs through the map in 7 min and 12 min after the source is set, with five repetitions. The results show the average distance error of the predicted source from the actual location was 19.52 cm and 30.28 cm using MOX and 25.24 cm and 30.60 cm using the RGO gas sensor for the 7th and 12th min trials, respectively. The errors show that the predicted gas source location based on MOX is 1.0% (12th min), much closer to the actual site than that predicted with RGO. However, RGO also shows a larger gas sensing area than MOX by 0.35–8.33% based on the binary image of the SLAM-GDM map, which indicates that RGO is much more sensitive than MOX in the trial run. Regarding power consumption, RGO consumes an average of 294.605 mW, 56.33% less than MOX, with an average consumption of 674.565 mW. The experiment shows that RGO can perform as well as MOX in mobile olfaction applications but with lower power consumption and operating temperature.

1. Introduction

A mobile robot is a type of robot that can move freely in the environment using a wheel-based or foot-based system. These robots are developed to help solve problems associated with tasks that are harmful to humans. Such duties include repetitive movement, which can result in ergonomic risk, and potential exposure to toxic or odorless gas that can cause harm to humans. Mobile robots have attracted the attention of many researchers as a way to solve problems, with research continually conducted to explore additional robot capabilities.
The usage of gas sensors in mobile robots, also known as mobile olfaction, is among the contributions that mobile robots can make to solve gas-related problems or, more specifically, gas leakage. Gas leakage can occur in any indoor area, especially in the oil and gas industry, associated with the emission of volatile organic compounds (VOCs), such as acetone, ethanol, and methanol. Popular gas sensors available are based on electrochemical, catalytic, and chemoresistive gas sensors. The electrochemical sensor usually consists of several electrodes in contact with electrolytes. The gas diffuses into the sensor to the working electrode. It interacts with the sensing material, causing a chemical reaction and an electrical current passing through the measuring circuit [1]. In contrast, a catalytic sensor works when combustible gas burns on the detector element. This increases the temperature, as well as the resistance value [2]. Chemoresistive sensors consist of sensing material in bulk or deposited on a suitable support, on which a molecular reaction takes place. This leads to a change in concentration-dependent properties that can be transformed into an electrical signal when in contact with environmental gas, and oxidization or a reduction process occurs [3].
The most commonly used gas sensors for mobile robots are chemoresistive sensors based on metal oxide (MOX). MOX can be based on zinc, iron, and tin oxide. MOX is popular owing to its sensitivity, reliability, low deployment cost, and low complexity in electronic parts, making it a viable choice for mobile robots [4]. However, the sensor is subject to drawbacks, including high operating temperature with high power consumption owing to the requirement of an additional heater circuit beside the sensing circuit to power the sensor [5]. Typically, the power usage is high due to the time requirement of the MOX sensor to reach its operating temperature and stability when it is turned ON and exposed to air or VOCs [6]. Power usage is crucial, especially in mobile olfaction areas where the robots are battery-powered with limited operating time.
Concerning MOX, Ref. [7] used two metal oxide sensors: Figaro TGS2620 and TGS2610. In some cases, an e-nose is also used to increase the sensor selectivity to different gas classifications. The authors of [8] used two e-noses comprising an array of four MOX sensors (two TGS2600, one TGS2602, and one TGS2620). Each MOX sensor typically consumes 210 mW for the heating circuit alone. When used in multiples, the power consumption is further increased, limiting the operating time of the mobile robot. The authors of [9] proposed using an array of 16 MOX gas sensors (4 TGS2600, 4 TGS2602, 4 TGS2611, and 4 TGS2620) sampled in open conditions. The gas sensor array is designed to be constantly turned ON, even in mobile robot recharging conditions. The sensors are operated at different operating temperatures using pulse width modulation (PWM) of duty cycles (25%, 50%, 75%, and 62.5%). The researcher tested three gas conditions: (1) ethanol, (2) acetone, and (3) ethanol and acetone at different locations. They reported that the sensors successfully detected and classified ethanol and acetone, except under condition (3), for which only one of the gasses with a higher concentration was observed at a location. In other cases, researchers [10] used three different MOX gas sensors coated with tin dioxide (SnO2), tungsten trioxide (WO3), and nickel dioxide (NiO) sensing material. The SnO2 is doped with 2% Palladium and 0.4% Platinum (SnO2-PdPt) for enhanced stability. Researchers used different metal oxides to increase the selectivity of VOC detection towards hazardous gas for rescuers (toxic and explosive gas). The researcher used 2-propanol as the target VOC in their experiment with two different VOC injection methods (head-space sampling and spray injection). All three sensors could produce repeatable results, with NiO showing the best repeatability of the gas source location. In terms of response, SnO2-PdPt achieved a response rate of 80% (a decrease in resistance from baseline) in head-space sampling and a 60% response using the VOC spray-injection method. WO3 achieved a lower response rate of 40% and 15%, and NiO showed the lowest response rates of 10% and 5% towards the target VOC. Moreover, Ref. [11] used three TGS2620 MOX gas sensors for mobile olfaction applications. The researcher reported that the sensor requires a long recovery time of 60 s after leaving the gas source area, resulting in errors in the gas distribution map, where the gas appears to drift along with the mobile robot and cause errors in predicting the gas source location.
Besides the recovery time, the MOX gas sensor operates at high temperatures, typically at an average of 300 °C [8,10,11]. This statement is also supported by the research done by the researcher [12], which uses Titanium Dioxide nanowires (NW-TiO2). The researcher tested the NW-TiO2 against 100 ppm ethanol at the different operating temperatures of 25, 150, 300, and 450 °C. The researcher found that at higher operational temperature changes from 25 to 300 °C, the response time becomes much faster, from 310 s reduced to 18 s. The recovery time also shows significant results, reduced from 400 s to 22 s based on the results of the researcher sample D. The high operating temperature is due to the requirement of improving the sensor response and sensitivity towards gas like acetone, ethanol, carbon monoxide, and toluene. This change is due to the competition of slow kinetic energy at low temperatures and enhanced desorption at high temperatures, which directly affects the sensor conductor changes [13,14]. Researcher [15] also highlights that using embedded metal nanoparticles or mixed metal oxide active layers can reduce the sensor’s operating temperature. However, a heater circuit is still needed since most sensors still require a specific operating temperature (50 to 200 °C) to yield optimal gas sensing results. It is also noted that the usage of MOX also requires high power consumption, and frequently, different MOX is used to increase sensor selectivity [8,9,11].
Besides the conventional ground mobile robot with gas sensor MOX, biohybrid or biosensor based on insect odor receptors has also been developed to be used with unmanned aerial vehicles (UAVs), commonly known as drones. The biohybrid system integrates with synthetic devices developed by researchers [16] to introduce human palm-sized drones equipped with an insect’s odor-sensing antennae. The drones they set can navigate autonomously toward the source of the airborne odor source. Combined with the odor source localization technique, the researcher managed to detect the airborne odor while avoiding obstacles in its flight path in a confined space. Meanwhile, researchers [17,18] also developed a fully autonomous drone with a portable electroantennogram (EAG) based on silk moth antennae mounted on the sensor. The researcher used the bombykol based on adult male silk moth antennae for odorant stimulation to conduct the odor source localization. The drone is moved using the spiral movement based on the spiral-surge algorithm. The EAG signal intensities intensify over time to search the odor source location by exploring the maximum value of the odor concentration based on the algorithm. The drone can detect the odor with approximately 1 s response and recovery time, with constant repeatability of the sensor response. However, the devices consume an average of 680 mW, and using the 110 mAh battery only allows an operating time of 30 min. The antennae used also requires changes after one h of usage, and the signal intensity decreases rapidly over time. Even though the biohybrid sensor can offer a good response, recovery, and repeatability in odor sensing, the sensor is still limited by its low operating time with its high-power consumption of 680 mW from the devices alone. This also limits the distance area the drone can cover, which cannot fully use the high mobility features of the drone.
Another type of chemoresistive sensor available is based on graphene, one of the prominent sensors that proved able to detect a wide variety of gas with high sensitivity, low operating temperature, and huge specific surface area for gas absorption [19]. The sensor can detect the gas by absorption of the gas molecule, triggering charge transfer between graphene and gas molecule, which results in a change of conductance. The graphene-based gas sensor does not require the additional heater circuit to increase its working temperature as opposed to the MOX.
So far, from our knowledge, there are yet to be seen graphene-based gas sensors that are associated with mobile robots. Hence, this research will investigate the graphene-based sensor capability to replace the traditionally used metal oxide sensor for gas source localization on the mobile robot.

2. Research Methodology

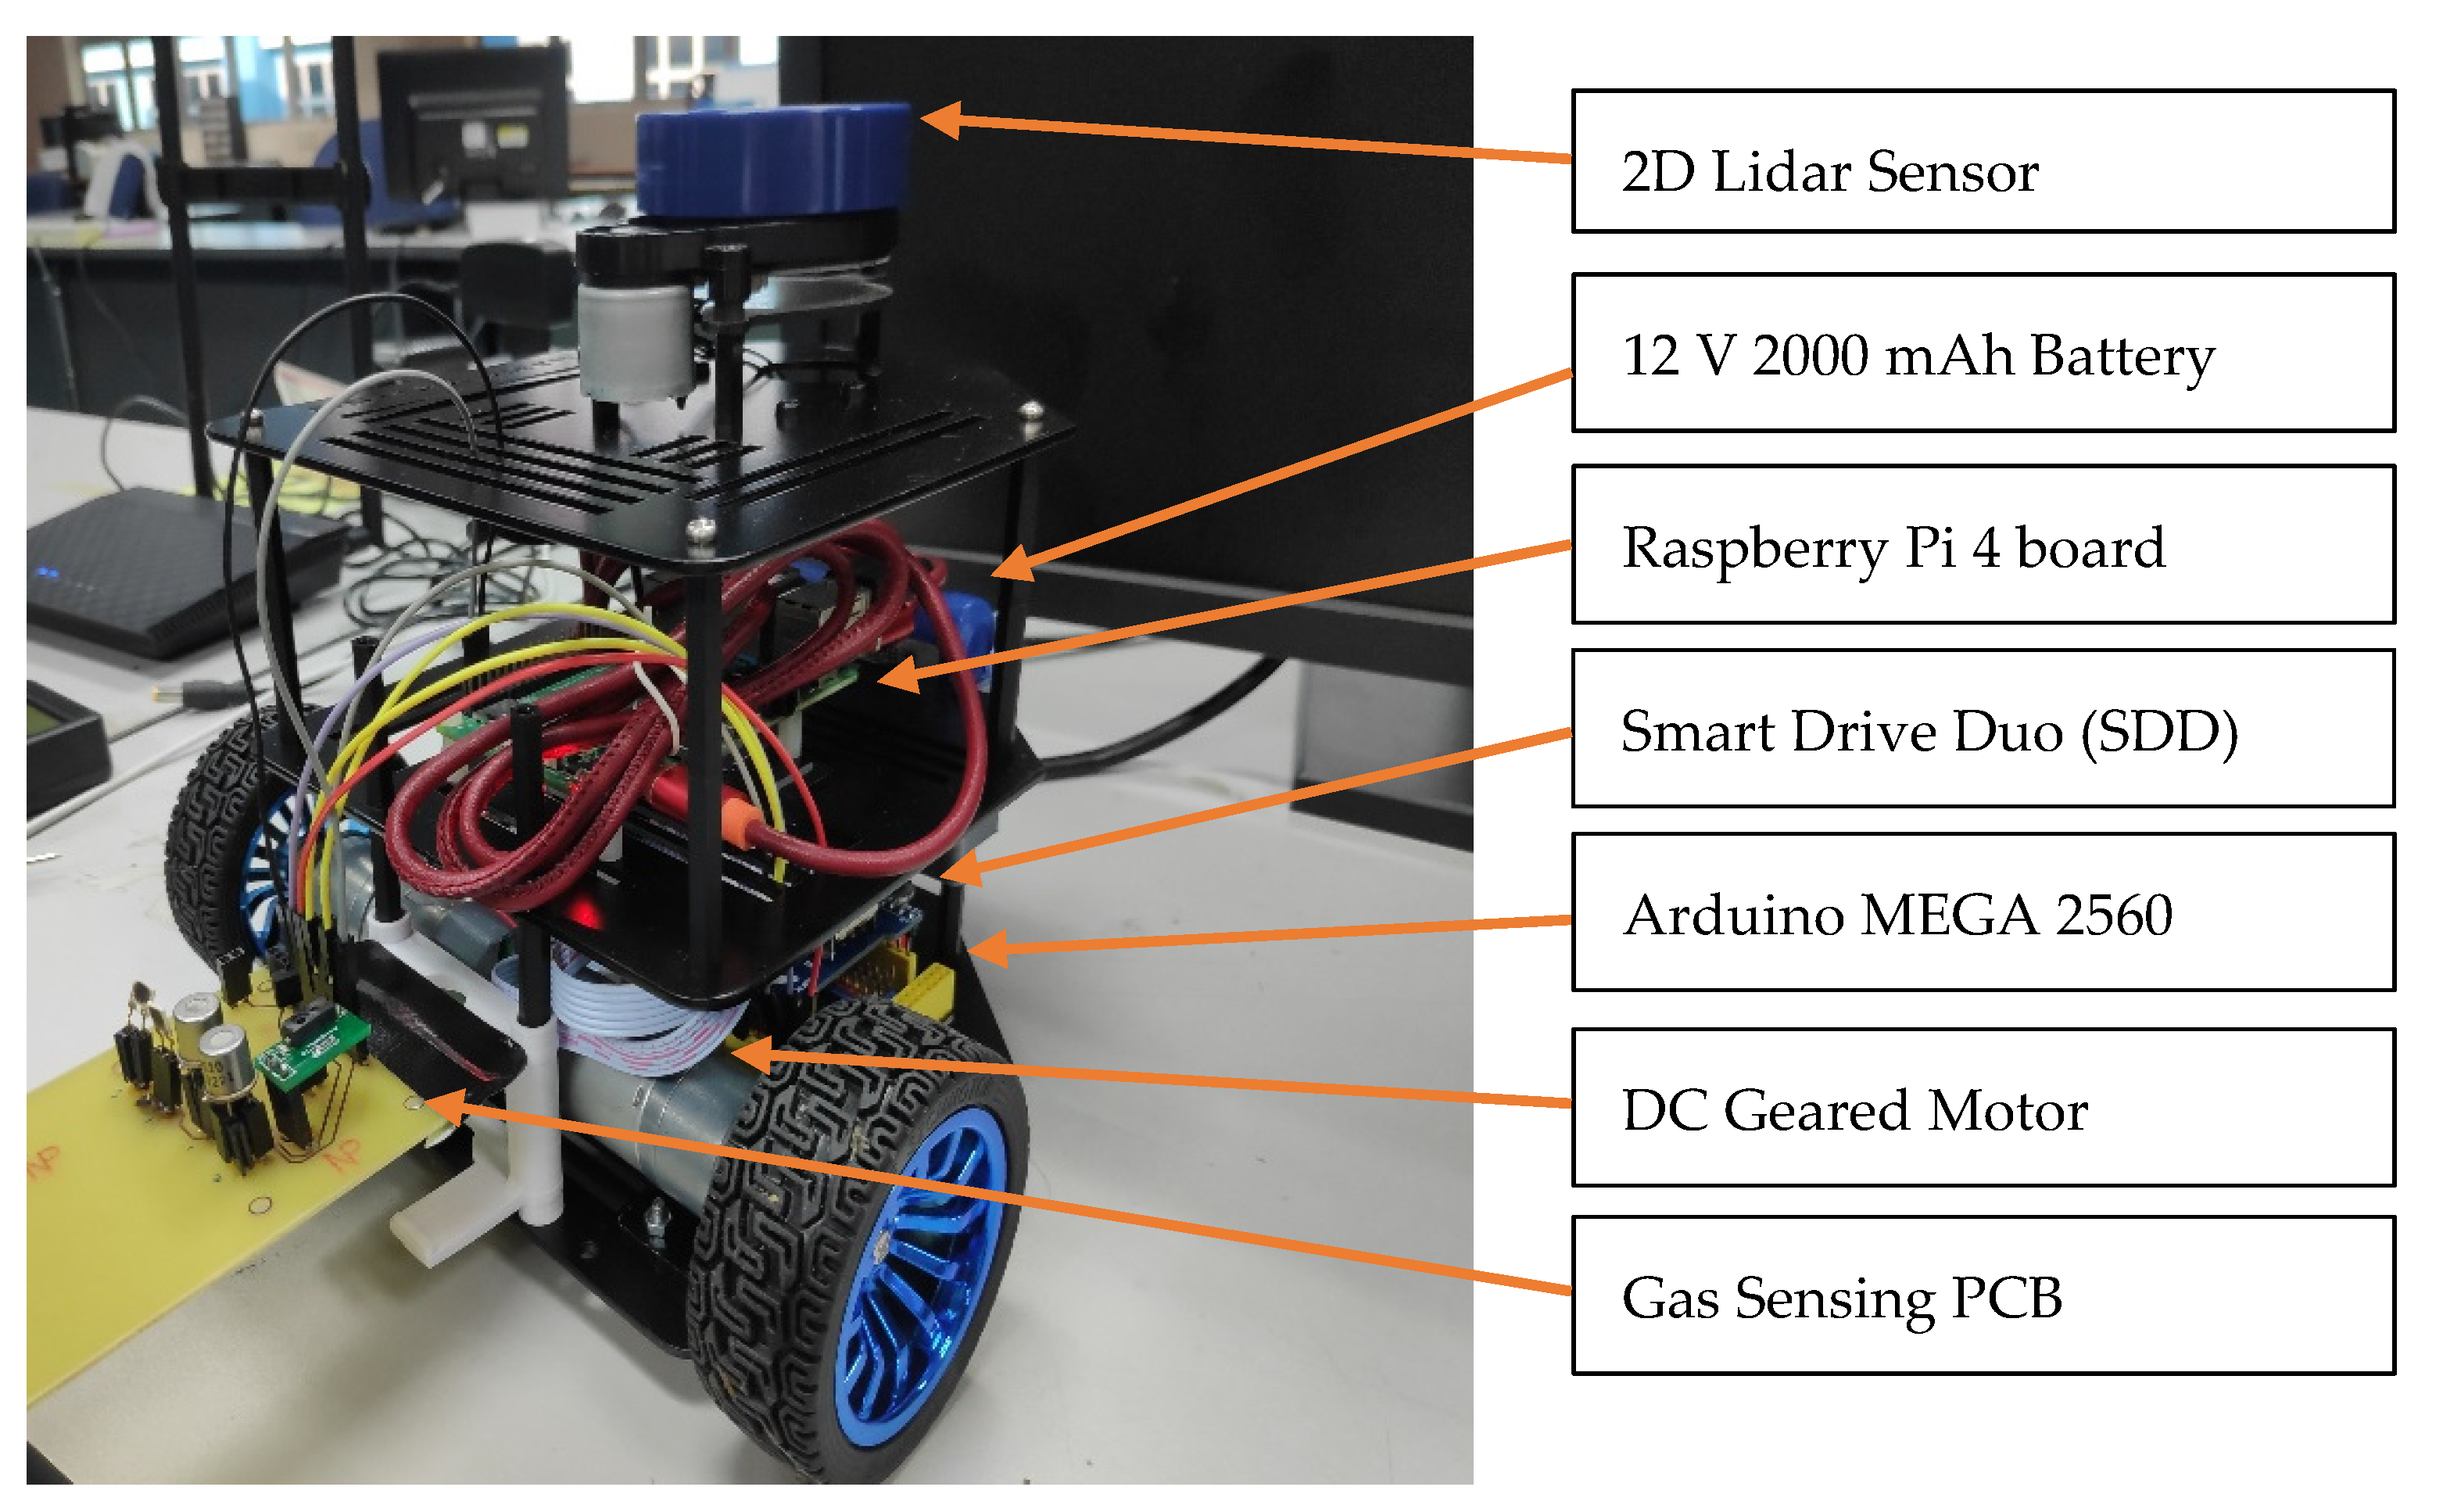
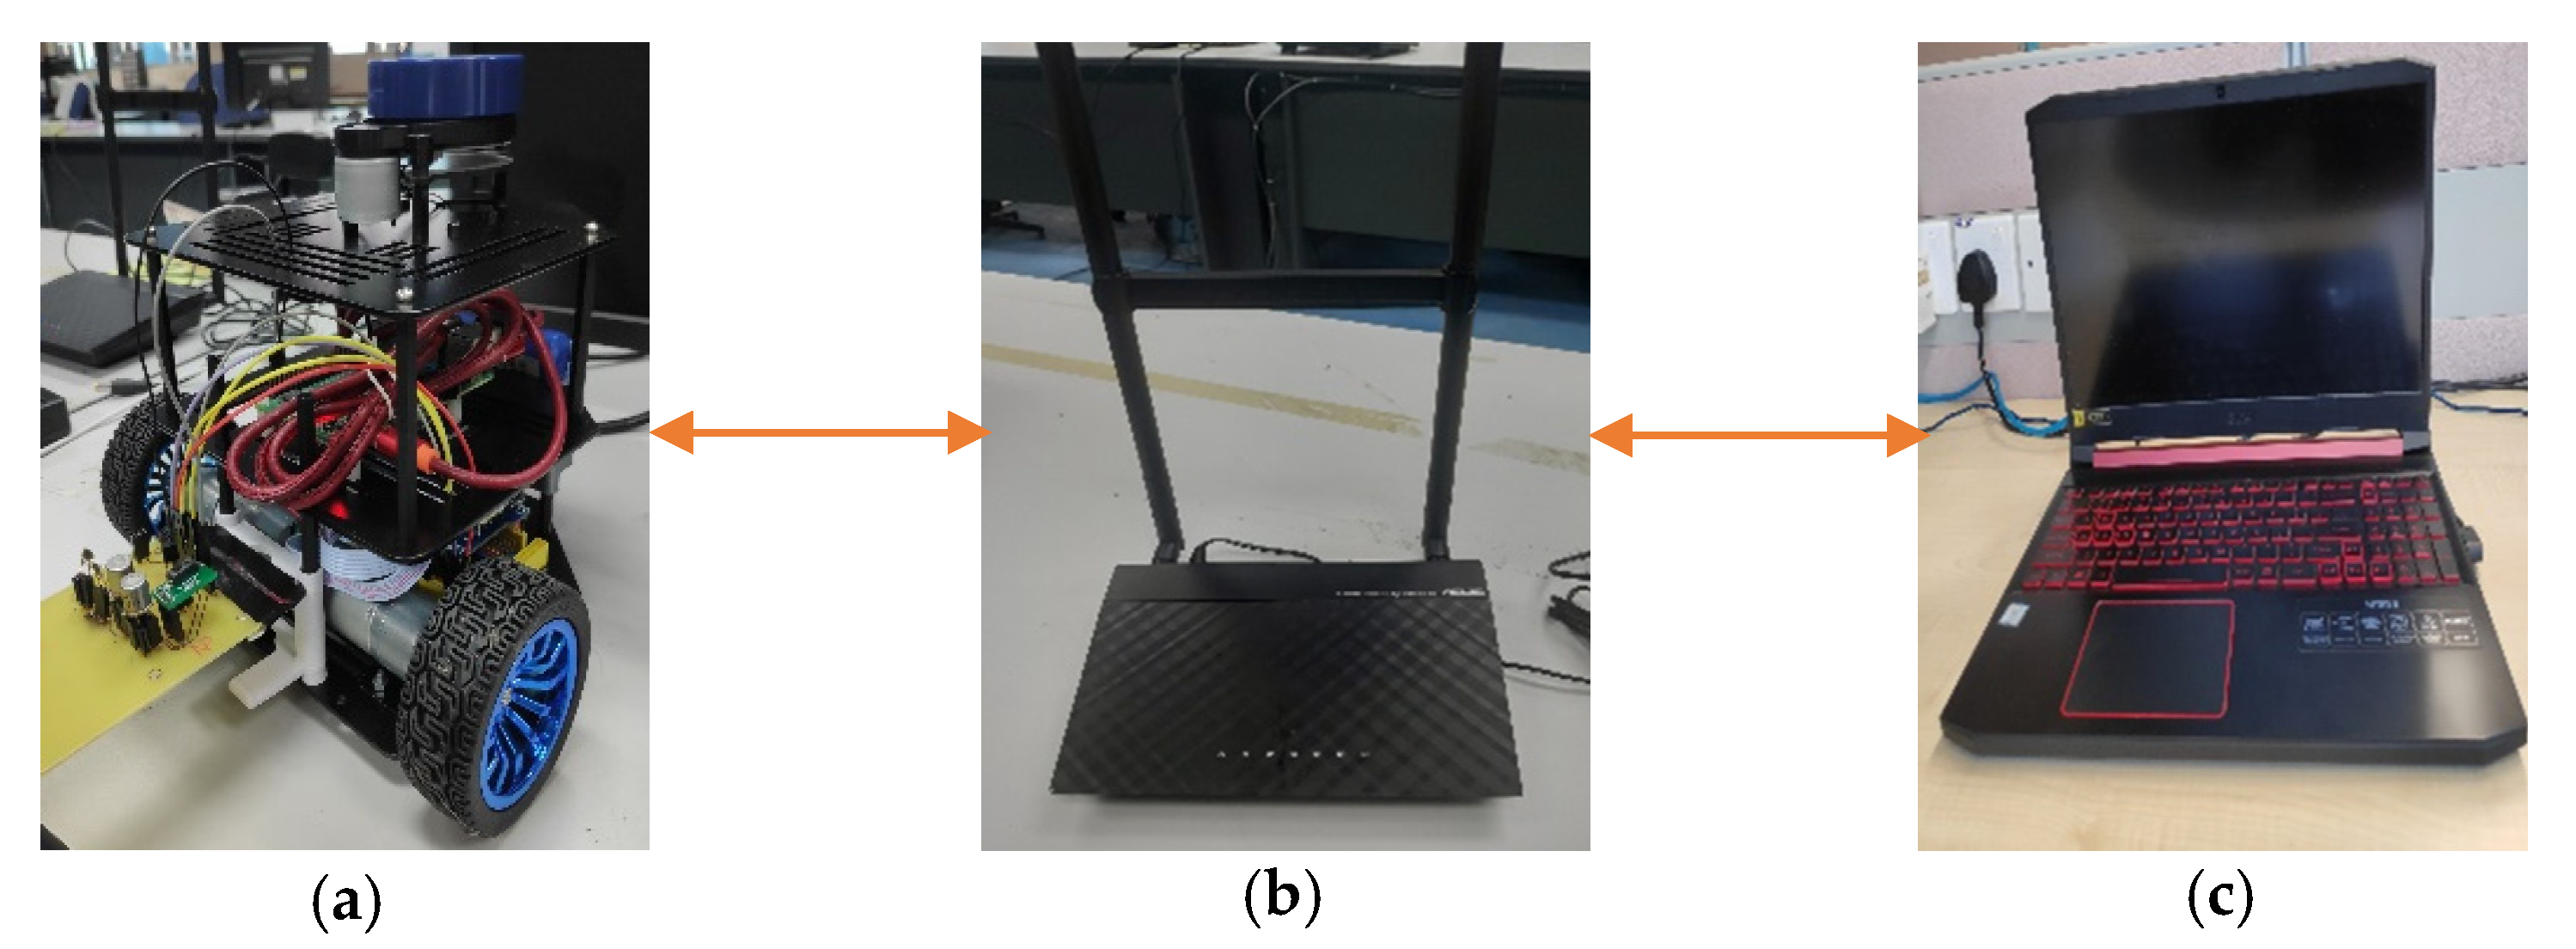
2.1. Mobile Robot Setup

The mobile robot used in this research is Bveeta mini type R. It is a two-wheeled mobile robot driven by educational computer programming language. It is primarily used for educational or research purposes, with few modifications that can be added or re-engineered to create a new platform for the robot. The benefits include its small size, programmable, and lower price due to its small and compact size without sacrificing any of its quality and functionality.

2.1.1. Hardware Architecture

Bveeta mobile robot is equipped with three small platform sizes, each containing different equipment, as shown in Figure 1. The first platform has 2 Direct Current (DC) 12 V 130 rotation per minute (RPM) geared motors with an encoder controlled by Smart Drive Duo (SDD) and the main power board with Arduino Mega 2560 for analog sensor reading and analyzing. The sensor main circuit board is placed on the front of the mobile robot of the first platform that is interfaced with the Arduino. The mobile robot is powered by a 12 V 2000 mAh battery on the back of the robot. The second platform has Single Board Computer (SBC), the Raspberry Pi 4, as the main computer controlling the Bveeta. At the same time, the third platform is equipped with 2D-LIDAR with 360° covering a distance of 0.1 m up to 8 m.
The mobile robot Bveeta is known as the base station, while the laptop or monitoring station is known as the workstation for controlling and monitoring the mobile robot. Both stations are communicated with each other using full-duplex communication through wireless connections of a router, as shown in Figure 2. This allows both-ways communication while simultaneously sending and receiving messages from one another.

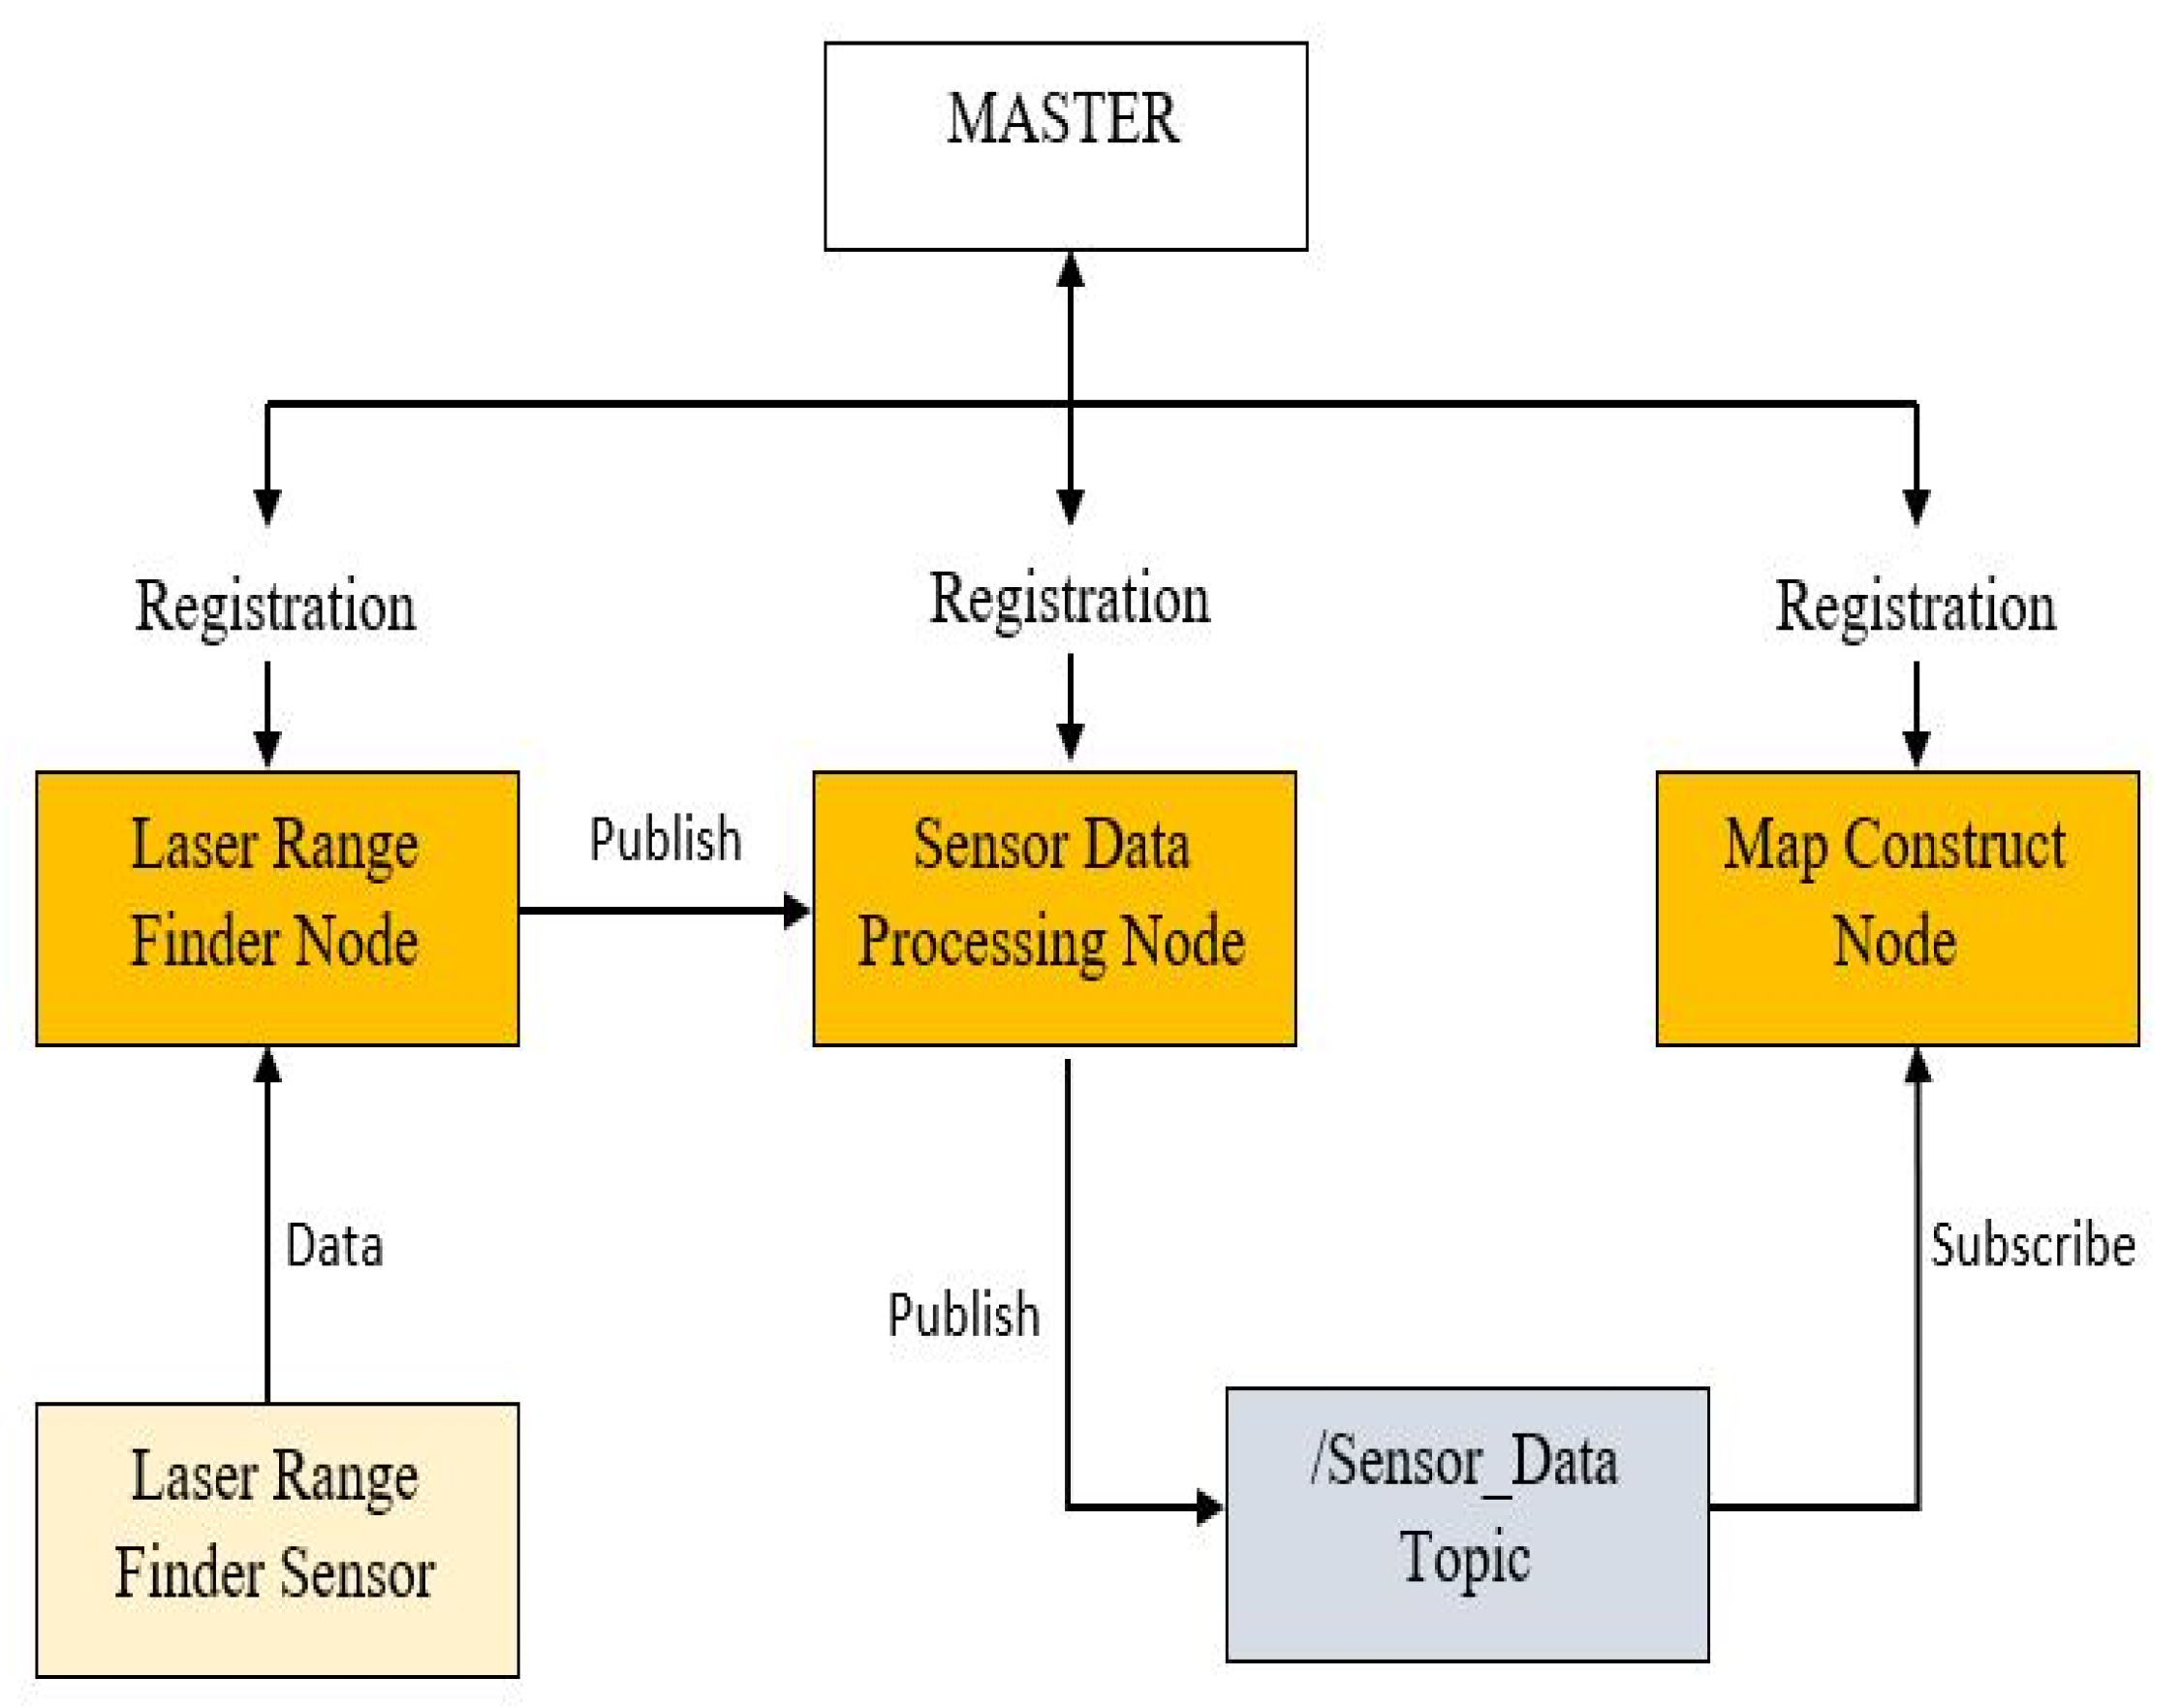
2.1.2. Software Architecture

The Operating System (OS) used for both the raspberry pi on the base station and the workstation is Ubuntu 18.04, together with Robotic Operating System (ROS) platform. ROS is an open-source platform that allows users to communicate and control the robot. The ROS version used in this research is Melodic Morenia, the 12th distribution release of ROS suitable with Ubuntu 18.04. Figure 3 shows an example of the relation between ROS Master, ROS node, and the topics. ROS Master will register and allow each node created for communication to publish or subscribe to its assigned topics [20].

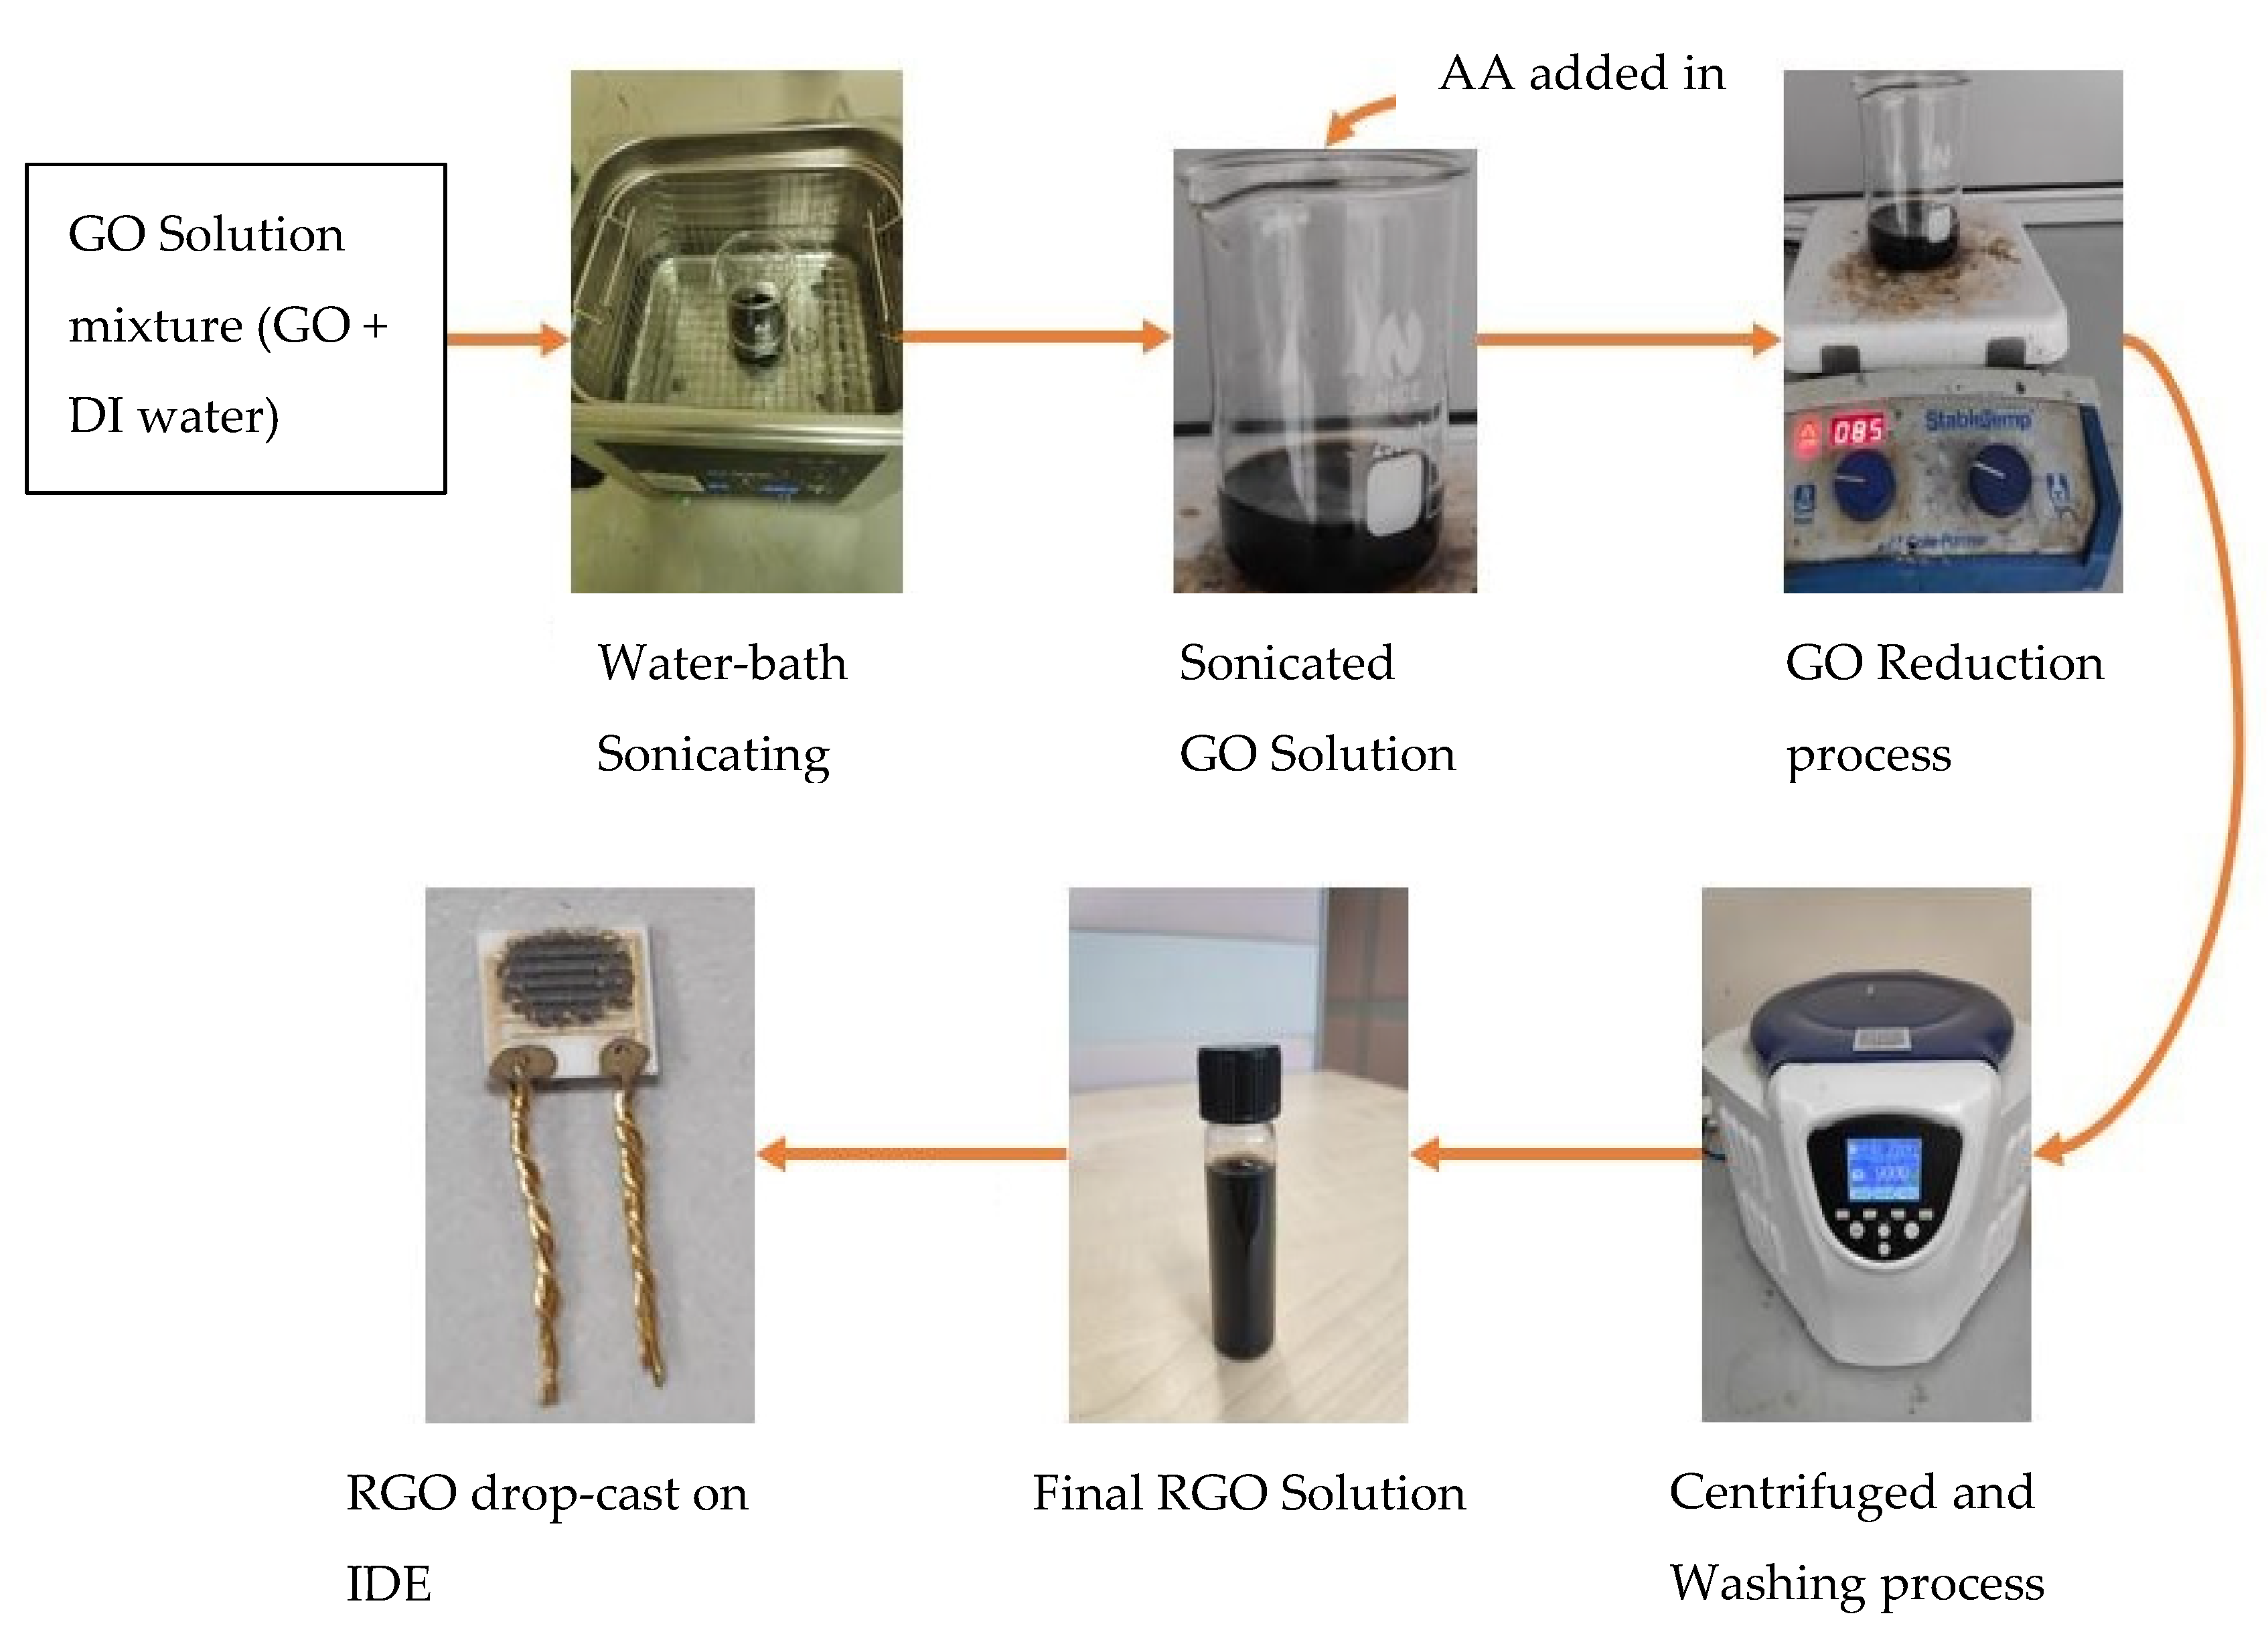
2.2. Preparation of Reduced Graphene Oxide (RGO)

Reduced Graphene Oxide (RGO) is chosen as the graphene-based gas sensor to be used with the mobile olfaction applications and compared with the MOX. RGO is synthesized from Graphene Oxide (GO) of 0.4 mg/mL solution referenced from previous work by [21,22]. The GO solution is prepared with de-ionized (DI) water and sonicated using water-bath sonicate for 30 min. The sonication is to weaken the van-der walls force between the molecules in GO to allow uniform aqueous dispersion. Then, GO is reduced in an aqueous solution, where 100 mg of Ascorbic Acid (AA) is dispersed into the sonicated GO solution. The mixed solution is then stirred vigorously by a magnetic stirrer on the hot plate for one h at 65 °C in a room-temperature environment. The solution is centrifuged for 15 min at 9000 rpm and washed with DI water to remove any residual unreacted GO from the solution. The obtained sample of RGO is then drop-casted onto the Interdigitated Electrode (IDE) as its sensing material based on the reference by the researcher [23], which also used IDE as the sensing platform. Even though, Quartz Crystal Microbalance (QCM) is also viable for depositing RGO sensing material as done by [24]. The QCM sensing principle relies on the measures of frequency changes based on the mass absorbed by the electrode. It requires an additional filter to suppress the effect of dust and particles, especially for moving platforms such as mobile robots [25]. Figure 4 shows the illustration of the RGO preparation process.

2.3. Simultaneous Localization and Mapping (SLAM)

SLAM is one of the mapping methods available for mobile robot mapping using the ROS platform in Ubuntu. The algorithm chosen for this research is Hector SLAM, an open-source 2D SLAM Technique introduced in [26]. Hector SLAM algorithm is based on the Gaussian–Newton Minimization Method, an improvement to the newton method, where the second derivative is not needed to be calculated [27]. This algorithm is used to find the ideal alignment of a laser scan endpoint with the built map by finding the transformation ξ k = ( x k , y k , θ k ) T from Equation (1):
ξ k * = a r g m i n i = 1 n [ 1 M ( S i ( ξ k ) ) ] 2 .
The equation functions M ( S i ( ξ k ) ) , where M is the map value and ( S i ( ξ k ) ) is the world coordinates of the laser scan endpoint, and can be described as in Equation (2),
S i ( ξ k ) = ( c o s ( θ k ) s i n ( θ k ) s i n ( θ k ) c o s ( θ k ) ) ( s i , x s i , y ) + ( x k y k ) .
Then the next pose, step transformation Δ ξ change, can be estimated using the prior value of ξ k by optimizing laser point errors of Equation (3),
i = 1 n [ 1 M ( S i ( ξ k + Δ ξ k ) ) ] 2 0 .
Using the first-order Taylor expansion in the above Equation for M ( S i ( ξ k + Δ ξ k ) ) will yield Equation (4):
i = 1 n [ 1 M ( S i ( ξ k ) ) M ( S i ( ξ k ) ) S i ( ξ k ) ξ k Δ ξ k ] 2 0 .
Setting the partial derivatives concerning Δ ξ k to zero and estimating the minimized value of the Equation gives Equation (5):
2 i = 1 n [ M ( S i ( ξ k ) ) S i ( ξ k ) ξ k ] T
[ 1 M ( S i ( ξ k ) ) M ( S i ( ξ k ) ) S i ( ξ k ) ξ k Δ ξ k ] = 0
Finally, using the Gauss-Newton equation, solve the minimization of Δ ξ k as in Equation (6):
Δ ξ k = H 1 i = 1 n [ M ( S i ( ξ k ) ) S i ( ξ k ) ξ k ] T [ 1 M ( S i ( ξ k ) ) ]
where H is as in Equation (7):
H = [ M ( S i ( ξ k ) ) S i ( ξ k ) ξ k ] T [ M ( S i ( ξ k ) ) S i ( ξ k ) ξ k ] .
The Hector SLAM does not contain the explicit loop closure system detection, but is still able to provide an accurate close-loop close to real-world environments. In turn, it allows low computational requirements and prevents significant changes from happening to the map building during the runtime [26]. The algorithm also does not rely on odometry data, making it more suitable for mobile robots with low computational processing power and still able to generate high map accuracy [28].

2.4. Gas Distribution Mapping (GDM)

GDM is one of the gas source localization techniques used to locate the gas source in the environment, which introduced many algorithms today for research on mobile olfaction. One such algorithm used in this research is Kernel DM which was introduced by the researcher [29]. It is used to create a 2D gas distribution model based on the reading measured from the gas sensor. This algorithm computes the mean concentration value in the generated map based on the dataset from the gas sensor reading. It will continue updating the map as the mobile robot moves forward.
The gas distribution is represented as a grid map with the value of grid cells, k, and utilizes the univariate Kernel Gaussian function, N from Equation (8), to represent the importance of measurement, r i , obtained from the location, x i on the grid cells of the map. Firstly, two momentarily grid maps are generated by calculating Ω k , the cumulative importance weight, and R k , the cumulative weighted reading from Equations (9) and (10), respectively:
N ( | x i x k | , σ ) = 1 σ 2 π e ( | x i x k | ) 2 / ( 2 σ 2 )
Ω k = i = 1 n N ( | x i x k | , σ )
R k = i = 1 n N ( | x i x k | , σ ) r i
From the formula, x k denotes the center of the grid cell k, and σ is the kernel width determining the spatial gas distribution size in the environment. While | x i x k | shows the distance of location measurement, i with respect to σ and k. When the cumulative weight, Ω k , gives a high value, it means that many measurements are recorded close to the center of the cell, k. Meanwhile, a low value means only a few recorded measurements are close to the center of the grid cell. Next, the confidence map α k from Equation (11) can be computed by normalizing Ω k to the range [0, 1] with the scaling parameter σ Ω ,
α k = 1 e ( Ω k ) 2 / σ Ω 2
The confidence map indicates the confidence level for the gas concentration estimation at each cell, k. This map will be used to calculate the estimated mean concentration r k in Equation (12),
  r k = α k R k Ω k + { 1 α k } r 0
From Equation (12), r 0 represents the estimation of the mean gas concentration of cells with insufficient or few readings of gas concentration from neighboring cells which a low α k value can indicate. In the research, we set the value of r 0 to be the average of all our sensor readings, in other words, the resistance value.

2.5. SLAM-GDM

In this research, we integrate SLAM and GDM to create a merged map that shows the mean gas distribution in the map with obstacles features. The map from SLAM gives us the map with obstacles features, which helps to ensure the calculated mean gas distribution does not exceed the lab’s outer wall. In turn, it will not only be able to realistically portray the gas flow that can be blocked by obstacles but also helps improve the accuracy of the gas source localization. The Kernel DM calculations rely on the localization information provided by Hector SLAM. From each time step, cumulative importance weight, Ω k (Equation (9)) and cumulative weighted reading, R k (Equation (10)), the calculation depends on the gas sensor measurements, r i , and location of the measurement, x i of each time step for the Kernel DM map [30]. When running SLAM-GDM, two independent maps are generated: the SLAM map, m k , and GDM mean concentration map, r k . SLAM-generated map, which is the occupancy grid map, consists of three different pixels colors, namely, black (obstacles), white (free or empty space), and grey (no knowledge or data). Each of them indicates occupied, unoccupied, and unexplored areas, respectively. Each of the generated pixel colors is shown in the map, m k in terms of value as the condition in Equation (13),
m k = { 1               unexplored , 0                   unoccupied , 100                   occupied .
Meanwhile, the Kernel DM-generated gas distribution map indicates the mean concentration of gas by the different intensities of color, as shown in Figure 5. In this case, the color combination of yellow or red, or in the Python programming language YlOrRd, is used to indicate the difference in the concentration level in the map. The darker color, which in this case is dark red, represents a high concentration level, while the lighter color, orange, indicates lower gas concentration in the map.
The map of SLAM and GDM mean concentration is merged such that the unoccupied (free space) pixels in the SLAM map from Equation (13) are replaced by mean gas concentration estimates from Kernel DM. The merged map,   r   ˜ k Equation (14), also required that SLAM and GDM maps be of the same orientation, resolution, and map size to ensure they fit well for the merging.
  r   ˜ k = { r k         if   m k = 0 , m k         otherwise .

3. Results and Discussion

3.1. Experimental Setup

The experiment is conducted in an indoor lab under a controlled wind flow environment with a single gas source, ethanol of 95% solution is placed in a closed container near a corner of the lab. Figure 6 shows the location of the experiment with the initial and final position of the mobile robot with the planned route movement and the location of the gas source.
The experiment is separated into two parts with different duration of 7 min and 12 min of the same gas spread after opening the gas source container. The mobile robot will move along the planned path without stopping at a speed of 0.1 m/s. The mobile robot speed is chosen based on the experience from our previous work [31], and the mobile robot speed can affect the map accuracy from SLAM. The non-stop movement simulates real-life conditions where the user does not know the location of the gas source. Once the first part is done, the mobile robot will restart and run again using the same path after the 12th min of gas spread. Then, the experiment is repeated for five trials to deduce the results’ consistency under the same environmental conditions.

3.2. Experimental Results

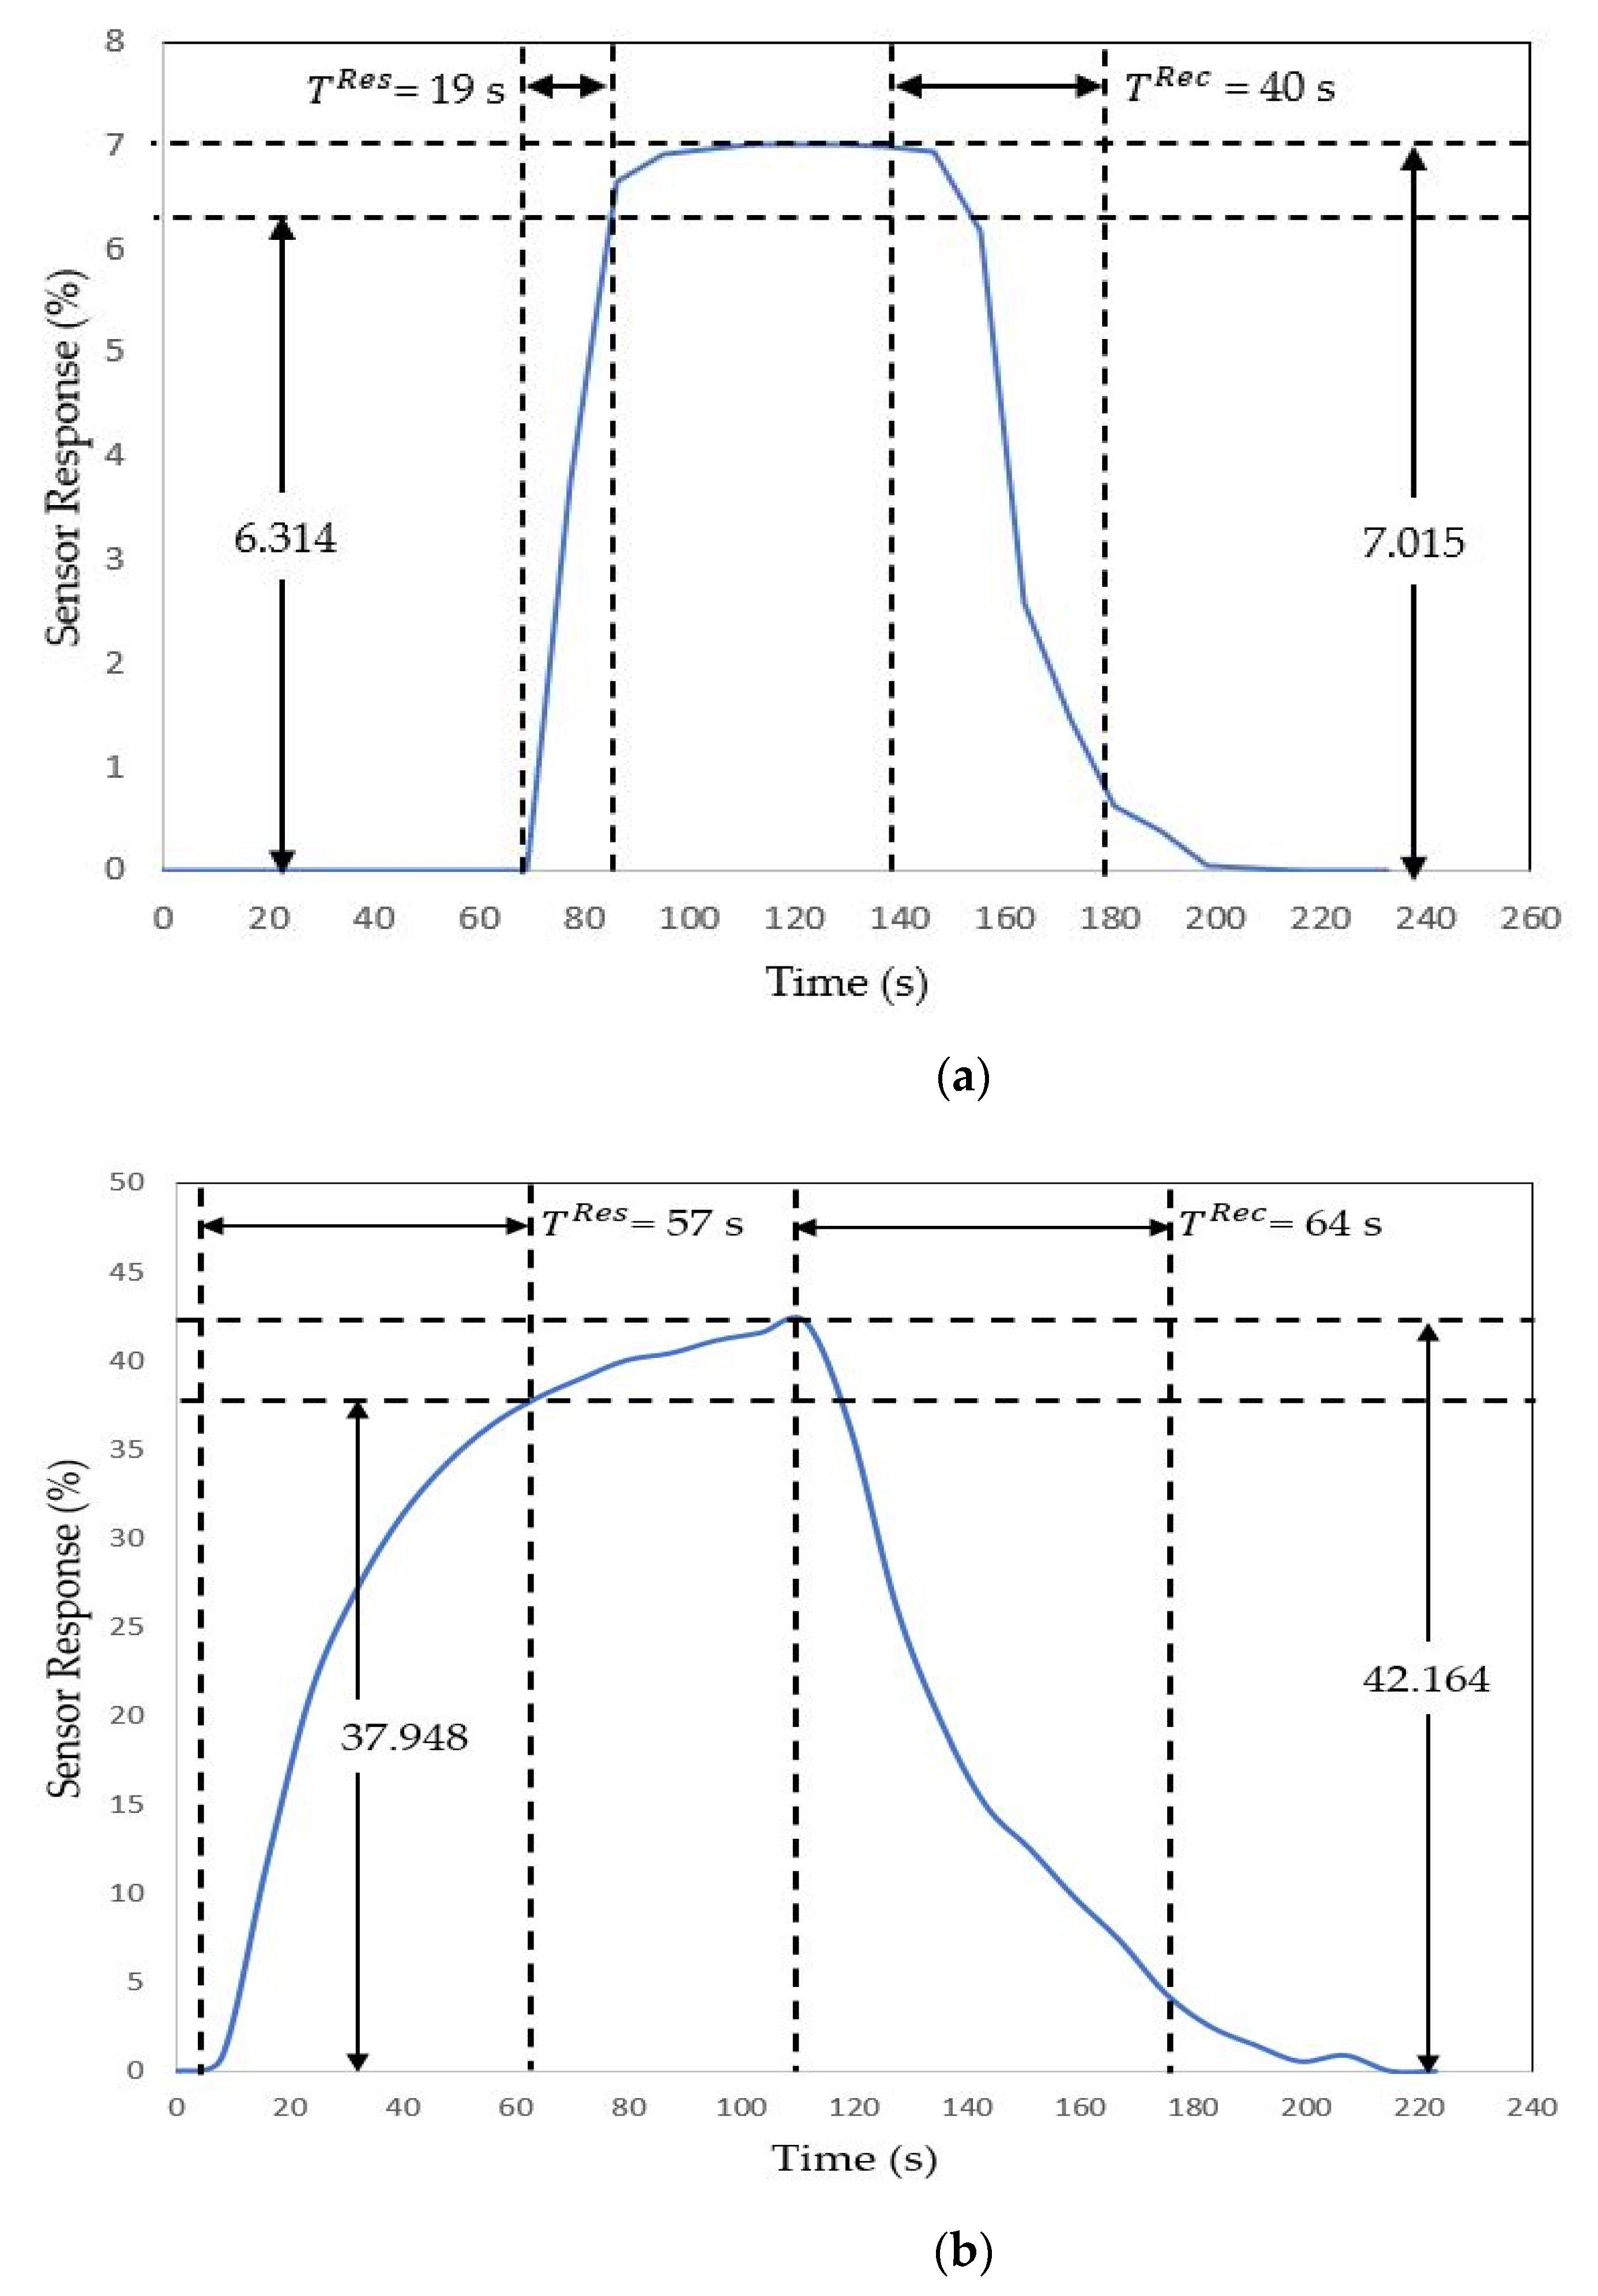
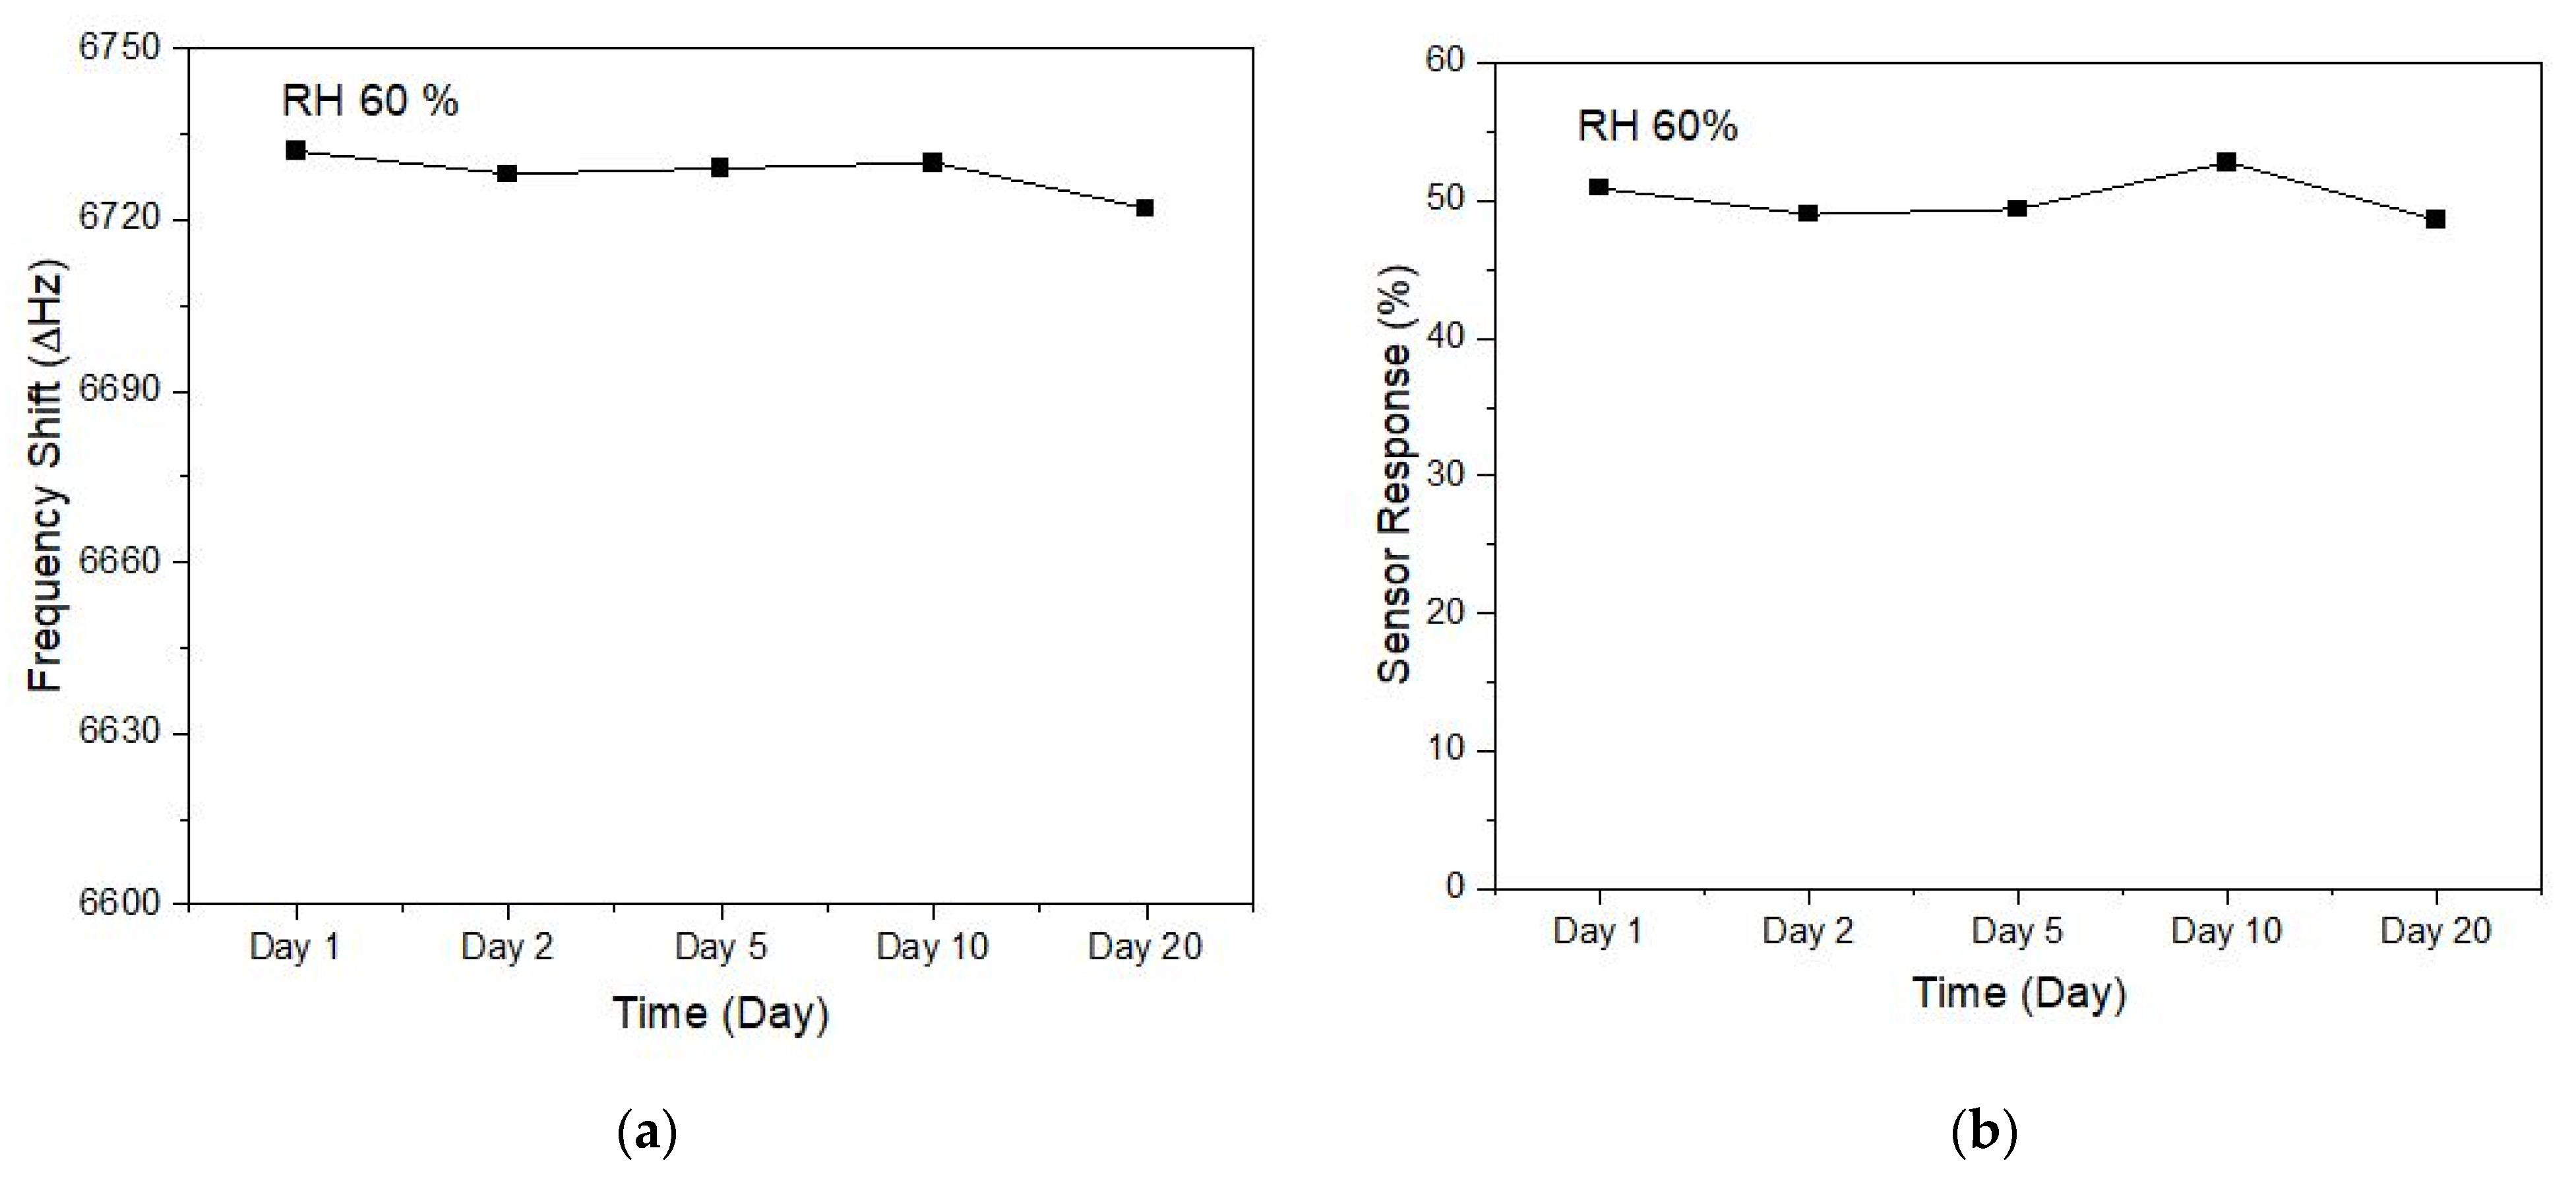
3.2.1. Sensor Lab Testing

Before the sensor is used with the mobile robot, the sensor is first tested in the lab. The RGO and MOX gas sensor is tested against 100 ppm and 300 ppm ethanol, as shown in Figure 7. The sensor response (%) is calculated based on Equation (15). R is the resistance reading of the gas sensor, where Rg is the resistance measured when the sensor is exposed to the target gas, and Ra is the baseline resistance of the sensor exposed to air.
Sensor   Response   ( % ) = R g R a R a × 100 %
Results show that the RGO sensor responds towards 100 ppm and 300 ppm ethanol in 6.6–7.1% and 11.3–11.9%, respectively. It shows that the differences are minimal at 0.5% and 0.6% for 100 and 300 ppm in terms of repeatability performance. Meanwhile, MOX shows a range of 41–45% for 100 ppm and 58–64% for 300 ppm. MOX also shows good repeatability with differences of 4% and 6% for 100 and 300 ppm ethanol, respectively.
The response time is measured from baseline until 90% of the peak reading. Meanwhile, recovery time is calculated from peak to 10% of baseline reading, as shown in Figure 8 for both RGO and MOX. Figure 8a RGO and Figure 8b MOX shows the gas sensor response and recovery time of the first trial to 100 ppm ethanol. The response and recovery time for RGO is 19 s and 40 s, while for MOX is 57 s and 64 s, respectively. The measurement is then taken for the rest of the four trials, as shown in Table 1. The results show that RGO sensors read an average of 23.5 s and 20 s response time, while MOX sensor reads an average of 54 s and 44 s towards 100 and 300 ppm ethanol, respectively. At the same time, the recovery time average for RGO is 44 s and 29.5 s, and MOX with 65.75 s and 75.25 s. Response and recovery time for both sensors shows that RGO gives 56% and 54% faster response time and 33% and 57% better recovery time than MOX towards 100 and 300 ppm ethanol, respectively.
The RGO and MOX sensor’s long-term stability in its response to ethanol is also measured for 20 days, as shown in Figure 9. The stability test for RGO is conducted on a QCM sensing platform, where the same RGO solution was also synthesized on the IDE that was used by the mobile robot. The stability test is conducted for 20 days with references from the previous researcher [12]. The results show that the RGO response consistently changes from day 1 to day 10. However, the sensor shows a slight decrease of 0.12% in response from day 10 to day 20. MOX also offers a similar response as RGO until day 5, where MOX shows a slight increase of 3.4% on day 10 before decreasing back by 4.2% sensor response on day 20 with differences of 0.8% from day 5. This shows that both gas sensors exhibit similar response pattern changes. The result indicates that both sensors still have good stability overall for 20 days and are less affected by chemical change when exposed to the atmosphere.

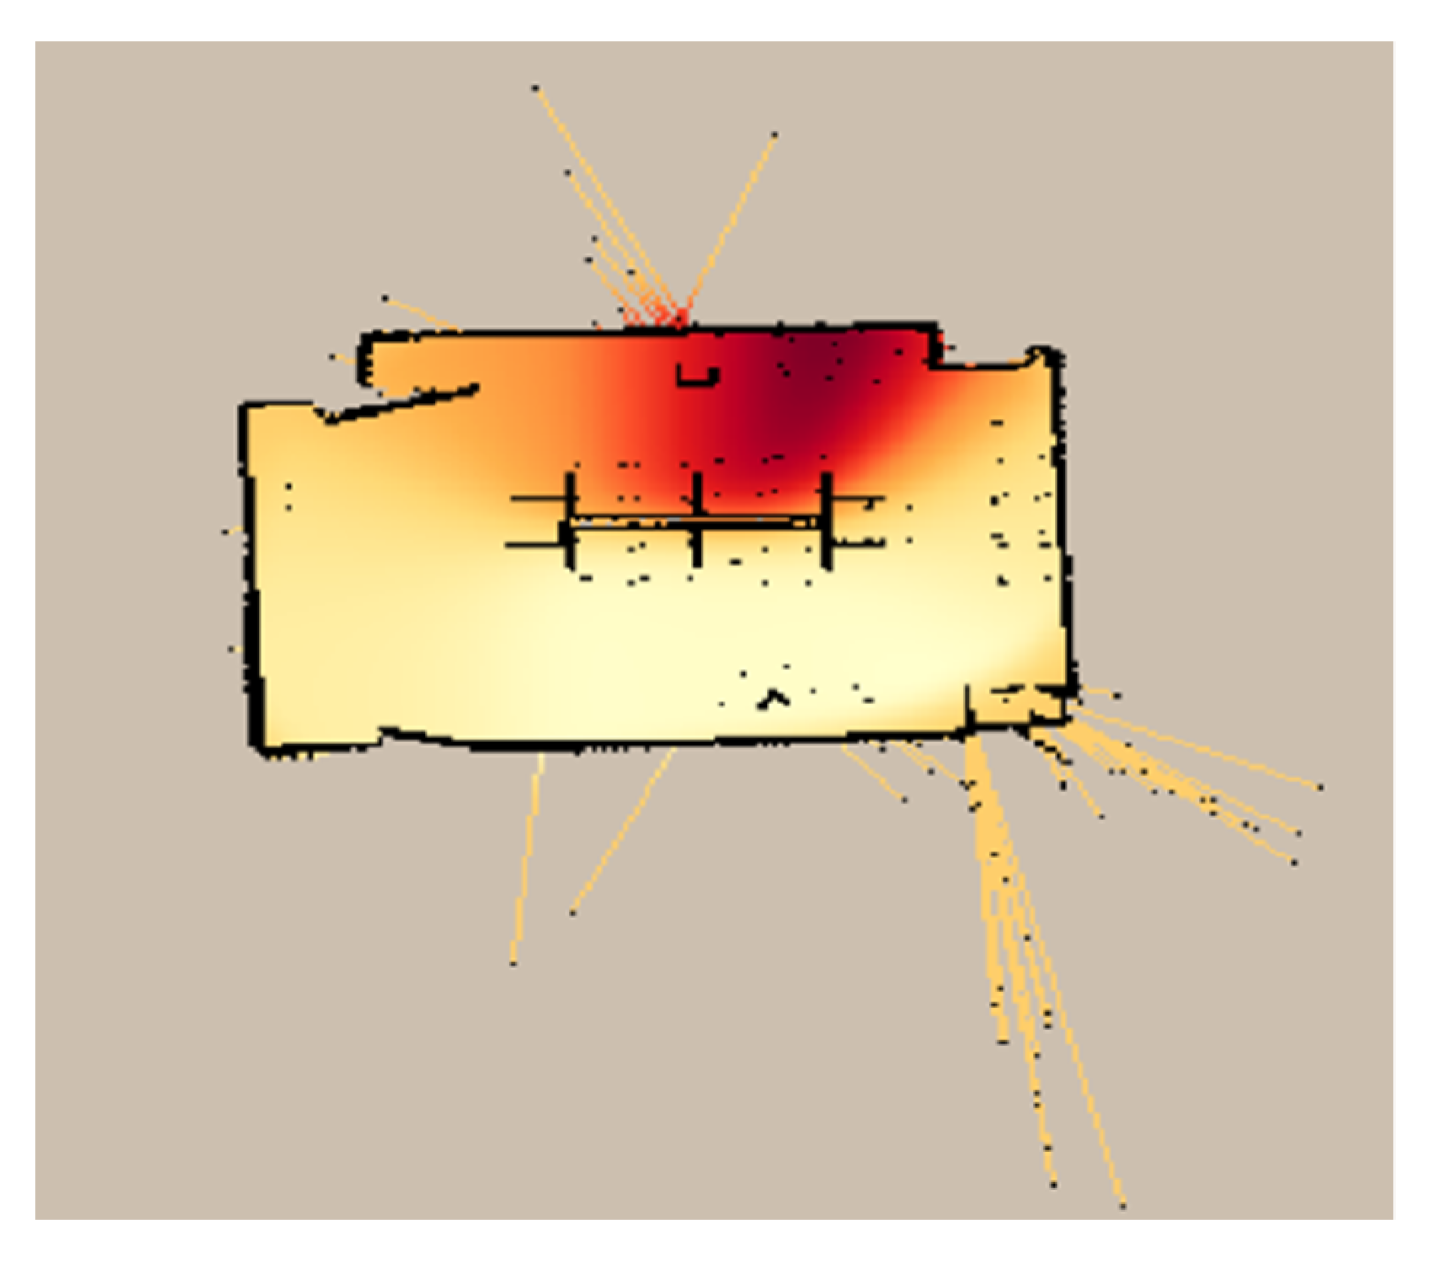
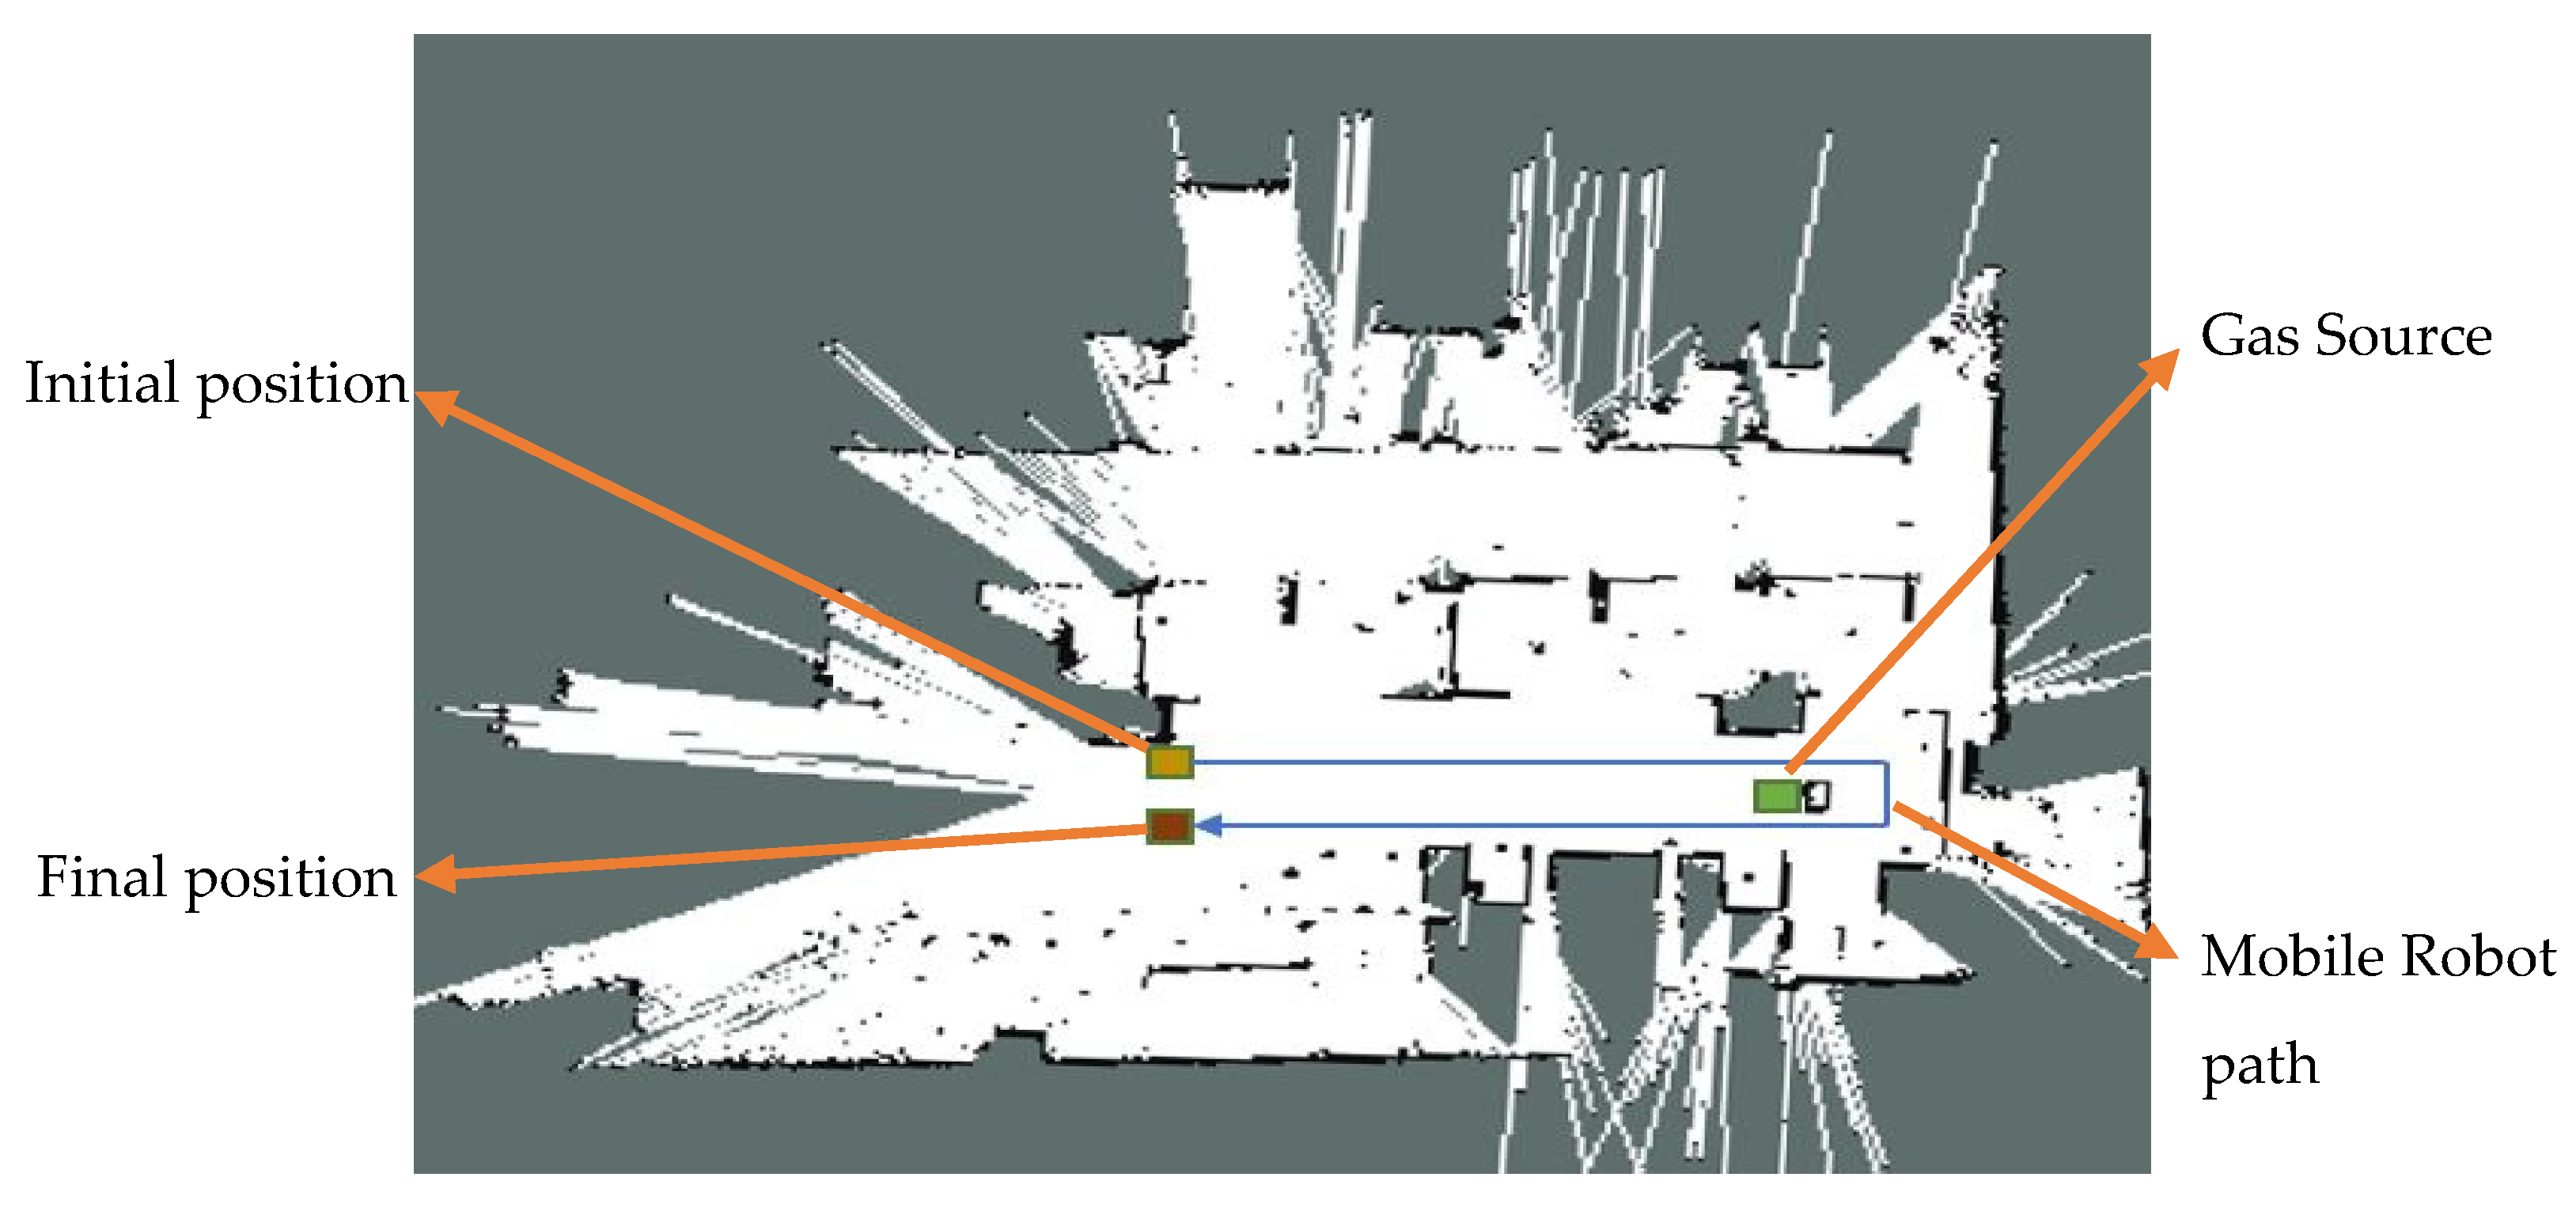
3.2.2. SLAM-GDM Test Results

The experiment is carried out based on the experimental setup in Figure 6. The SLAM-GDM experiment result is obtained as a merged map, as shown in Table 2. The integrated map shows the typical mean gas spread, which is indicated by the color brightness of yellow and red, with dark red indicating the highest mean gas concentration and light yellow the lowest mean gas concentration.
From the results, both MOX and RGO detect gas distribution on the right side of the map or area located nearby the gas source. It shows that a small amount of wind flow still exists in the indoor environment, causing the air to flow toward the right side of the map.
Based on the built gas distributed map, the gas source is predicted using the global maxima to get the highest concentration mean gas reading from the neighboring grid cell. Table 3 shows the error of distance measured from the predicted to the actual gas source for the five repetition trials.
Both MOX and RGO were able to give consistently predicted gas source localization. The measured distance for MOX is closer than RGO to the actual gas source location by differences of 5.72 cm (22.7%) for the 7th min trial and 0.32 cm (1.0%) for the 12th min trial. However, two of the MOX trial also gave very close predicted locations by 5.4 cm and 5.1 cm from trial 2 (7th min) and trial 5 (7th min). Meanwhile, for RGO, only in trial 1 (7th min) was it able to get closest to the actual source by 6.3 cm. These differences show that MOX is better in terms of predicting the precise gas source location. However, MOX also shows vast differences in localization of gas source from 7th min to 12th min by 35.5% increase in distance measured. At the same time, RGO shows a minor difference of a 17.5% increment. The difference in increment is due to the RGO sensor being able to detect earlier the low concentrations of ethanol further from the gas source during the 7th min run. Meanwhile, the MOX sensor did not detect the low concentrations of ethanol in the early run and only started to detect once the concentration increased from a more prolonged duration of gas spread in the 12th min run.
From the built map in Table 2, gas distribution around the gas source can be separated from the merged map by image processing technique. The separated gas distribution image is then changed to grayscale and, finally, a binary picture (0 and 1). The value 0 (black) is the background image, and 1 (white) is the gas distribution area detected by the gas sensor. This is to investigate the size of the gas distribution area detected by both sensors, as shown in Table 4. This shows the differences in the gas spread from the 7th to 12th min and which sensor is more sensitive to the gas ethanol.
Based on the visual alone, RGO shows a larger size of gas concentration of the mean gas sensing area compared to MOX. The total pixel number from the binary figure is calculated to represent which sensor has better sensitivity from the gas sensing area, as shown in Table 5. The RGO sensor offers a range of 0.35–8.33% difference in the concentrated gas sensing area, except for trial 3, 7th min, where the MOX sensor sensing area is larger by 1.8%. The results show that RGO detects more significant gas-sensing regions of the gas distribution from the map. This indicates that RGO is more sensitive toward the gas than MOX in the experiment.
Meanwhile, power consumption for both RGO and MOX is also measured and calculated from the sensor’s voltage output and resistance reading. MOX gas sensor, including the heater circuit, shows an average power consumption of 674.565 mW, while RGO shows an average of 294.605 mW. The differences show that the average power consumption of the RGO sensor is 56.33% lesser than the MOX sensor. MOX shows higher power consumption due to the requirement of a heater circuit, which typically consumes 210 mW to heat the sensor to its operating temperature. Meanwhile, the RGO sensor in this research works at room temperature with no heating element requirement. However, it can still deliver a good response for the gas source localization process.
The results show that the sensing capabilities of RGO are comparable to the traditionally used MOX gas sensor. Both sensors ran simultaneously on the mobile robot in the same environmental conditions in all five trials.
Based on the result discussed, RGO sensors successfully detected gas sources while running with the mobile robot.

4. Conclusions

Graphene-based gas sensor, more specifically RGO, is proposed to be used with the mobile robot and compared its performance with MOX. The sensor is tested in an indoor controlled environment by running simultaneously with the mobile robot to locate the gas source, ethanol of 95% solution. In this research, we indicated the limitations faced by MOX, the long recovery time, high power consumption, and high operating temperature for mobile olfaction.
The RGO and MOX gas sensor is tested in the lab first against 100 and 300 ppm ethanol. The testing is repeated four times, and the sensor can give good repetition with minimal response (%) differences of 0.5% and 0.6% for 100 and 300 ppm. At the same time, MOX gas sensor reading shows 41–45% for 100 ppm and 58–64% for 300 ppm differences of 4% and 6% for 100 and 300 ppm ethanol, respectively. Response and recovery time for both sensors shows that RGO is 56% and 54% faster response time and 33% and 57% lower recovery time than MOX. RGO and MOX gas sensors are also tested for their stability. Both sensors show similar constant pattern changes in response and can maintain stability until day 20.
Five trials were conducted, and both RGO and MOX successfully detected the gas spread and predicted the location of the gas source. Results show that even though MOX gives a lower measured distance of predicted gas source location to the actual, RGO can detect more gas spread of ethanol in the environment, indicating it is more sensitive than MOX. Meanwhile, at the same time, the power consumption of RGO is 294.605 mW which is 56.33% lower than MOX which consumes 674.565 mW.

Author Contributions

Conceptualization, W.A.S.N., H.F.H. and K.K.; methodology, W.A.S.N., H.F.H., K.K., N.A.A.H. and M.G.; software, W.A.S.N., Z.H.M.J. and A.N.A.; validation, H.F.H. and K.K.; formal analysis, W.A.S.N. and Z.H.M.J.; investigation, W.A.S.N., Z.H.M.J. and A.N.A.; resources, H.F.H. and K.K.; data curation, W.A.S.N.; writing—original draft preparation, W.A.S.N.; writing—review and editing, H.F.H. and K.K.; visualization, W.A.S.N.; supervision, H.F.H. and K.K.; project administration, H.F.H.; funding acquisition, H.F.H. All authors have read and agreed to the published version of the manuscript.

Funding

This research is funded by Universiti Teknologi PETRONAS (UTP) under a research grant (YUTP 015LC0-379). The Center for Graduate Studies (CGS), UTP partially funds the publication charge.

Data Availability Statement

The data is included in this article. The data presented in this article are available on request from the corresponding author after obtaining permission from the authorized person.

Acknowledgments

The author would like to thank the Graduate Assistantship scheme from the CGS, UTP, and Universiti Malaysia Perlis (UniMAP) for their research facilities and support.

Conflicts of Interest

The authors declare no conflict of interest.

References

  1. Örnek, Ö.; Karlık, B. An Overview of Metal Oxide Semiconducting Sensors in Electronic Nose Applications. In Proceedings of the 3rd International Symposium on Sustainable Development, Sarajevo, Bosnia and Herzegovina, 31 May–1 June 2012; Volume 2, pp. 506–515. [Google Scholar]
  2. Lee, E.B.; Hwang, I.S.; Cha, J.H.; Lee, H.J.; Lee, W.B.; Pak, J.J.; Lee, J.H.; Ju, B.K. Micromachined catalytic combustible hydrogen gas sensor. Sens. Actuators B Chem. 2011, 153, 392–397. [Google Scholar] [CrossRef]
  3. Neri, G. First fifty years of chemoresistive gas sensors. Chemosensors 2015, 3, 1–20. [Google Scholar] [CrossRef] [Green Version]
  4. Filipenko, M.; Afanasyev, I. Comparison of Various SLAM Systems for Mobile Robot in an Indoor Environment. In Proceedings of the 2018 International Conference on Intelligent Systems (IS), Funchal, Portugal, 25–27 September 2018; pp. 400–407. [Google Scholar]
  5. Alrammouz, R.; Podlecki, J.; Abboud, P.; Sorli, B.; Habchi, R. A review on flexible gas sensors: From materials to devices. Sens. Actuators A Phys. 2018, 284, 209–231. [Google Scholar] [CrossRef]
  6. Rossi, M.; Brunelli, D. Analyzing the transient response of MOX gas sensors to improve the lifetime of distributed sensing systems. In Proceedings of the 2013 5th IEEE International Workshop on Advances in Sensors and Interfaces (IWASI), Bari, Italy, 13–14 June 2013; pp. 211–216. [Google Scholar]
  7. Chutia, R.; Bhuyan, M. Study of temperature modulated tin oxide gas sensor and identification of chemicals. In Proceedings of the 2012 2nd National Conference on Computational Intelligence and Signal Processing (CISP), Guwahati, India, 2–3 March 2012; pp. 181–184. [Google Scholar]
  8. Loutfi, A.; Coradeschi, S.; Lilienthal, A.J.; Gonzalez, J. Gas distribution mapping of multiple odour sources using a mobile robot. Robotica 2009, 27, 311–319. [Google Scholar] [CrossRef] [Green Version]
  9. Palacín, J.; Martínez, D.; Clotet, E.; Pallejà, T.; Burgués, J.; Fonollosa, J.; Pardo, A.; Marco, S. Application of an Array of Metal-Oxide Semiconductor Gas Sensors in an Assistant Personal Robot for Early Gas Leak Detection. Sensors 2019, 19, 1957. [Google Scholar] [CrossRef] [PubMed] [Green Version]
  10. Vincent, T.A.; Xing, Y.; Cole, M.; Gardner, J.W. Investigation of the response of high-bandwidth MOX sensors to gas plumes for application on a mobile robot in hazardous environments. Sens. Actuators B Chem. 2018, 279, 351–360. [Google Scholar] [CrossRef] [Green Version]
  11. Lilienthal, A.; Ulmer, H.; Frohlich, H.; Stutzle, A.; Werner, F.; Zell, A. Gas source declaration with a mobile robot. In Proceedings of the IEEE International Conference on Robotics and Automation (ICRA), New Orleans, LA, USA, 26 April–1 May 2004; Volume 2, pp. 1430–1435. [Google Scholar]
  12. Shooshtari, M.; Salehi, A.; Vollebregt, S. Effect of temperature and humidity on the sensing performance of TiO2 nanowire-based ethanol vapor sensors. Nanotechnology 2021, 32, 325501. [Google Scholar] [CrossRef] [PubMed]
  13. Kim, I.D.; Rothschild, A.; Lee, B.H.; Kim, D.Y.; Jo, S.M.; Tuller, H.L. Ultrasensitive chemiresistors based on electrospun TiO2 nanofibers. Nano Lett. 2006, 6, 2009–2013. [Google Scholar] [CrossRef] [PubMed]
  14. Gessner, T.; Gottfried, K.; Hoffmann, R.; Kaufmann, C.; Weiss, U.; Charetdinov, E.; Hauptmann, P.; Lucklum, R.; Zimmermann, B.; Dietel, U.; et al. Metal oxide gas sensor for high temperature application. Microsyst. Technol. 2000, 6, 169–174. [Google Scholar] [CrossRef]
  15. Korotcenkov, G.; Cho, B.K. Metal oxide composites in conductometric gas sensors: Achievements and challenges. Sens. Actuators B Chem. 2017, 244, 182–210. [Google Scholar] [CrossRef]
  16. Anderson, M.J.; Sullivan, J.G.; Horiuchi, T.K.; Fuller, S.B.; Daniel, T.L. A bio-hybrid odor-guided autonomous palm-sized air vehicle. Bioinspiration Biomim. 2020, 16, 026002. [Google Scholar] [CrossRef] [PubMed]
  17. Terutsuki, D.; Uchida, T.; Fukui, C.; Sukekawa, Y.; Okamoto, Y.; Kanzaki, R. Electroantennography-based bio-hybrid odor-detecting drone using silkmoth antennae for odor source localization. J. Vis. Exp. 2021, 174, e62895. [Google Scholar] [CrossRef] [PubMed]
  18. Terutsuki, D.; Uchida, T.; Fukui, C.; Sukekawa, Y.; Okamoto, Y.; Kanzaki, R. Real-time odor concentration and direction recognition for efficient odor source localization using a small bio-hybrid drone. Sens. Actuators B Chem. 2021, 339, 129770. [Google Scholar] [CrossRef]
  19. Yuan, W.; Shi, G. Graphene-Based Gas Sensors. Mater. Chem. A 2013, 1, 10078–10091. [Google Scholar] [CrossRef]
  20. Priyandoko, G.; Ming, T.Y.; Achmad, M.S.H. Mapping of unknown industrial plant using ROS-based navigation mobile robot. In Proceedings of the IOP Conference Series: Material Science and Engineering, Pahang, Malaysia, 1–2 August 2017; IOP Publishing: Philadelphia, PA, USA, 2017; Volume 257, p. 012088. [Google Scholar]
  21. Gupta, M.; Hawari, H.F.; Kumar, P.; Burhanudin, Z.A.; Tansu, N. Functionalized Reduced Graphene Oxide Thin Films for Ultrahigh CO2 Gas Sensing Performance at Room Temperature. Nanomaterials 2021, 11, 623. [Google Scholar] [CrossRef] [PubMed]
  22. Gupta, M.; Hawari, H.F.; Kumar, P.; Burhanudin, Z.A. Copper Oxide/Functionalized Graphene Hybrid Nanostructures for Room Temperature Gas Sensing Applications. Crystals 2022, 12, 264. [Google Scholar] [CrossRef]
  23. Lee, Z.Y.; Hawari, H.F.; Djaswadi, G.W.B.; Kamarudin, K. A Highly Sensitive Room Temperature CO2 Gas Sensor Based on SnO2-rGO Hybrid Composite. Materials 2021, 14, 522. [Google Scholar] [CrossRef] [PubMed]
  24. Hussein, N.A.A.; Hawari, H.F.; Wong, Y.H. Synthesis of Iron Oxide/Polyaniline/Reduced Graphene Oxide Nanocomposite Materials as Active Sensing Material. In Proceedings of the International Conference on Intelligent and Advanced Systems: Enhance the Present for a Sustainable Future (ICIAS), Kuching, Malaysia, 13–15 July 2021; pp. 1–5. [Google Scholar]
  25. Noda, K.; Aizawa, H. Indoor environmental monitoring system using a robot vacuum cleaner. Sens. Mater. 2020, 32, 1133–1140. [Google Scholar] [CrossRef]
  26. Kohlbrecher, S.; Von Stryk, O.; Meyer, J.; Klingauf, U. A flexible and scalable SLAM system with full 3D motion estimation. In Proceedings of the 9th IEEE International Symposium on Safety, Security, and Rescue Robotics (SSRR), Kyoto, Japan, 1–5 November 2011; pp. 155–160. [Google Scholar]
  27. Eliwa, M.; Adham, A.; Sami, I.; Eldeeb, M. A critical comparison between Fast and Hector SLAM algorithms. REST J. Emerg. Trends Model. Manuf. 2017, 3, 44–49. [Google Scholar]
  28. Xuexi, Z.; Guokun, L.; Genping, F.; Dongliang, X.; Shiliu, L. SLAM algorithm analysis of mobile robot based on lidar. In Proceedings of the Chinese Control Conference (CCC), Guangzhou, China, 27–30 July 2019; pp. 4739–4745. [Google Scholar]
  29. Lilienthal, A.; Duckett, T. Gas Source Localisation by Constructing Concentration Gridmaps with a Mobile Robot. In Proceedings of the European Conference on Mobile Robots (ECMR), Warsaw, Poland, 4–6 September 2003. [Google Scholar]
  30. Kamarudin, K.; Md Shakaff, A.Y.; Bennetts, V.H.; Mamduh, S.M.; Zakaria, A.; Visvanathan, R.; Ali Yeon, A.S.; Kamarudin, L.M. Integrating SLAM and gas distribution mapping (SLAM-GDM) for real-time gas source localization. Adv. Robot. 2018, 32, 903–917. [Google Scholar] [CrossRef]
  31. Norzam, W.A.S.; Hawari, H.F.; Kamarudin, K. Analysis of Mobile Robot Indoor Mapping using GMapping Based SLAM with Different Parameter. In IOP Conference Series: Materials Science and Engineering, Pulau Pinang, Malaysia, 26–27 August 2019; IOP Publishing: Philadelphia, PA, USA, 2019. [Google Scholar]
Figure 1. Bveeta Mobile Robot with Gas Sensing PCB.
Electronics 12 00171 g001
Figure 2. Full-duplex communication from the (a) base station through wireless communications of (b) Router to (c) workstation.
Electronics 12 00171 g002
Figure 3. ROS Master and ROS Node with published and subscribed topics.
Electronics 12 00171 g003
Figure 4. Illustration of RGO Preparation process from GO.
Electronics 12 00171 g004
Figure 5. GDM 2D mean gas concentration map.
Electronics 12 00171 g005
Figure 6. Experimental setup of indoor Lab location.
Electronics 12 00171 g006
Figure 7. RGO and MOX sensor response (%) towards 100 ppm and 300 ppm ethanol. RGO (a) 100 ppm (b) 300 ppm, MOX (c) 100 ppm (d) 300 ppm.
Electronics 12 00171 g007
Figure 8. Gas sensor response and recovery time measurement (a) RGO (b) MOX.
Electronics 12 00171 g008
Figure 9. Stability testing of gas sensor (a) RGO and (b) MOX.
Electronics 12 00171 g009
Table 1. Response and recovery time of MOX and RGO to 100 ppm and 300 ppm ethanol.
SensorTrial100 ppm300 ppm
Response Time (s)Recovery Time (s)Response Time (s)Recovery Time (s)
RGO119402828
225431729
318501736
432431825
MOX157643785
263615072
351794974
445594070
Table 2. Mean gas concentration SLAM-GDM Map with actual and predicted gas source location.
Duration of Gas Spread (min)Gas SensorLegends
MOXRGO
7Electronics 12 00171 i001Electronics 12 00171 i002Electronics 12 00171 i005
12Electronics 12 00171 i003Electronics 12 00171 i004
Table 3. The measured distance (error) of the predicted from the actual gas source location.
TrialDistance Error (cm)
12345Average
Duration of gas spread (min)712712712712712712
MOX31.930.55.431.828.327.326.930.25.131.619.5230.28
RGO6.333.227.728.535.426.228.033.228.831.925.2430.60
Table 4. Binary image of mean gas distribution.
Duration of Gas Source Spread (min)Gas Sensor
MOXRGO
7Electronics 12 00171 i006Electronics 12 00171 i007
12Electronics 12 00171 i008Electronics 12 00171 i009
Table 5. Summation of pixel binary number 1 (white area).
TrialDuration of Gas Source Spread (min)MOXRGODifferences (%)
1724,32126,5308.33
1225,32625,4770.59
2724,62124,7080.35
1224,62826,4676.95
3725,37724,9191.80
1225,13925,7362.32
4724,71626,1245.39
1224,44225,3233.48
5724,41024,6951.15
1224,62325,0451.68
Disclaimer/Publisher’s Note: The statements, opinions and data contained in all publications are solely those of the individual author(s) and contributor(s) and not of MDPI and/or the editor(s). MDPI and/or the editor(s) disclaim responsibility for any injury to people or property resulting from any ideas, methods, instructions or products referred to in the content.

