
Optimal Power Allocation and Cooperative Relaying under Fuzzy Inference System (FIS) Based Downlink PD-NOMA

 , , , and
Abstract
:1. Introduction
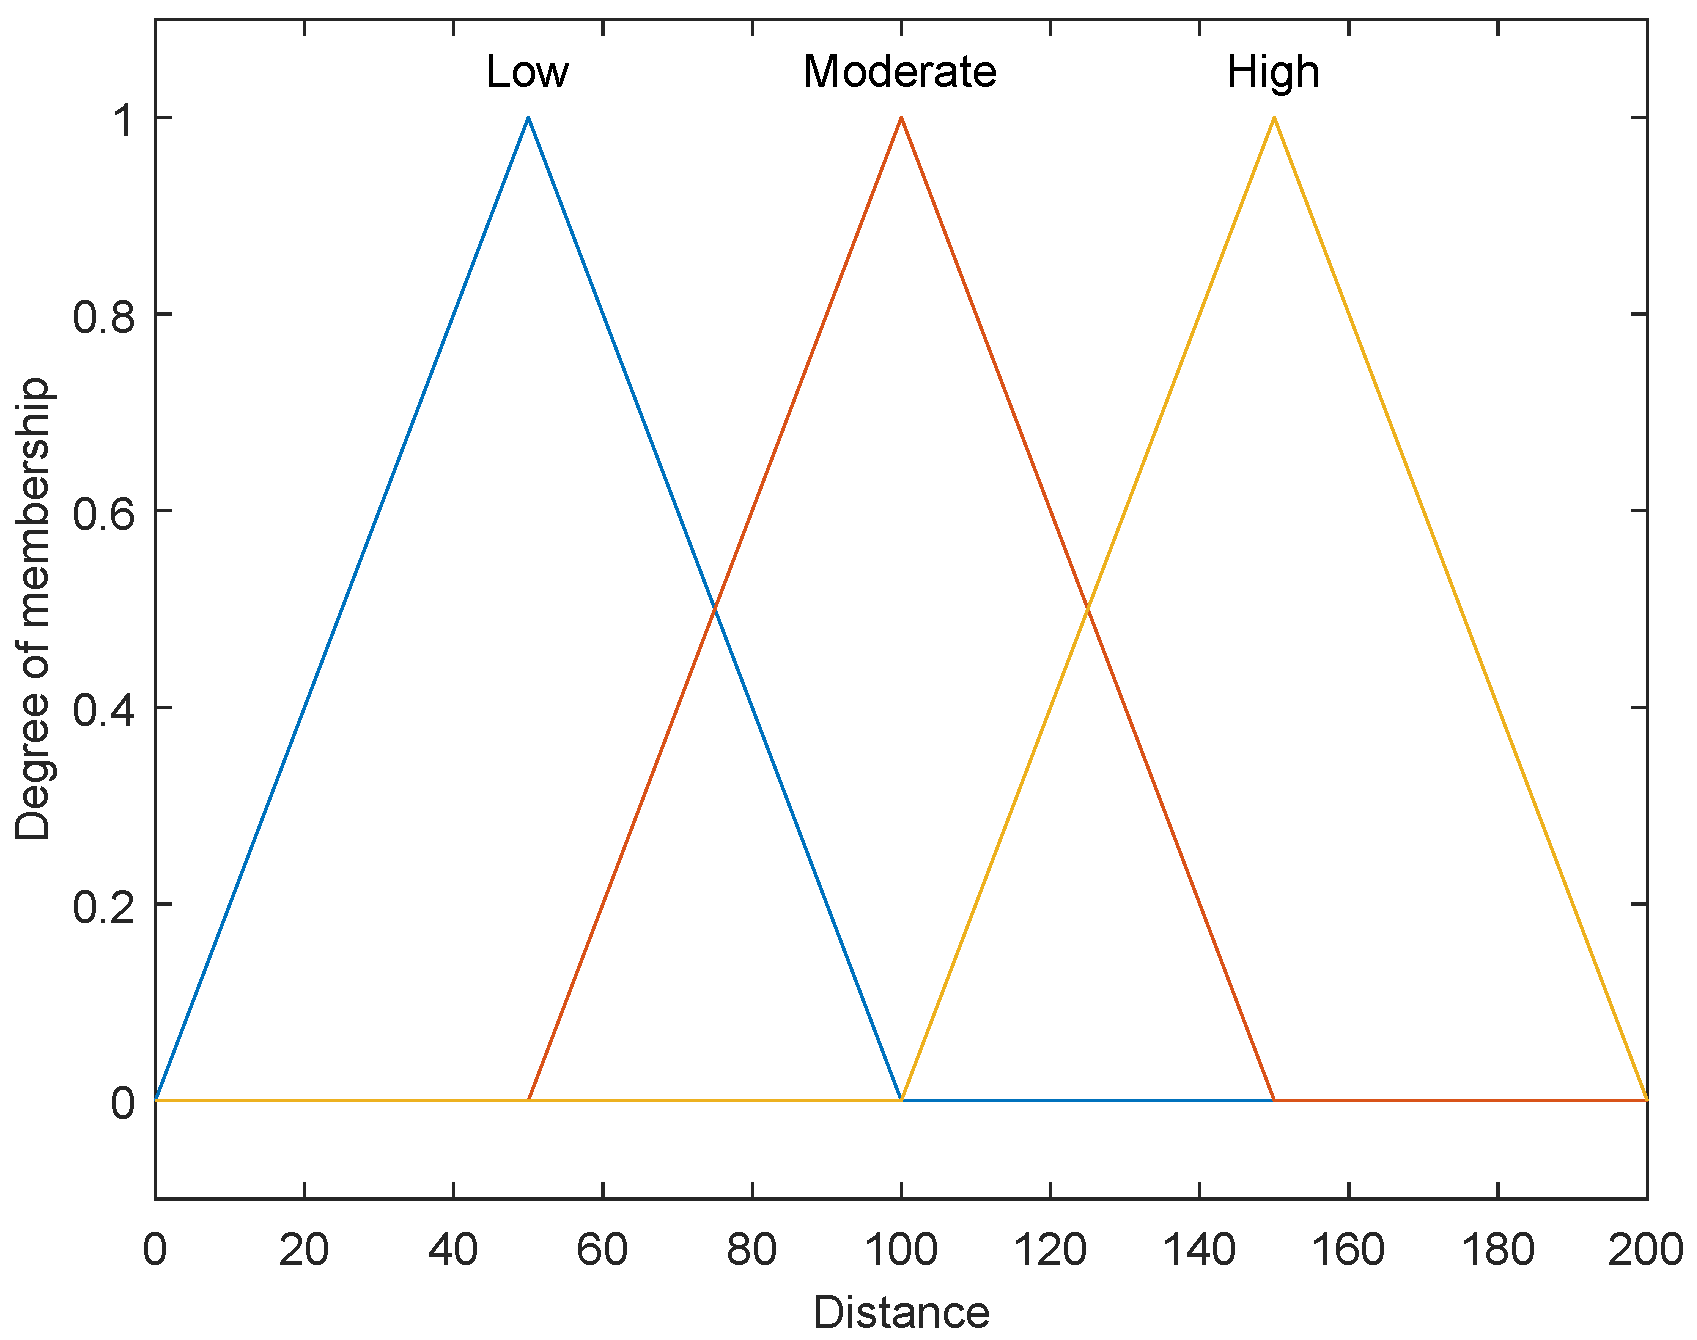
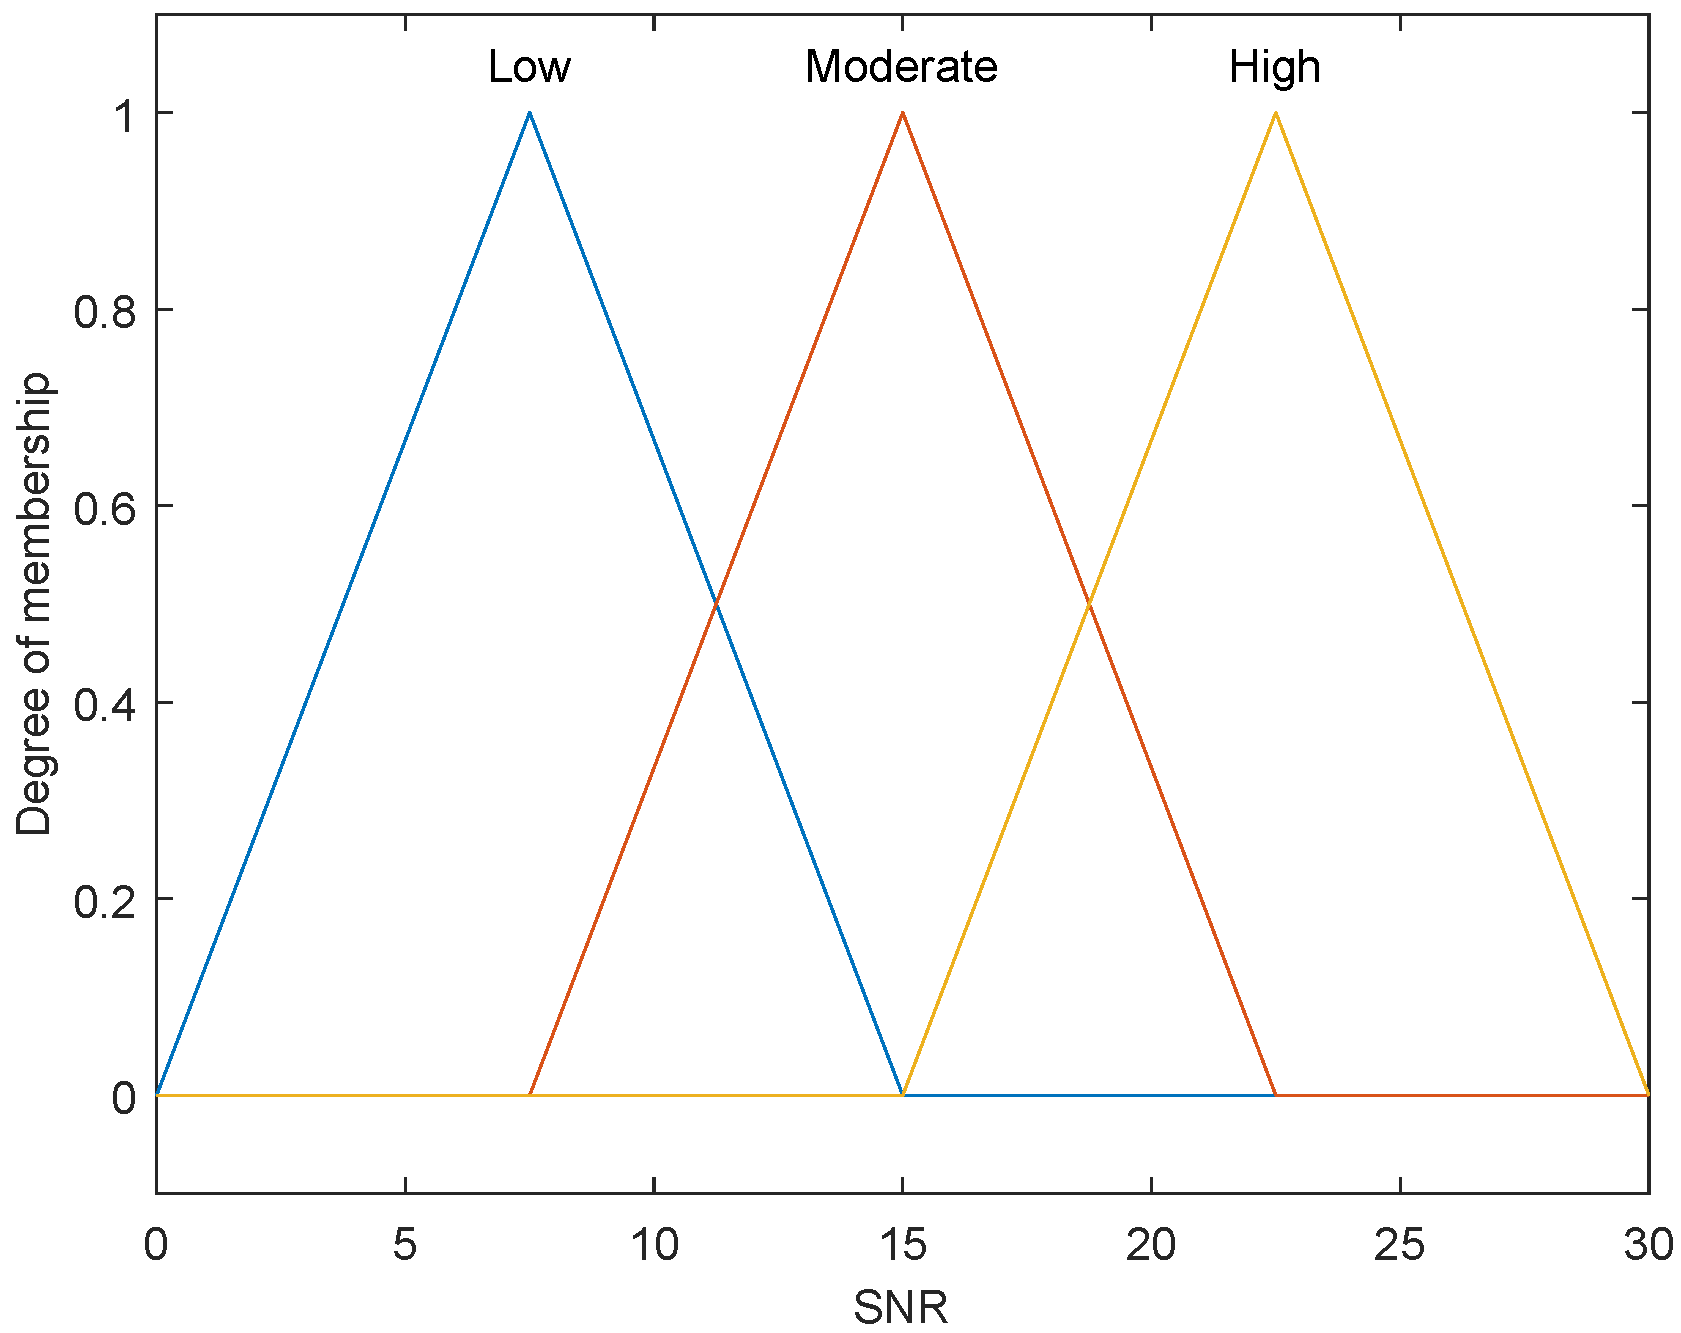
- The power optimization problem is coordinated through multi-input parameters such as distance (d), signal-to-noise ratio (), and foliage depth () for each user in PD-NOMA;
- The optimization problem for equity power allocation is solved through an FIS-based system that guarantees user-fairness in terms of the optimal power distribution among PD-NOMA users;
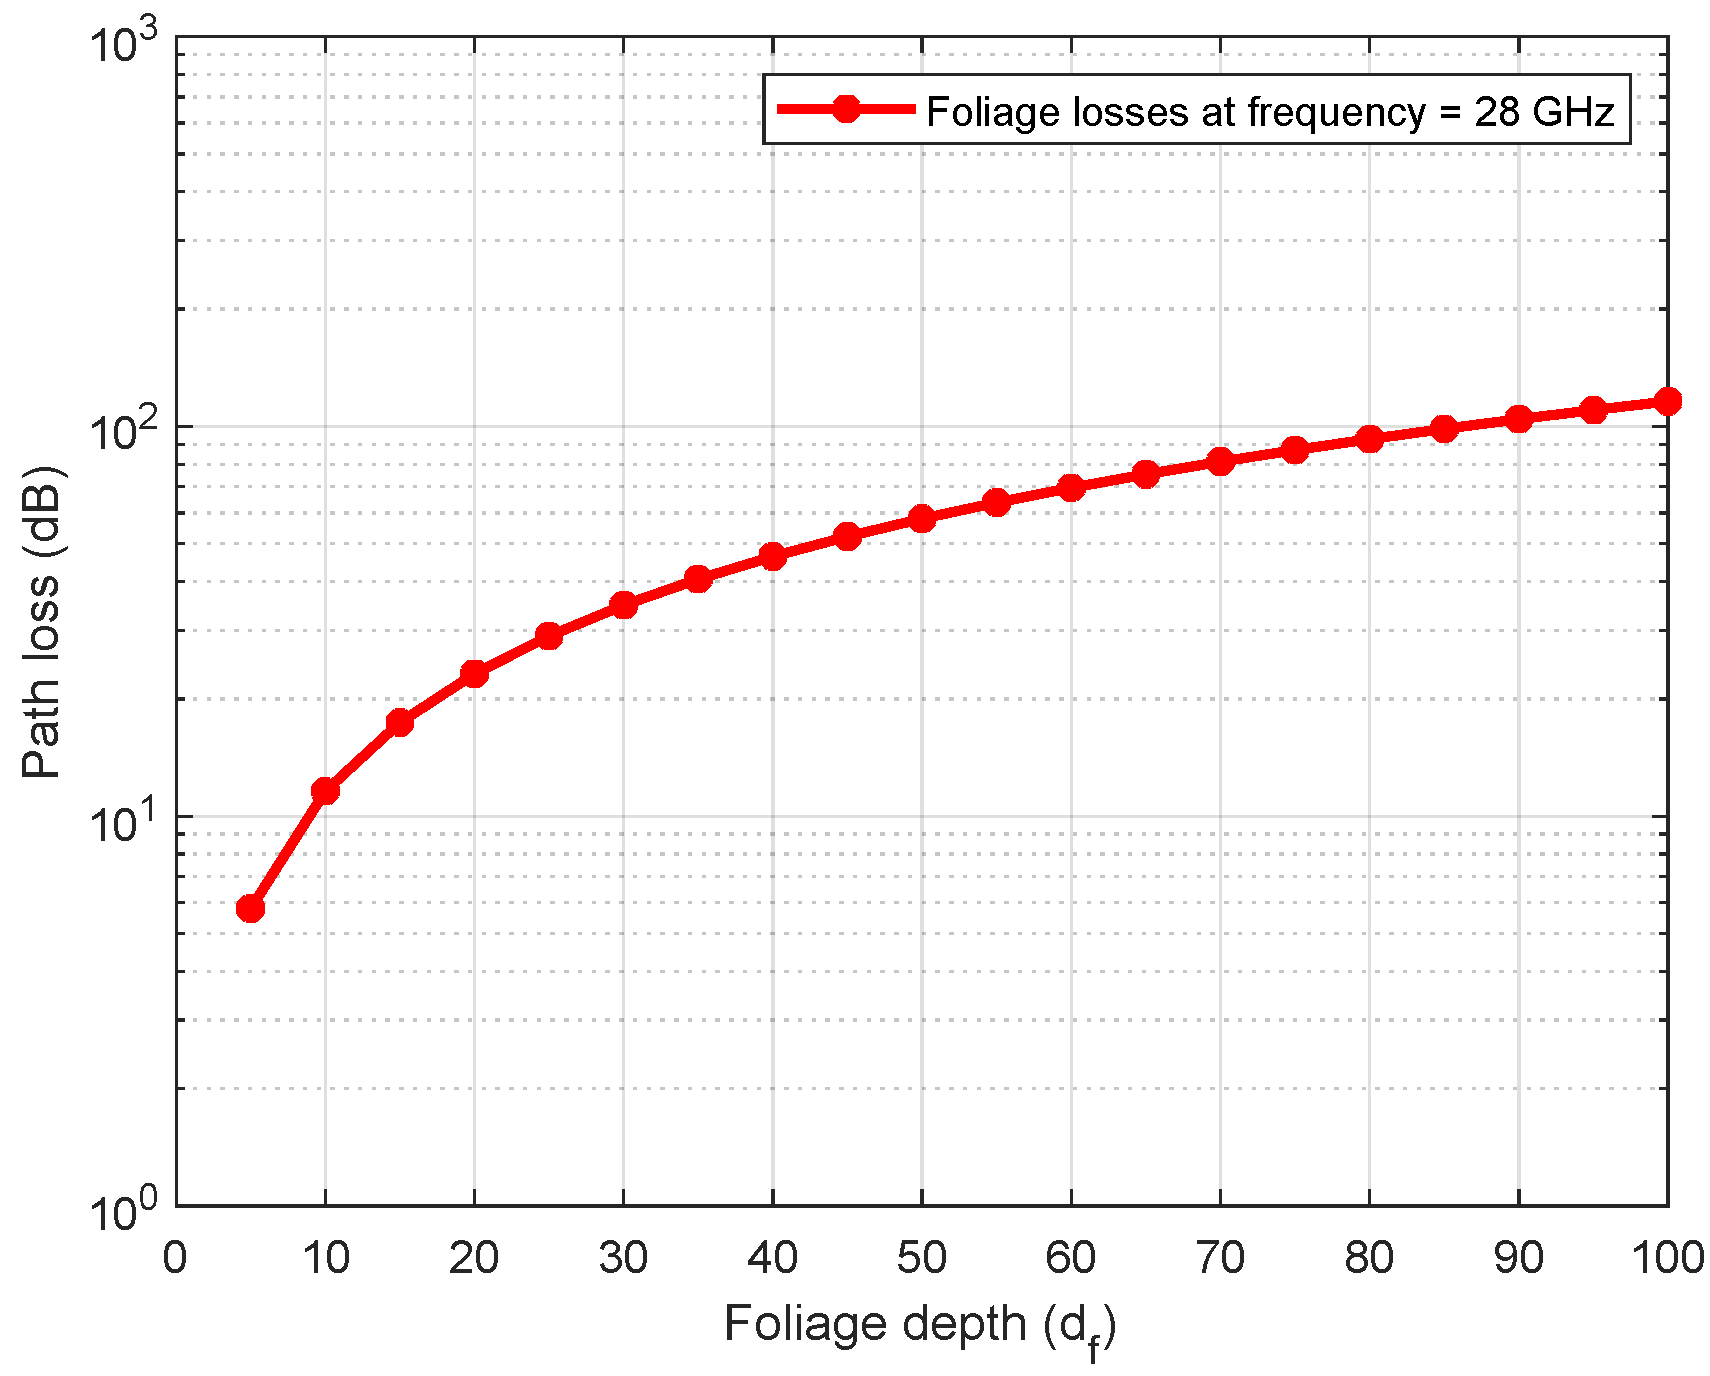
- In realistic 5G micro-cells, the Weissberger model is being used to analyze the impact of foliage on channel conditions between the gNodeB and users;
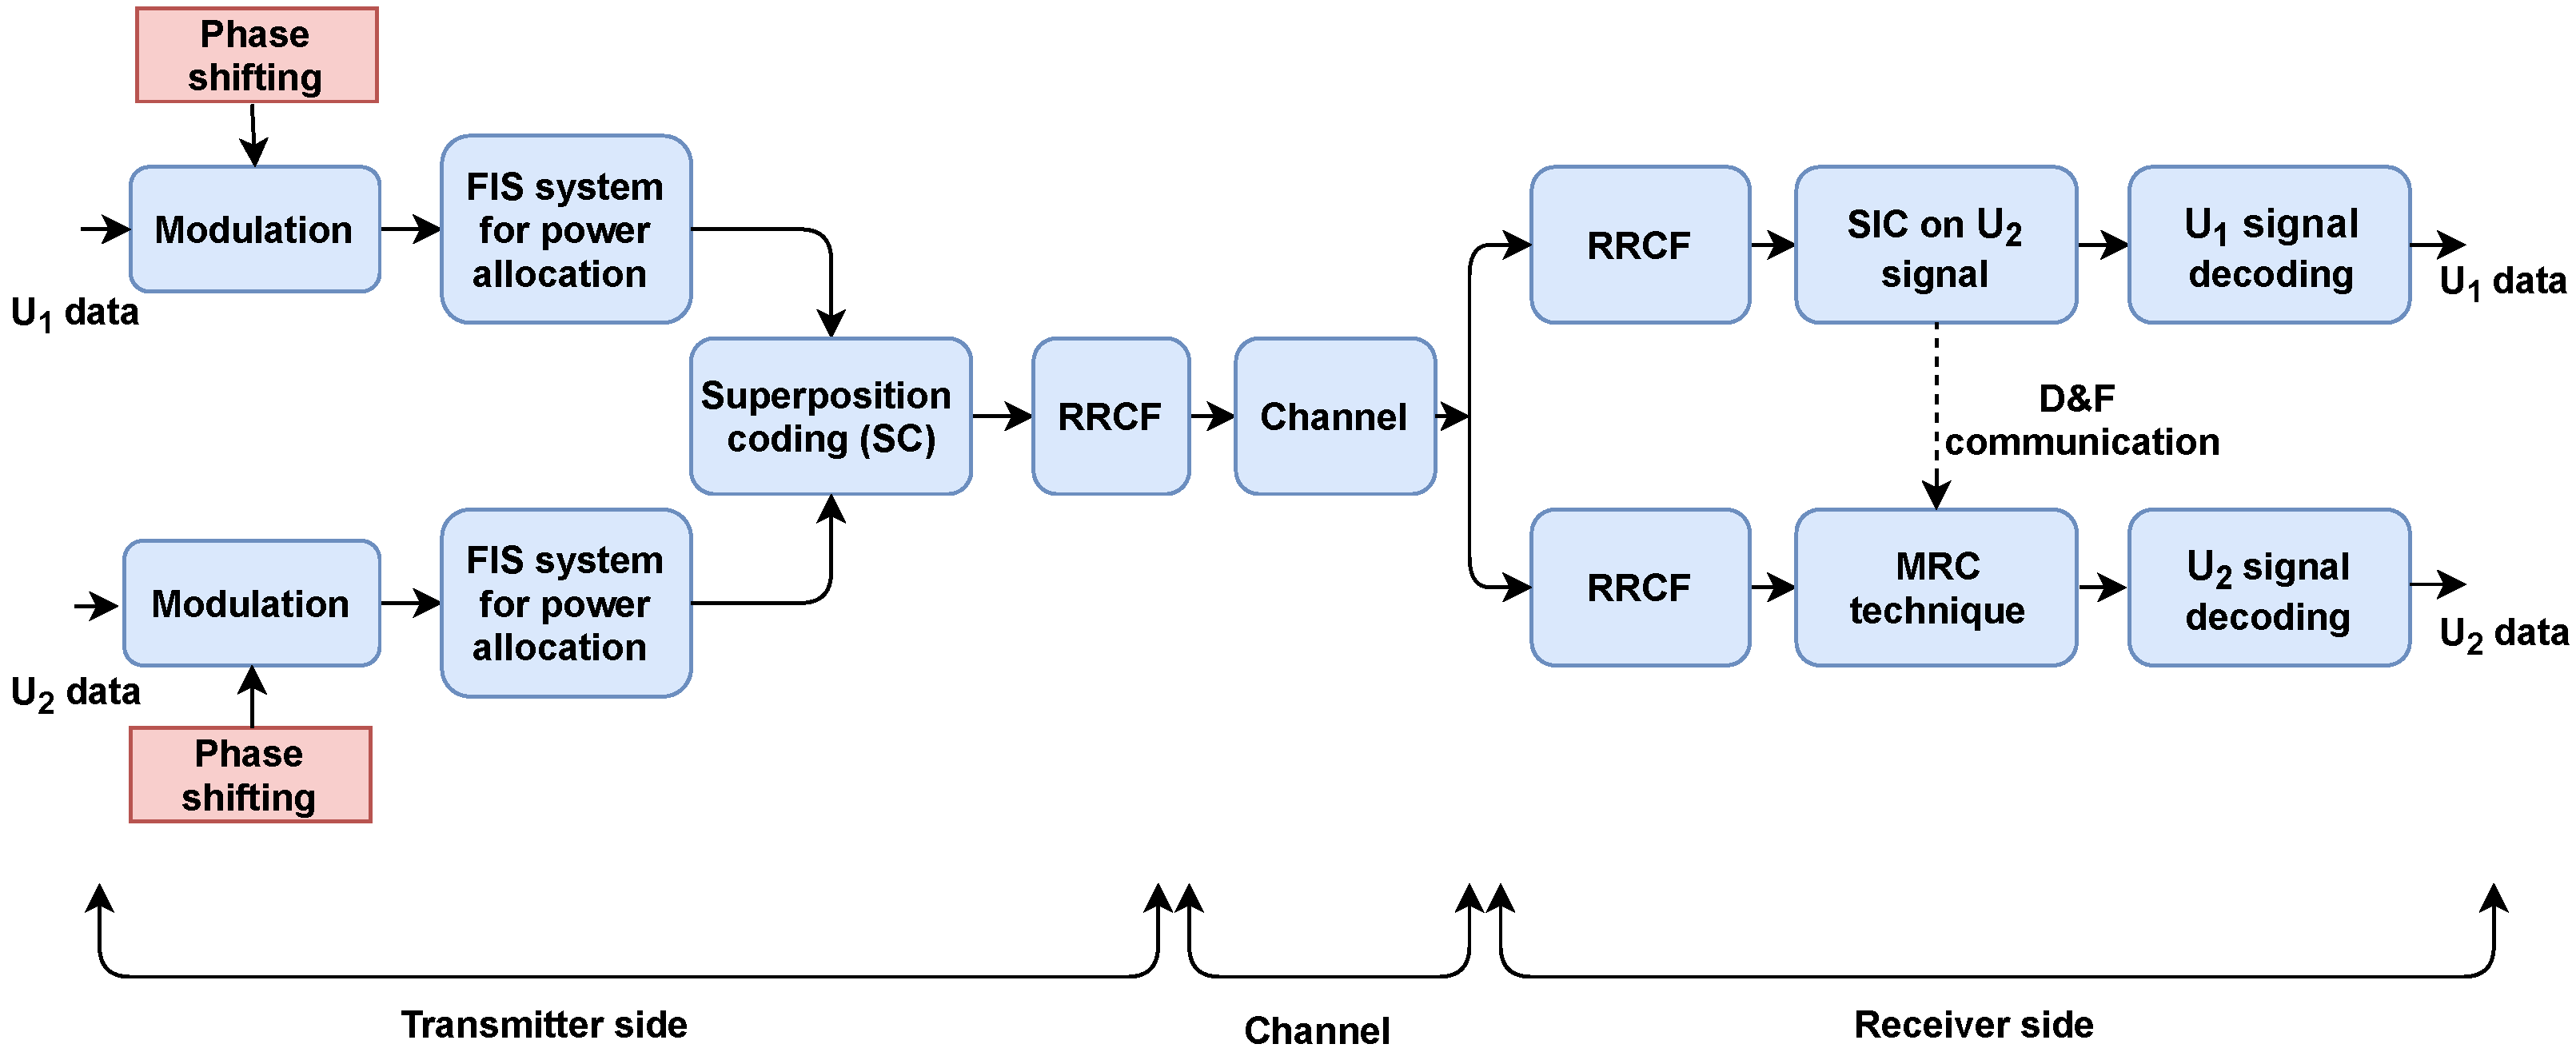
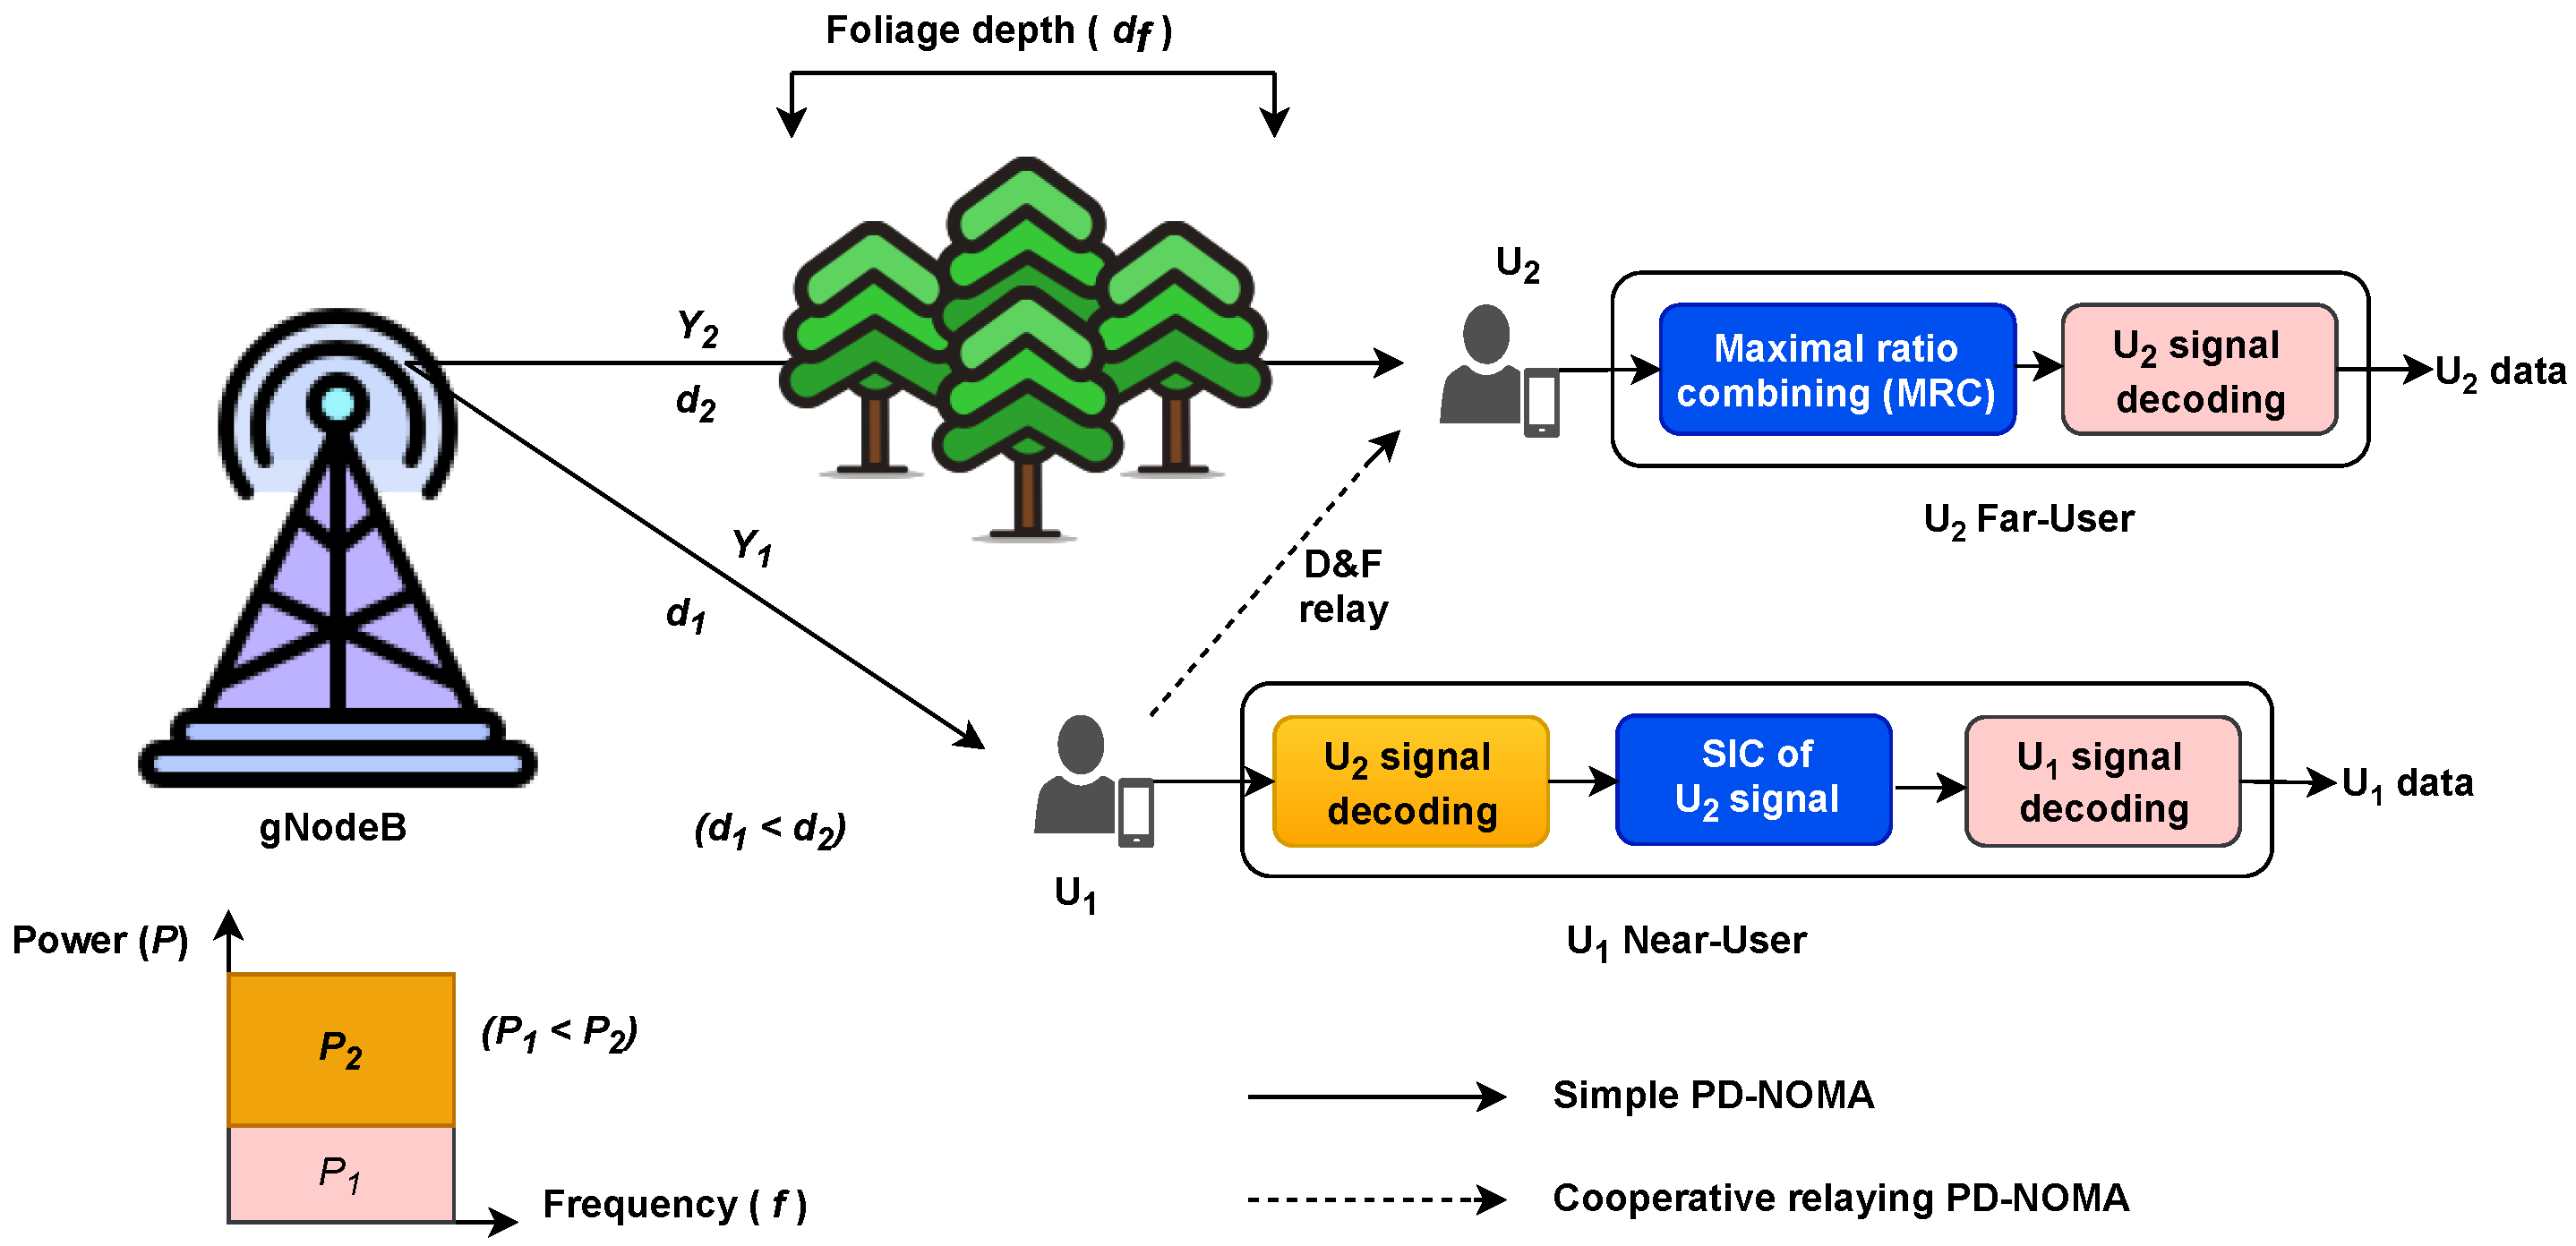
- The proposed methodology employs the decode and forward (D&F) cooperation relaying mechanism at the cell-center level to improve BER performance at the cell-edge level, where a maximum ratio combining (MRC) is used for detection.
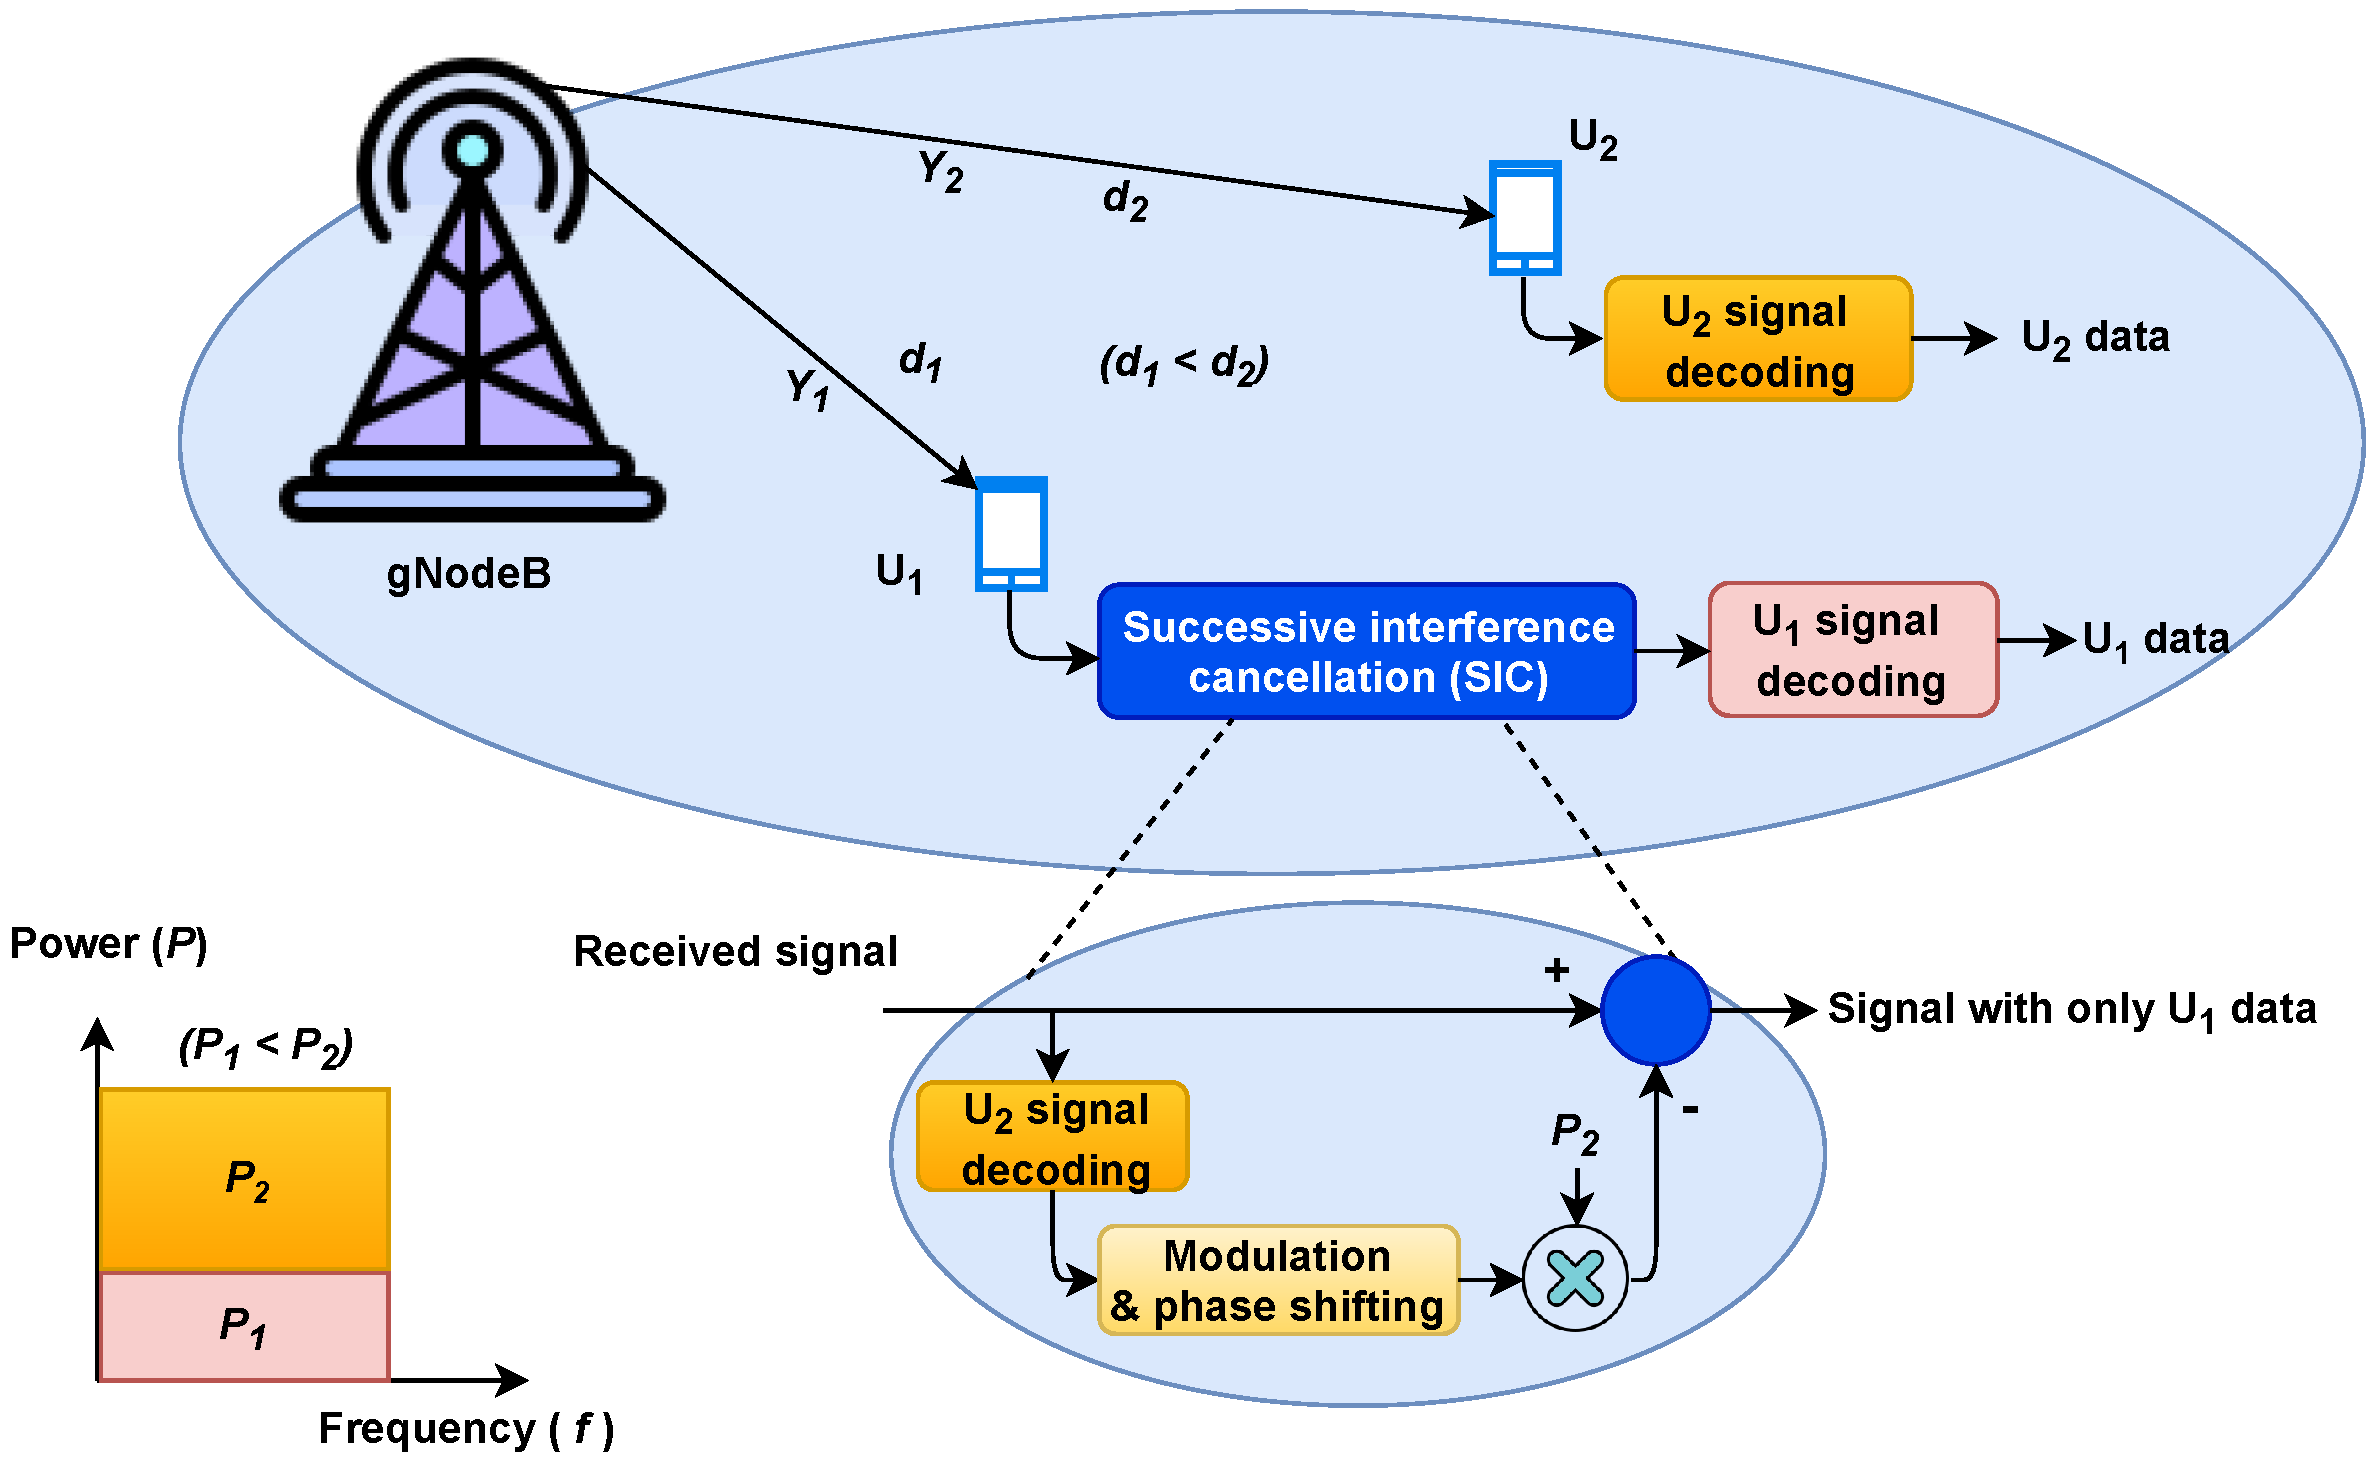
2. System Model
3. Optimal Power Allocation (PA), Cooperative Relaying and Channel Models in PD-NOMA
3.1. Fuzzy Inference System for Optimal PA
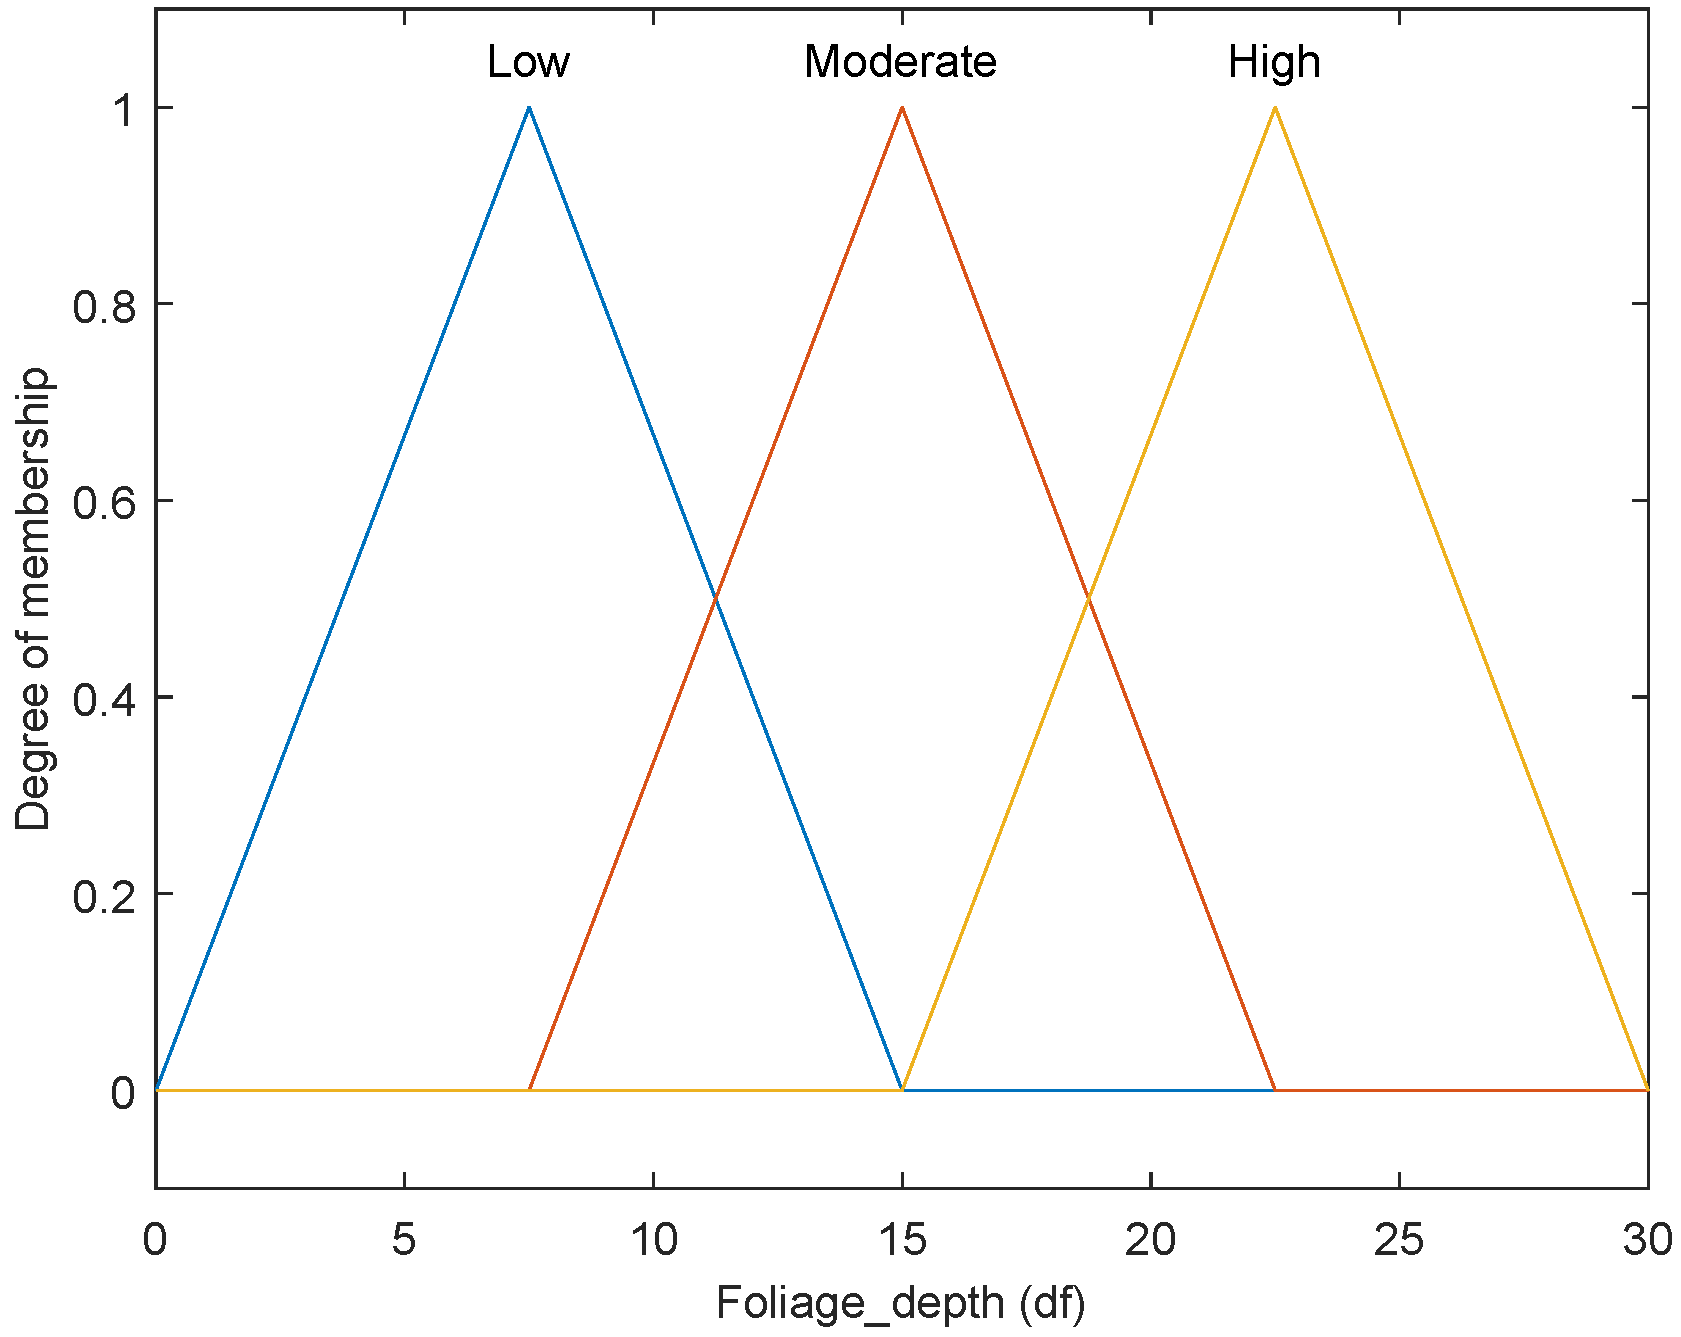
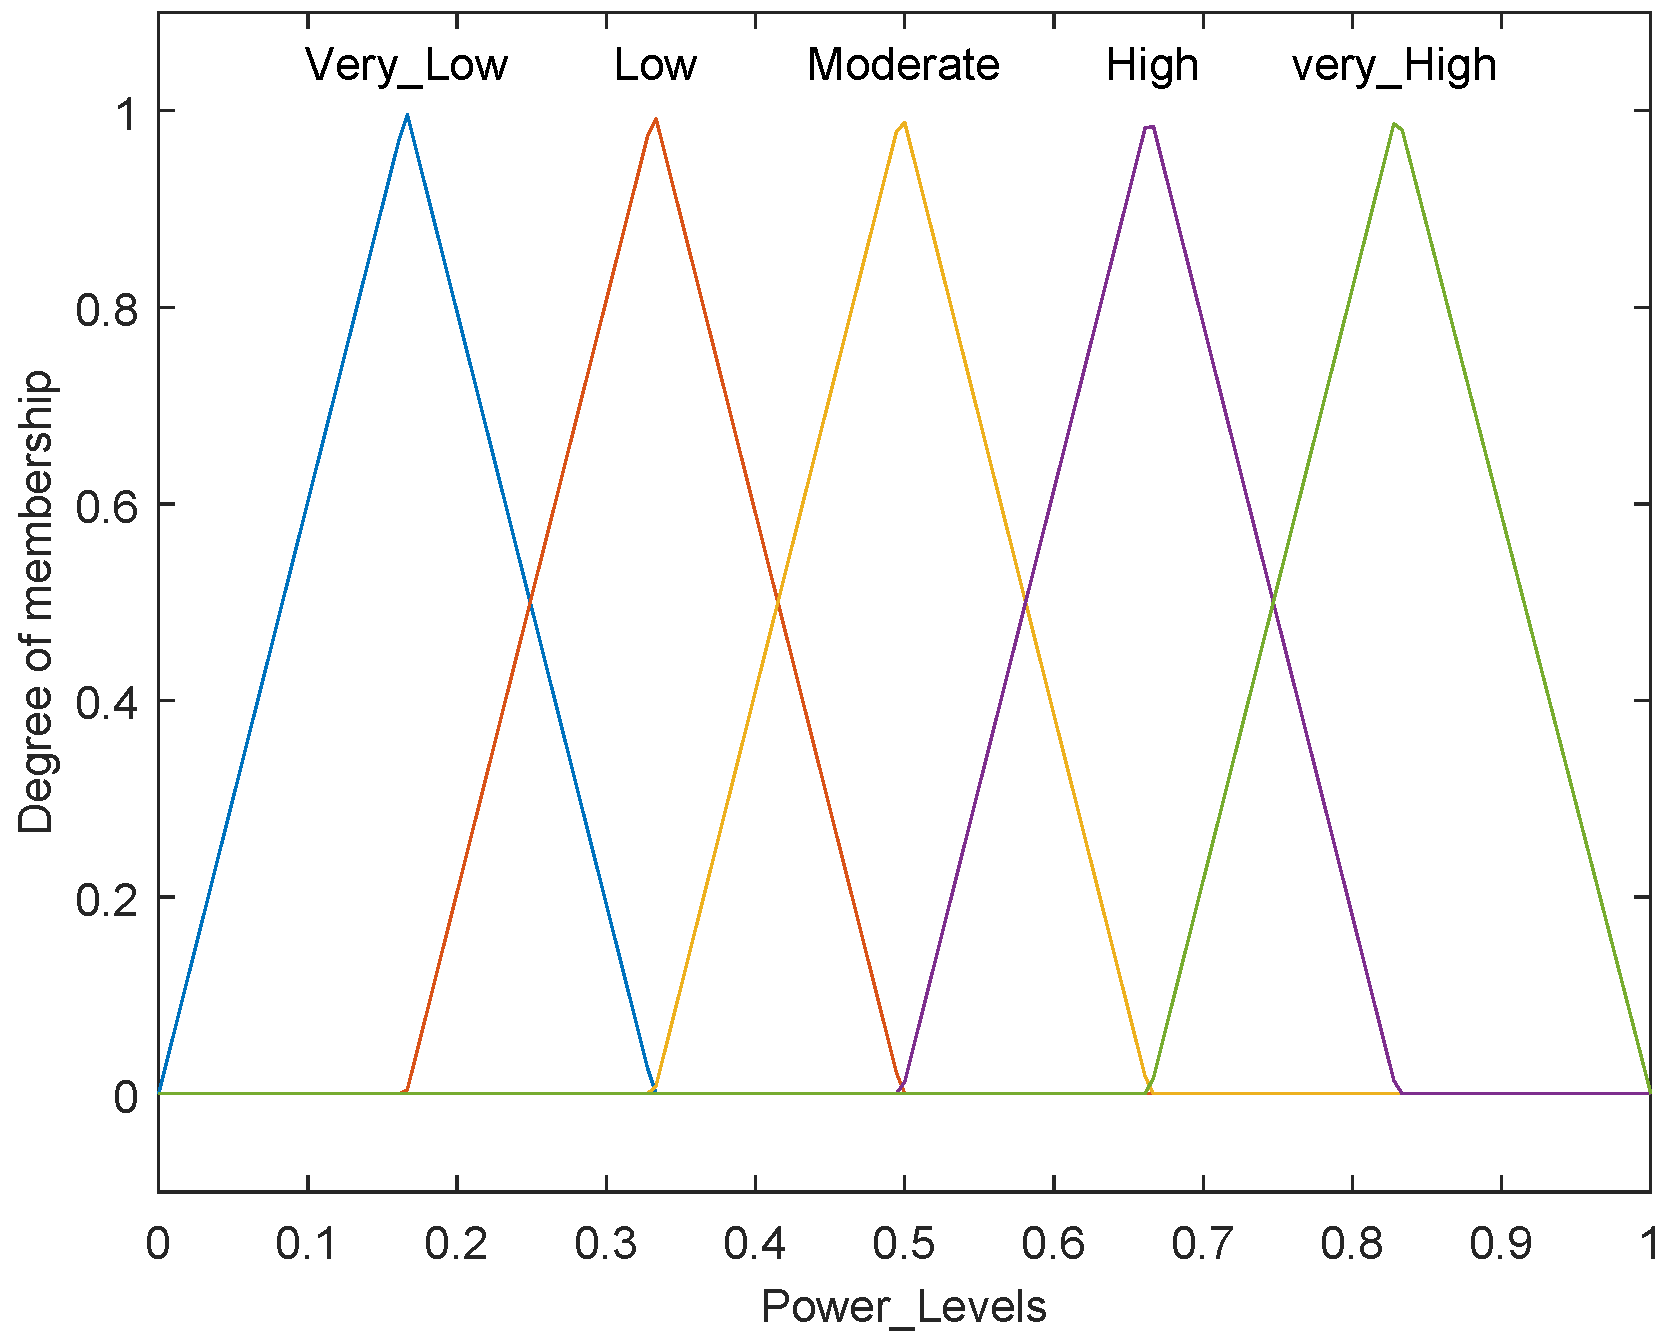
3.1.1. Selection of Fuzzy Sets
3.1.2. Fuzzy Rule Matrix (FRM) for Optimal PA
3.1.3. Defuzzification
3.2. Cooperative Relaying and Channel Models in PD-NOMA
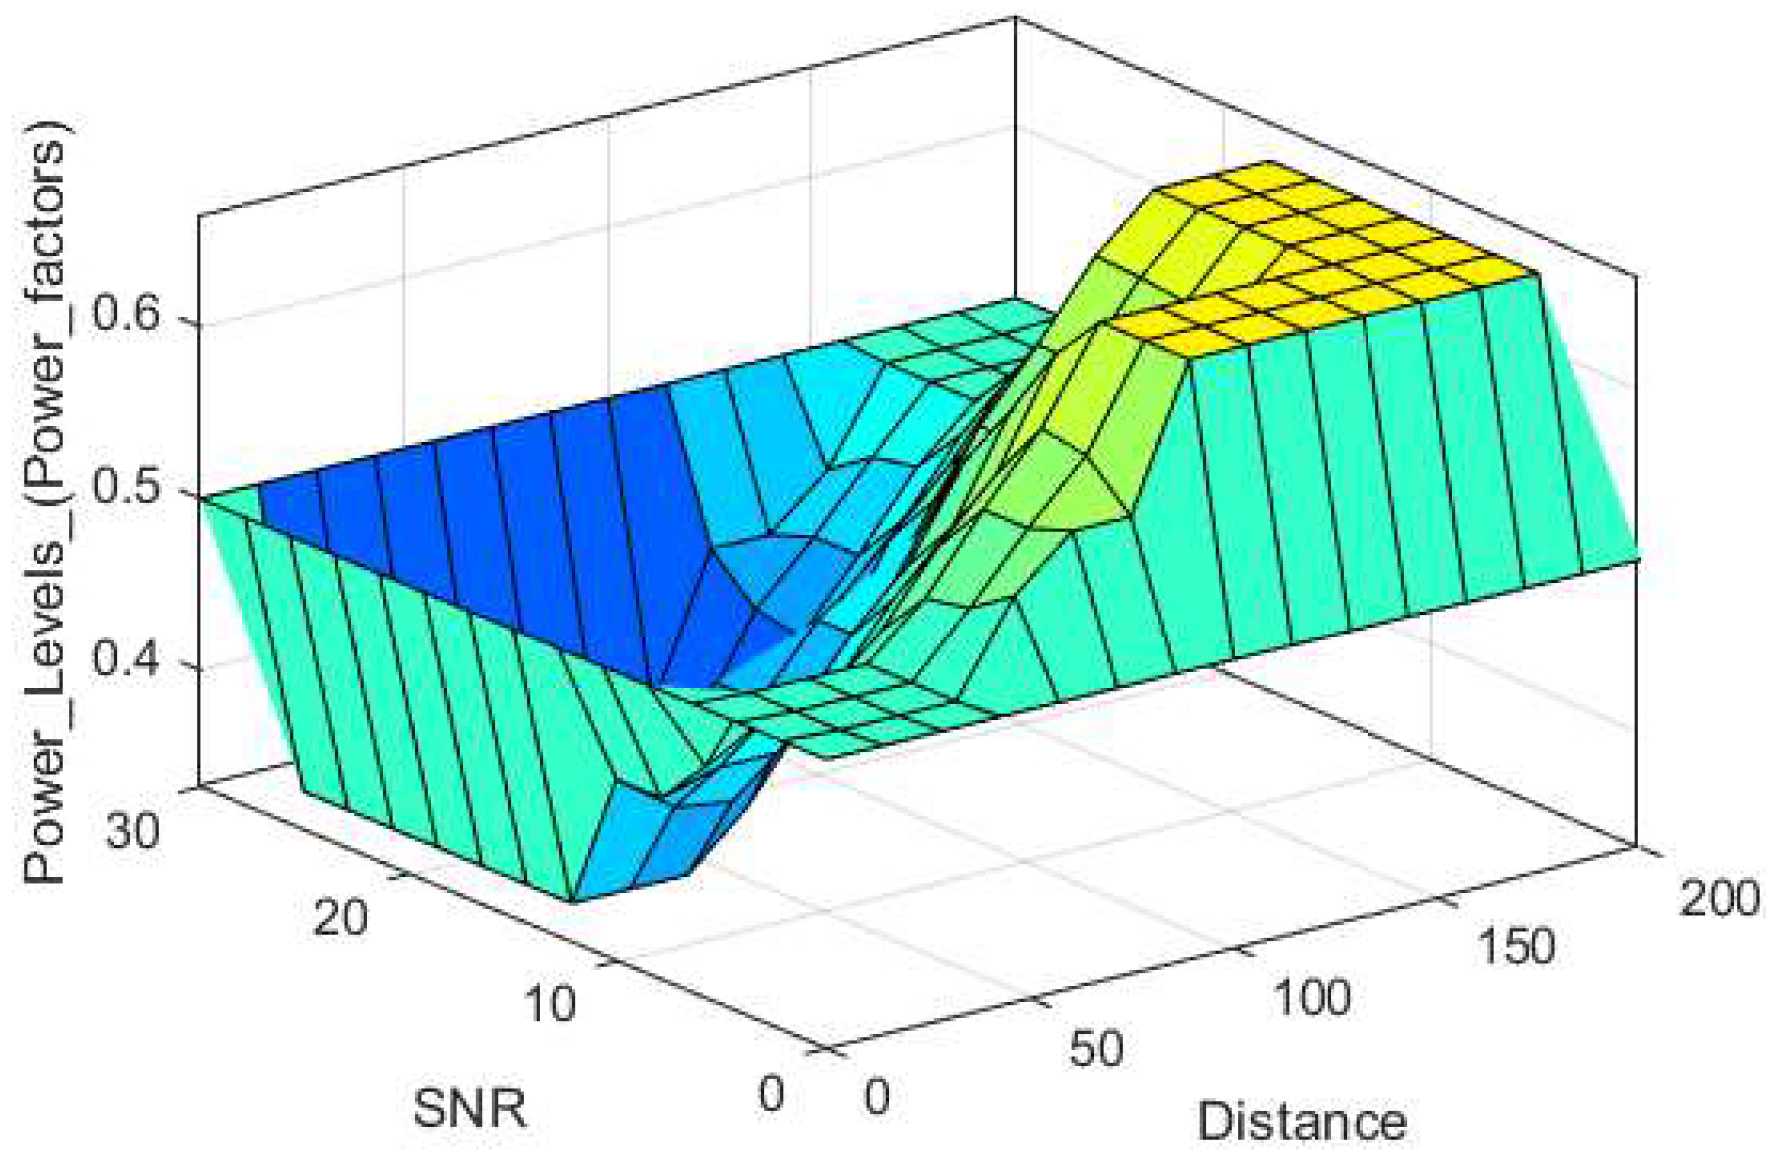
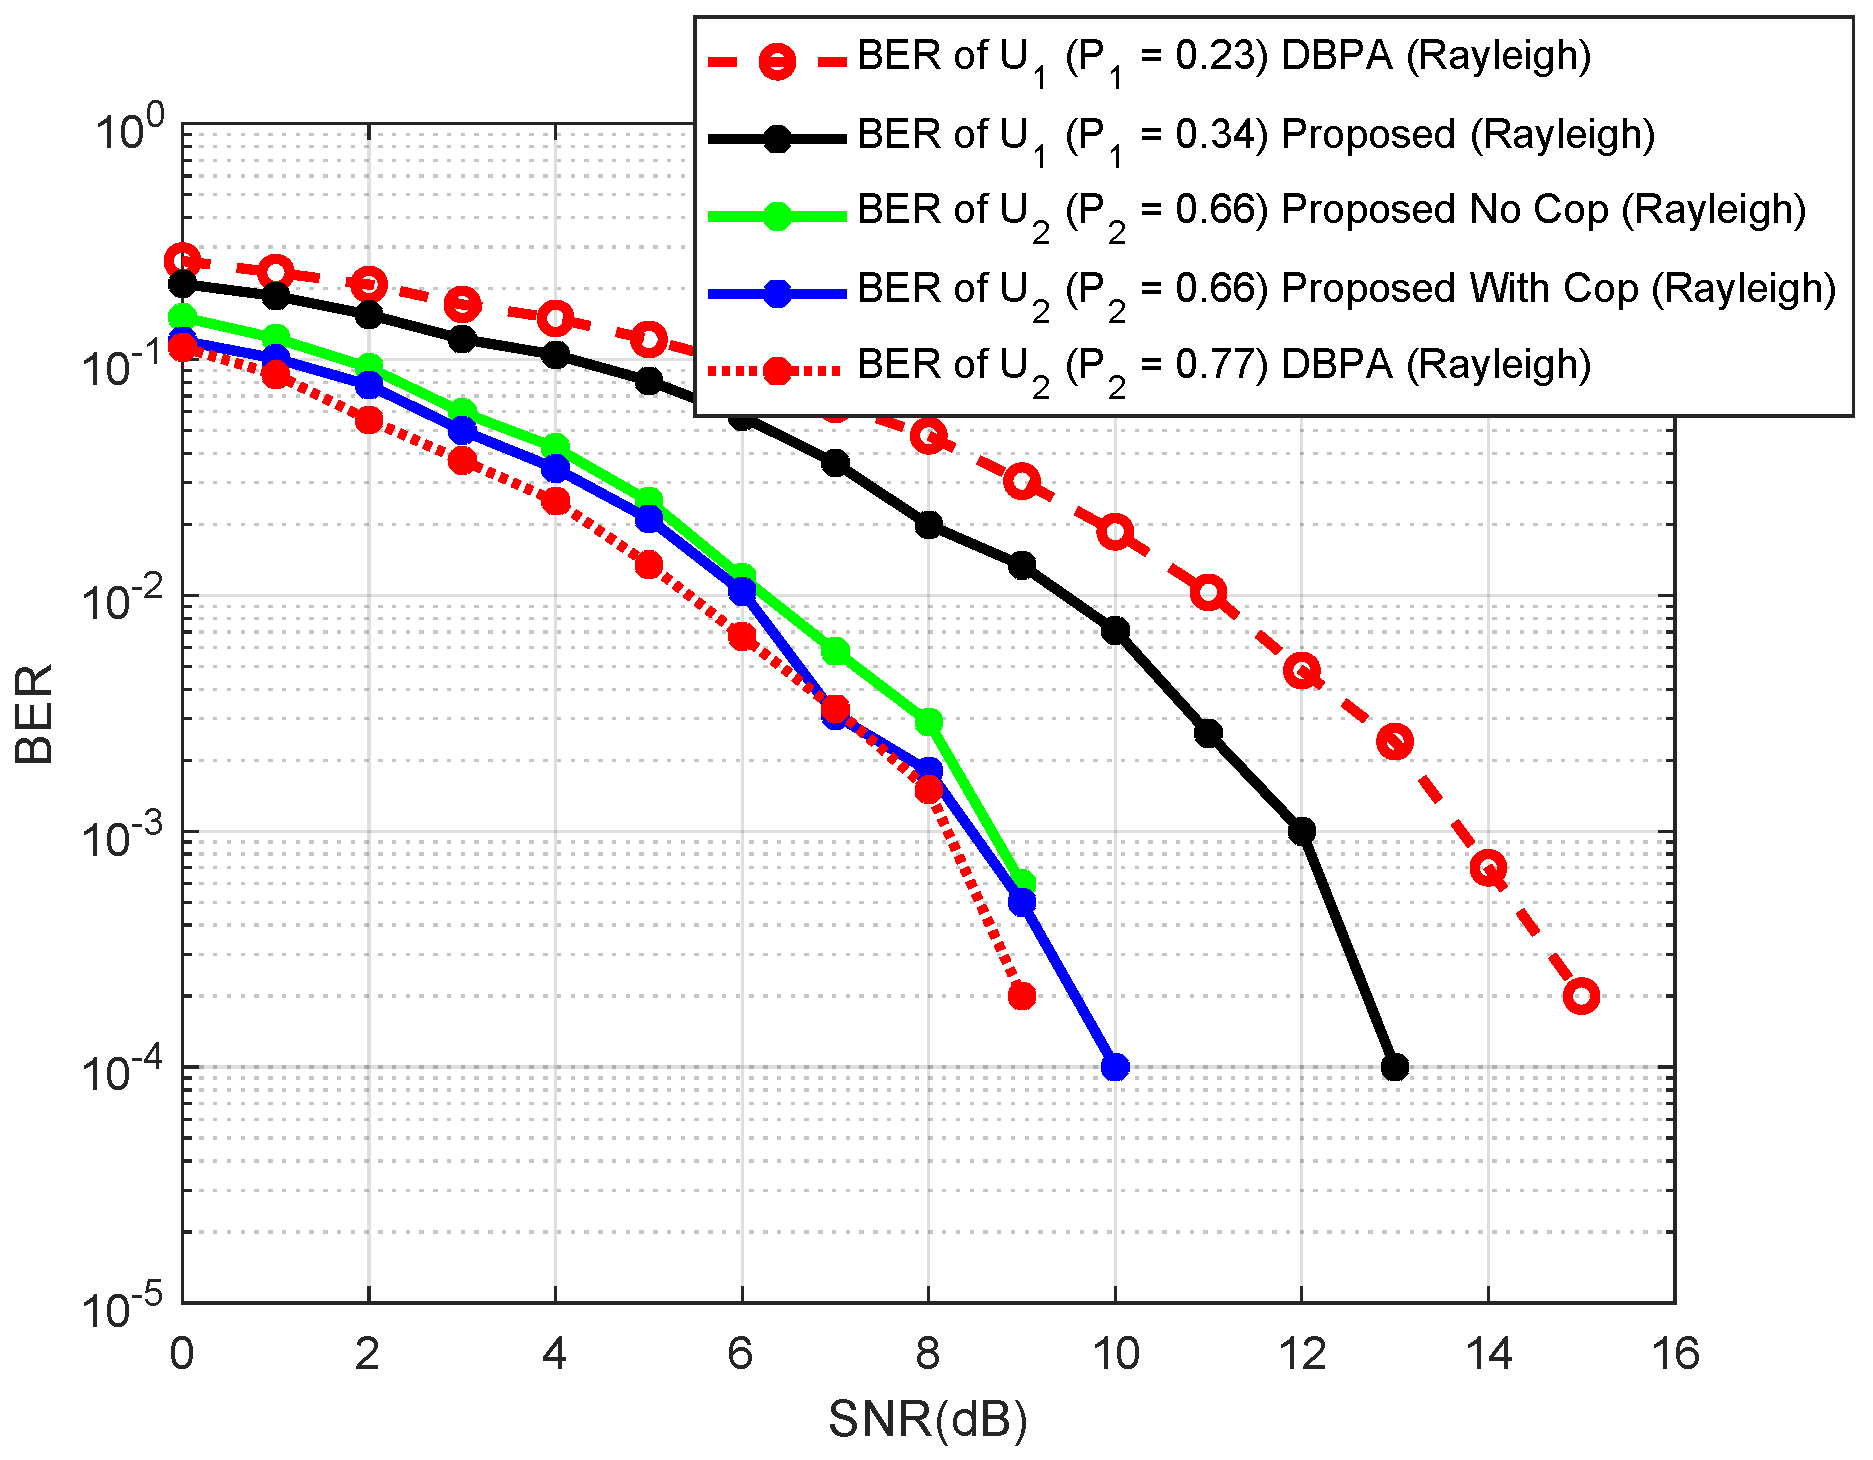
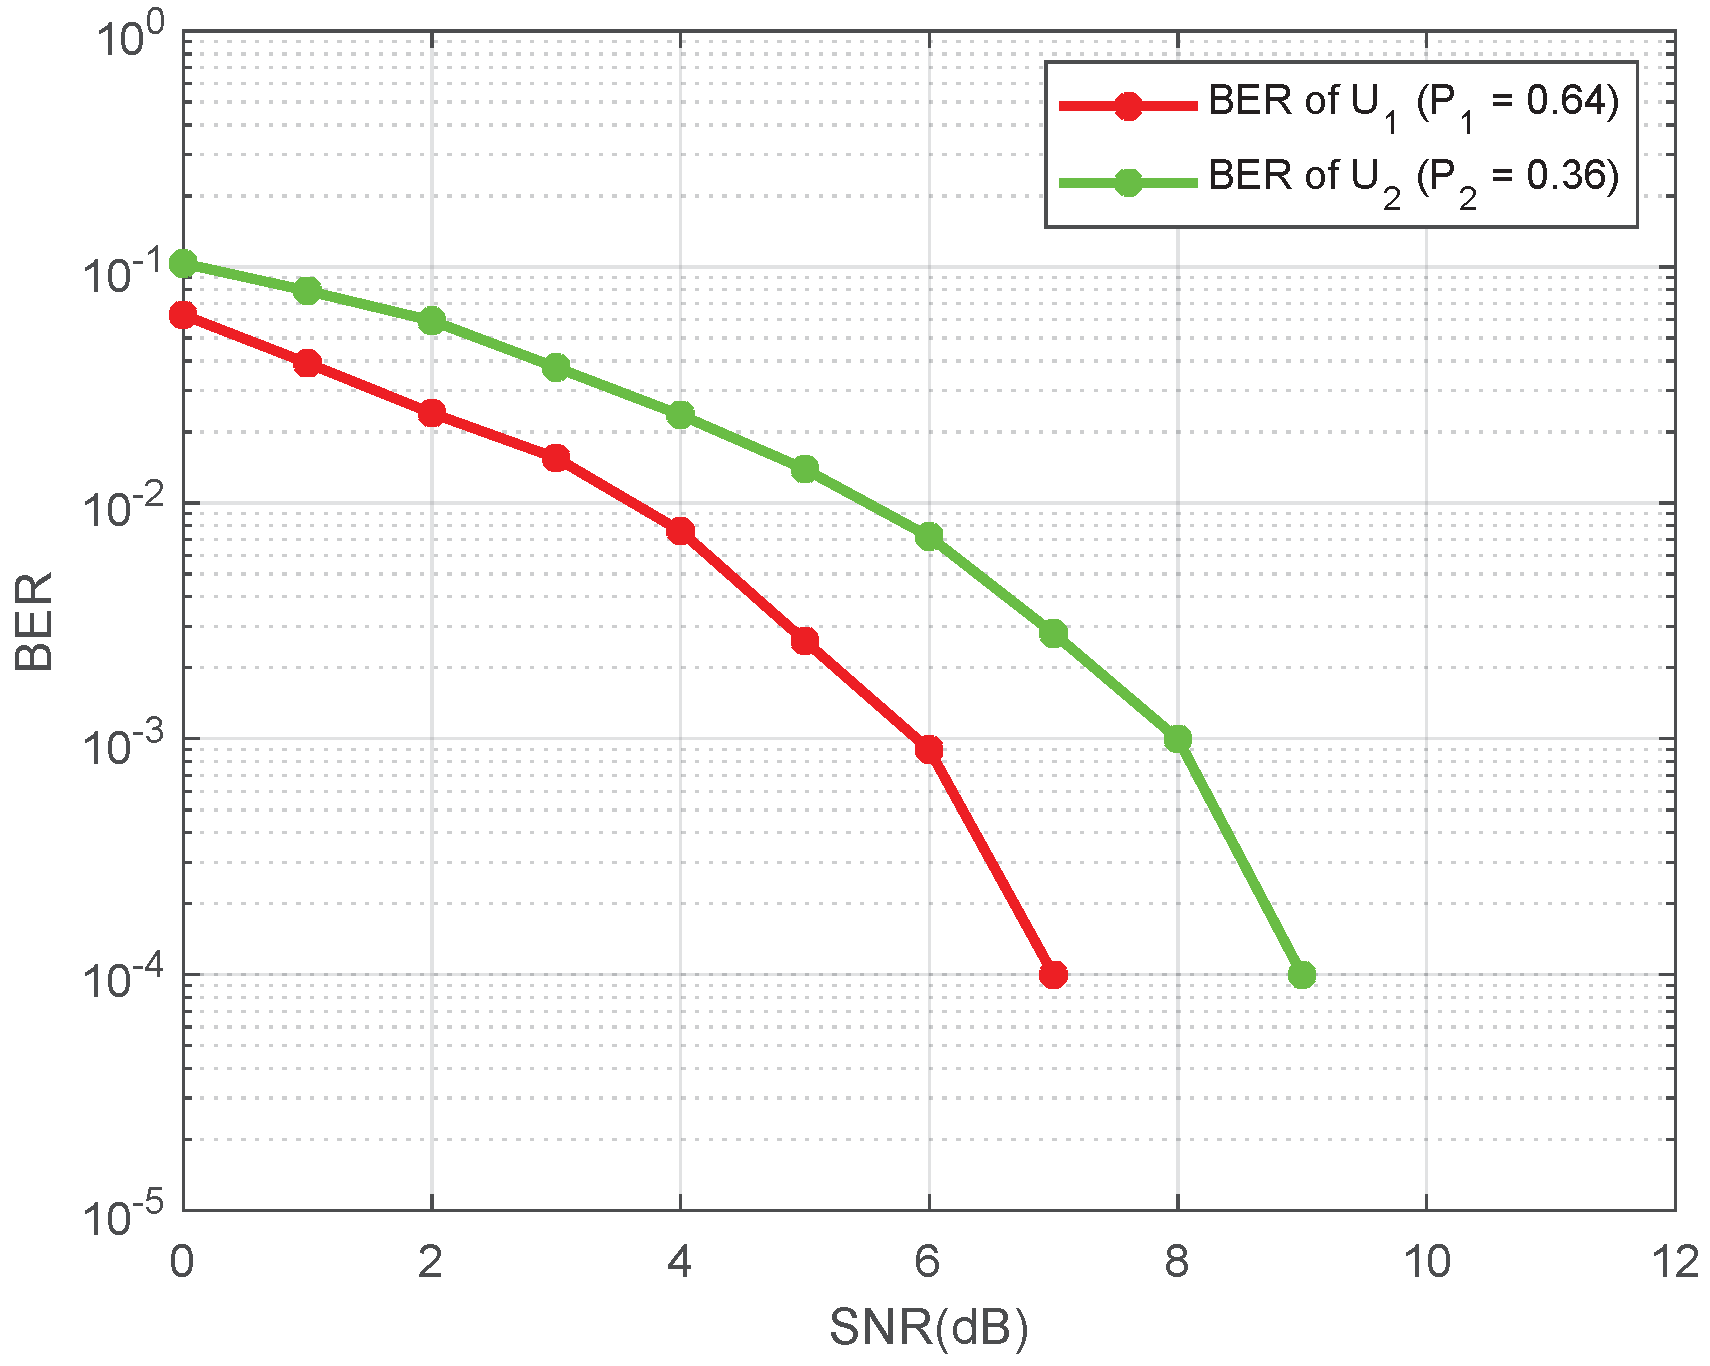
4. Simulation Results
5. Conclusions
Author Contributions
Funding
Acknowledgments
Conflicts of Interest
Appendix A. Numerical Example for the Proposed FIS-Based System
- = min (0.6666, 0.1333, 0.6666) = 0.1333, and = 0.3332.
- = min (0.6666, 0.1333, 0.3333) = 0.1333, and = 0.4998.
- = min (0.6666, 0.8666, 0.6666) = 0.6666, and = 0.3332.
- = min (0.6666, 0.8666, 0.3333) = 0.3333, and = 0.3332.
- = min (0.2, 0.1333, 0.6666) = 0.1333, and = 0.4998.
- = min (0.2, 0.1333, 0.3333) = 0.1333, and = 0.6664.
- = min (0.2, 0.8666, 0.6666) = 0.2, and = 0.3332.
- = min (0.2, 0.8666, 0.3333) = 0.2, and = 0.4998.
References
- Saito, Y.; Kishiyama, Y.; Benjebbour, A.; Nakamura, T.; Li, A.; Higuchi, K. Non-orthogonal multiple access (NOMA) for cellular future radio access. In Proceedings of the 2013 IEEE 77th Vehicular Technology Conference (VTC Spring), Dresden, Germany, 2–5 June 2013; pp. 1–5. [Google Scholar]
- Makki, B.; Chitti, K.; Behravan, A.; Alouini, M.S. A survey of NOMA: Current status and open research challenges. IEEE Open J. Commun. Soc. 2020, 1, 179–189. [Google Scholar] [CrossRef] [Green Version]
- Higuchi, K.; Benjebbour, A. Non-orthogonal multiple access (NOMA) with successive interference cancellation for future radio access. IEICE Trans. Commun. 2015, 98, 403–414. [Google Scholar] [CrossRef] [Green Version]
- Ping, L.; Liu, L.; Wu, K.; Leung, W.K. Interleave division multiple-access. IEEE Trans. Wirel. Commun. 2006, 5, 938–947. [Google Scholar] [CrossRef] [Green Version]
- Ping, L.; Wang, P.; Wang, X. Recent progress in interleave-division multiple-access (IDMA). In Proceedings of the MILCOM 2007-IEEE Military Communications Conference, Orlando, FL, USA, 29–31 October 2007; pp. 1–7. [Google Scholar]
- Nikopour, H.; Baligh, H. Sparse code multiple access. In Proceedings of the 2013 IEEE 24th Annual International Symposium on Personal, Indoor, and Mobile Radio Communications (PIMRC), London, UK, 8–11 September 2013; pp. 332–336. [Google Scholar]
- Al-Imari, M.; Imran, M.A. Low density spreading multiple access. In Multiple Access Techniques for 5G Wireless Networks and Beyond; Springer: Cham, Switzerland, 2019; pp. 493–514. [Google Scholar]
- Chen, S.; Ren, B.; Gao, Q.; Kang, S.; Sun, S.; Niu, K. Pattern division multiple access—A novel nonorthogonal multiple access for fifth-generation radio networks. IEEE Trans. Veh. Technol. 2016, 66, 3185–3196. [Google Scholar] [CrossRef]
- Larsson, E.G.; Edfors, O.; Tufvesson, F.; Marzetta, T.L. Massive MIMO for next generation wireless systems. IEEE Commun. Mag. 2014, 52, 186–195. [Google Scholar] [CrossRef] [Green Version]
- Zeng, M.; Hao, W.; Dobre, O.A.; Ding, Z. Cooperative NOMA: State of the art, key techniques, and open challenges. IEEE Netw. 2020, 34, 205–211. [Google Scholar] [CrossRef]
- Kryukov, Y.V.; Pokamestov, D.A.; Rogozhnikov, E.V.; Demidov, A.Y.; Gromova, Y.S. Experimental research of PD/NOMA. In Proceedings of the 2018 19th International Conference of Young Specialists on Micro/Nanotechnologies and Electron Devices (EDM), Erlagol, Russia, 29 June–3 July 2018; pp. 176–179. [Google Scholar]
- Zhang, X.; Haenggi, M. The performance of successive interference cancellation in random wireless networks. IEEE Trans. Inf. Theory 2014, 60, 6368–6388. [Google Scholar] [CrossRef] [Green Version]
- Ding, Z.; Schober, R.; Poor, H.V. Unveiling the importance of SIC in NOMA systems—Part 1: State of the art and recent findings. IEEE Commun. Lett. 2020, 24, 2373–2377. [Google Scholar] [CrossRef]
- Kang, J.M.; Kim, I.M. Optimal user grouping for downlink NOMA. IEEE Wirel. Commun. Lett. 2018, 7, 724–727. [Google Scholar] [CrossRef]
- Lei, H.; Gao, R.; Park, K.H.; Ansari, I.S.; Kim, K.J.; Alouini, M.S. On secure downlink NOMA systems with outage constraint. IEEE Trans. Commun. 2020, 68, 7824–7836. [Google Scholar] [CrossRef]
- Mahmood, A.; Zeeshan, M. Power allocation and performance analysis of multiuser NOMA under NYUSIM channel model. In Proceedings of the 2019 14th Conference on Industrial and Information Systems (ICIIS), Kandy, Sri Lanka, 18–20 December 2019; pp. 296–301. [Google Scholar]
- Mahmood, A.; Khan, S.; Hussain, S.; Zeeshan, M. Performance Analysis of Multi-User Downlink PD-NOMA Under SUI Fading Channel Models. IEEE Access 2021, 9, 52851–52859. [Google Scholar] [CrossRef]
- Mahmood, A.; Zeeshan, M.; Ashraf, T. A new hybrid CDMA-NOMA scheme with power allocation and user clustering for capacity improvement. Telecommun. Syst. 2021, 78, 225–237. [Google Scholar] [CrossRef]
- Ali, S.; Hossain, E.; Kim, D.I. Non-orthogonal multiple access (NOMA) for downlink multiuser MIMO systems: User clustering, beamforming, and power allocation. IEEE Access 2016, 5, 565–577. [Google Scholar] [CrossRef]
- Rihan, M.; Huang, L.; Zhang, P. Joint interference alignment and power allocation for NOMA-based multi-user MIMO systems. EURASIP J. Wirel. Commun. Netw. 2018, 1, 217. [Google Scholar] [CrossRef]
- Khan, S.K.; Farasat, M.; Naseem, U.; Ali, F. Performance evaluation of next-generation wireless (5G) UAV relay. Wirel. Pers. Commun. 2020, 113, 945–960. [Google Scholar] [CrossRef]
- Di Renzo, M.; Zappone, A.; Debbah, M.; Alouini, M.S.; Yuen, C.; De Rosny, J.; Tretyakov, S. Smart radio environments empowered by reconfigurable intelligent surfaces: How it works, state of research, and the road ahead. IEEE J. Sel. Areas Commun. 2020, 38, 2450–2525. [Google Scholar] [CrossRef]
- Liu, Y.; Liu, X.; Mu, X.; Hou, T.; Xu, J.; Di Renzo, M.; Al-Dhahir, N. Reconfigurable intelligent surfaces: Principles and opportunities. IEEE Commun. Surv. Tutor. 2021, 23, 1546–1577. [Google Scholar] [CrossRef]
- Liaqat, M.; Noordin, K.A.; Abdul Latef, T.; Dimyati, K. Power-domain non orthogonal multiple access (PD-NOMA) in cooperative networks: An overview. Wirel. Netw. 2020, 26, 181–203. [Google Scholar] [CrossRef]
- Basar, E.; Di Renzo, M.; De Rosny, J.; Debbah, M.; Alouini, M.S.; Zhang, R. Wireless communications through reconfigurable intelligent surfaces. IEEE Access 2019, 7, 116753–116773. [Google Scholar] [CrossRef]
- He, D.; Ai, B.; Guan, K.; Wang, L.; Zhong, Z.; Kürner, T. The design and applications of high-performance ray-tracing simulation platform for 5G and beyond wireless communications: A tutorial. IEEE Commun. Surv. Tutor. 2018, 21, 10–27. [Google Scholar] [CrossRef]
- Glassner, A.S. (Ed.) An Introduction to Ray Tracing; Morgan Kaufmann: San Francisco, CA, USA, 1989. [Google Scholar]
- Chen, Y.; Li, Y.; Han, C.; Yu, Z.; Wang, G. Channel measurement and ray-tracing-statistical hybrid modeling for low-terahertz indoor communications. IEEE Trans. Wirel. Commun. 2021, 20, 8163–8176. [Google Scholar] [CrossRef]
- Tian, Y.; Pan, G.; Alouini, M.S. On NOMA-based mmWave communications. IEEE Trans. Veh. Technol. 2020, 69, 15398–15411. [Google Scholar] [CrossRef]
- Taj, N.; Zafar, M.H.; Waqas, S.A.; Rehman, H.; Alassafi, M.O.; Khan, I. Smart Relay Selection Scheme Based on Fuzzy Logic with Optimal Power Allocation and Adaptive Data Rate Assignment. Int. J. Commun. Netw. Inf. Secur. 2019, 11, 239–247. [Google Scholar]
- Selvachandran, G.; Quek, S.G.; Lan, L.T.H.; Son, L.H.; Giang, N.L.; Ding, W.; Abdel-Basset, M.; Albuquerque, V.H.C. A new design of mamdani complex fuzzy inference system for multiattribute decision making problems. IEEE Trans. Fuzzy Syst. 2021, 29, 716–730. [Google Scholar] [CrossRef]
- Diaz, J.L.; Mendel, J.M.; Junior, R.H. Fuzzy-System Kernel Machines: A Kernel Method Based on the Connections Between Fuzzy Inference Systems and Kernel Machines. IEEE Trans. Fuzzy Syst. 2022, 1. [Google Scholar] [CrossRef]
- Baldo, N.; Zorzi, M. Cognitive network access using fuzzy decision making. IEEE Trans. Wirel. Commun. 2009, 8, 3523–3535. [Google Scholar] [CrossRef]
- Joshi, G.P.; Acharya, S.; Kim, S.W. Fuzzy-logic-based channel selection in IEEE 802.22 WRAN. Inf. Syst. 2015, 48, 327–332. [Google Scholar] [CrossRef]
- Farahani, H.; Ebadi, M.J.; Jafari, H. Finding inverse of a fuzzy matrix using eigenvalue method. Int. J. Innov. Technol. Explor. Eng. 2019, 9, 3030–3037. [Google Scholar]
- Jafari, H.; Malinowski, M.T.; Ebadi, M.J. Fuzzy stochastic differential equations driven by fractional Brownian motion. Adv. Differ. Equ. 2021, 2021, 16. [Google Scholar] [CrossRef]
- Ma, L.; Wang, X.; Wang, X.; Wang, L.; Shi, Y.; Huang, M. TCDA: Truthful combinatorial double auctions for mobile edge computing in industrial Internet of Things. IEEE Trans. Mob. Comput. 2021. [Google Scholar] [CrossRef]
- Omiyi, P.E.; Nasralla, M.M.; Rehman, I.U.; Khan, N.; Martini, M.G. An intelligent fuzzy logic-based content and channel aware downlink scheduler for scalable video over OFDMA wireless systems. Electronics. 2020, 9, 1071. [Google Scholar] [CrossRef]
- Rehman, I.U.; Philip, N.Y.; Nasralla, M.M. A hybrid quality evaluation approach based on fuzzy inference system for medical video streaming over small cell technology. In Proceedings of the 2016 IEEE 18th International Conference on e-Health Networking, Applications and Services (Healthcom), Munich, Germany, 14–16 September 2016; pp. 1–6.
- Jamali, N.; Sadegheih, A.; Lotfi, M.M.; Wood, L.C.; Ebadi, M.J. Estimating the depth of anesthesia during the induction by a novel adaptive neuro-fuzzy inference system: A case study. Neural Process. Lett. 2021, 53, 131–175. [Google Scholar] [CrossRef]
- Balasubbareddy, M.; Sivanagaraju, S.; Suresh, C.V. Multi-objective optimization in the presence of practical constraints using non-dominated sorting hybrid cuckoo search algorithm. Eng. Sci. Technol. Int. J. 2015, 18, 603–615. [Google Scholar] [CrossRef] [Green Version]
- Lee, C.C. Fuzzy logic in control systems: Fuzzy logic controller. I. IEEE Trans. Syst. Man Cybern. 1990, 20, 404–418. [Google Scholar] [CrossRef] [Green Version]
- Rappaport, T.S.; MacCartney, G.R.; Samimi, M.K.; Sun, S. Wideband millimeter-wave propagation measurements and channel models for future wireless communication system design. IEEE Trans. Commun. 2015, 63, 3029–3056. [Google Scholar] [CrossRef]
- Rahim, H.M.; Leow, C.Y.; Rahman, T.A. Millimeter wave propagation through foliage: Comparison of models. In Proceedings of the 2015 IEEE 12th Malaysia International Conference on Communications (MICC), Kuching, Malaysia, 23–25 November 2015; pp. 236–240. [Google Scholar]
- Zhang, Y.; Anderson, C.R.; Michelusi, N.; Love, D.J.; Baker, K.R.; Krogmeier, J.V. Propagation modeling through foliage in a coniferous forest at 28 GHz. IEEE Wirel. Commun. Lett. 2019, 8, 901–904. [Google Scholar] [CrossRef] [Green Version]


| S.no | d | SNR | d | Power Level |
|---|---|---|---|---|
| 1 | L | L | L | L |
| 2 | L | L | M | M |
| 3 | L | L | H | H |
| 4 | L | M | L | L |
| 5 | L | M | M | L |
| 6 | L | M | H | M |
| 7 | L | H | L | VL |
| 8 | L | H | M | L |
| 9 | L | H | H | L |
| 10 | M | L | L | M |
| 11 | M | L | M | H |
| 12 | M | L | H | H |
| 13 | M | M | L | L |
| 14 | M | M | M | M |
| 15 | M | M | H | H |
| 16 | M | H | L | L |
| 17 | M | H | M | L |
| 18 | M | H | H | M |
| 19 | H | L | L | H |
| 20 | H | L | M | H |
| 21 | H | L | H | VH |
| 22 | H | M | L | M |
| 23 | H | M | M | H |
| 24 | H | M | H | H |
| 25 | H | H | L | L |
| 26 | H | H | M | M |
| 27 | H | H | H | H |
| Parameters | Values |
|---|---|
| Carrier frequency () | 28 GHz |
| gNodeB radius | 200 m |
| gNodeB and U antenna | (SISO) 1,1 |
| gNodeB height () | 10 m |
| 0.0019 (Collective) | |
| Users (U) height () | 1 m |
| Path Loss exponent (n) | 2 |
| Modulation schemes | BPSK |
| Phase shifts | |
| Mean 0, variance 2.52 |
| Users | d | i/p SNR | d | Power Factor (DBPA) | Power Factor (FIS) | SNR Level Obtained (DBPA) | SNR Level Obtained (FIS) |
|---|---|---|---|---|---|---|---|
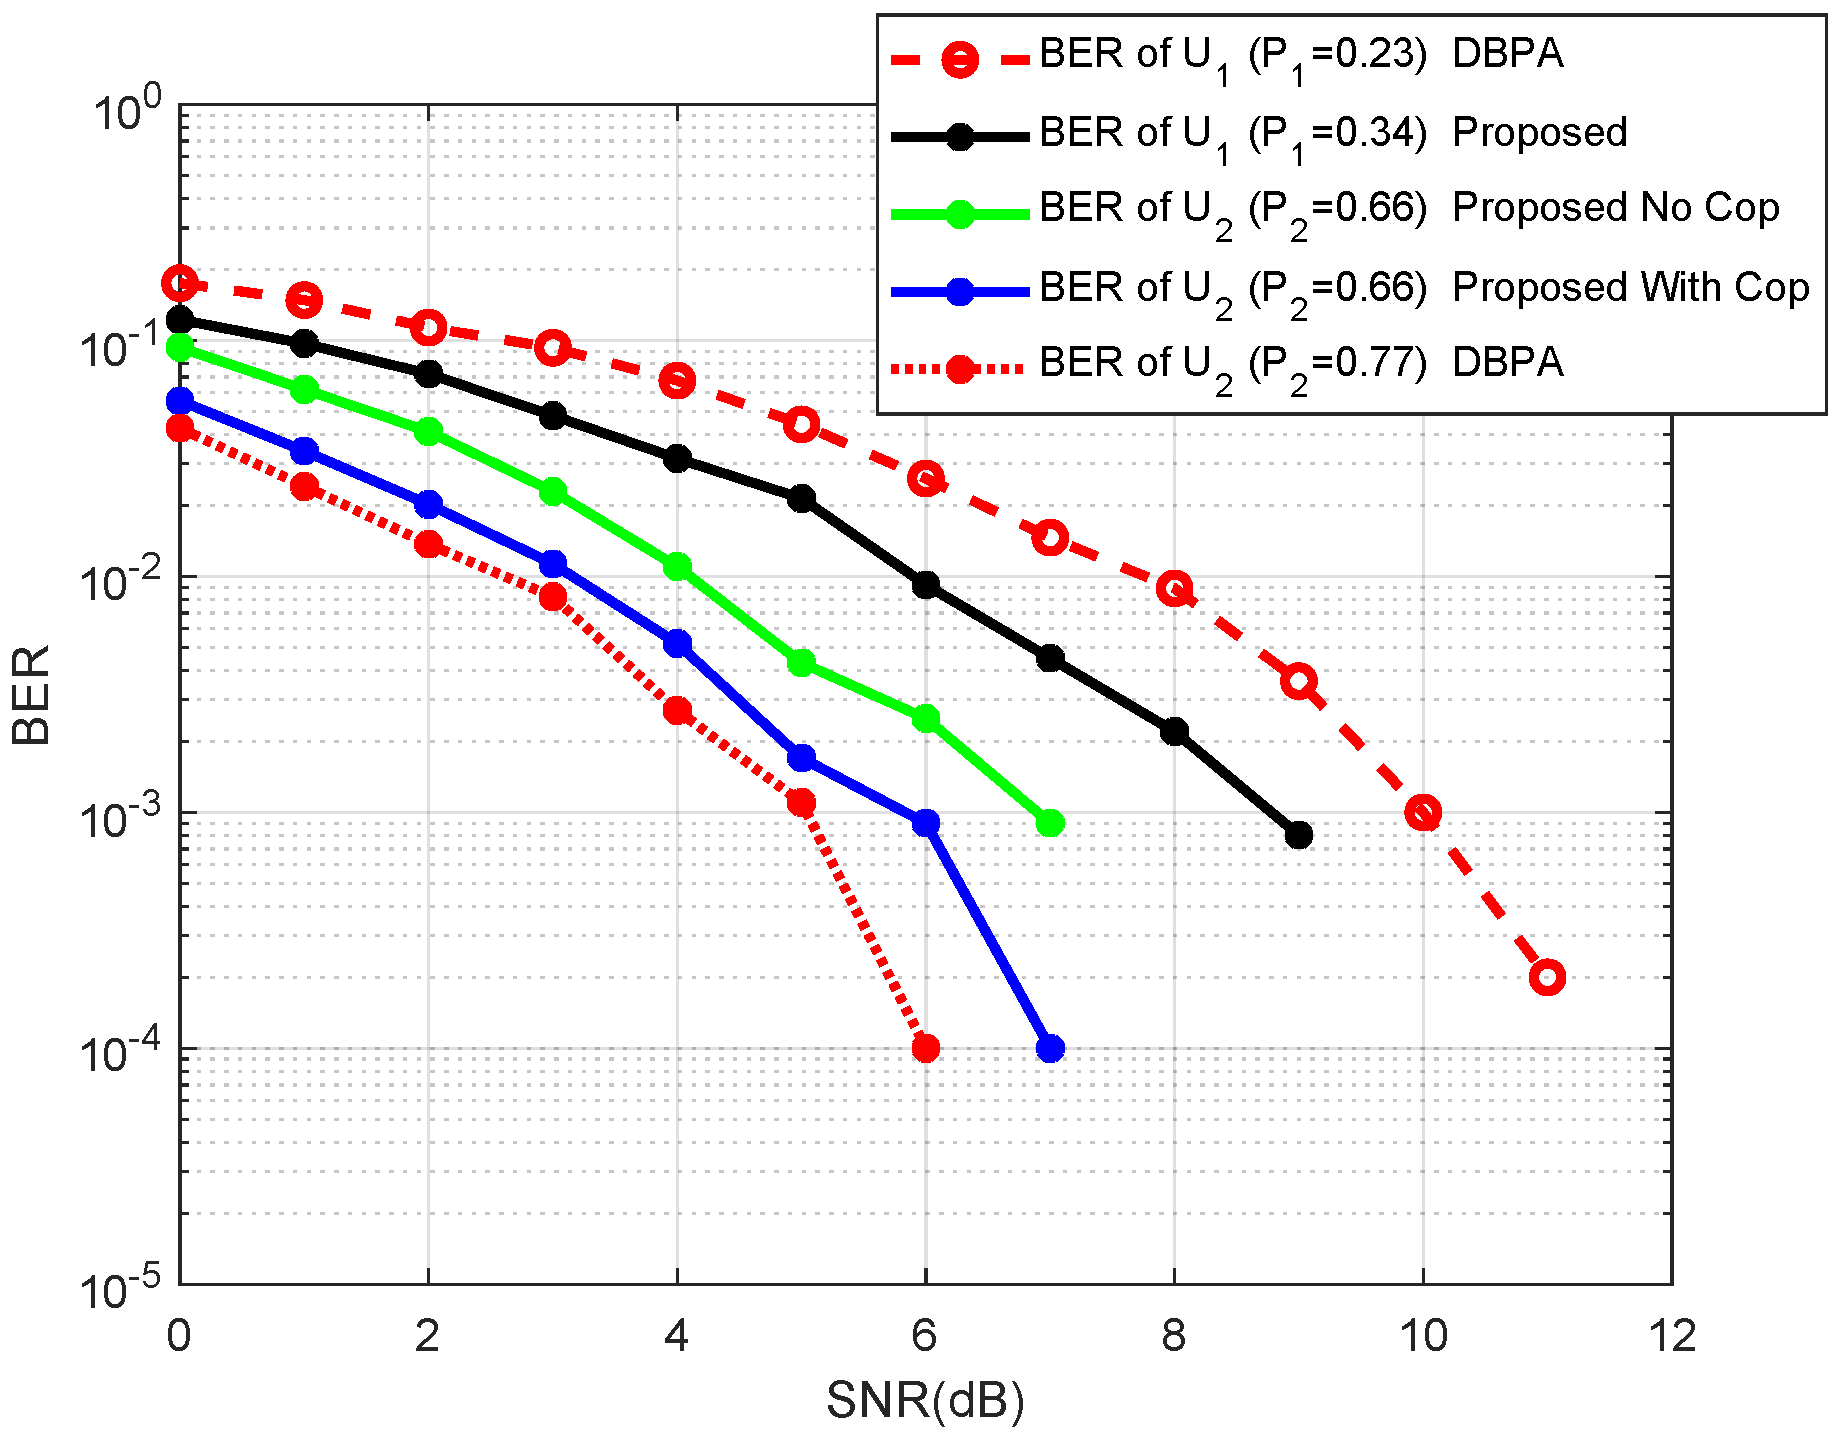
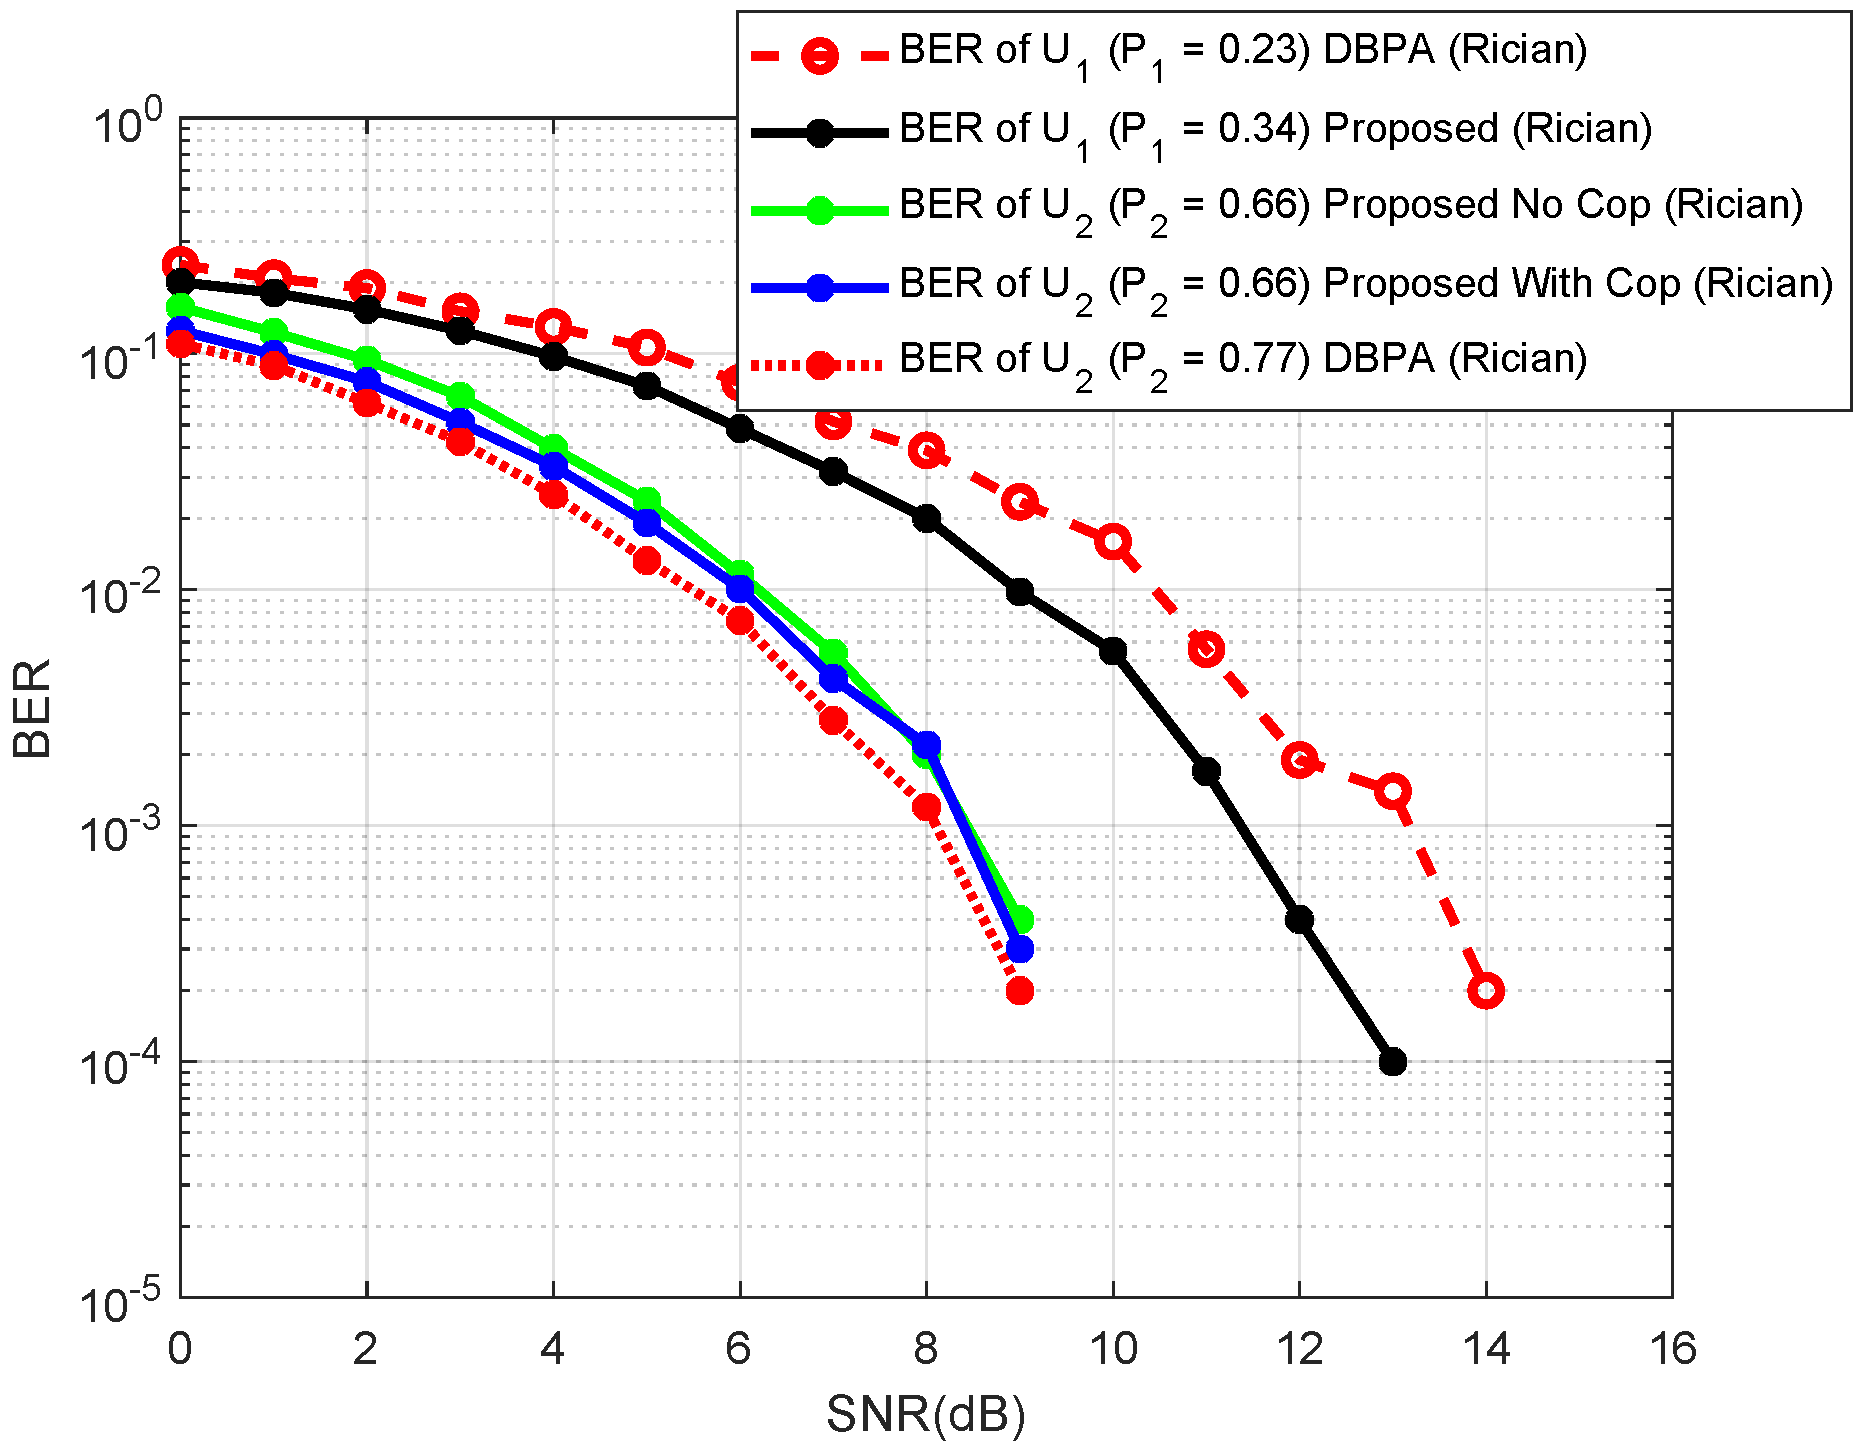
| UE | 60 m | 14 dB | 10 m | 0.23 | 0.34 | 10 dB | 8.8 dB |
| UE | 180 m | 10 dB | 28 m | 0.77 | 0.66 | 5 dB | 6 dB (with D&F), 7 dB (No D&F) |
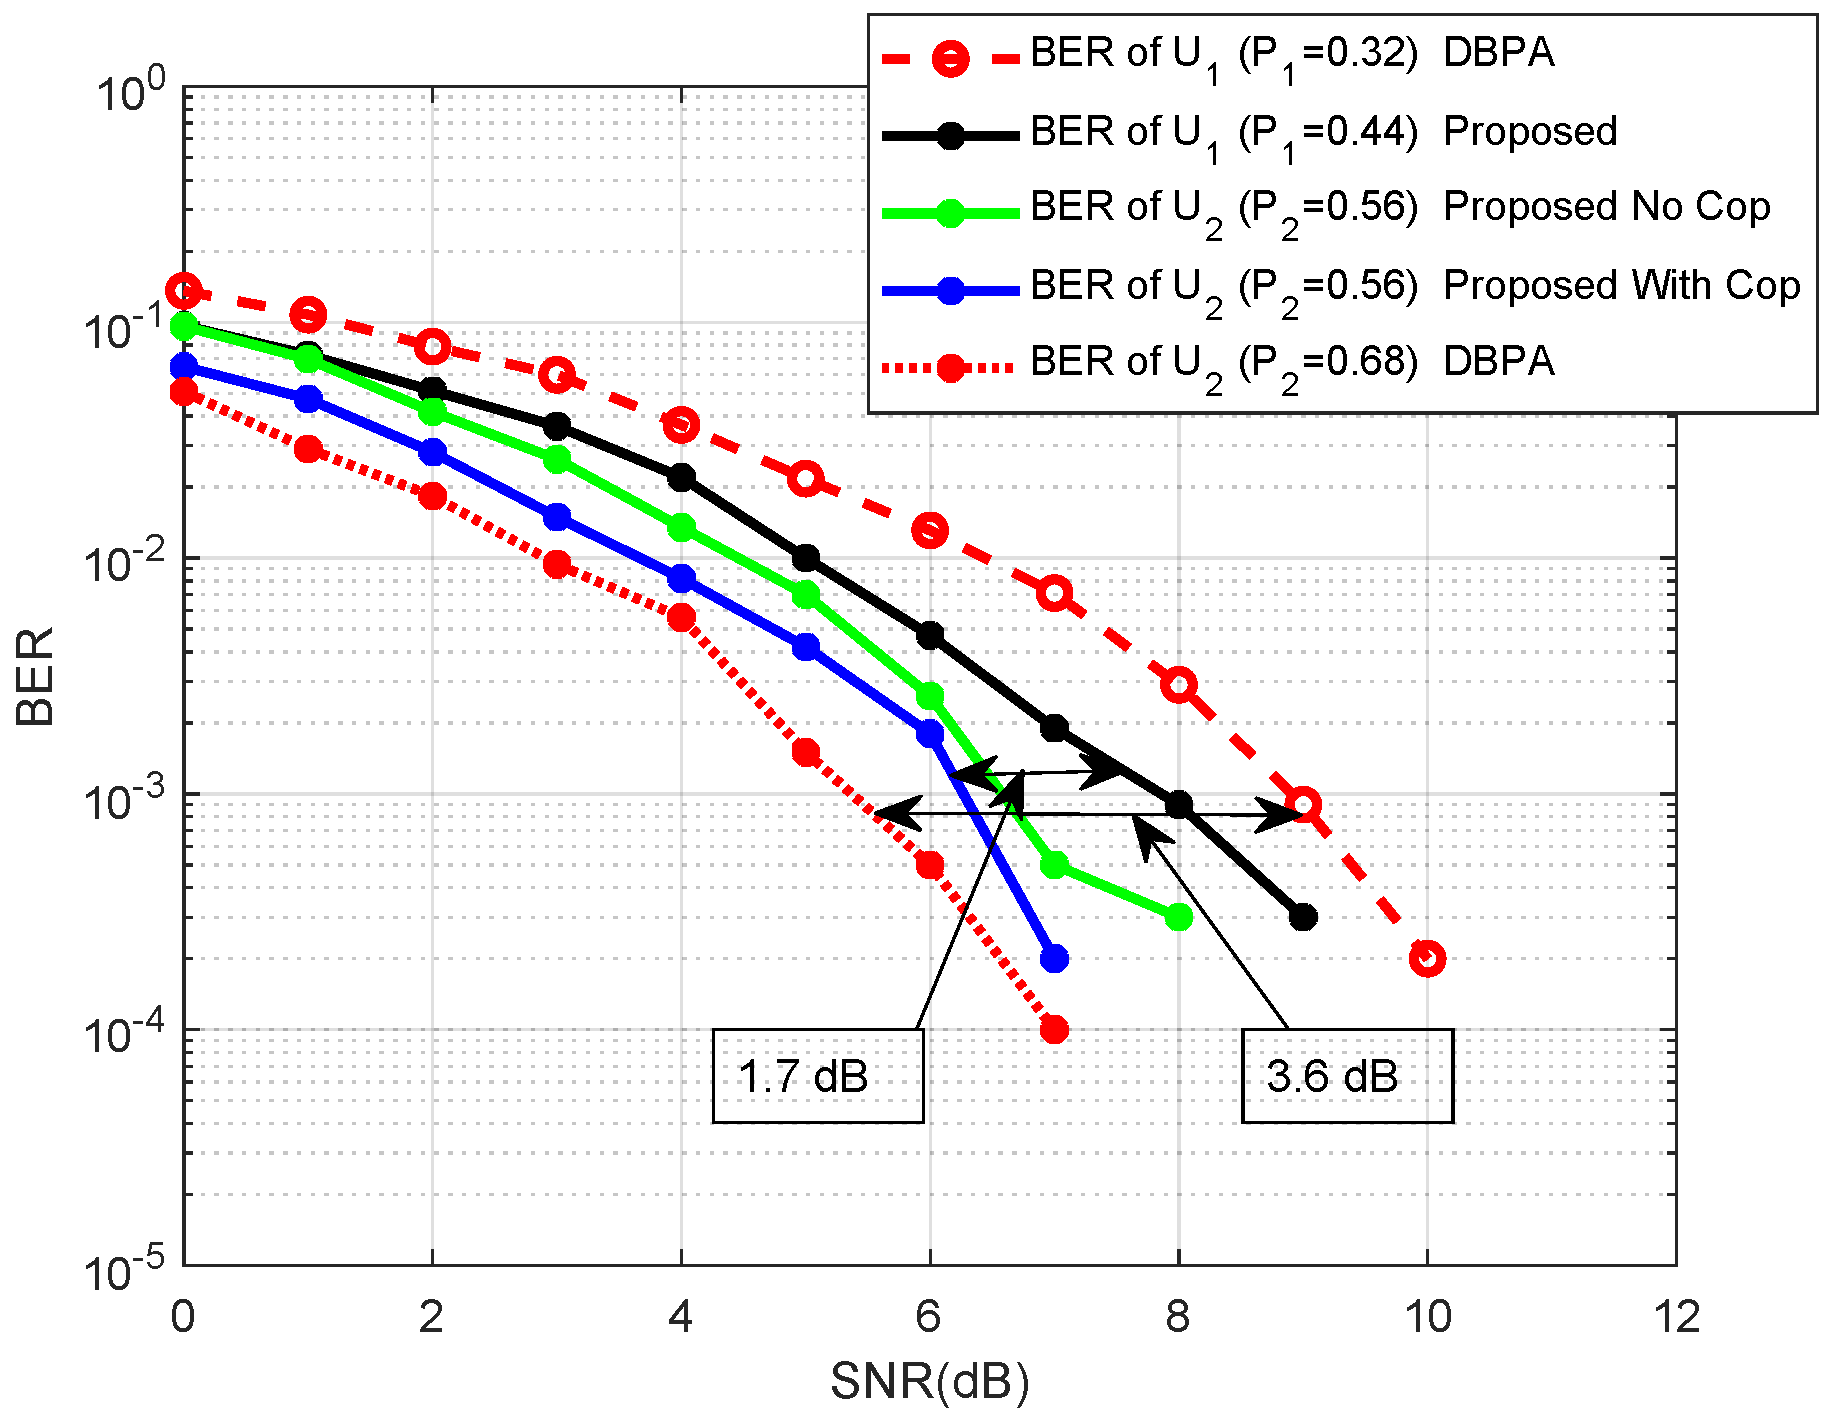
| UE | 40 m | 15 dB | 5 m | 0.32 | 0.44 | 9 dB | 8 dB |
| UE | 80 m | 10 dB | 10 m | 0.68 | 0.56 | 5.4 dB | 6.3 dB (with D&F), 6.6 dB (No D&F) |
| UE | 90 m | 15 dB | 25 m | – | 0.64 | – | 6 dB |
| UE | 110 m | 25 dB | 8 m | – | 0.36 | – | 8 dB (No D&F) |
Publisher’s Note: MDPI stays neutral with regard to jurisdictional claims in published maps and institutional affiliations. |
© 2022 by the authors. Licensee MDPI, Basel, Switzerland. This article is an open access article distributed under the terms and conditions of the Creative Commons Attribution (CC BY) license (https://creativecommons.org/licenses/by/4.0/).
Share and Cite
Mahmood, A.; Marey, M.; Nasralla, M.M.; Esmail, M.A.; Zeeshan, M. Optimal Power Allocation and Cooperative Relaying under Fuzzy Inference System (FIS) Based Downlink PD-NOMA. Electronics 2022, 11, 1338. https://doi.org/10.3390/electronics11091338
Mahmood A, Marey M, Nasralla MM, Esmail MA, Zeeshan M. Optimal Power Allocation and Cooperative Relaying under Fuzzy Inference System (FIS) Based Downlink PD-NOMA. Electronics. 2022; 11(9):1338. https://doi.org/10.3390/electronics11091338
Chicago/Turabian StyleMahmood, Asif, Mohamed Marey, Moustafa M. Nasralla, Maged A. Esmail, and Muhammad Zeeshan. 2022. "Optimal Power Allocation and Cooperative Relaying under Fuzzy Inference System (FIS) Based Downlink PD-NOMA" Electronics 11, no. 9: 1338. https://doi.org/10.3390/electronics11091338