Article

Vertiport Operations Modeling, Agent-Based Simulation and Parameter Value Specification

1
School of Engineering and Design, Technical University of Munich, Arcisstraße 21, 80333 München, Germany
2
Bauhaus Luftfahrt, Willy-Messerschmitt-Straße 1, 82024 Taufkirchen, Germany
*
Author to whom correspondence should be addressed.
Electronics 2022, 11(7), 1071; https://doi.org/10.3390/electronics11071071
Submission received: 24 February 2022 / Revised: 21 March 2022 / Accepted: 25 March 2022 / Published: 29 March 2022
(This article belongs to the Special Issue Urban Air Mobility)

Abstract

:
Urban air mobility (UAM) is the idea of creating a future mobility market through the introduction of a new mode of aerial transport with substantial travel time advantages. A key factor diminishing travel time savings is vertiport processes. So far, vertiport throughput capacity has only been studied in a static manner using analytical methods, which has been found to be insufficient. This paper wants to increase the level of understanding of operational dynamics on vertiport airfields by being the first to apply agent-based simulation. For this purpose, an existing vertiport model consisting of pads, gates and stands was refined through two means. First, a sensitivity study with over 100 simulations was executed shedding light on the driving processes on a vertiport airfield. Second, an expert interview series with 17 participants was conducted, letting the experts evaluate the model and specify relevant parameter values. Three main results should find mention here: (1) Pad operations were identified to be most impactful on passenger delays. (2) Pad and gate processes have a threshold capacity beyond which delays increase exponentially. (3) A refined vertiport model is presented, including the 27 most relevant parameters and their value specification. In conclusion, this paper finds that optimized vertiport airfield design is crucial to UAM operations, and dynamic passenger and vehicle interactions cannot be neglected.

1. Introduction and Literature Review

Urban air mobility (UAM) has received much attention in recent years, in both academia and the industry, with the potential of introducing a novel mode of transport into urban settings. The trend of urbanization in recent decades [1] has led to increased traffic problems and congestion, which in turn affects travel times, the environment and the overall quality of city life. UAM promises to be a fast [2] and clean [3] mode of transport. Some reports even indicate that UAM could alleviate congestion [4], while most estimations are more careful and do not expect a significant impact on the overall transportation network. A recent study even claims that the opposite could be true: when including access and egress trips to vertiports, the number of cars on the road might increase [5]. Market shares are conceivable to range between marginal significance [6] all the way up to 8% in the long haul [7]. Various market studies have tried to capture the global market potential [8,9,10,11,12,13] in the 2030s; estimates are located in tens of billions USD. This would be a relevant future mobility market, which has the potential to offer a variety of novel, intermodal services. For comprehensive and recent summaries of UAM topics, see publications by Niklaß et al. [14], Straubinger et al. [15] and Garrow et al. [16].
Should inner-city air travel become a reality, and if UAM becomes affordable to a relevant portion of the population, there could be fleets of thousands of aircraft in single metropolitan areas. This development would require highly performant infrastructure. UAM vehicles are envisioned to be fully or hybrid electric and have vertical take-off and landing (VTOL) capability (electric VTOL vehicles (eVTOLs). The infrastructure for eVTOLs, which is commonly referred to as vertiports, will need to cater throughputs in the magnitude of commercial airports [17] on the surface areas of large heliports [18]. Space in cities is costly [19], and airspace management will pose additional difficulties [20]. Vertiports will need to handle this highly constrained environment, which makes vertiport design and operations ambitious undertakings. Early modeling of the impact of UAM on cities and spatial structures was conducted by Straubinger [19]. She found out that the surface area demand of vertiports has a strong negative effect on the overall welfare of the population. Accordingly, designing vertiports with small footprints is an important goal.
Vertiports have been studied to some degree, but there are crucial gaps in the knowledge when it comes to proposed real-life operations. In 2019, the world’s first vertiport was built by Skyports for an exhibition in Singapore [21,22]. Yet, this and similar projects [23] are comparative in size to existing helipads [24] and so far only for exhibitory purposes. Vertiport layout design and current considerations are discussed in detail by Preis [25]. As there are no real-life vertiports operating as of today, there is also no experimental research at this point.
Some work has been conducted concerning the airspace management, looking at equipment to increase safety during landing for small airports [26], airport-specific weather forecasts [27] or dynamic airspace sectorization [28]. These are all valuable considerations on the path to enabling safe air traffic management in the dense airspace surrounding a vertiport. Yet, these studies do not look at VTOL, but rather conventional take-off and landing, and do not consider airfield operations. When looking at VTOL, ground-breaking research was conducted around vertiport capacity envelopes by Vascik et al. [29]. Further, Zelinski’s work on vertiport surface topologies [30] should find mention, as well as Schweiger et al. investigating the level of service a vertiport layout can deliver [31]. What remains is a gap in the current literature around operational dynamics on vertiports and, in particular, the vertiport airfield, which is the main focus of the presented work.
This paper wants to inform applied operations research in academia and start-ups in the industry who concern themselves with vertiport design; it aims to help develop both use cases and best urban mobility practices. Toward this goal, the fidelity of vertiport research will be raised from previous analytical approaches to an agent-based simulative approach. Next to the classical four-step approach of transport modeling (see for example Ref. [32]), agent-based modeling has become increasingly popular for transport simulation in recent decades [33] and has already been applied to simulating UAM [34]. Therefore, this simulation approach seems fitting. Simulation of vertiports goes beyond existing research and presents the highest possible level of fidelity, as real-life experiments are not an option at the moment, as discussed earlier. A high-fidelity vertiport airfield model will be presented throughout the paper, including a careful selection of relevant parameters and an informed determination of their values. The relevant information is drawn from the literature review and an expert interview series. The agent-based modeling and simulation (ABMS) framework in which the model is implemented was first published by Preis et al. [35] and has since been expanded.
The structure of the paper is as follows. In Section 2, the vertiport model will be briefly re-iterated, including all elements, agents and the assembled simulation environment. The refinement of the model through expert feedback will be highlighted. In Section 3, a sensitivity study of over 100 simulations will be presented with the aim of identifying driving operational processes. These processes encompass vehicle approach and departure, passenger boarding and de-boarding, number of pads and gates, initial fleet size of vehicles and the accumulated daily demand. In Section 4, all conceivable parameters are listed. The driving parameters are identified through expert interviews and insights from the sensitivity study. A final short list of parameters is presented, and each parameter value is determined according to values found in the literature and derived from expert interviews. Lastly, in the Appendix A, Appendix B, Appendix C, Appendix D and Appendix E, additional material on the vertiport model, the expert interview series conducted for this paper, the list of parameters and the statistical interpretation of the parameter values can be found.

2. Vertiport Model and Simulation Method

The vertiport model consists of elements, which are composed into a virtual environment and agents moving within this environment. There are three main elements (pads, gates and stands) and three additional elements (lanes, terminal and airspace). Two types of agents move within the environment: passengers and vehicles. Further, the controller plays a key role in coordinating all agents. In Appendix A, the characteristics of all elements and agents and how they are composed into the virtual environment will be described. Except for the terminal and the airspace, all other elements can only be occupied by one agent at a time. Both the early model and the implementation of the software code have been published before [35] and will, therefore, only be re-iterated briefly. Since the first publication, the model has been expanded and validated.

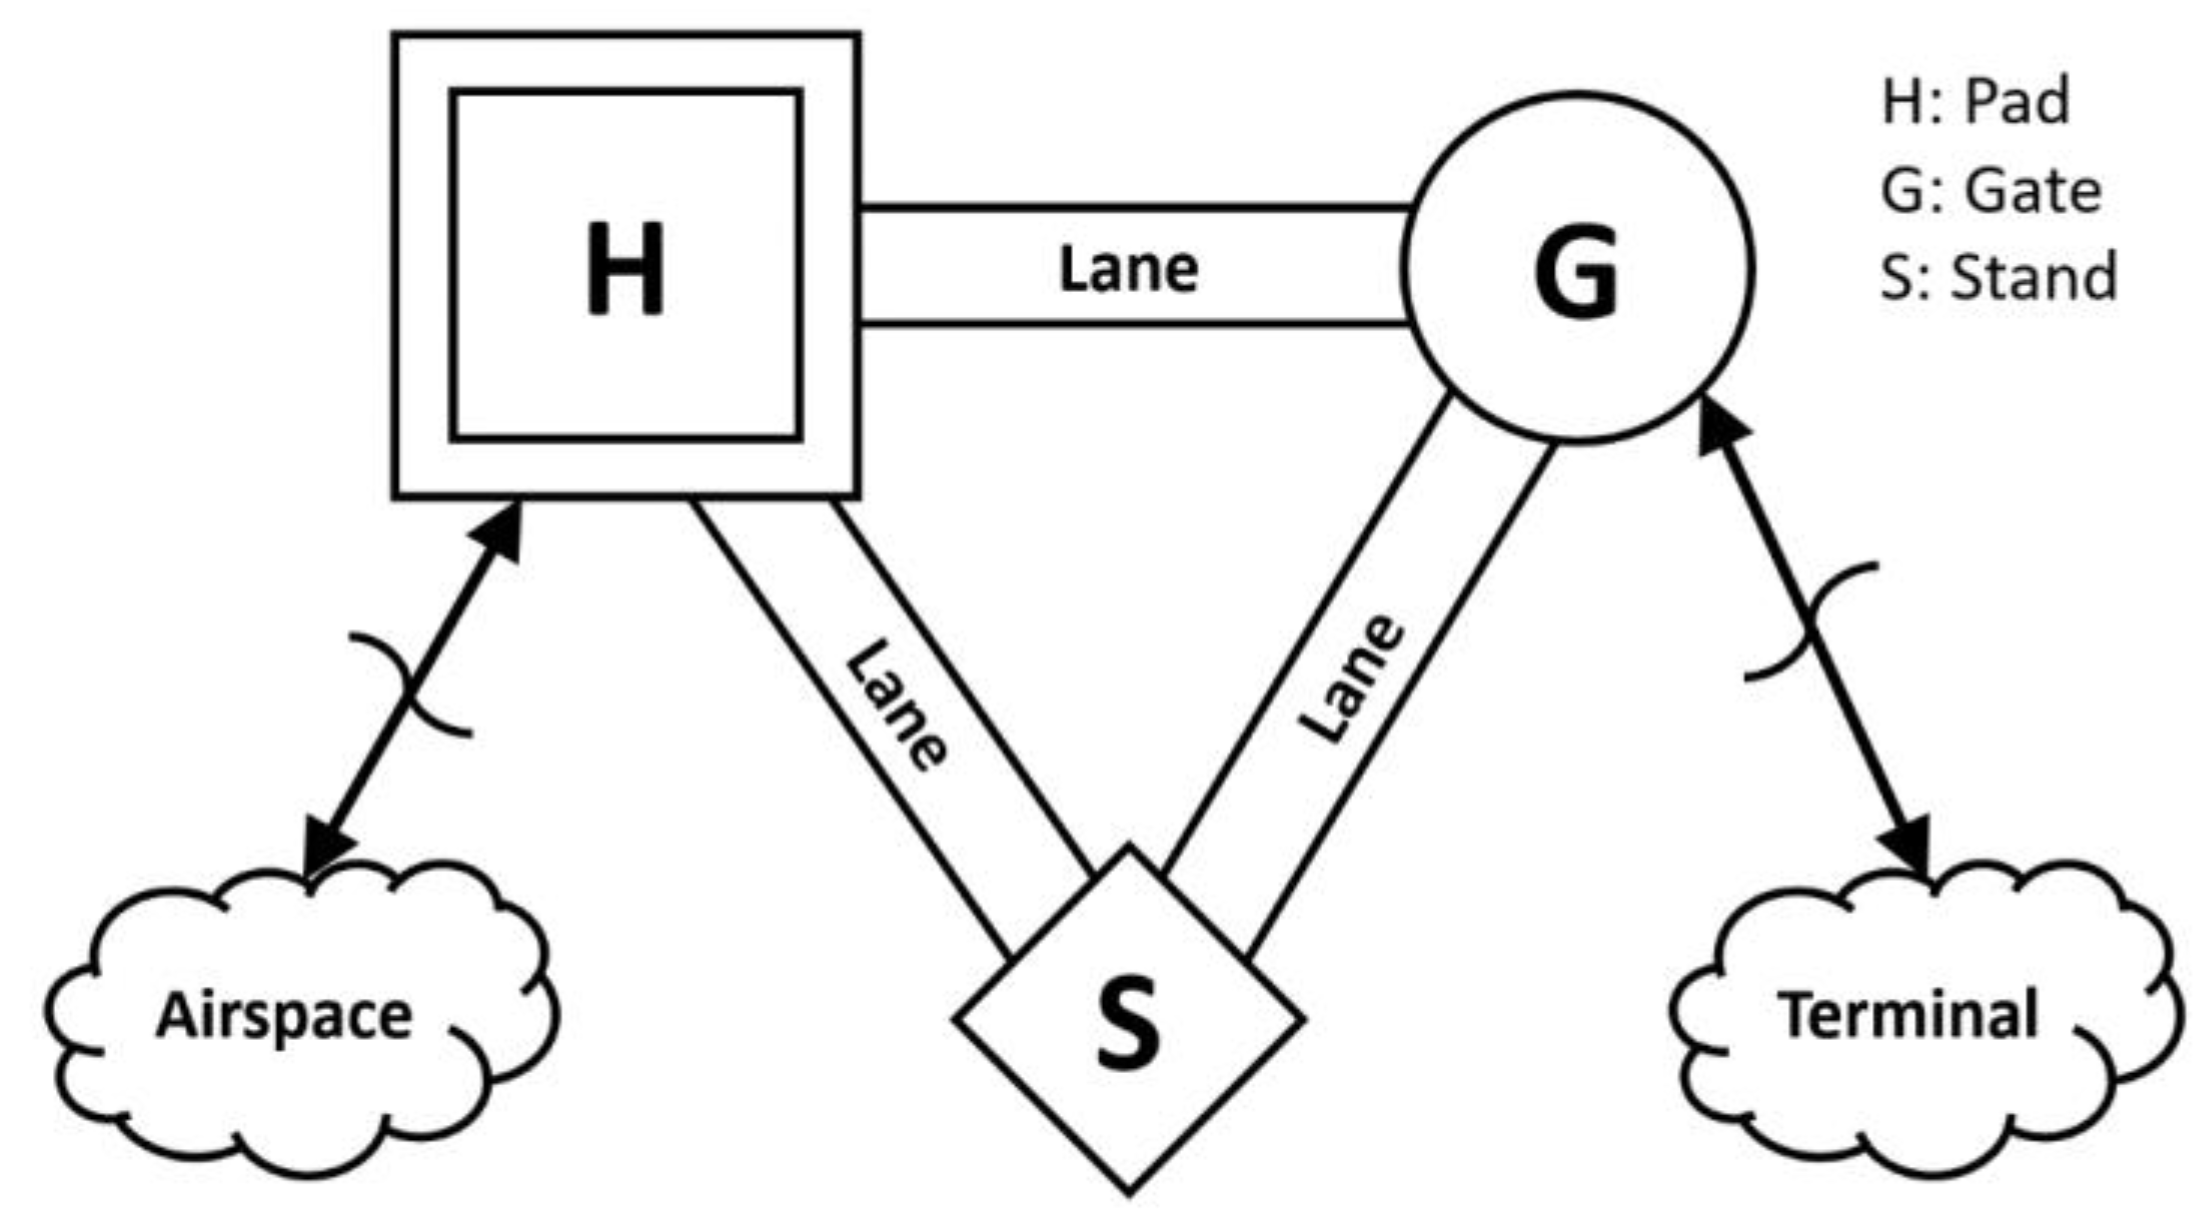
2.1. Vertiport Airfield Environment

In Figure 1, a schematic sketch of the environment can be seen. All pads, gates and stands are connected through lanes or taxiways and represent the airfield on the ground. The airspace is the system boundary on the side of the pads. Vehicles enter the environment through the airspace and need a certain approach time until they stand on a pad, which is differentiated into multiple steps. When vehicles take off from a pad, they need a certain time of departure while they are in the air before they leave the airspace and thus, the simulation boundary. The terminal is the system boundary on the side of the gates. Passengers arrive at the terminal, which can be imagined as a holding place near the gates, after processing (ticket scan, luggage drop-off, security screening). Passenger processing in the terminal is not considered in the environment, as will be explained in Section 2.2. Instead, passengers enter the environment at the point of arriving at the holding area. From the terminal, passengers walk toward a gate, enter the gate and start boarding a vehicle. After de-boarding a vehicle, passengers immediately walk toward the terminal and leave the simulation environment the moment they arrive at the terminal. Unused and empty vehicles are sent to a stand to clear space for other operations. Processes in the airspace and terminal were not part of the original model and were introduced for this paper. Further, a mechanism was introduced to prevent deadlock situations when the capacity limit of the vertiport is reached.

2.2. Vertiport Model Refinement

This model was presented to 17 experts, and three main points were criticized (the expert interview series will be explained in detail in Section 4.1). The points are listed below, and an explanation is given on how they will be accounted for:
  • Airspace operations. Several experts expected the main operational bottlenecks in the airspace. Additionally, sending eVTOLs into holding loops for extended times, which is done to prevent deadlocks, might not be possible. Currently, these questions are being addressed in cooperation with the German Aerospace Center (DLR) [36]. Bauhaus Luftfahrt (BHL) will focus on vertiport airfield operations. A well-defined interface between both models on the airside (DLR) and groundside (BHL) will allow a holistic view.
  • Passenger processing. Some experts criticized the choice to neglect passenger processing and, in particular, ticket scan, luggage drop-off and security screening, because these are essential and time consuming in today’s commercial aviation. First, these processes might and even must change dramatically in their duration to make UAM viable, wherefore they are not yet easily captured in an accurate model. Second, passenger processing has already been studied extensively for commercial airports [37], which allows adding empirical values to the results of the simulation during post-processing steps to account for pre-terminal passenger processing. The need for real-time simulation is not high. Lastly—and this answer comes from one of the experts on passenger boarding—passenger processing follows very different dynamics than vehicle taxiing. Both things may be difficult to harmonize into one unified environment and should rather be simulated independently.
  • Energy management. Other experts pointed out the need to include energy management in the model, in particular vehicle batteries, charging ports and an interface to the electric grid. As will be pointed out in Appendix A.1, this feedback was considered and included in the model. A detailed discussion of the model extension through an energy module will be presented in a separate publication to maintain a realistic scope of this paper. The parameter value determination of key energy-related parameters will still be considered in this paper, but the focus is on general vertiport airfield operations, unconstrained through energy limitations.
This section re-iterated the initial vertiport airfield model and highlighted early updates around the areas of the terminal and airspace. Two further aspects will now be considered to refine the model: first, the model improvements as desired from the 17 experts, which were discussed above. Second, a sensitivity study encompassing over 100 simulations, which will be described in the following Section 3. The goal is to identify the driving process and understand which parts of the model need further differentiation to capture all the relevant elements. Combining expert feedback and insights about the sensitivities will inform the refinement of the vertiport airfield model in Section 4.

3. Vertiport Operations Simulation Results and Identification of Driving Processes

With the updated vertiport model and the implementation in the ABMS simulation framework, which are described in Section 2, the first sensitivity study was undertaken. The goal is to understand the driving processes of vertiport operations, which will inform the following refinement of the model. In the course of the sensitivity study, over 100 simulations will be executed, distributed over six parameter variations. The following six processes or characteristics are expected to play a significant role and will be varied systematically:
  • Initial fleet size of vehicles parked on the vertiport at the start of simulation;
  • Accumulated demand over a day of operation;
  • Approach and departure time of vehicles;
  • Boarding and de-boarding time of passengers;
  • Number of pads;
  • Number of gates.

3.1. Definition of Simulation Sensitivity Study

The sensitivity study did not aim to look at realistic scenarios, but rather decouple the effects and variation of input parameters to understand the impact of individual processes. A 16 h day of operations was assumed. Demand profiles were randomly created from a normal distribution, with its peak in the middle of the operational time (see Figure 2). A normal distribution was chosen over a uniform distribution to understand the effects of peak and off-peak operations. Each distribution has the same accumulated number of vehicles arriving through the airspace and passengers arriving through the terminal, which leads to an identical number of parked vehicles at the start and end of each simulation. Asymmetric demand was judged to be an advanced question at the current stage and therefore not considered.
The baseline scenario is composed of 500 arrivals and requests, 20 vehicles of initial population and a vertiport layout with 4 pads, 12 gates and 20 stands. “Plans” is used as a term to describe both vehicle arrivals and passenger requests; there are, accordingly, a total of 1000 plans in the baseline scenario. Approach and departure times for vehicles are set to 60 s; walking time from the terminal to the gate and reverse for passengers is set to 20 s; boarding and de-boarding time is 120 s; and the speed of vehicle taxiing is 2.2 m/s. Five variations of the demand profiles (baseline profile shown in Figure 2, profiles B-E shown in Figure 3) were created in a Monte Carlo approach to account for stochastic effects. Next to the baseline scenario, 30 other sets of parameters were created with each 3–5 random samplings of the demand profile, resulting in a total of over 100 simulation scenarios (see Table 1). In the following, the average delay time per passenger over variations of parameters will be discussed.

3.2. Performance Indicator of Average Passenger Delay

The vertiport performance of any given simulation scenario in the sensitivity study will be expressed through a value, which is labeled “average (passenger) delay”. This value is defined as the involuntary or idle waiting time of n passengers, which is caused by non-optimal operations. In other words, the delay of passenger i is the difference between actual operations ti(actual operations) and optimal operations ti(optimal operations) (see Equation (1)). Delay can occur while a passenger is waiting in the terminal to have a vehicle assigned to them or while waiting at the gate when the assigned vehicle has not yet arrived at the gate. Delay can also occur while the passenger is sitting in the vehicle and the vehicle is forced to wait, both on the ground and in the air.
a v e r a g e   d e l a y = 1 n i n [ t i ( a c t u a l   o p e r a t i o n s ) t i ( o p t i m a l   o p e r a t i o n s ) ]
Throughout the sensitivity study, it will be observed that there are, generally speaking, two regions for each variation. First, there is a region of low average passenger delay (less than 5 min), where a variation of parameter has little impact. Second, there is a region of high passenger delay (more than 5 min), where variations of the parameter lead to an exponential increase in passenger delay. The first type of region will be considered “stable” operations, the second type of region will be considered “unstable” operations.

3.3. Simulation Results of Sensitivity Study

3.3.1. Fleet Size

The fleet size or initial population at the start of simulation is set to 20 vehicles in the baseline scenario. A quadratic fit approximates the data well (see Figure 4), showing an optimal spot around the center (16 vehicles) when half of the vertiport parking capacity is used initially (32 vehicles maximum capacity, 20 at stands and 12 at gates). Depending on the demand profile, the optimum shifts more toward an initially fuller vertiport (shift to the right) or an emptier vertiport (shift to the left). The explanation might be a temporal excess of requests or arrivals, respectively. Average delays of passengers vary between 0 and 5 min, showing that the initial population has very little impact on the delay.

3.3.2. Demand Magnitude

The accumulated demand of the baseline scenario consists of 500 vehicles arriving through the airspace with each one passenger on board and 500 passengers arriving through the terminal, resulting in 1000 passengers over the course of one day. For each demand magnitude from 750 to 1500 passengers, five random samples were created (see Figure 5). In particular, for an accumulated demand of 1200 passengers and more, the variation is strong, which suggests the interpretation that with increased demand, the system becomes unstable. Further, temporal peaks in demand probably affect the average delay of passengers more strongly than the accumulated demand over a day of operations. Average delays of passengers vary between 0 to 10 min. In summary, it can be said that the demand has a moderate impact on the delay, but the accumulated number of passengers is not a reliable indicator to predict passenger delay.

3.3.3. Approach/Departure and Boarding Times

The approach and departure time of the baseline scenario is each 60 s. An exponential fit approximates all three randomly sampled demand profiles nearly perfectly (see Figure 6). It can be seen that approach and departure times of up to 75 s have almost no impact on the average passenger delays. For more than 75 s, the average passenger delay then increases rapidly up to around half an hour for 120 s, which is twice the approach and departure time of the baseline scenario. Vertiports operate stably under a stretch of approach and departure times, but operations become unstable and delays increase rapidly once a threshold is crossed. Average delays of passengers vary between 0 and more than 30 min, which shows the major impact approach and departure times have on the delay.
The boarding and de-boarding time of the baseline scenario is each 2 min. An exponential fit approximates the results well (see Figure 7). Similarly to the approach and departure time, there is a long stretch of stable operations up until around 3.5 min. Afterward, the average passenger delays rise exponentially. The effect is not as strong as for the approach and departure time; at twice the boarding time of the baseline scenario of 4 min, the delays are still below 5 min. An interpretation can be that increased boarding time will lead to unstable operations and exponentially increasing delays, but the boarding time is not as critical as approach and departure time. Average delays of passengers vary between 0 and 20 min, showing a substantial impact on the delay.

3.3.4. Number of Pads and Gates

The number of pads is four for the baseline scenario. An exponential fit approximates the results nearly perfect (see Figure 8). Only discrete variations of the number of pads are possible, which limits the resolution along the x-axis. At three pads, the average passenger delay times have increased, but operations seem to be stable. At two pads, a tipping point in delays is seen, pointing to a highly critical relationship between stable vertiport operations, expressed in low average passenger delays, and a minimum number of pads. Average delays of passengers are below 5 min for three or more pads and are around 45 min for two pads. From the observed factors, the number of pads has the strongest impact on the delay.
The number of gates is 12 for the baseline scenario. An exponential fit approximates the results for individual demand profiles nearly perfectly (see Figure 9). This concludes that the particular demand profile has an effect on how efficiently the number of gates operate. For 10 or more gates, operations are stable; between 8 and 9 gates, average passenger delays start increasing and then rise exponentially for lower numbers of gates. Similarly to the number of pads, the number of gates shows a region of low delays and then experiences an exponential increase after a threshold toward a region of unstable operations. Average delays of passengers are below 2 min for 10 or more gates and increase to over 20 min for as few as 6 gates. The number of gates has a substantial impact on passenger delay.

3.4. Summary of Driving Processes in Vertiport Operations

Vertiport operations are highly sensitive to a variation in the presented driving parameters, typically showing a region of stable operations with low average passenger delays and an unstable region with exponential increase in delays. The initial fleet size at the start of a simulation has an optimal point at half capacity (half of all stands and gates are occupied by available vehicles) of the vertiport and has very little impact on the average passenger delay. The accumulated demand over a day results in scattered results, suggesting that temporal peaks in demand have a larger impact than the overall demand. This finding suggests that vertiports need to be designed toward a peak hour, not toward accumulated demand.
Both processing times and vertiport sizes show exponential growth in average passenger delays after crossing a certain threshold. Vehicle approach and departure time and the number of pads appear to be more sensitive than passenger boarding and de-boarding time and the number of gates. The central focus in designing vertiports should therefore be placed on optimal placement and handling of pads. Selecting the ratio between the number of pads and the number of gates, also accounting for the processing times, is also critical to plan an efficient vertiport layout. Once a vertiport layout is planned, it can handle a certain amount of demand, but not much more; due to the tipping point characteristic, it will quickly enter unstable operations, and average passenger delays will increase exponentially.
In this section, the previously published software implementation of the ABMS [35] was applied. Over 100 simulations were executed to understand the sensitivities of vertiport airfield operations. The focus of the initial publication lay on the software architecture, whereas this paper focuses on the application of the framework to generate new insights.

4. Discussion of Vertiport Parameters and Values

In this section, the list of parameters that are incorporated in the refined vertiport model are introduced, including the evolution of the list and the current short list of most relevant parameters. The model was refined based on the responses of experts presented in Section 2.2 and the insights from the simulation sensitivity study presented in Section 3.4. Initially, a list of parameters was formulated with a total of 82 entries assembled into 10 groups. Through expert interviews and literature review, the list was expanded and individual parameters were differentiated or aggregated where necessary, resulting in a full list of 95 parameters. Irrelevant parameters were dropped to form a long list of 55 parameters, and from these, the most relevant 27 parameters were chosen and assembled into 5 new groups. The full list of parameters can be seen in Appendix C and the short list of parameters in Appendix D. In the following sections, the expert interviews and selection process will be discussed in further detail.

4.1. Expert Interview Approach

As UAM, in its proposed magnitude, is a novel field of transportation, the scope and confidence of parameters for vertiport ground operations are strongly limited in current literature, wherefore expert interviews were chosen as a method for gathering data. The interviews followed a semi-structured approach with a list of questions related to UAM, the vertiport model and vertiport parameters. Each interview lasted 30–60 min and was conducted through video calls. Experts were selected according to their expertise and experience; each expert was interviewed in person and filled out a questionnaire about specific parameter values after the interview. The questions of the interview questionnaire can be found in Appendix B. The interview series took place between October 2020 and July 2021. All responses are anonymized for protection of privacy and confidentiality of the answers. For this reason, only the aggregated values can be shown in this paper.
In total, 17 experts took part in the interview series with backgrounds in research, the aviation industry, aircraft operations and architecture. The experts were from the USA, Great Britain and Germany and had an average experience in their field of 10.6 years (median experience 7 years). A total of 19 qualitative remarks toward the vertiport model were given, which are incorporated in Section 2.2. Forty-nine qualitative responses concerning the definition of parameters were gathered during the interviews. This information was incorporated in the refinement process of the parameter list presented in the following section.

4.2. Identification of Relevant Parameters

For the vertiport model, a total of 97 parameters in 10 groups were considered, out of which a short list of the most relevant parameters was formed, including 27 entries separated into 5 groups. There were four stages of the parameter list: the initial list (82 entries), the expanded full list (97 entries), the refined long list (57 entries) and the selective short list (27 entries). The responses from the expert interviews helped to expand the initial list toward the full list through adding new parameters or differentiating existing parameters. Further, the expert responses aided in forming the long list by aggregating multiple parameters into single parameters and dropping irrelevant parameters. The short list (see Section 4.3) was finally formed by looking at the expected driving processes (discussed in Section 3.4) on a vertiport and reducing the list of parameters to account for the most relevant aspects.
In Table 2, the initial 10 groups of parameters are shown and the number of parameters from the initial list, the full list, the long list and the short list.

4.3. Final Short List of Parameters

A short list of 27 parameters, which capture the most relevant processes in a vertiport, is shown in Appendix D. The IDs are coherent over the evolution of the parameter list (see all parameters considered in Appendix C). The short list of parameters is separated into five new groups and given a new index:
  • Vertiport elements (no index)
  • Flight approach and departure (indices A and D)
  • Passenger boarding and de-boarding (index B)
  • Energy management (index E)
  • Vehicle taxiing (index T)
Group vertiport elements was shown to be impactful in Section 3.3.4, where the number of pads and gates in a vertiport layout impacted the average passenger delay significantly. Groups boarding and approach and departure were both highlighted by the experts in Section 2.2 and shown to be relevant for vertiport operations in Section 3.3.3. Group energy was also highlighted by the experts in Section 2.2. Lastly, group taxiing was added due to the potential impact of different taxiing concepts, which have not yet been studied in depth.
All groups that have operational character (all except for vertiport elements) will be considered in the parameter value determination in Section 4.4. For group vertiport elements (which includes the dimensions of pads, gates, stands and taxiways), the values can be extracted with good confidence from existing heliport standards (see heliport manuals by FAA [38] or ICAO [18]). In addition, this group does not have any operational character in the same sense as the other four groups, but rather determines the possible vertiport layouts, which have to be designed prior to simulating a day of operations. Parameter groups boarding, taxiing, approach and departure and energy will be explained in the following and are visualized in Figure 10.

4.3.1. Flight Approach and Departure

Parameter group approach and departure starts with a vehicle being in the controlled airspace of the vertiport and starting final approach. It enters the physical airspace above the pad (A1), transitions into a final hover over the center of the pad (A2), touches the ground and shuts down the engines (A3), if the taxi mode is other than hover taxi. The pad needs a time to “cool down” after an operation (A4) to account for wake vortices and separation minima between vehicles. In reverse order, the vehicle starts its engines (D1), unless the taxi mode is hover taxi, lifts off and hovers (D2), and transitions into forward flight leaving the physical airspace of the pad (D3). Analog to the approach process, the pad needs a “cool-down” time (D4) before the next operation can be initiated.

4.3.2. Passenger Boarding and De-Boarding

Parameter group boarding starts with a passenger arriving or waiting at the holding place in the terminal. Once a vehicle is assigned, the passenger walks toward the gate (B1) and enters the gate (B2), which can be imagined as stepping through a door into the immediate proximity of a vehicle, in order to step into the vehicle and board it (B3). In reverse order, the passenger de-boards the vehicle (B4), leaves the proximity of the vehicle, steps through the gate door (B5) and subsequently walks toward the holding place in the terminal (B6) to exit the simulation.

4.3.3. Energy Management

Parameter group energy contains parameters for both charging or swapping vehicle batteries. As in the case of swapping, the batteries still need to be charged. Charging is essential for both types; for battery swapping, the charging process occurs remotely. The battery swapping time (E4) is aggregated into one parameter encompassing the entire swapping procedure. The battery has a certain capacity (E2), which corresponds to the usable capacity, not the full physical capacity of the battery. Therefore, a depth of discharge reserve needs to be subtracted beforehand. The batteries can be charged with a certain charging speed or charging power (E3), which is assumed constant as a first approximation. During the charging process, some energy is lost due to inefficiencies in the charging process. The losses are given as relative losses to the overall processed energy (E1).

4.3.4. Vehicle Taxiing

Parameter group taxiing encompasses three modes of taxiing: “hover” taxi, “passive” taxi and “active” taxi. The “passive” taxi mode facilitates a taxiing device, which is first mounted to the vehicle (T1), then the device moves over the airfield (T2), and at the destination, the device is de-mounted (T3). It could be pushing, pulling or carrying the vehicle, performed by a movable platform, through ropes or a bot, respectively. The “active” taxi mode facilitates auxiliary electrical motors at the wheels of the vehicles (skids are not possible in this scenario) through which the vehicle can taxi (T4) without using the main engines or an external device. The “hover” taxi mode facilitates the main engines to hover near the surface (eVTOLs with skids) or touch the ground and roll (eVTOLs with wheels) (T6). If the engines are off at the start of taxiing or have to be off after taxiing, the engines are started (T5) or stopped (T7), respectively.

4.4. Parameter Value Determination

After selecting and defining the essential parameters for the vertiport model in the previous sections, the parameter values are now going to be determined. As no vertiports in the envisioned dimension are operating at the time of writing, no direct experimental data are available. Some parameter values can be borrowed from similar applications, for example, the parameter values in group elements can be determined according to existing heliport guidelines [38]. Yet, for most parameters, value determination poses a substantial challenge. In order to attempt an initial value determination of the presented vertiport model and its parameters, two sources will be included in the following: parameter values determination from other authors’ statements captured in the literature and the estimations given by the experts during the interviews presented in Section 4.1.
From the literature review, a total of 135 datapoints were identified of which a subset of 47 parameter values is included in this paper. The other datapoints were either values in an aggregated form, had differently defined parameter boundaries or corresponded to parameters, which are not included in the final short list of parameters (see Section 4.2 for the selection of parameters). The experts answered a total of 186 datapoints, of which 77 correspond to one are another parameter of the final short list.
In Table 3, the value specification of all parameters identified as crucial for the vertiport model are shown (please find the definition of all parameters in the final short list in Appendix D). In Appendix E, a more detailed discussion of the statistical aggregation and confidence of value determination is presented.

5. Conclusions and Future Work

Urban air mobility promises to enrich the current transportation system with a new and fast mode of transport. Advances in the required infrastructure, in particular, vertiports, are necessary to realize the promises UAM offers. As of today, no vertiports are operating, and experimental data are, except for related research on heliports, non-existent. Through expert interviews and agent-based simulation, this paper attempted to raise the fidelity of vertiport operations modeling to a higher level.
A vertiport model, consisting of pads, gates and stands, was introduced. The model was implemented in an ABMS framework, with passengers and vehicles as agents. Experts were asked to evaluate the model and recommend refinements. Their answers on airspace operations, passenger boarding and energy management were discussed. Next, a simulation sensitivity study was conducted, showing that vertiports have a region of stable operations and a threshold beyond which operations become unstable, causing passenger delays to increase exponentially. In particular, the number of pads and length of approach and departure time of vehicles were identified as design drivers. This study further guided the focus of model refinement. Lastly, through expert interviews (n = 17) and results from the sensitivity study, the early model (initially presented by Preis et al. [35]) was refined, and 27 driving parameters were identified. These parameters were grouped into vertiport elements, vehicle approach and departure, passenger boarding and de-boarding, energy management and vehicle taxiing. Through the literature review and expert estimations, the parameter values were specified.
The work of this paper can aid the wider scope of research in at least three ways. First, the updated vertiport model (Section 2) may be used as a reference for general research around infrastructure for UAM. Second, the results of the sensitivity study (Section 3.4) give valuable insights into the design drivers for vertiport operations and will be helpful when planning vertiport layout and operations in highly constrained urban environments. Third, the list of parameters (Section 4.3 and Appendix D) and, in particular, the specified parameter values (Section 4.4) can be used in part or as a whole for studies in the area of UAM. There is not much consensus in the UAM community on the parameter values, which makes this specification especially valuable. A further strength is the combined approach of literature review and expert estimations.
In the future, the ABMS framework will be used to further investigate the effects on vertiports, in particular the questions of taxiing modes, energy sources and charging vs. swapping of batteries. An ongoing refinement of the parameter values will also be performed as new research is conducted throughout the community. Lastly, a stochastic extension to the vertiport model is planned to account for variations, in particular, between passengers in real life.

Author Contributions

Conceptualization, L.P. and M.H.; Methodology, L.P.; Software, L.P.; Resources, M.H.; Data Curation, L.P.; Writing—Original Draft Preparation, L.P.; Writing—Review and Editing, L.P. and M.H.; Visualization, L.P.; Supervision, M.H. All authors have read and agreed to the published version of the manuscript.

Funding

This research received no external funding.

Informed Consent Statement

Informed consent was obtained from all subjects involved in the study. Written informed consent has been obtained from the interviewees from the expert interview series to publish this paper.

Conflicts of Interest

The authors declare no conflict of interest.

Abbreviations

UAMUrban Air Mobility
eVTOLsElectric Vertical Take-Off and Landing Vehicles
VTOLVertical Take-Off and Landing
ABMSAgent-Based Modeling and Simulation

Appendix A. Vertiport Model Elements and Agents

Appendix A.1. Elements of Vertiport Airfield

Pads are physical areas for take-off and landing of eVTOLs. They present the interface between ground and air operations and are connected through lanes with the rest of the vertiport airfield. Before landing or after take-off, pads have a so called “cool-down” time before the next operation can take place to account for separation minima due to wake vortices and safety buffers.
Gates are both a physical area where vehicles park during turnaround, as well as interfaces to the terminal to allow for boarding and de-boarding of passengers. One vehicle and multiple passengers can be at the gate at the same time. Charging eVTOLs can be possible at gates but is not mandatory. Small inspection or maintenance tasks can be accounted for through a fixed turnaround time. Gates are connected through lanes with the rest of the vertiport airfield.
Stands are physical areas for parking vehicles during low demand and for charging and/or swapping of batteries. At stands, larger maintenance tasks can be performed, which are modeled through a state “busy”, which can be interrupted upon request. Stands are connected through lanes with the rest of the vertiport airfield.
Figure A1. Main vertiport elements: pad, gates and stand.
Electronics 11 01071 g0a1
Lanes are non-physical or physical connections between pads, gates and stands. There are two capabilities included in the model. First, an open airfield with no distinct areas for lanes. All the main elements are connected with all the other main elements of a different type through beeline connections. Physical collision of agents, which might occur on intersecting lanes, is not accounted for. Second, a defined taxiway layout, where taxi nodes are included to create a network of lanes. Lanes are aggregated into taxiways, and each taxi-way can only be occupied by one vehicle at a time. Beyond vehicles taxiing on the lanes, it is also conceivable that there will be no vehicle movement on the ground, but rather passengers walking from the gate to the pad for boarding. In this case, passenger lanes are defined.
Figure A2. Layout variations implemented in the ABMS framework: defined and open.
Electronics 11 01071 g0a2
The terminal is a non-physical space and can be imagined as a holding area inside the vertiport facility near the gate. Here, passengers enter the simulation environment and stay while they are waiting for a vehicle. Once a vehicle is assigned, passengers need a short time to walk toward the gate. Passenger processing (ticket scan, luggage drop-off, security screening) is not considered, but the terminal is implemented in a way to be expandable into separate physical areas. The terminal can hold an unlimited number of passengers and has a direct, equally long connection to each gate.
The airspace is a non-physical space representing the physical airspace surrounding the vertiport. Vehicles arrive in the airspace and start approaching a pad, if available, or are forced into a holding state in the airspace. The airspace can hold an unlimited number of vehicles. The airspace is connected to all pads with the same distance but can be differentiated into airspace segments (e.g., representing different directions from which vehicles arrive), and pads can be connected to only one or some of these airspace segments. When a vehicle approaches a pad or departs from a pad into the airspace, the pad is occupied for the entire process, even before the vehicle would physically occupy the pad, to account for separation minima. Included in the approach or departure operation is a distinct cool-down time before the pad is available for the next operation.

Appendix A.2. Agents in Vertiport Simulation

Passengers arrive either by foot through the terminal to request a vehicle or on board of a vehicle arriving through the airspace to be dropped off at a gate. When arriving at a vertiport by foot, passengers enter the terminal and either wait in this holding area or walk toward the gate, where their assigned vehicle is located. When departing the vertiport, they walk from the gate to the terminal after de-boarding the vehicle. When they reach the terminal, they leave the simulation environment. Passengers have a walking speed and/or need distinct amounts of time to walk between the terminal and the gates, enter and exit the gates and board or de-board a vehicle.
Vehicles are either stationed at the vertiport at the start of the operations or arrive at the vertiport through the airspace. If they find an available pad, they start the approach; if not, they are forced into a holding loop in the air. An approach consists of entering the physical pad airspace, a final hover, touch-down and a cool-down time. Depending on the mode of taxiing (hovering, using supplemental motors at wheels, being pulled by taxiing bot) the engines are potentially stopped. The departure process contains the same steps in reverse order. Vehicles either taxi to an available stand to be parked or to a gate to drop off passengers. Either way, the pad must be left immediately, and mechanisms are implemented to assure at least one free stand or gate. Vehicles carry batteries, which can either be swapped or charged at stands or potentially gates. The batteries have a capacity, charging speed and charging inefficiencies. The model currently only allows for single-seater vehicles. Vehicles with multiple seats increase the operational complexity substantially. Questions arise such as pooling passengers, energy constraints, varying passenger destinations and other factors that need to be considered. All these lie outside the system boundaries of the model’s environment.
The controller is representative of an all-knowing air traffic controller who has perfect knowledge of all passenger and vehicle states and locations. They work through all requests, assigning vehicles to arriving passengers, and through all arrivals, assigning destinations to both passengers and vehicles. The controller becomes aware of a vehicle arriving in the airspace and a passenger arriving at the terminal at the moment of arrival with no prior notification. Therefore, the controller reacts to the given situation and cannot plan ahead. Next to processing all new vehicle arrivals and passenger requests, the controller monitors all waiting agents and serves them according to the first-in-first-out principle.

Appendix B. Expert Interview Questionnaire

In the following, an excerpt of questions is shown from the expert interview series conducted for the purpose of refining the vertiport model and determining the parameter values. The experts received an interview guide including the questions ahead of time. Not all questions were answered every time, accounting for the individual backgrounds of the experts and their partial inability to pass on information due to confidentiality reasons. The expert interview series was conducted between October 2020 and July 2021 and encompassed 17 experts with divers backgrounds.
P3Q1: Within the current model, what would you assume to be the critical path or design driver?
P3Q2: Which elements or processes are you missing?
P3Q3: For which processes would you see the greatest optimization potential?
P3Q4: Where do you anticipate the biggest operational safety threats?
P4Q1: What is your estimated value for each of the parameters below? What would be a minimal value? A maximal value? How sure are you (1 = very sure, 2 = sure enough, 3 = educated guess)?
P4Q2: Which parameters of the above list would you define as most important?
P4Q3: What other parameters would you find interesting or critical?

Appendix C. Parameter List Evolution

In the following, the evolution of the parameter list, which is discussed in Section 4 is visualized in detail. The colors correspond to the individual lists (gray: full list, blue: long list, green: short list). The font corresponds to the evolution of the parameters. Regular font means the parameter was present in the initial list. Crossed-out font means the parameter was aggregated with other parameters into a supra-parameter or differentiated into multiple sub-parameters. Red font means the parameters were added later on and were not part of the initial list.
Figure A3. Evolution of parameter list.
Electronics 11 01071 g0a3aElectronics 11 01071 g0a3b

Appendix D. Parameter Short List

In the following table, the essential parameters for vertiport operations are described. The “initial ID” corresponds to the IDs used throughout the evolution of the parameter list (see Appendix C). The “new group” and “new ID” correspond to the group definition in Section 4.3. All parameters have a descriptive title, and all time-based parameters are additionally described in terms of their initial and final state.
Table A1. Parameter definition of final short list.
Initial IDNew GroupNew IDParameterTime StartsTime Ends
A1Elements-Dimensions of pad--
A3Elements-Dimensions of gate--
A5Elements-Dimensions of stand--
A7Elements-Dimensions of taxiway--
B11BoardingB1Terminal to gatePassenger starts walking from waiting area in the terminalPassenger arrives at door connecting the terminal and the airfield
B12BoardingB6Gate to terminalPassenger starts walking from door connecting the airfield and the terminalPassenger arrives at waiting area in the terminal
C6BoardingB2Enter gatePassenger steps through the door between terminal and airfieldPassenger arrives at immediate proximity of the vehicle
C5BoardingB5Leave gatePassenger starts walking away from the vehiclePassenger steps through door, leaving the airfield, and enters the terminal
C1BoardingB3BoardingPassenger steps into the vehiclePassenger is buckled up and ready for takeoff
C4BoardingB4De-boardingPassenger unbuckles and begins to gather belongingsPassenger exits the vehicle and steps onto the ground
D5TaxiingT1Mounting passive taxiing deviceVehicle is stationary at mount location, and passive taxiing device is ready to be mountedPassive taxiing device is mounted to vehicle
D4TaxiingT2Passive taxiing--
D7TaxiingT3De-mounting passive taxiing deviceVehicle is stationary at mount location, and passive taxiing device is ready to be de-mountedPassive taxiing device is de-mounted from vehicle
D8TaxiingT4Active taxiing--
D2TaxiingT6Hover taxiing--
F4Approach and DepartureA1Enter airspaceVehicle is in final approach and about to enter physical airspace of the padVehicle finishes descent or forward movement
F2Approach and DepartureA2Final hoverVehicle stopped descent or forward movementVehicle wheels or skids touch the ground
E2Approach and Departure/TaxiingT7/A3Stop engineEngine power is on idleEngine is off
F11Approach and DepartureA4Cool-down (landing)Vehicle taxied off the padNext operation can be initiated: entering physical airspace of the pad during approach or taxiing onto pad from the airfield
E1Approach and Departure/TaxiingT5/D1Start engineEngine is offEngine is ready for takeoff or taxiing
F1Approach and DepartureD2Initial hoverVehicle wheels or skids stop touching the groundVehicle begins ascent or forward movement
F3Approach and DepartureD3Leave airspaceVehicle begins ascent or forward movementVehicle exits physical airspace above the pad
F12Approach and DepartureD4Cool-down (take-off)Vehicle left the physical airspace of the padNext operation can be initiated: entering physical airspace of the pad during approach or taxiing onto pad from the airfield
G10EnergyE1Energy loss--
G5EnergyE2Battery capacity--
G3EnergyE3Charging speed--
H9EnergyE4Swapping timeVehicle rests at swapping facility ready for swapping, old battery pack on boardVehicle is ready to leave swapping facility, new battery pack on board

Appendix E. Notes on Confidence of Parameter Value Determination

In the following, the statistical considerations during the determination of the parameter values are presented, including an interpretation of the confidence of the determination. In the table below, all parameters (index i ) of the short list (see Appendix D for the definition of the parameters) are presented, including the number of datapoints from expert interviews and the literature. Both groups, expert responses v e x p i and the literature v l i t i , are treated separate at first: the median v m e d i and average v a v g i values of both groups are calculated individually. For the literature group, both median v l i t , m e d i and average v l i t , a v g i values for each parameter are unweighted. For the expert group, the median values v e x p , m e d i are unweighted, and the average values v e x p , a v g i are weighted according to the confidence levels the experts gave during the interviews (see Appendix B). As a measure of agreement between values from experts and the literature, the variance Δ v i between the two groups is defined according to Equation (A1). The variance is calculated for the median Δ v m e d i and average Δ v a v g i values. The values are then calculated separately for median v c a l , m e d i and average v c a l , a v g i according to Equation (A2). The value whose absolute variance | Δ v i | is smaller is then chosen to be the final value v i .
Δ v i = v e x p i v l i t i v l i t i
v c a l i = v l i t i + v e x p i 2
To find a further measure of agreement, this time, between all values, the concept of a normal distribution is applied, which is defined through its expected value μ and its standard deviation σ . μ is defined to be the final value v i and σ is calculated according to Equation (A3), with n i being the number of datapoints for parameter i and v k i denotes an individual datapoint. Analysis of a normal distribution shows that about two-thirds of all values lie with ± 1 σ of the expected value.
σ 2 = 1 n i n = 1 k ( v k i μ ) 2
Three criteria of confidence are defined to determine the overall confidence of the value determination for each parameter. If all three criteria are met, the confidence is considered high. If two criteria are met, the confidence is considered medium. If one ore no criteria are met, the confidence is considered low. The definition of the criteria is as follows:
  • The parameter i has five or more total datapoints.
  • The absolute variance | Δ v i | of both median and average is below a value of 0.5.
  • The quotient of two times the standard deviation and the expected value 2 * σ μ is below a value of 1.0.
Figure A4. Statistical analysis of parameter value specification and confidence.
Electronics 11 01071 g0a4

References

  1. European Commission. Atlas of the Human Planet 2019: JRC Science for Policy Report; European Commission: Brussels, Belgium, 2019. [Google Scholar]
  2. Rothfeld, R.; Fu, M.; Balać, M.; Antoniou, C. Potential Urban Air Mobility Travel Time Savings: An Exploratory Analysis of Munich, Paris, and San Francisco. Sustainability 2021, 13, 2217. [Google Scholar] [CrossRef]
  3. Pukhova, A. Environmental Evaluation of Urban Air Mobility Operation. Master’s Thesis, Technical University of Munich (TUM), Munich, Germany, 2018. [Google Scholar]
  4. Werner, M.; Duwe, D.; Busch, C. Zukunftsstudie E-Fliegen: Vorbereitende Kurzstudie zum Aufbau Eines Testfelds für Energieeffizientes, Elektrisches und Autonomes Fliegen in Baden-Württemberg; Fraunhofer IAO: Stuttgart, Germany, 2019. [Google Scholar]
  5. Pukhova, A.; Llorca, C.; Moreno, A.; Staves, C.; Zhang, Q.; Moeckel, R. Flying taxis revived: Can Urban air mobility reduce road congestion? J. Urban Mobil. 2021, 1, 100002. [Google Scholar] [CrossRef]
  6. Ploetner, K.O.; Al Haddad, C.; Antoniou, C.; Frank, F.; Fu, M.; Kabel, S.; Llorca, C.; Moeckel, R.; Moreno, A.T.; Pukhova, A.; et al. Long-term application potential of urban air mobility complementing public transport: An upper Bavaria example. CEAS Aeronaut. J. 2020, 11, 991–1007. [Google Scholar] [CrossRef] [PubMed]
  7. Mayakonda, M.; Justin, C.Y.; Anand, A.; Weit, C.J.; Wen, J.; Zaidi, T.; Mavris, D. A Top-Down Methodology for Global Urban Air Mobility Demand Estimation. In Proceedings of the AIAA Aviation 2020 Forum, Virtual Event, 15–19 June 2020; American Institute of Aeronautics and Astronautics: Reston, VA, USA, 2020; p. 2019. [Google Scholar]
  8. Holden, J.; Goel, N. Fast-Forwarding to a Future of On-Demand Urban Air Transportation; UBER Elevate: Frisco, TX, USA, 2016. [Google Scholar]
  9. Horvath & Partners. Business between Sky and Earth: Assessing the Market Potenial of Mobility in the 3rd Dimension, Urban Air Mobility Study Report 2019; Horvath & Partners: Stuttgart, Germany, 2019. [Google Scholar]
  10. Grandl, G.; Oseguera-Lohr, R.M.; Cachay, J.; Doppler, S.; Salib, J.; Ross, H. The Future of Vertical Mobility: Sizing the Market for Passenger, Inspection, and Goods Services until 2035; Porsche Consulting: Stuttgart, Germany, 2018. [Google Scholar]
  11. Hamilton, B.A. Urban Air Mobility (UAM) Market Study: Final Report, National Aeronautics and Space Administration (NASA). Available online: https://ntrs.nasa.gov/citations/20190001472 (accessed on 2 June 2020).
  12. Crown Consulting; Ascension Global; Georgia Institute of Technology (Georgia Tech); McKinsey & Company. Urban Air Mobility (UAM) Market Study: Technical Briefing, National Aeronautics and Space Administration (NASA), Nov. Available online: https://ntrs.nasa.gov/citations/20190026762 (accessed on 2 June 2020).
  13. Baur, S.; Schickram, S.; Homulenko, A.; Martinez, N.; Dyskin, A. Urban Air Mobility: The Rise of a New Mode of Transportation; Roland Berger: Munich, Germany, 2018. [Google Scholar]
  14. Niklaß, M.; Dzikus, N.; Swaid, M.; Berling, J.; Lührs, B.; Lau, A.; Terekhov, I.; Gollnick, V. A Collaborative Approach for an Integrated Modeling of Urban Air Transportation Systems. Aerospace 2020, 7, 50. [Google Scholar] [CrossRef]
  15. Straubinger, A.; Rothfeld, R.; Shamiyeh, M.; Büchter, K.-D.; Kaiser, J.; Plötner, K.O. An overview of current research and developments in urban air mobility—Setting the scene for UAM introduction. J. Air Transp. Manag. 2020, 87, 101852. [Google Scholar] [CrossRef]
  16. Garrow, L.A.; German, B.J.; Leonard, C.E. Urban air mobility: A comprehensive review and comparative analysis with autonomous and electric ground transportation for informing future research. Transp. Res. Part C Emerg. Technol. 2021, 132, 103377. [Google Scholar] [CrossRef]
  17. Federal Aviation Administration (FAA). Airport Capacity Profiles; F055-L11-014; Federal Aviation Administration: Washington, DC, USA, 2014.
  18. International Civil Aviation Organization (ICAO). Heliport Manual (Doc 9261), 5th ed.; Doc 9261-AN/903; International Civil Aviation Organization: Montreal, QC, Canada, 2020; Available online: https://store.icao.int/en/heliport-manual-doc-9261 (accessed on 2 June 2020).
  19. Straubinger, A.; Verhoef, E.T.; de Groot, H.L. Will urban air mobility fly? The efficiency and distributional impacts of UAM in different urban spatial structures. Transp. Res. Part C Emerg. Technol. 2021, 127, 103124. [Google Scholar] [CrossRef]
  20. Vascik, P.D.; Balakrishnan, H.; Hansman, J.R. Assessment of Air Traffic Control for Urban Air Mobility and Un-manned Systems. In Proceedings of the 8th International Conference for Research in Air Transportation (ICRAT), Barcelona, Spain, 26–29 June 2018; Available online: https://dspace.mit.edu/handle/1721.1/117686 (accessed on 2 June 2020).
  21. Brown, A. Volocopter, “World’s First Full-Scale Air Taxi VoloPort Unveiled in Singapore”. Skyports. Available online: https://skyports.net/2019/10/worlds-first-full-scale-air-taxi-voloport-unveiled-in-singapore/ (accessed on 2 June 2020).
  22. Autofutures. Full-Scale Vertiport on Show in Singapore—We Talk to eVTOL Infrastructure Company Skyports; Auto Futures: London, UK, 2019. [Google Scholar]
  23. Fleming, S. The UK is Building the World’s First Airport: For Flying Cars; World Economic Forum: Geneva, Switzerland, 2021; Available online: https://www.weforum.org/agenda/2021/02/uk-first-airport-electric-flying-cars (accessed on 1 April 2021).
  24. Central Intelligence Agency (CIA). The World Factbook: Heliports. Available online: https://www.cia.gov/the-world-factbook/field/heliports/ (accessed on 7 April 2021).
  25. Preis, L. Quick Sizing, Throughput Estimating and Layout Planning for VTOL Aerodromes—A Methodology for Vertiport Design. In Proceedings of the AIAA Aviation 2021 Forum, Virtual Event, 2–6 August 2021; American Institute of Aeronautics and Astronautics: Reston, VA, USA, 2021. [Google Scholar]
  26. Kaleta, W.; Skorupski, J. A fuzzy inference approach to analysis of LPV-200 procedures influence on air traffic safety. Transp. Res. Part C Emerg. Technol. 2019, 106, 264–280. [Google Scholar] [CrossRef]
  27. Buxi, G.; Hansen, M. Generating day-of-operation probabilistic capacity scenarios from weather forecasts. Transp. Res. Part C Emerg. Technol. 2013, 33, 153–166. [Google Scholar] [CrossRef] [Green Version]
  28. Gerdes, I.; Temme, A.; Schultz, M. Dynamic airspace sectorisation for flight-centric operations. Transp. Res. Part C Emerg. Technol. 2018, 95, 460–480. [Google Scholar] [CrossRef]
  29. Vascik, P.D.; Hansman, J.R. Development of Vertiport Capacity Envelopes and Analysis of Their Sensitivity to Top-ological and Operational Factors. In Proceedings of the AIAA Scitech 2019 Forum, San Diego, CA, USA, 7–11 January 2019; American Institute of Aeronautics and Astronautics: San Diego, CA, USA, 2019; p. 409. [Google Scholar]
  30. Zelinski, S. Operational Analysis of Vertiport Surface Topology. In Proceedings of the 2020 AIAA/IEEE 39th Digital Avionics Systems Conference (DASC), San Antonio, TX, USA, 11–16 October 2020; pp. 1–10. [Google Scholar]
  31. Schweiger, K.; Knabe, F.; Korn, B. An exemplary definition of a vertidrome’s airside concept of operations. Aerosp. Sci. Technol. 2021, 110, 107144. [Google Scholar] [CrossRef]
  32. Ortuzar, J.d.D.; Willumsen, L.G. Modelling Transport, 4th ed.; John Wiley & Sons: Hoboken, NJ, USA, 2011; Available online: http://site.ebrary.com/lib/alltitles/docDetail.action?docID=10510502 (accessed on 2 June 2020).
  33. Chen, L. Agent-based modeling in urban and architectural research: A brief literature review. Front. Arch. Res. 2012, 1, 166–177. [Google Scholar] [CrossRef] [Green Version]
  34. Rothfeld, R.; Balac, M.; Ploetner, K.O.; Antoniou, C. Agent-Based Simulation of Urban Air Mobility. In Proceedings of the 2018 Modeling and Simulation Technologies Conference, Atlanta, GA, USA, 25–29 June 2018; American Institute of Aeronautics and Astronautics: San Diego, CA, USA, 2018. [Google Scholar]
  35. Preis, L.; Amirzada, A.; Hornung, M. Ground Operation on Vertiports—Introduction of an Agent-Based Simulation Framework. In Proceedings of the AIAA Scitech 2021 Forum, Virtual Event, 11–15 and 19–21 January 2021; American Institute of Aeronautics and Astronautics: San Diego, CA, USA, 2021. [Google Scholar]
  36. Schweiger, K.; Knabe, F.; Korn, B. UAM Vertidrome Airside Operation: What needs to be considered? In Proceedings of the Delft International Conference on Urban Air-Mobility (DICUAM), Virtual Event, 15–17 March 2021. [Google Scholar]
  37. Neufville, R.d.; Amedeo, O.R.; Belobaba, P.P.; Reynolds, T.G. Airport Systems: Planning, Design, and Management, 4th ed.; McGraw-Hill Education: Berkshire, UK, 2013; Available online: https://www.accessengineeringlibrary.com/content/book/9780071770583 (accessed on 2 June 2020).
  38. Federal Aviation Administration (FAA). Heliport Design, AC 150/5390-2C. 2012. Available online: https://www.faa.gov/airports/resources/advisory_circulars/index.cfm/go/document.current/documentnumber/150_5390-2 (accessed on 2 June 2020).
  39. Schmidt, M.; Engelmann, M.; Brügge-Zobel, T.; Hornung, M.; Glas, M. PAXelerate—An Open Source Passenger Flow Simulation Framework for Advanced Aircraft Cabin Layouts. In Proceedings of the 54th AIAA Aerospace Sciences Meeting, San Diego, CA, USA, 4–8 January 2016; American Institute of Aeronautics and Astronautics: San Diego, CA, USA, 2016. [Google Scholar]
  40. Guerreiro, N.M.; Butler, R.W.; Maddalon, J.M.; Hagen, G.E. Mission Planner Algorithm for Urban Air Mobility—Initial Performance Characterization. In Proceedings of the AIAA Aviation 2019 Forum, Dallas, Texas, 17–21 June 2019; American Institute of Aeronautics and Astronautics: San Diego, CA, USA, 2019. [Google Scholar]
  41. Guerreiro, N.M.; Hagen, G.E.; Maddalon, J.M.; Butler, R.W. Capacity and Throughput of Urban Air Mobility Vertiports with a First-Come, First-Served Vertiport Scheduling Algorithm. In Proceedings of the AIAA Aviation 2020 Forum, Virtual Event, 15–19 June 2020; American Institute of Aeronautics and Astronautics: San Diego, CA, USA, 2020; p. 22. [Google Scholar]
  42. UBER Elevate, UberAir Vehicle Requirements and Missions. 2018. Available online: https://s3.amazonaws.com/uber-static/elevate/Summary+Mission+and+Requirements.pdf (accessed on 5 October 2020).
  43. Vitalle, R.F.; Zhang, Y.; Normann, B.; Shen, N. A Model for the Integration of UAM operations in and near Terminal Areas. In Proceedings of the Aiaa Aviation 2020 Forum, Virtual Event, 15–19 June 2020. [Google Scholar]
  44. Kohlman, L.W.; Patterson, M.D. System-Level Urban Air Mobility Transportation Modeling and Determination of Energy-Related Constraints. In Proceedings of the 2018 Aviation Technology, Integration, and Operations Conference, Atlanta, GA, USA, 25–29 June 2018; American Institute of Aeronautics and Astronautics: San Diego, CA, USA, 2018. [Google Scholar]
  45. Roy, S.; Kotwicz, M.T.H.; Leonard, C.; Jha, A.; Wang, N.; German, B.; Garrow, L. A Multi-Commodity Network Flow Approach for Optimal Flight Schedules for an Airport Shuttle Air Taxi Service. In Proceedings of the AIAA Scitech 2020 Forum, Orlando, FL, USA, 6–10 January 2020; American Institute of Aeronautics and Astronautics: San Diego, CA, USA, 2020; p. 3518. [Google Scholar]
  46. Chakraborty, I.; Mishra, A.A. Total Energy Based Flight Control System Design for a Lift-Plus-Cruise Urban Air Mobility Concept. In Proceedings of the AIAA Scitech 2021 Forum, Virtual Event, 11–15 and 19–21 January 2021; p. 21. [Google Scholar]
  47. Patterson, M.D.; Antcliff, K.R.; Kohlman, L.W. A Proposed Approach to Studying Urban Air Mobility Missions Including an Initial Exploration of Mission Requirements; NASA Langley: Hampton, VA, USA, 2018.
  48. Brown, A.; Harris, W.L. Vehicle Design and Optimization Model for Urban Air Mobility. J. Aircr. 2020, 57, 1003–1013. [Google Scholar] [CrossRef]
  49. Maheshwari, A.; Mudumba, S.; Sells, B.E.; DeLaurentis, D.A.; Crossley, W.A. Identifying and Analyzing Operations Limits for Passenger-Carrying Urban Air Mobility Missions. In Proceedings of the AIAA Aviation 2020 Forum, Virtual Event, 15–19 June 2020; American Institute of Aeronautics and Astronautics: San Diego, CA, USA, 2020; p. 526. [Google Scholar]
  50. Vascik, P.D. Systems Analysis of Urban Air Mobility Operational Scaling. Ph.D. Thesis, Department of Aeronautics & Astrophysics, Massachusetts Institute of Technology (MIT), Cambridge, MA, USA, 2020. [Google Scholar]
  51. Kleinbekman, I.C.; Mitici, M.; Wei, P. Rolling-Horizon Electric Vertical Takeoff and Landing Arrival Scheduling for On-Demand Urban Air Mobility. J. Aerosp. Inf. Syst. 2020, 17, 150–159. [Google Scholar] [CrossRef]
  52. Justin, C.Y.; Payan, A.P.; Briceno, S.I.; German, B.J.; Mavris, D.N. Power optimized battery swap and recharge strategies for electric aircraft operations. Transp. Res. Part C Emerg. Technol. 2020, 115, 102605. [Google Scholar] [CrossRef]
  53. Stith, P.; Khangura, J. Preparing for Take-Off: Urban Air Mobility Infrastructure National Institute of Aerospace (NIA) National Aeronautics and Space Administration (NASA) Study Results. In Proceedings of the 33rd Electric Vehicle Symposium (EVS33), Portland, OR, USA, 14–17 June 2020; Available online: https://zenodo.org/record/4027893 (accessed on 2 June 2020).
  54. Finkeldei, W.; Feldhoff, E.; Roque, G.S. Flughafen Köln/Bonn Flugtaxi Infrastruktur: Machbarkeitsstudie; Flughafen Köln/Bonn GmbH: Cologne, Germany, 2020. [Google Scholar]
  55. Boelens, J.H. Pioneering the Urban Air Taxi Revolution; Volocopter: Bruchsal, Germany, 2020. [Google Scholar]
  56. Volocopter. VoloCity: Design Specifications, August Calculated Approximations Not Yet Tested in Flight. Available online: https://www.volocopter.com/solutions/volocity/ (accessed on 2 June 2020).
  57. Geely, Gone in 90 Seconds: Geely’s Solution to Vehicle Charging. Available online: https://zgh.com/media-center/story/gone-in-90-seconds/?lang=en (accessed on 6 July 2021).
  58. NIO. Nio launcht Akkutausch-Station der Zweiten Generation, Electrive. Available online: https://www.electrive.net/2021/04/15/nio-launcht-akkutausch-station-der-zweiten-generation/ (accessed on 2 June 2020).
Figure 1. Vertiport environment composed of pads, gates and stands, including connecting lanes and interfaces to airspace and terminal [35].
Electronics 11 01071 g001
Figure 2. Passenger and vehicle demand profile for baseline scenario, randomly generated from normal distribution, spanning a 16 h operational day (example of variation A).
Electronics 11 01071 g002
Figure 3. Variations B-E of demand profiles generated through Monte Carlo approach.
Electronics 11 01071 g003
Figure 4. Average passenger delay with varying initial population of vehicles.
Electronics 11 01071 g004
Figure 5. Average passenger delay with varying demand (accumulated over one day).
Electronics 11 01071 g005
Figure 6. Average passenger delay with varying vehicle approach and departure time.
Electronics 11 01071 g006
Figure 7. Average passenger delay with varying passenger boarding time.
Electronics 11 01071 g007
Figure 8. Average passenger delay with varying number of pads.
Electronics 11 01071 g008
Figure 9. Average passenger delay with varying number of gates.
Electronics 11 01071 g009
Figure 10. Refined model, including parameters from final short list grouped into approach and departure, boarding, taxiing and energy.
Electronics 11 01071 g010
Table 1. Overview of parameter variations for simulations of the sensitivity study.
Aspect to Be VariedDemand Variations IncludedVaried Values (Baseline Marked)Description
Fleet SizeA-C0, 8, 12, 16,
20, 24, 32
Number of vehicles initially parked at vertiport
DemandA-E750, 1000, 1200, 1250, 1300, 1500Accumulated demand over day of operations
Approach and DepartureA-C30, 60, 75, 90, 105, 120Time vehicle needs to land or take off (in seconds) before next operation is possible
BoardingA-C1, 2, 3.5, 4, 4.5, 5Time passenger needs to board or de-board a vehicle (in minutes)
PadsA-C2, 3, 4, 5Number of pads included in airfield layout
GatesA-C6, 7, 8, 9, 10, 12, 16Number of gates included in airfield layout
Table 2. Evolution of list of parameters and division into initial groups.
IDInitial GroupInitial ListFull ListLong ListShort List
AVertiport Elements9954
BPassenger Processing91272
CPassenger Boarding161644
DVehicle Taxiing6865
ETake-Off and Landing5532
FFlight Approach and Departure1114146
GBattery Charging101193
HBattery Swapping81031
IVehicle Maintenance6820
JGeneral Vertiport Operations2440
Total82975727
Table 3. List of parameter values in the refined vertiport model, including references.
IDParameterValueUnit# Experts# LiteratureReferences
B1/B6Terminal to/from gate31.9s30
B2Enter gate19.7s50
B3Boarding73.0s45[8,30,39,40,41]
B4De-boarding65.8s44[8,30,40,41]
B5Leave gate26.7s20
T2Passive taxiing2.63m/s60
T1/T3(De-)mounting passive taxiing device27.0s30
T4Active taxiing2.15m/s51[42]
T6Hover taxiing3.25m/s33[30,36,43]
T5/D1Start engine4.50s20
T7/A3Stop engine5.00s20
A1Enter airspace46.3s62[8,44]
A2Final hover22.9s55[43,45,46,47,48]
D2Initial hover13.5s55[43,44,45,46,48]
D3Leave airspace28.7s61[44]
A4/D4“Cool-down” after landing/take-off30.0s33[49,50,51]
E3Charging speed311kW47[42,44,45,48,52,53,54]
E2Battery capacity133kWh43[46,48,55]
E1Energy loss7.17%33[44,48,52]
E4Swapping time349s25[11,52,56,57,58]
Publisher’s Note: MDPI stays neutral with regard to jurisdictional claims in published maps and institutional affiliations.

