
A Novel Feature Set Extraction Based on Accelerometer Sensor Data for Improving the Fall Detection System


Abstract
:
1. Introduction
2. Related Works
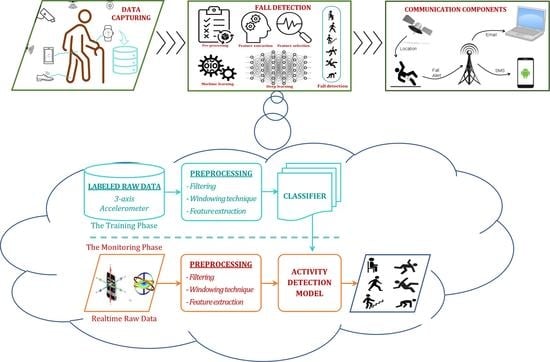
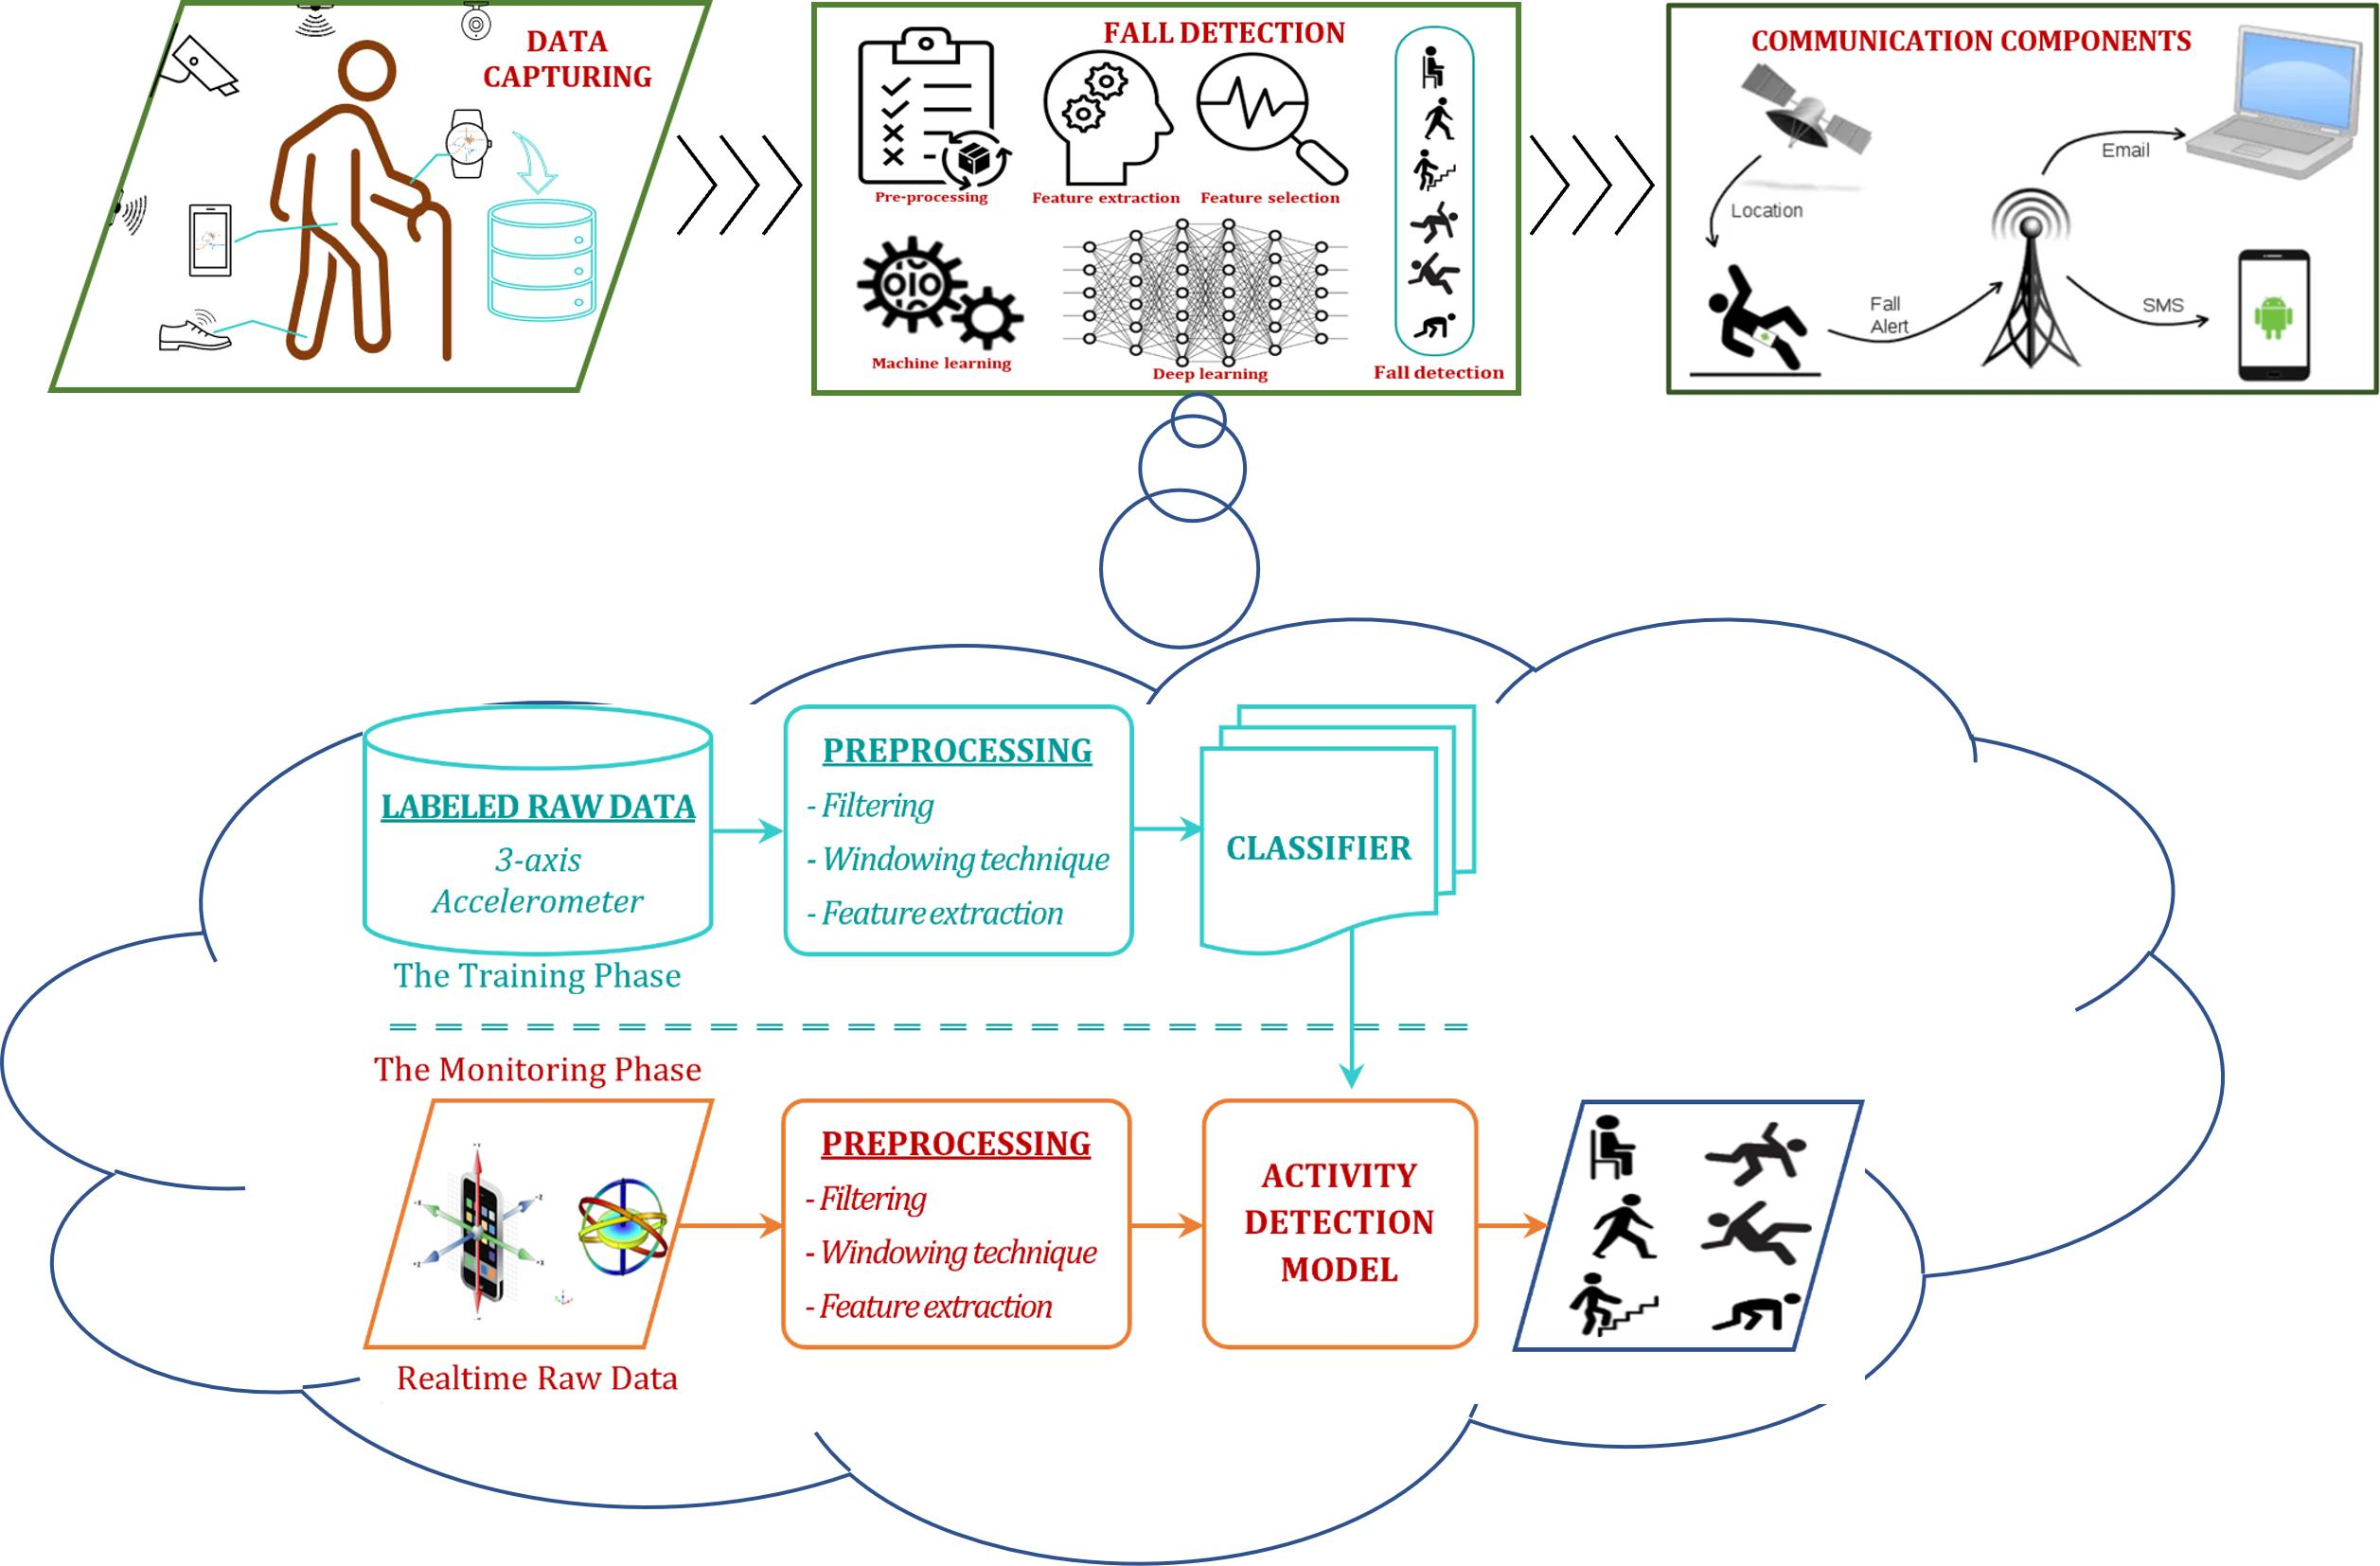
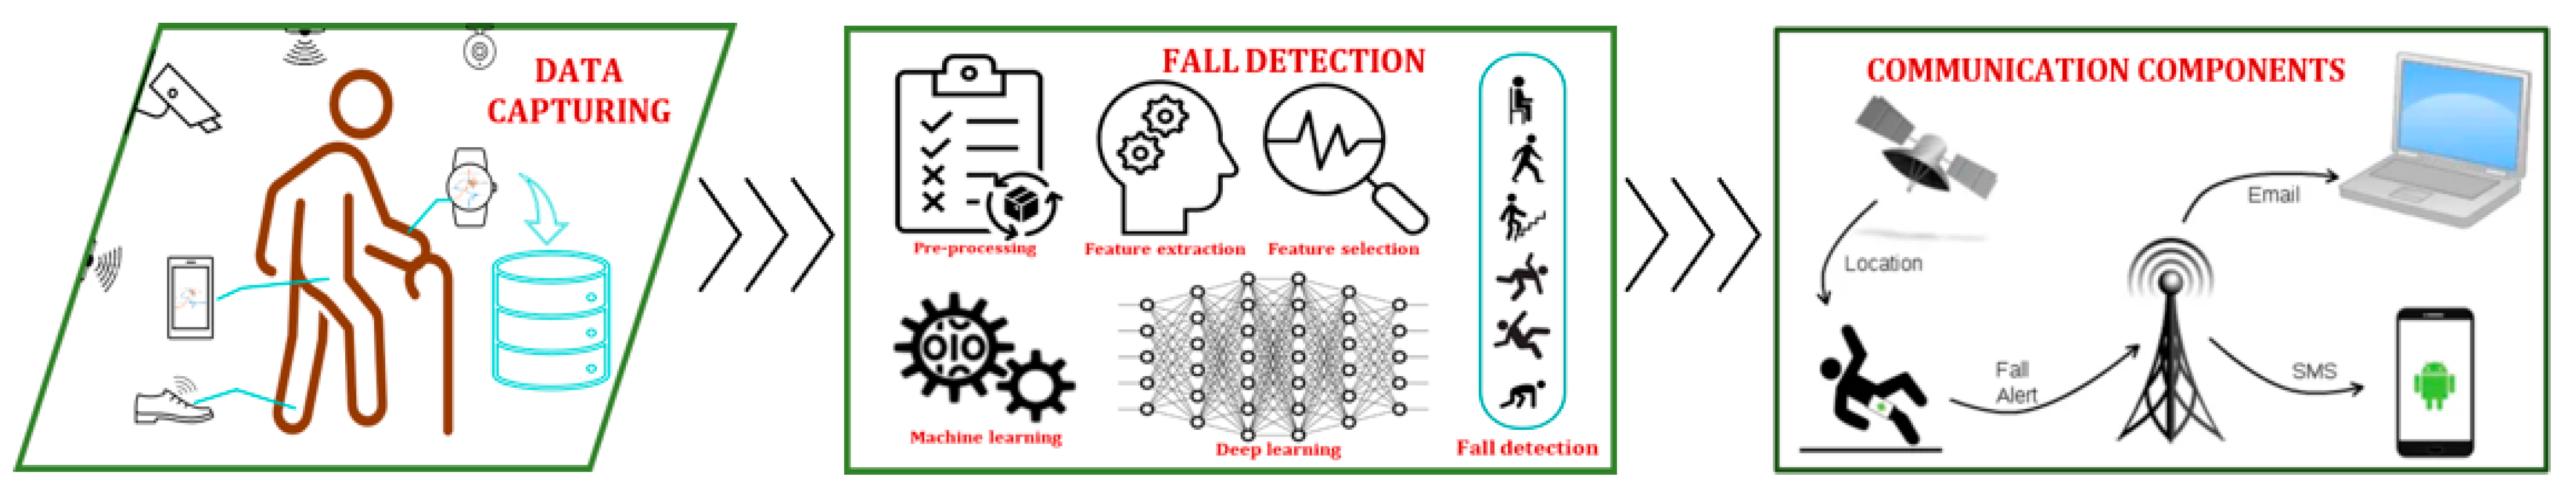
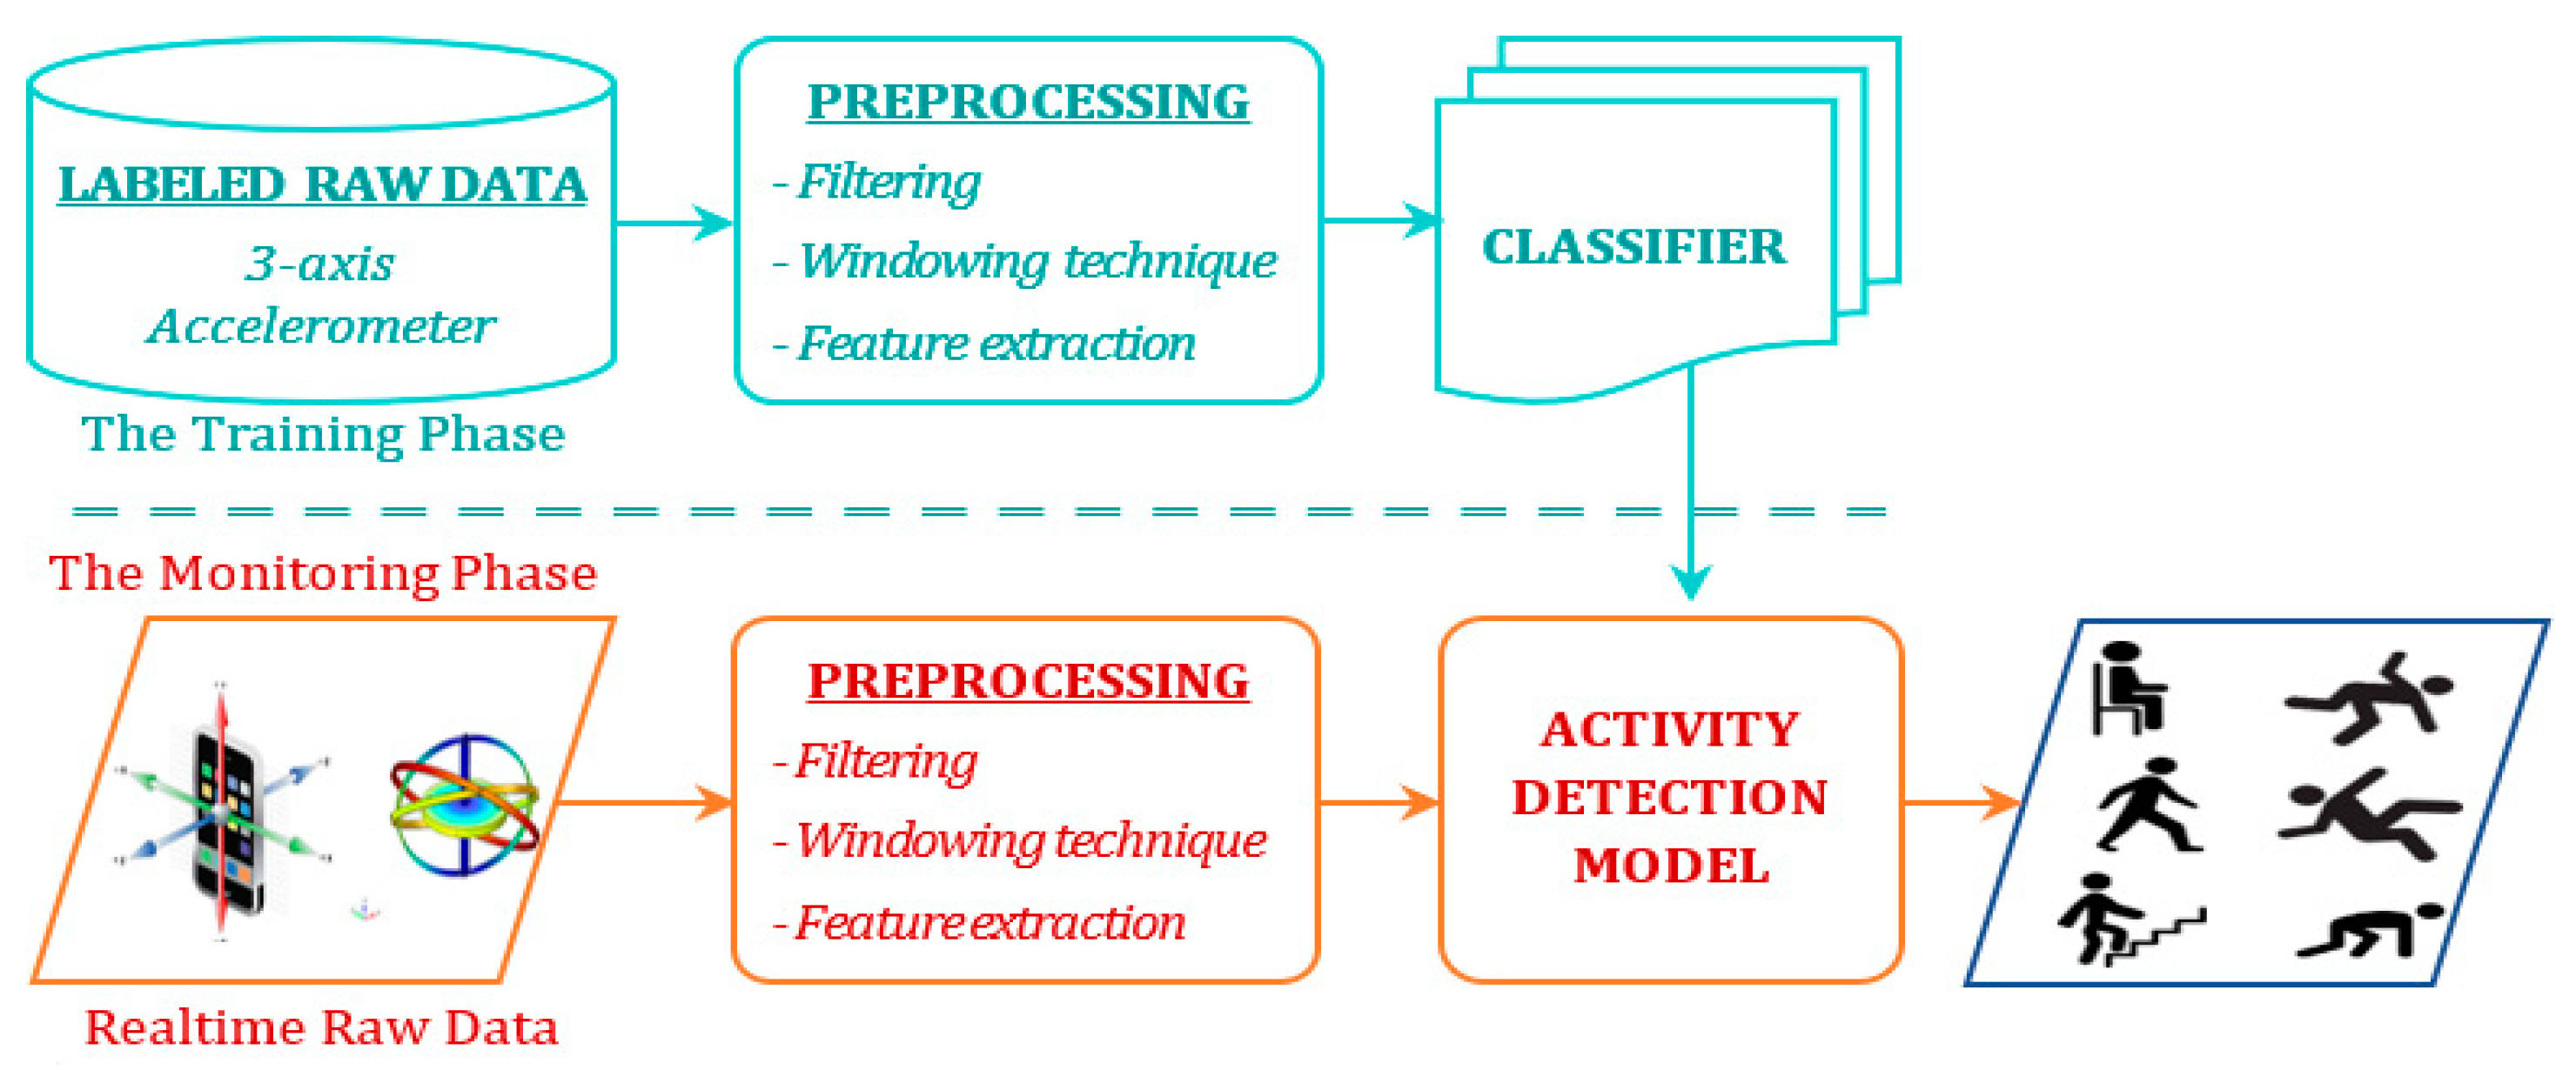
3. The Proposal Framework for Fall Detection
3.1. Data Preprocessing
3.1.1. Filtering Technique
3.1.2. Windowing Technique (Sliding Window)
3.1.3. The Proposal Features Extraction Method (Feature Extraction)
- The feature set in the time domain (T): The popular features are based on statistical metrics, such as mean, variance, and standard deviation. Besides, some other features in the time domain, such as the difference between the minimum and maximum values, zero-crossings, cross-correlation, peak to average ratio (PAR), signal magnitude area (SMA), signal vector magnitude, and differential signal vector magnitude, (DSVM) are additionally computed. The total number of features in the time domain is 34 features.
- The feature set in the frequency domain (F): The time series data of each component are converted into the frequency domain by using the Fast Fourier Transform (FFT) algorithm. Then, the features in the frequency domain consisting of energy and entropy metrics are computed. The spectral energy in certain frequencies is an additional feature computed. These features represent the cyclic information of activities. The number of features in this set F is 7 features.
- Hjorth parameters (H): Consisting of activity (A), mobility (M), and complexity (C), these parameters were introduced by Hjorth in 1970 to analyze time-series data [43]. Because these parameters can provide useful information in both the time and frequency domains, they were mostly used in analyzing biomedical signals such as ECG and EEG [43,44]. Therefore, these parameters are proposed as additional features in our work. The number of features in this set H is only 3 features because only the rms component is applied in computation.
3.2. Model Selections
3.3. Model Evaluations
4. Experimental Evaluations
4.1. Experimental Datasets
4.1.1. MobiAct Dataset
4.1.2. UP-Fall Detection Dataset
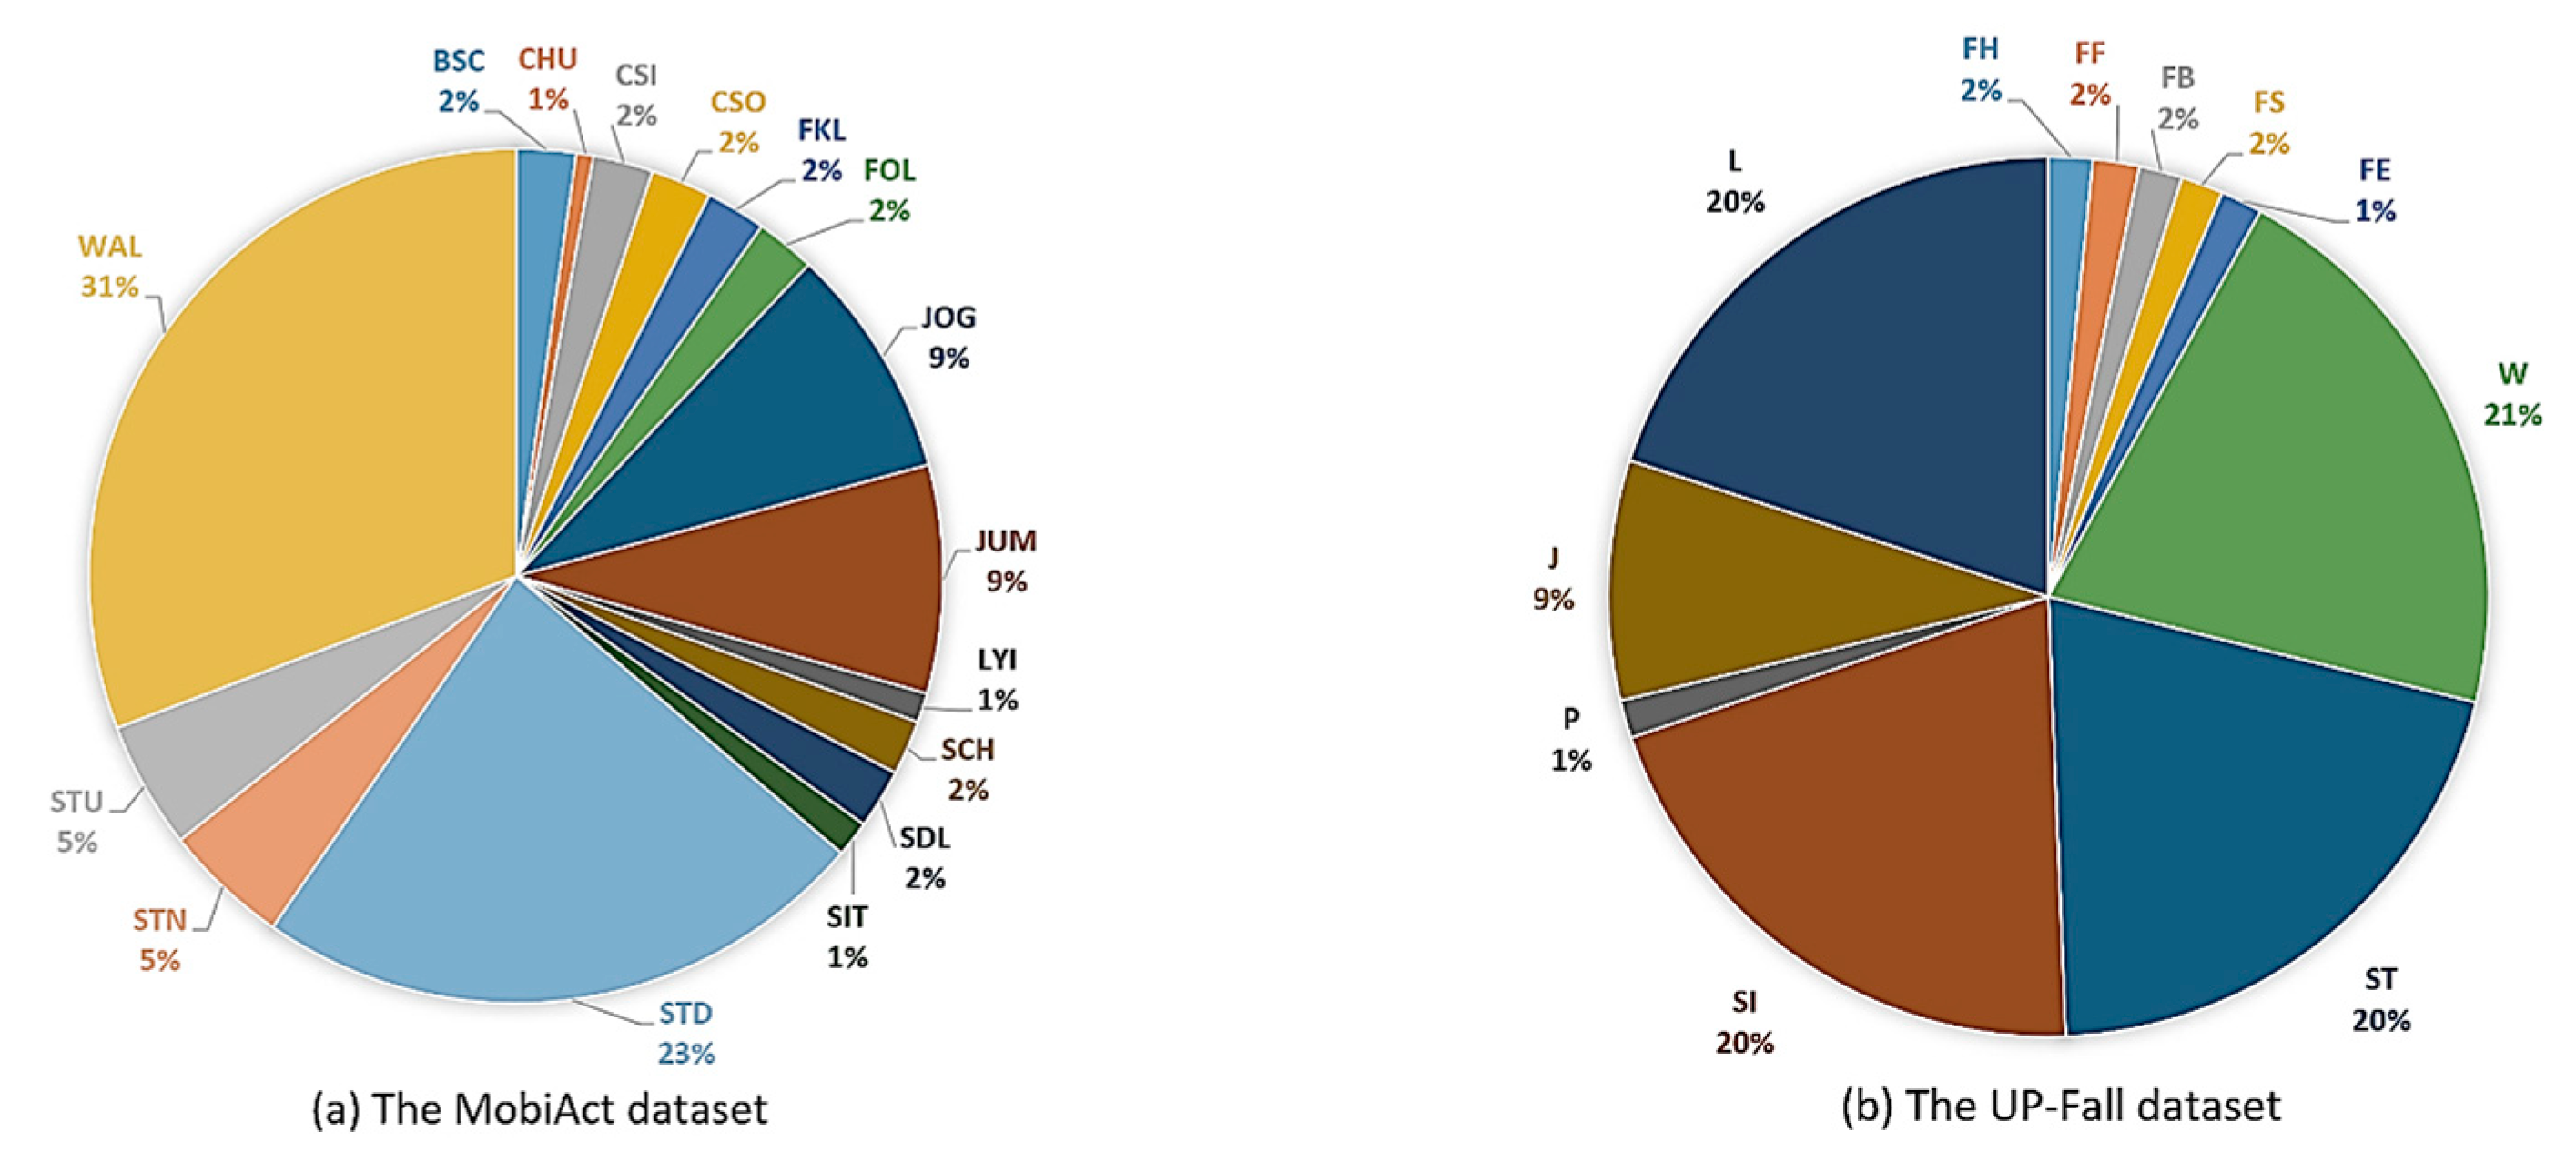
4.1.3. Distribution of Datasets
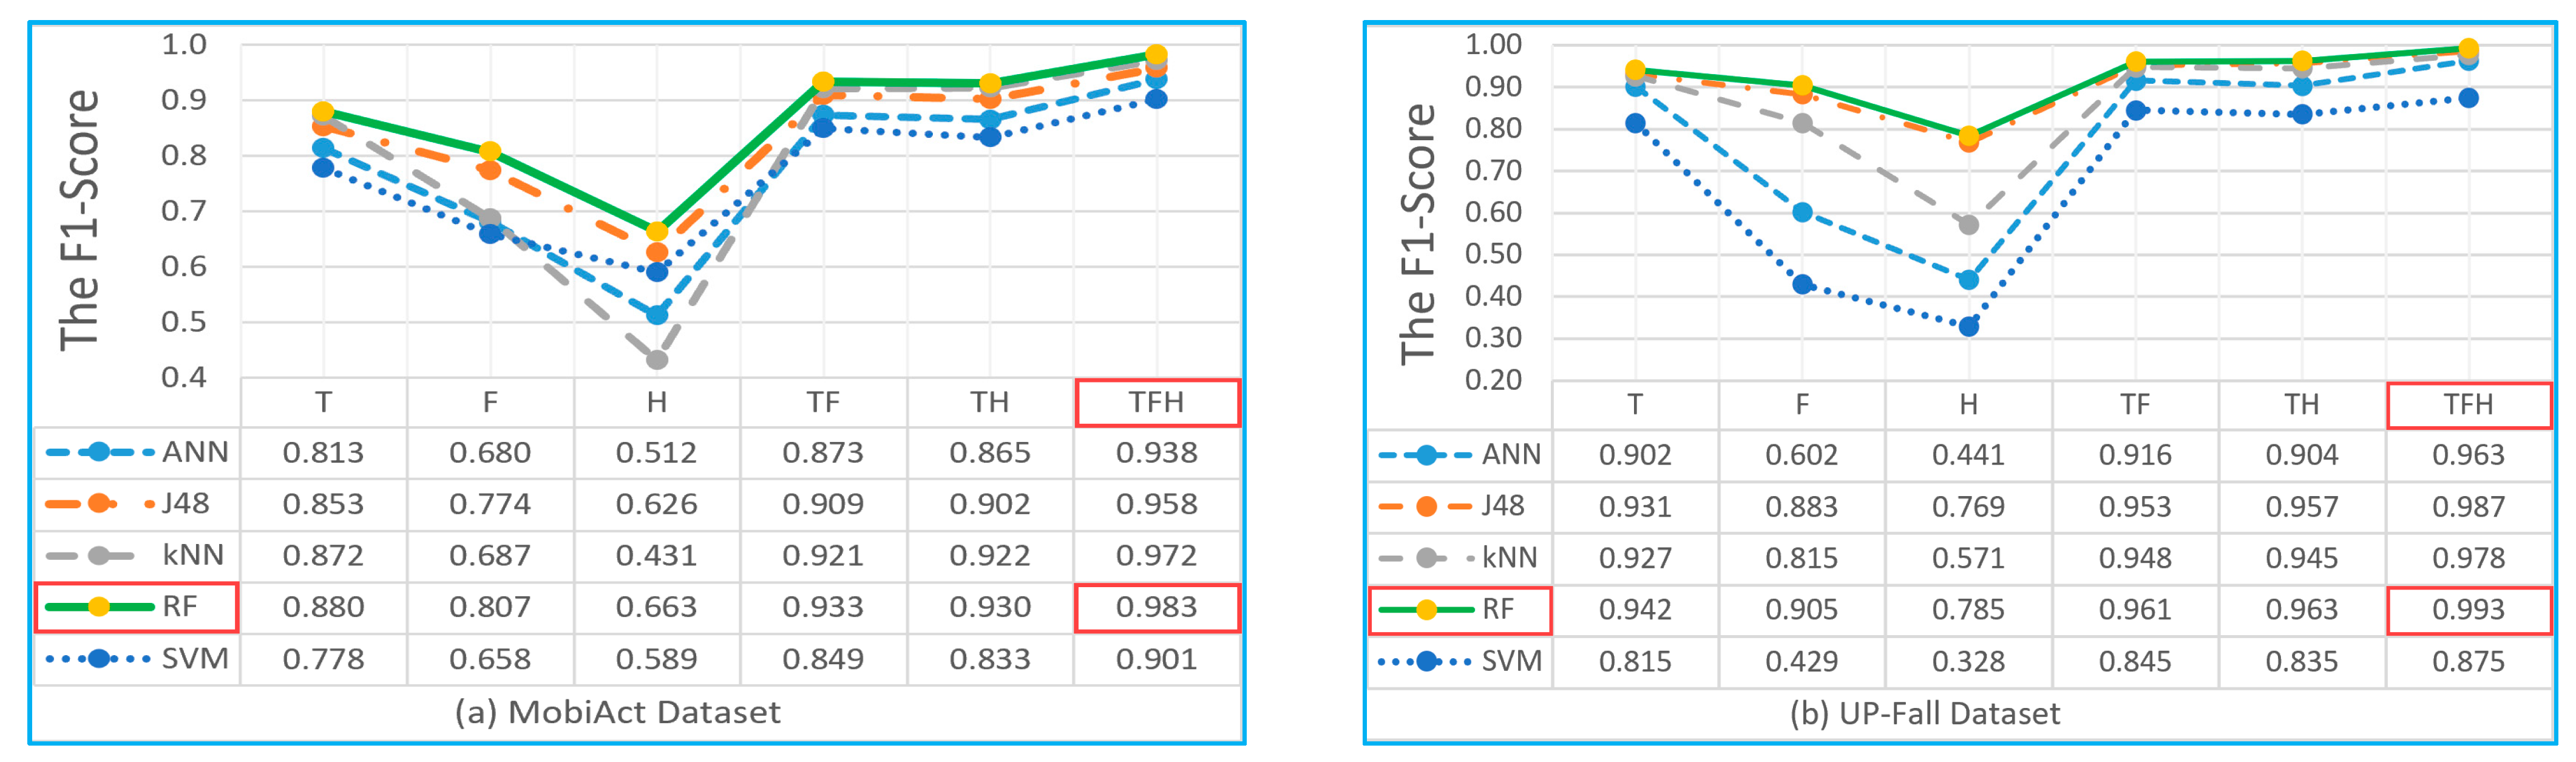
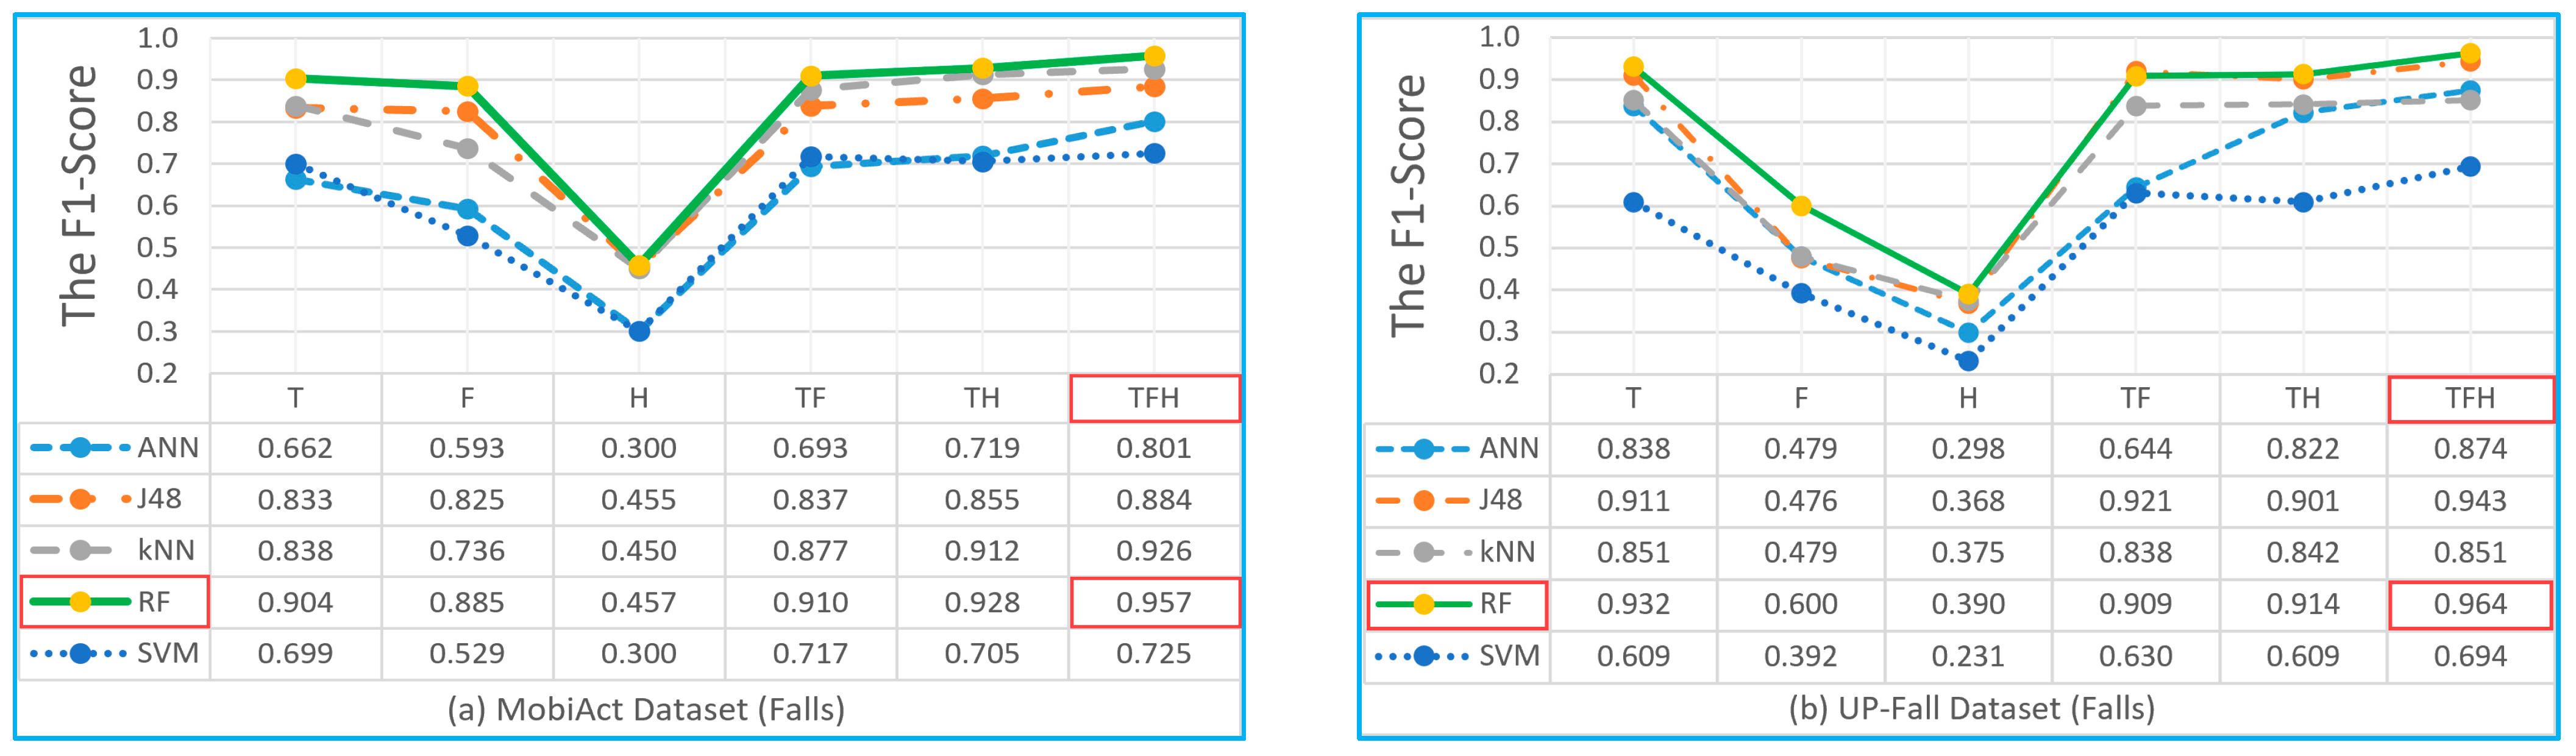
4.2. Effect of Feature Sets
4.2.1. Experiment Description
4.2.2. Discussion
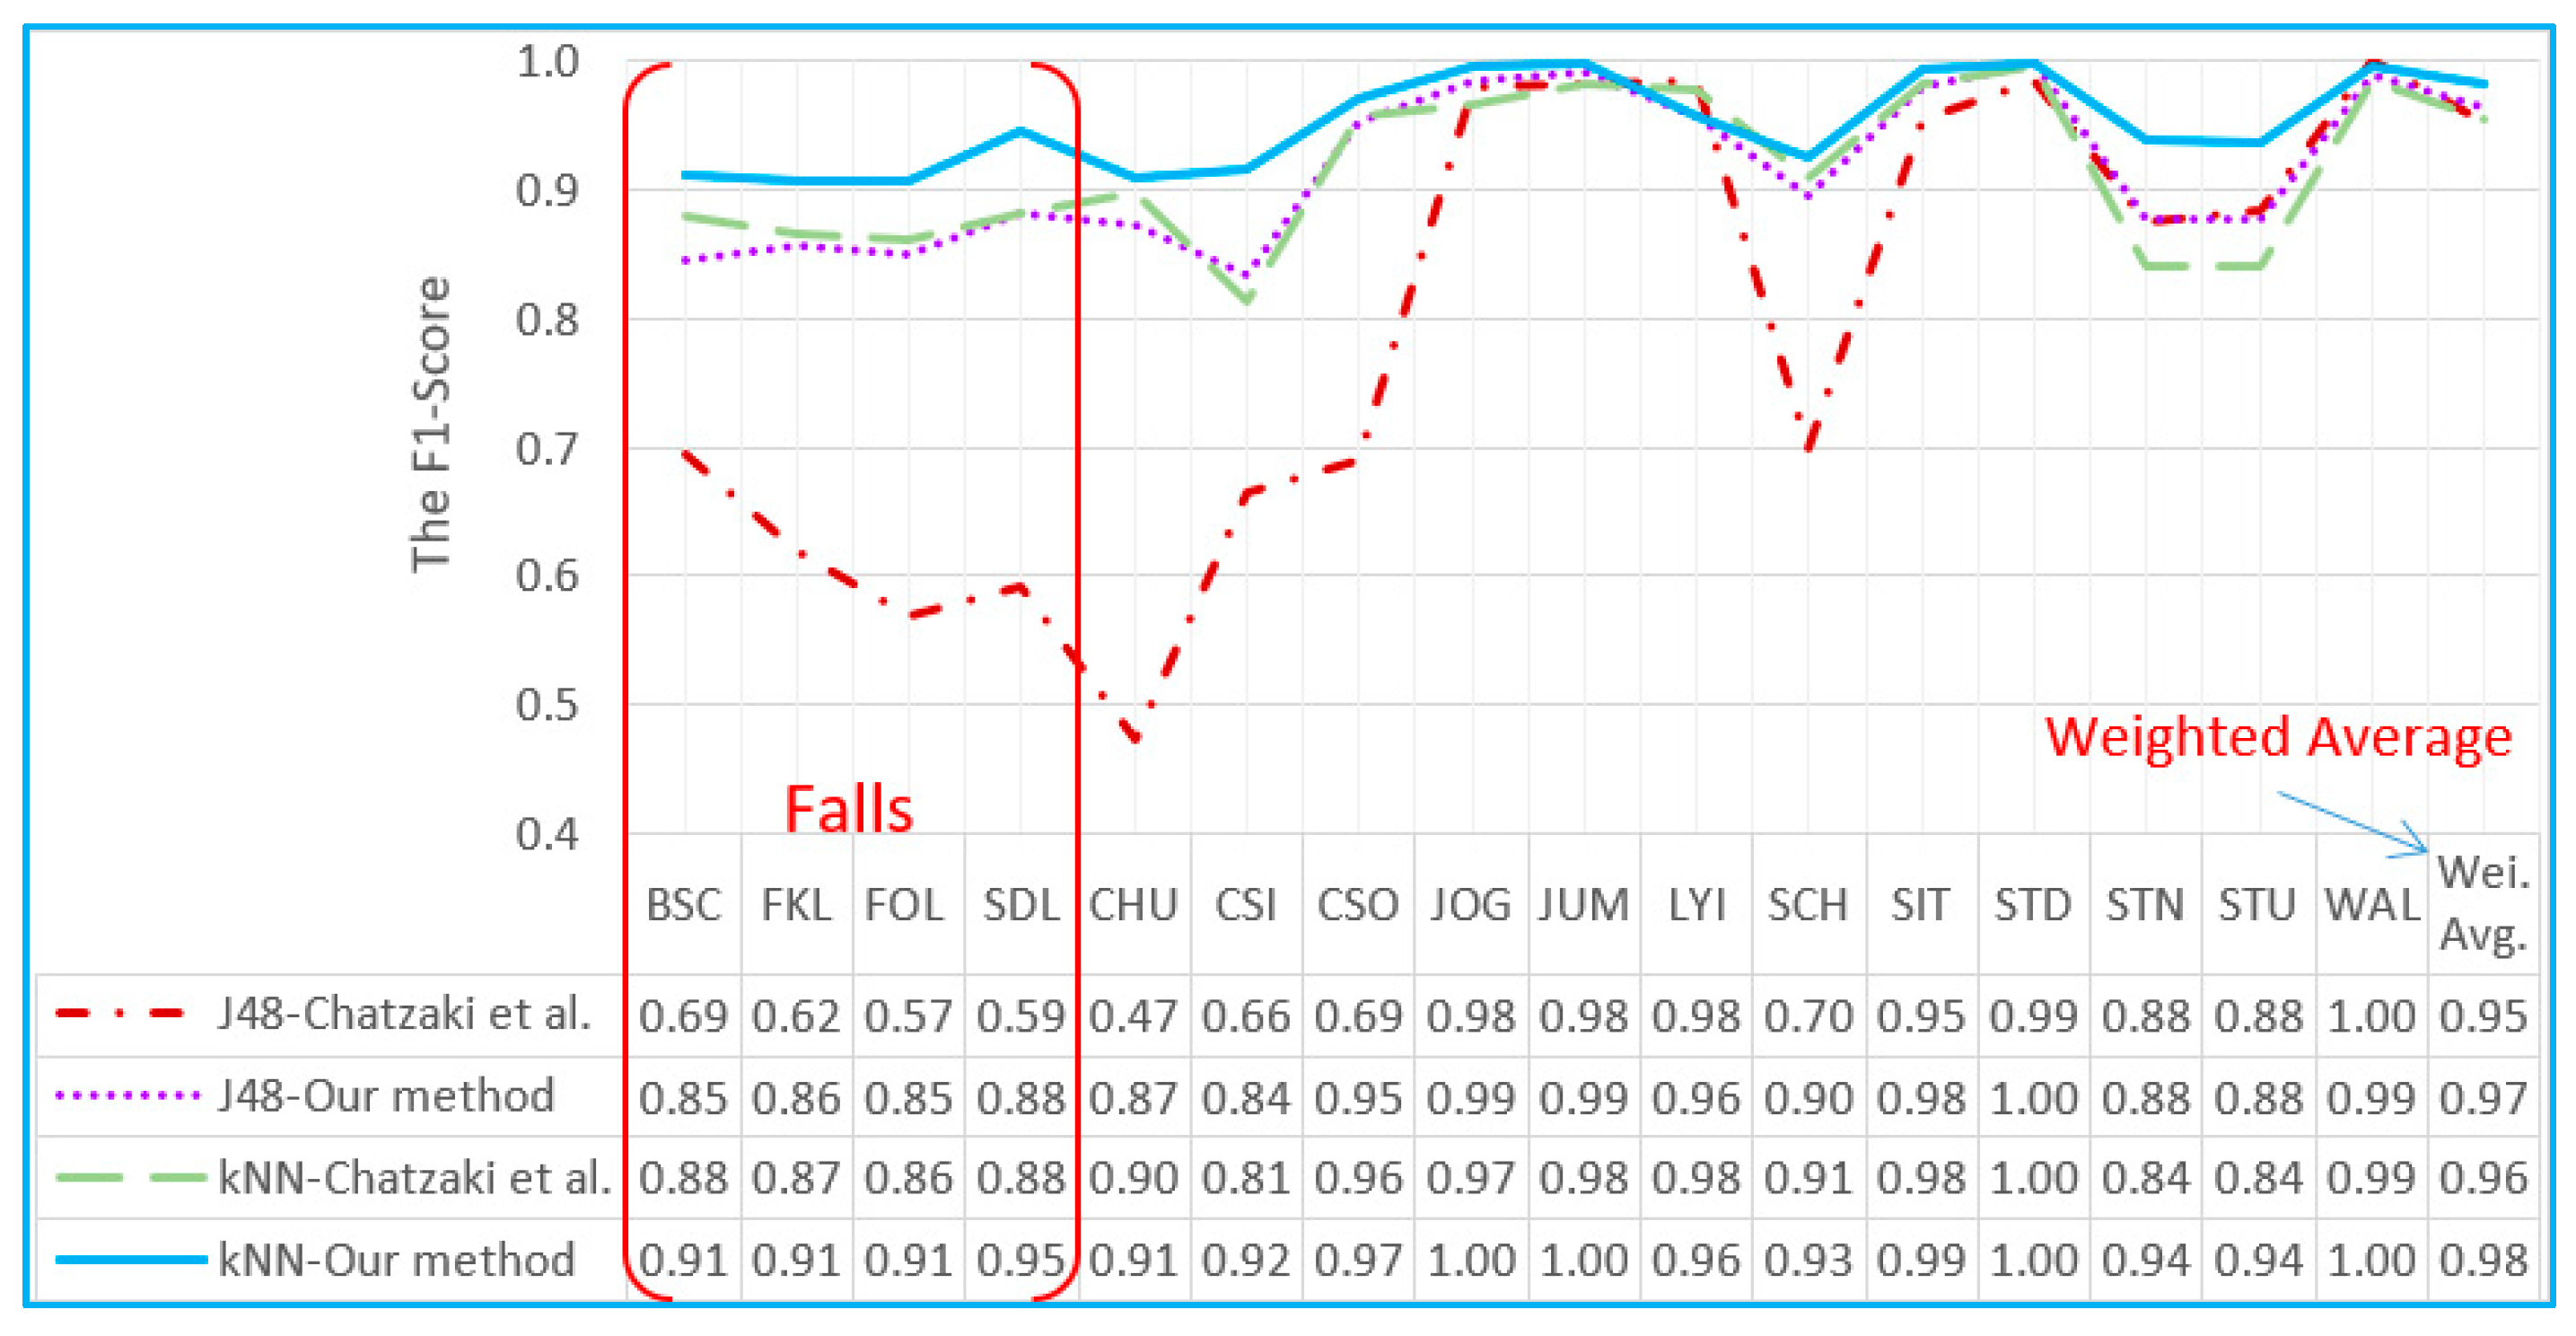
4.3. Comparison
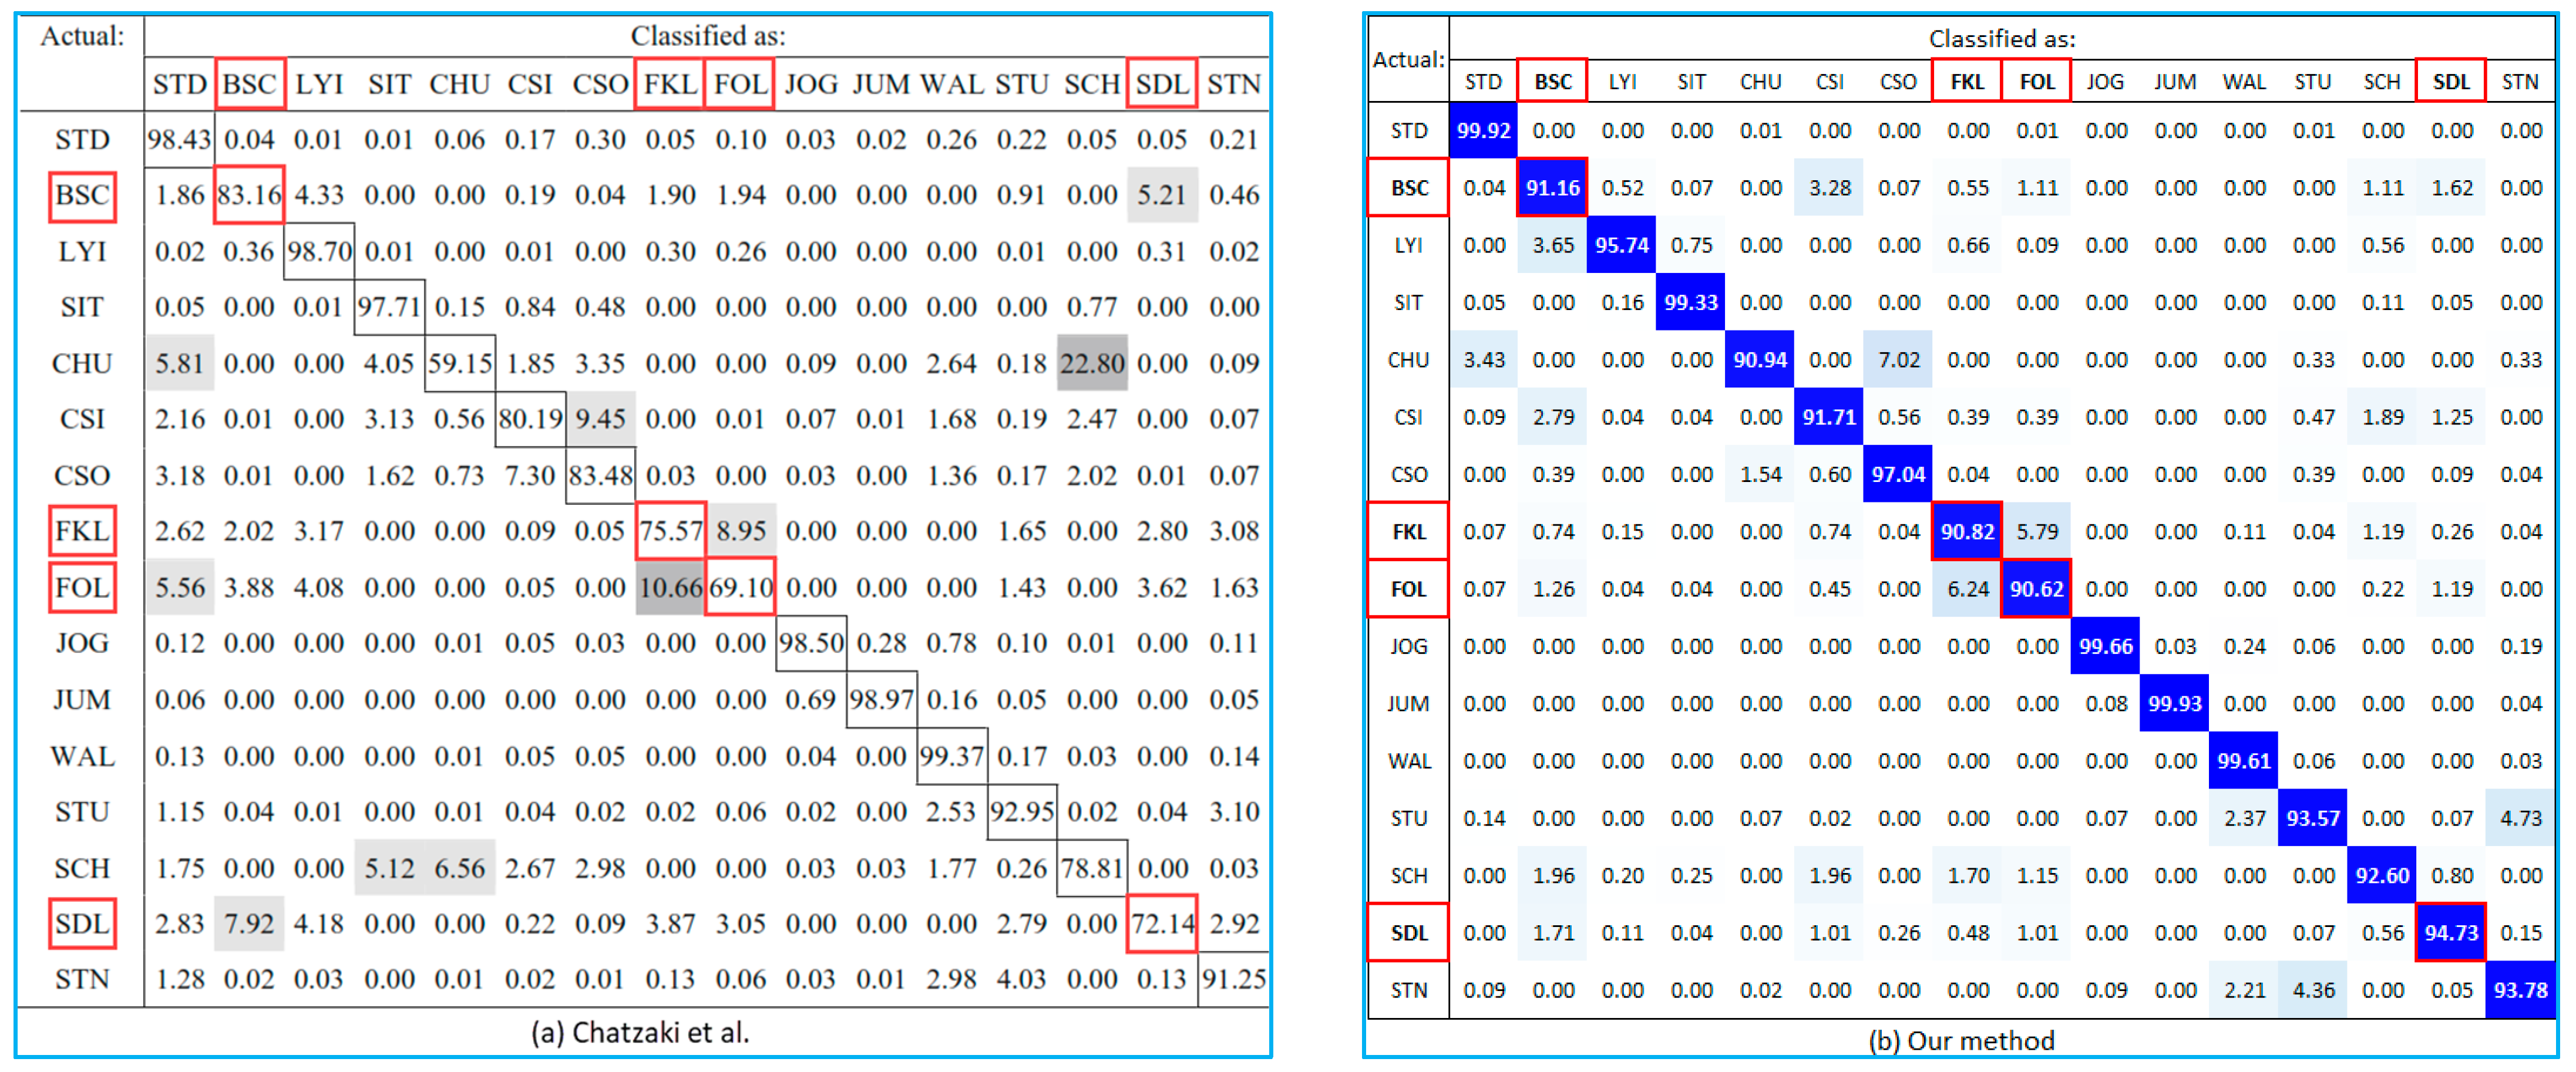
4.3.1. Research Based on MobiAct Dataset
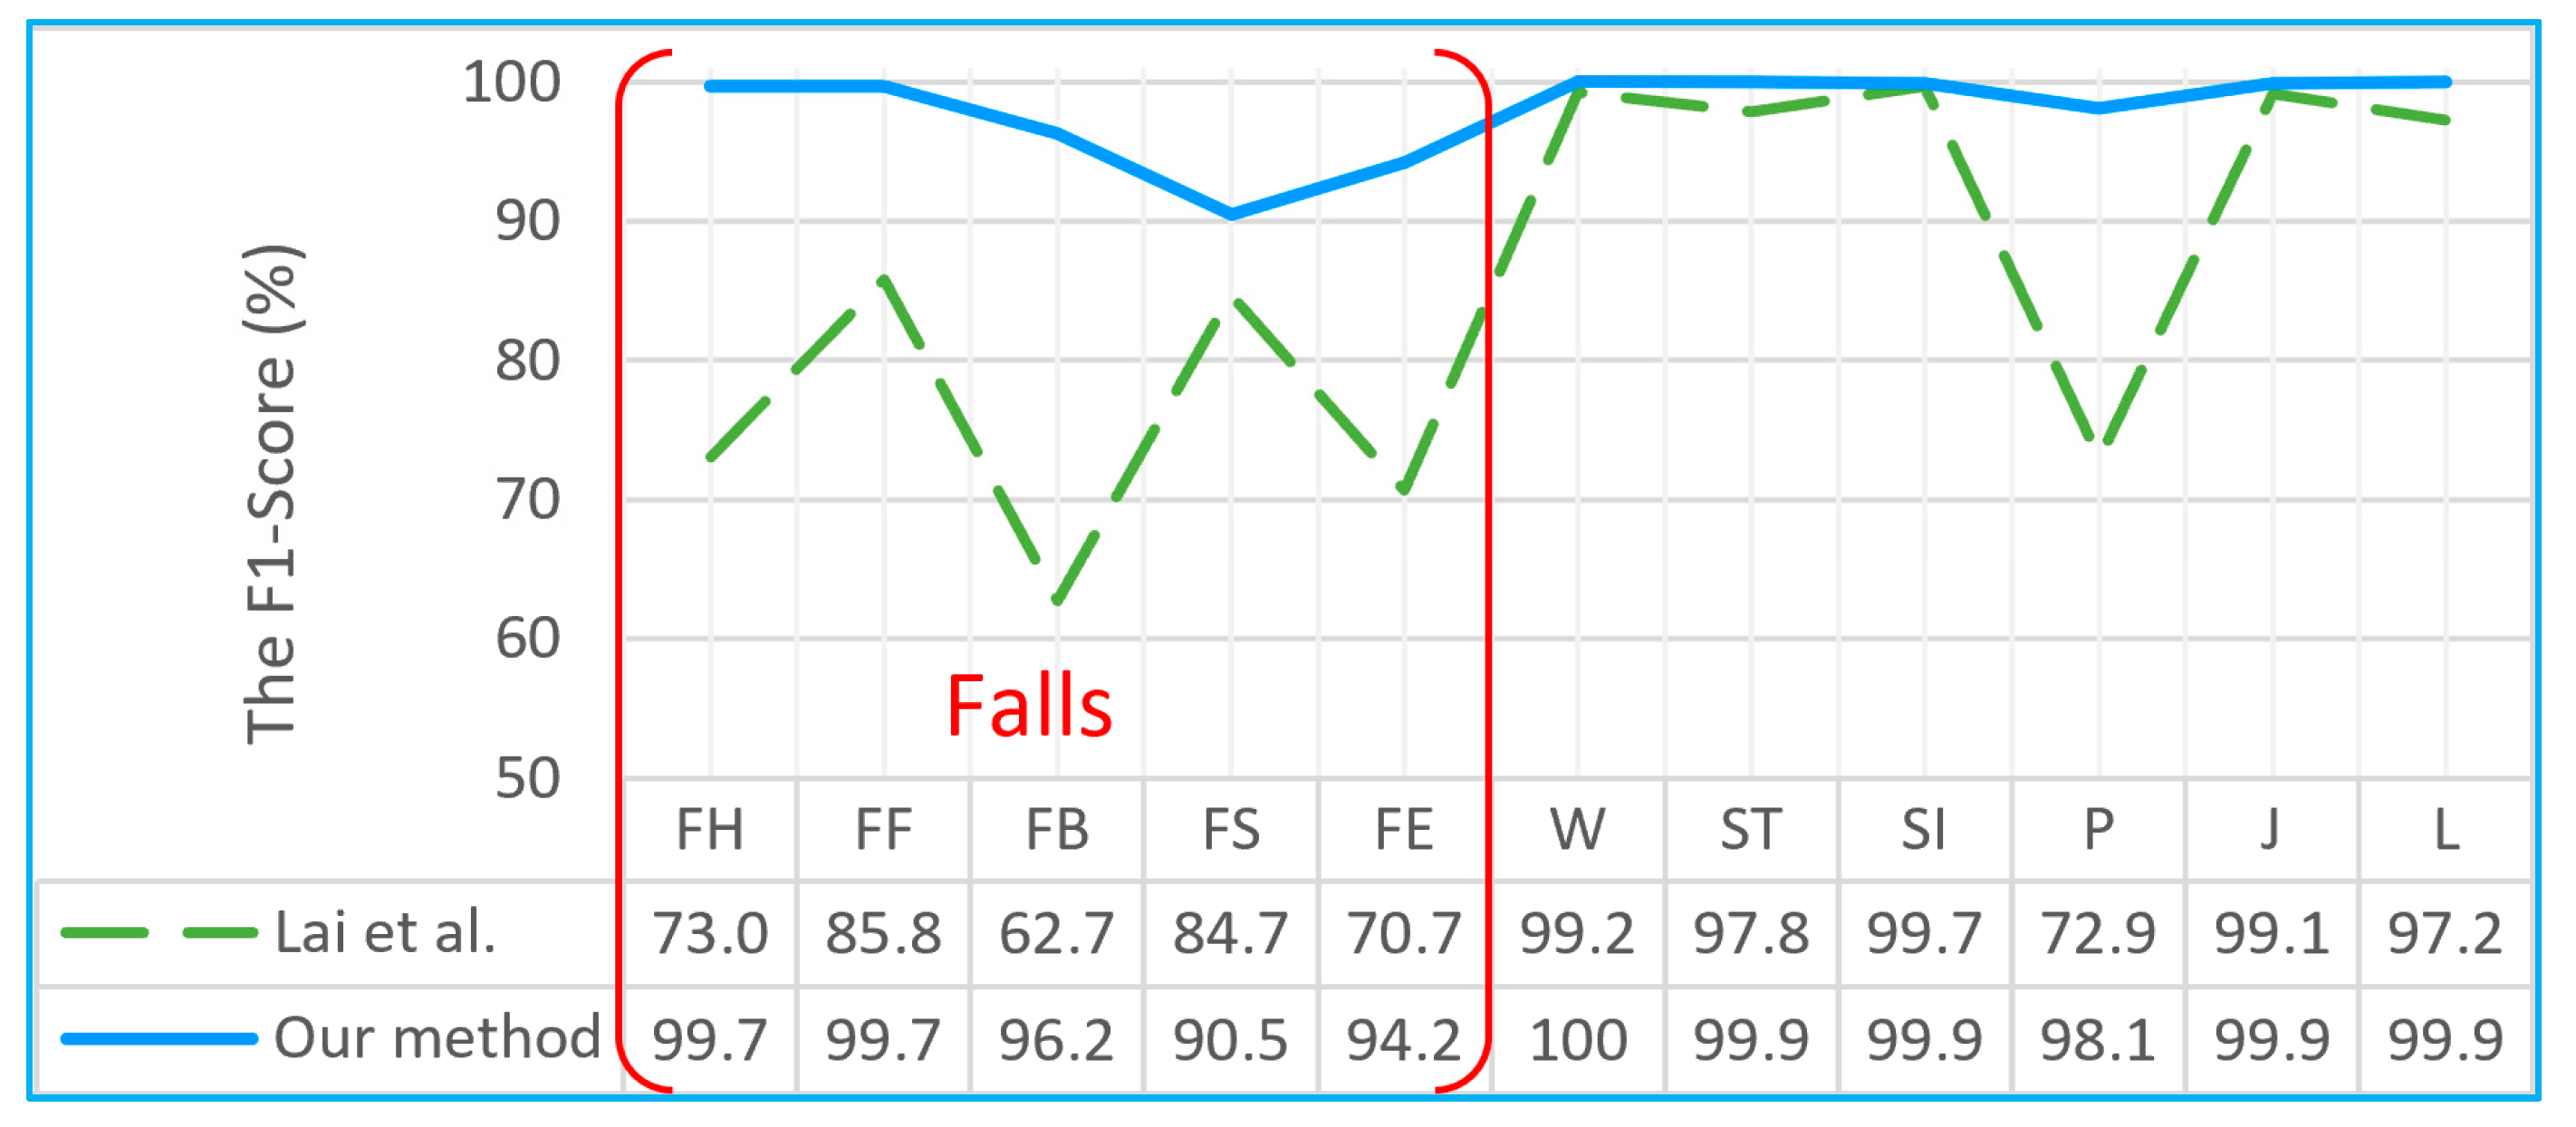
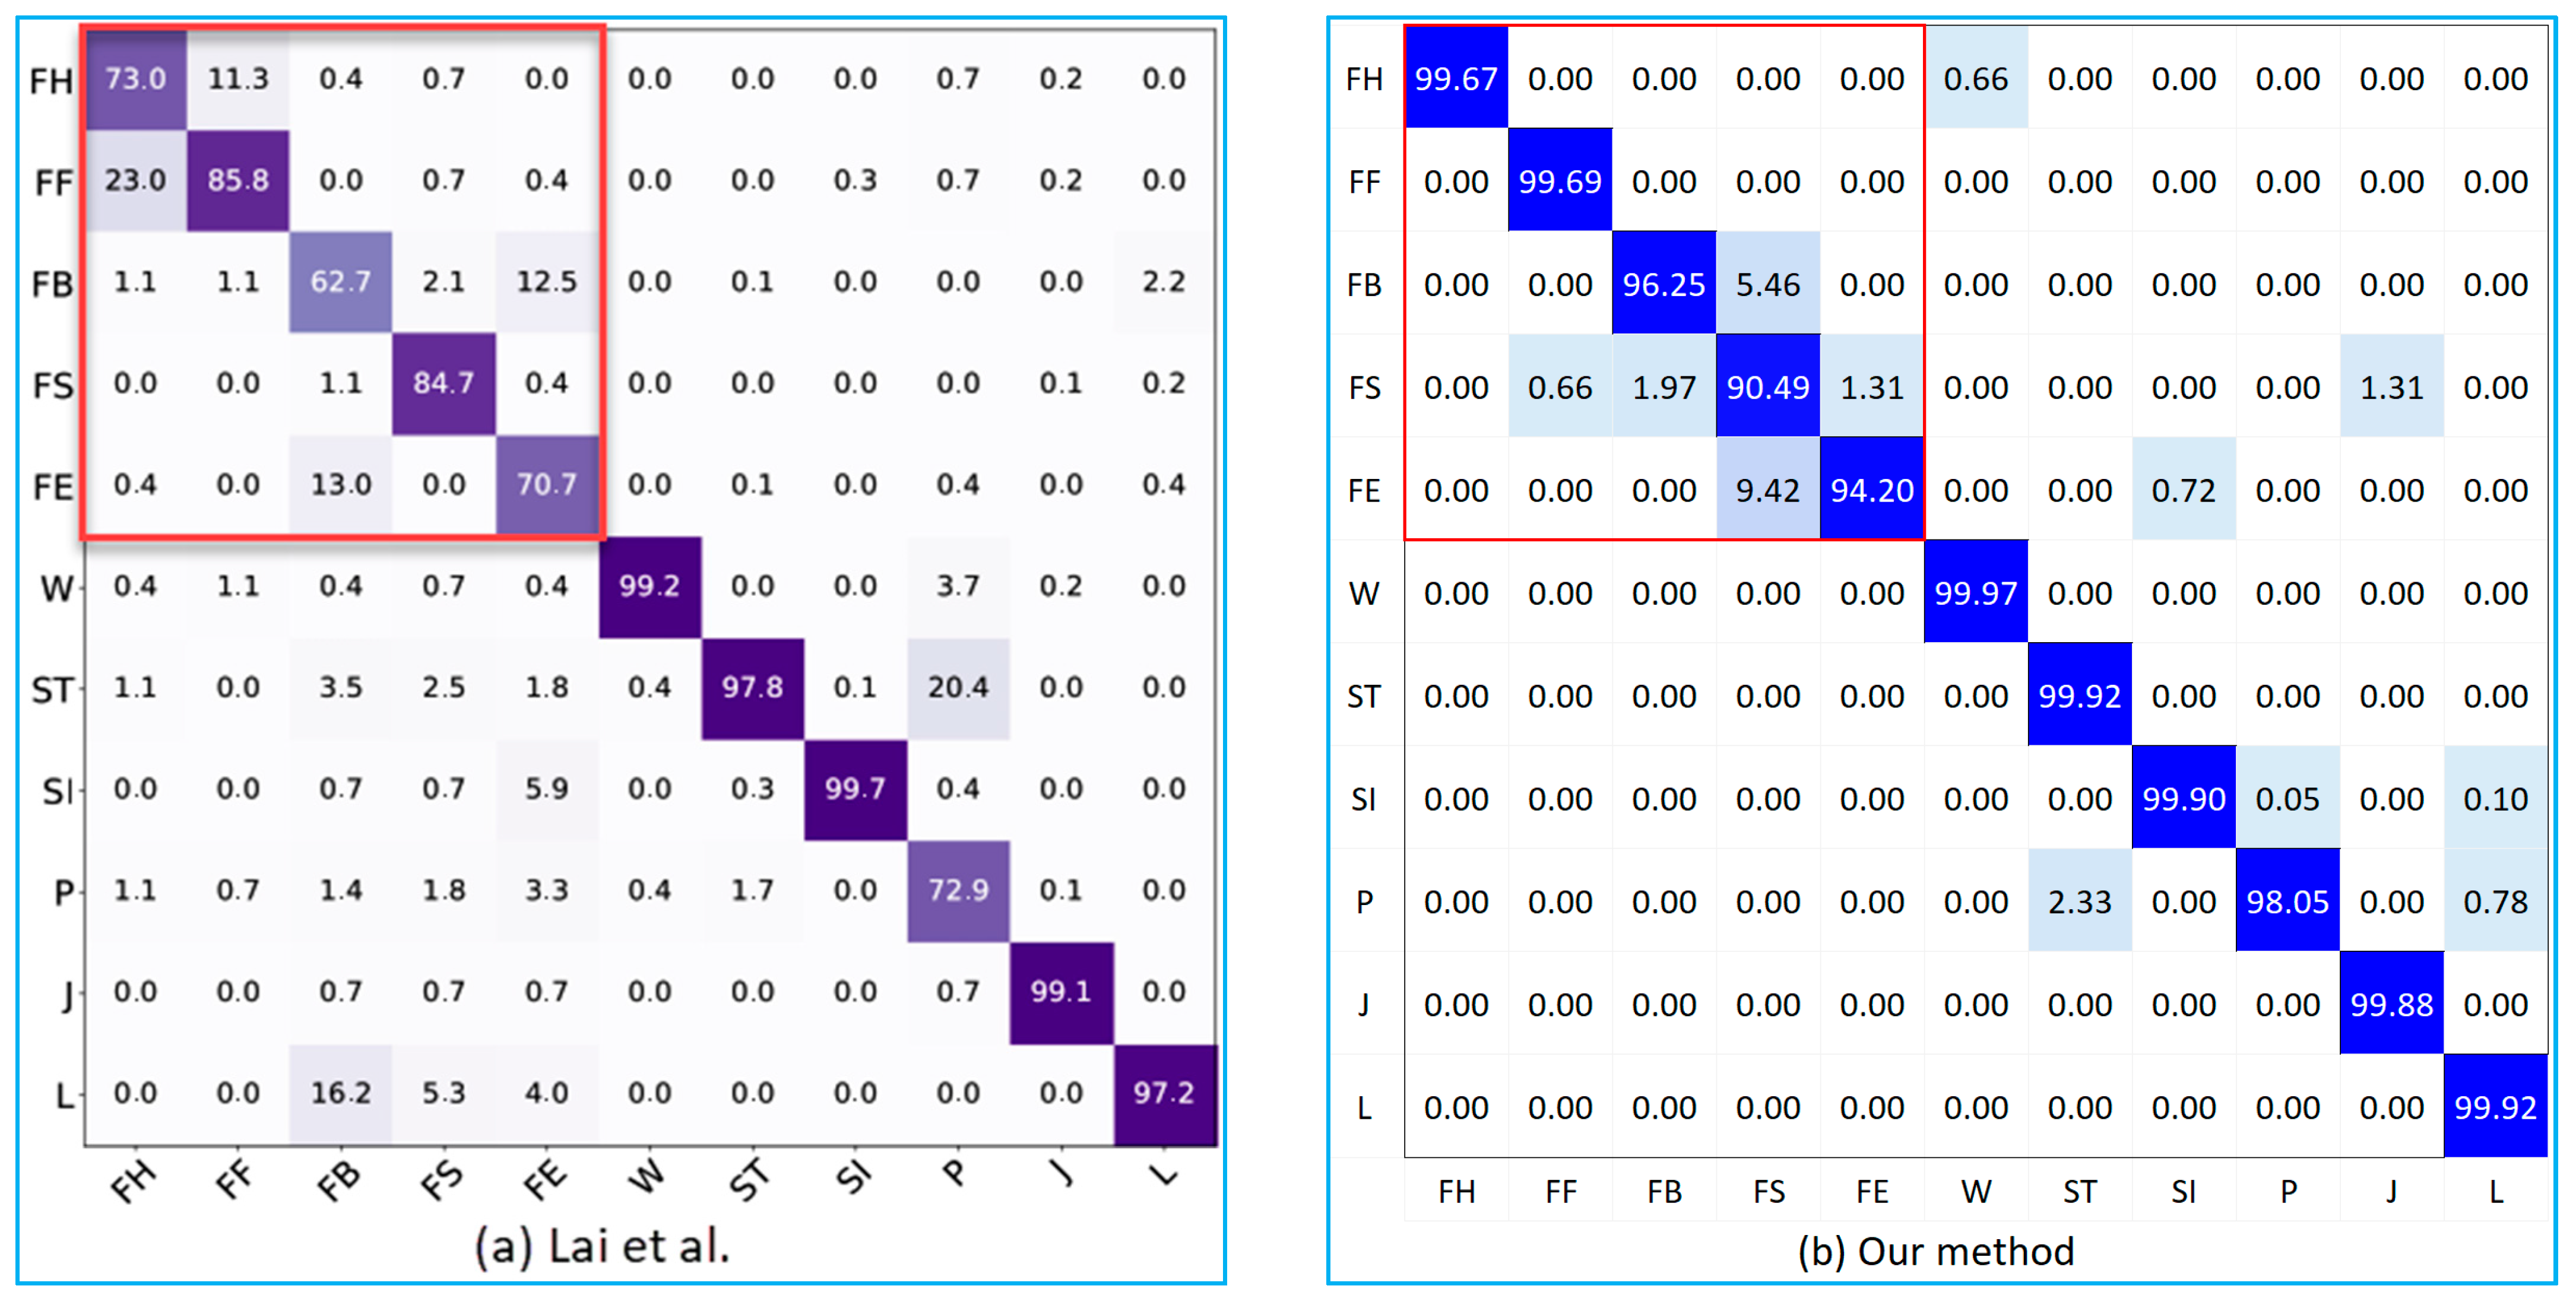
4.3.2. Research Based on UP-Fall Dataset
5. Conclusions
Author Contributions
Funding
Institutional Review Board Statement
Informed Consent Statement
Data Availability Statement
Acknowledgments
Conflicts of Interest
References
- Vavoulas, G.; Chatzaki, C.; Malliotakis, T.; Pediaditis, M.; Tsiknakis, M. The Mobiact Dataset: Recognition of Activities of Daily Living Using Smartphones. In Proceedings of the International Conference on Information and Communication Technologies for Ageing Well and e-Health, Rome, Italy, 21–22 April 2016; Volume 2, pp. 143–151. [Google Scholar]
- Martínez-Villaseñor, L.; Ponce, H.; Brieva, J.; Moya-Albor, E.; Núñez-Martínez, J.; Peñafort-Asturiano, C. UP-Fall Detection Dataset: A Multimodal Approach. Sensors 2019, 19, 1988. [Google Scholar] [CrossRef] [PubMed] [Green Version]
- Falls. Available online: https://www.who.int/news-room/fact-sheets/detail/falls (accessed on 26 November 2021).
- Ramachandran, A.; Karuppiah, A. A Survey on Recent Advances in Wearable Fall Detection Systems. BioMed Res. Int. 2020, 2020, 2167160. [Google Scholar] [CrossRef] [PubMed]
- Vallabh, P.; Malekian, R. Fall Detection Monitoring Systems: A Comprehensive Review. J. Ambient. Intell. Humaniz. Comput. 2018, 9, 1809–1833. [Google Scholar] [CrossRef]
- Mahfuz, S.; Isah, H.; Zulkernine, F.; Nicholls, P. Detecting Irregular Patterns in IoT Streaming Data for Fall Detection. In Proceedings of the 2018 IEEE 9th Annual Information Technology, Electronics and Mobile Communication Conference (IEMCON), Vancouver, BC, Canada, 1–3 November 2018; pp. 588–594. [Google Scholar]
- Xu, J.; He, Z.; Zhang, Y. CNN-LSTM Combined Network for IoT Enabled Fall Detection Applications. In Proceedings of the Journal of Physics: Conference Series, Xi’an, China, 25–27 April 2019; IOP Publishing: Bristol, UK, 2019; Volume 1267, p. 012044. [Google Scholar]
- Lai, K.; Yanushkevich, S.N.; Shmerko, V.; Hou, M. Capturing Causality and Bias in Human Action Recognition. Pattern Recognit. Lett. 2021, 147, 164–171. [Google Scholar] [CrossRef]
- Kraft, D.; Srinivasan, K.; Bieber, G. Deep Learning Based Fall Detection Algorithms for Embedded Systems, Smartwatches, and IoT Devices Using Accelerometers. Technologies 2020, 8, 72. [Google Scholar] [CrossRef]
- Santoyo-Ramón, J.A.; Casilari, E.; Cano-García, J.M. A Study of One-Class Classification Algorithms for Wearable Fall Sensors. Biosensors 2021, 11, 284. [Google Scholar] [CrossRef]
- Al Nahian, M.J.; Ghosh, T.; Al Banna, M.H.; Aseeri, M.A.; Uddin, M.N.; Ahmed, M.R.; Mahmud, M.; Kaiser, M.S. Towards an Accelerometer-Based Elderly Fall Detection System Using Cross-Disciplinary Time Series Features. IEEE Access 2021, 9, 39413–39431. [Google Scholar] [CrossRef]
- Chatzaki, C.; Pediaditis, M.; Vavoulas, G.; Tsiknakis, M. Human Daily Activity and Fall Recognition Using a Smartphone’s Acceleration Sensor. 2017. Available online: https://www.researchgate.net/publication/318548841_Human_Daily_Activity_and_Fall_Recognition_Using_a_Smartphone’s_Acceleration_Sensor (accessed on 3 March 2022).
- Wu, X.; Cheng, L.; Chu, C.-H.; Kim, J. Using Deep Learning and Smartphone for Automatic Detection of Fall and Daily Activities. In Proceedings of the International Conference on Smart Health, Shenzhen, China, 1–2 July 2019; Springer: Cham, Switzerland, 2019; pp. 61–74. [Google Scholar]
- Shi, J.; Chen, D.; Wang, M. Pre-Impact Fall Detection with CNN-Based Class Activation Mapping Method. Sensors 2020, 20, 4750. [Google Scholar] [CrossRef]
- Le, T.M.; Van Tran, L.; Dao, S.V.T. A Feature Selection Approach for Fall Detection Using Various Machine Learning Classifiers. IEEE Access 2021, 9, 115895–115908. [Google Scholar] [CrossRef]
- Hassan, M.M.; Gumaei, A.; Aloi, G.; Fortino, G.; Zhou, M. A Smartphone-Enabled Fall Detection Framework for Elderly People in Connected Home Healthcare. IEEE Netw. 2019, 33, 58–63. [Google Scholar] [CrossRef]
- Nooruddin, S.; Islam, M.M.; Sharna, F.A.; Alhetari, H.; Kabir, M.N. Sensor-Based Fall Detection Systems: A Review. J. Ambient Intell. Humaniz. Comput. 2021, 1–17. [Google Scholar] [CrossRef]
- Igual, R.; Medrano, C.; Plaza, I. A Comparison of Public Datasets for Acceleration-Based Fall Detection. Med. Eng. Phys. 2015, 37, 870–878. [Google Scholar] [CrossRef] [PubMed] [Green Version]
- Pannurat, N.; Thiemjarus, S.; Nantajeewarawat, E. A Hybrid Temporal Reasoning Framework for Fall Monitoring. IEEE Sens. J. 2017, 17, 1749–1759. [Google Scholar] [CrossRef]
- Olson, D.L.; Delen, D. Advanced Data Mining Techniques; Springer Science & Business Media: Berlin/Heidelberg, Germany, 2008. [Google Scholar]
- Bala, D.; Waliullah, G.M. Efficient Classification Techniques of Human Activities from Smartphone Sensor Data Using Machine Learning Algorithms. Available online: https://www.researchgate.net/publication/353429204_Efficient_Classification_Techniques_of_Human_Activities_from_Smartphone_Sensor_Data_using_Machine_Learning_Algorithms (accessed on 3 March 2022).
- Panhwar, M.; Shah, S.M.S.; Shah, S.M.Z.S.; Shah, S.M.; Chowdhry, B.S. Smart Phone Based Fall Detection Using Auto Regression Modeling in a Non-Restrictive Setting. Indian J. Sci. Technol. 2017, 10, e111274. [Google Scholar] [CrossRef] [Green Version]
- Khan, S.S.; Hoey, J. Review of Fall Detection Techniques: A Data Availability Perspective. Med. Eng. Phys. 2017, 39, 12–22. [Google Scholar] [CrossRef] [PubMed] [Green Version]
- Wang, H.; Li, M.; Li, J.; Cao, J.; Wang, Z. An Improved Fall Detection Approach for Elderly People Based on Feature Weight and Bayesian Classification. In Proceedings of the 2016 IEEE International Conference on Mechatronics and Automation, Harbin, China, 7–10 August 2016; pp. 471–476. [Google Scholar]
- Ma, X.; Wang, H.; Xue, B.; Zhou, M.; Ji, B.; Li, Y. Depth-Based Human Fall Detection via Shape Features and Improved Extreme Learning Machine. IEEE J. Biomed. Health Inform. 2014, 18, 1915–1922. [Google Scholar] [CrossRef]
- He, J.; Bai, S.; Wang, X. An Unobtrusive Fall Detection and Alerting System Based on Kalman Filter and Bayes Network Classifier. Sensors 2017, 17, 1393. [Google Scholar] [CrossRef]
- Tsinganos, P.; Skodras, A. A Smartphone-Based Fall Detection System for the Elderly. In Proceedings of the 10th International Symposium on Image and Signal Processing and Analysis, Ljubljana, Slovenia, 18–20 September 2017; pp. 53–58. [Google Scholar]
- Waheed, M.; Afzal, H.; Mehmood, K. NT-FDS—A Noise Tolerant Fall Detection System Using Deep Learning on Wearable Devices. Sensors 2021, 21, 2006. [Google Scholar] [CrossRef]
- Martínez-Villaseñor, L.; Ponce, H.; Perez-Daniel, K. Deep Learning for Multimodal Fall Detection. In Proceedings of the 2019 IEEE International Conference on Systems, Man and Cybernetics (SMC), Bari, Italy, 6–9 October 2019; pp. 3422–3429. [Google Scholar]
- Veltink, P.H.; Bussmann, H.J.; De Vries, W.; Martens, W.J.; Van Lummel, R.C. Detection of Static and Dynamic Activities Using Uniaxial Accelerometers. IEEE Trans. Rehabil. Eng. 1996, 4, 375–385. [Google Scholar] [CrossRef] [Green Version]
- Van Hees, V.T.; Gorzelniak, L.; Dean León, E.C.; Eder, M.; Pias, M.; Taherian, S.; Ekelund, U.; Renström, F.; Franks, P.W.; Horsch, A. Separating Movement and Gravity Components in an Acceleration Signal and Implications for the Assessment of Human Daily Physical Activity. PLoS ONE 2013, 8, e61691. [Google Scholar] [CrossRef] [Green Version]
- Bayat, A.; Pomplun, M.; Tran, D.A. A Study on Human Activity Recognition Using Accelerometer Data from Smartphones. Procedia Comput. Sci. 2014, 34, 450–457. [Google Scholar] [CrossRef] [Green Version]
- Mannini, A.; Intille, S.S.; Rosenberger, M.; Sabatini, A.M.; Haskell, W. Activity Recognition Using a Single Accelerometer Placed at the Wrist or Ankle. Med. Sci. Sports Exerc. 2013, 45, 2193. [Google Scholar] [CrossRef] [PubMed] [Green Version]
- Jiang, M.; Shang, H.; Wang, Z.; Li, H.; Wang, Y. A Method to Deal with Installation Errors of Wearable Accelerometers for Human Activity Recognition. Physiol. Meas. 2011, 32, 347. [Google Scholar] [CrossRef] [PubMed] [Green Version]
- Doherty, A.; Jackson, D.; Hammerla, N.; Plötz, T.; Olivier, P.; Granat, M.H.; White, T.; Van Hees, V.T.; Trenell, M.I.; Owen, C.G. Large Scale Population Assessment of Physical Activity Using Wrist Worn Accelerometers: The UK Biobank Study. PLoS ONE 2017, 12, e0169649. [Google Scholar] [CrossRef]
- Leutheuser, H.; Schuldhaus, D.; Eskofier, B.M. Hierarchical, Multi-Sensor Based Classification of Daily Life Activities: Comparison with State-of-the-Art Algorithms Using a Benchmark Dataset. PLoS ONE 2013, 8, e75196. [Google Scholar] [CrossRef] [Green Version]
- Anguita, D.; Ghio, A.; Oneto, L.; Parra Perez, X.; Reyes Ortiz, J.L. A Public Domain Dataset for Human Activity Recognition Using Smartphones. In Proceedings of the 21th International European Symposium on Artificial Neural Networks, Computational Intelligence and Machine Learning, Bruges, Belgium, 24–26 April 2013; pp. 437–442. [Google Scholar]
- Casale, P.; Pujol, O.; Radeva, P. Human Activity Recognition from Accelerometer Data Using a Wearable Device. In Proceedings of the Iberian Conference on Pattern Recognition and Image Analysis, Las Palmas de Gran Canaria, Spain, 8–10 June 2011; pp. 289–296. [Google Scholar]
- Ortiz, J.L.R. Smartphone-Based Human Activity Recognition. Ph.D. Thesis, Universitat Politècnica de Catalunya (UPC), Barcelona, Spain, 2014. [Google Scholar]
- Wang, J.-S.; Chuang, F.-C. An Accelerometer-Based Digital Pen with a Trajectory Recognition Algorithm for Handwritten Digit and Gesture Recognition. IEEE Trans. Ind. Electron. 2011, 59, 2998–3007. [Google Scholar] [CrossRef]
- Mathie, M.J.; Coster, A.C.F.; Lovell, N.H.; Celler, B.G. Detection of Daily Physical Activities Using a Triaxial Accelerometer. Med. Biol. Eng. Comput. 2003, 41, 296–301. [Google Scholar] [CrossRef]
- Lu, D.-N.; Nguyen, D.-N.; Nguyen, T.-H.; Nguyen, H.-N. Vehicle Mode and Driving Activity Detection Based on Analyzing Sensor Data of Smartphones. Sensors 2018, 18, 1036. [Google Scholar] [CrossRef] [Green Version]
- Hjorth, B. EEG Analysis Based on Time Domain Properties. Electroencephalogr. Clin. Neurophysiol. 1970, 29, 306–310. [Google Scholar] [CrossRef]
- Oh, S.-H.; Lee, Y.-R.; Kim, H.-N. A Novel EEG Feature Extraction Method Using Hjorth Parameter. Int. J. Electron. Electr. Eng. 2014, 2, 106–110. [Google Scholar] [CrossRef] [Green Version]
- Zheng, Z.; Du, J.; Sun, L.; Huo, M.; Chen, Y. TASG: An Augmented Classification Method for Impersonal HAR. Mob. Inf. Syst. 2018, 2018, 6751363. [Google Scholar] [CrossRef]
- Nguyen, T.-H.; Lu, D.-N.; Nguyen, D.-N.; Nguyen, H.-N. Dynamic Basic Activity Sequence Matching Method in Abnormal Driving Pattern Detection Using Smartphone Sensors. Electronics 2020, 9, 217. [Google Scholar] [CrossRef] [Green Version]


| Researchers | Dataset | Number of Types (ADLs/Falls) | Sensors | Number of Features | Feature Domains | Window Size/Window Overlapping Ratio | The Best Method | Fall Classifier Type | Measures |
|---|---|---|---|---|---|---|---|---|---|
| Chatzaki et al., 2017 [12] | MobiAct V2.0 | 12/4 | A,G | 39 | Time domain, Frequency domain | 1 s, 80% | k-NN | Multi-class | F1-score = 96.8% |
| Shi et al., 2020 [14] | MobiAct | 4/4 | A, G | raw data for CNN, 3 features for CAM | Time domain | 1 s, 50% | CNN + CAM | Binary class | ACC = 95.55% |
| Mahfuz et al., 2018 [6] | MobiAct | 9/4 | A | 58 | Time domain | 10 s | ANN | Binary class | ACC = 98.75% |
| Hassan et al., 2019 [16] | MobiAct V2.0 | 12/4 | A | 58 | Time domain | 10 s | Hybrid deep cnn-lstm | Binary class | F1 = 97% |
| Xu et al., 2019 [7] | MobiAct | 6/1 | A | raw data | 4 s | CNN-LSTM | Binary class | ACC = 98.98% | |
| Wu et al., 2019 [13] | MobiAct | 9/4 | A,G | raw data | 3.45 s | LSTM | Multi-class | ACC = 98.83% F1 = 90.33% | |
| L. Martínez-Villaseñor et al., 2019 [2] | UP-Fall (IMU) | 6/5 | A, G | 756 | Time domain, frequency domain | 1 s, 50% | ANN | Multi-class | ACC = 95.73%, F1 = 71.79% |
| Le et al., 2021 [15] | UP-Fall | 6/5 | A, L, Av, Bs | 14 | Time domain, frequency domain | k-NN + APGWO | Binary class | ACC = 99.3%, F1 = 84.79%. | |
| Lai et al., 2021 [8] | UP-Fall | 6/5 | A | raw data | Res-TCN (Adam CNN) | Binary and multi-class | ACC = 97.75% F1 = 98.68% (binary class) ACC = 94.40% F1 = 86.73% (multi-class) | ||
| Santoyo-Ramón et al., 2021 [10] | UP-Fall | 6/5 | A | 12 | Time domain, Frequency domain | SVM + Major voting ensemble | Binary class | Sen = 9.59%, Spe = 98.41% | |
| Nahian et al., 2021 [11] | UP-FALL | 6/5 | A | 39 | Time domain, Frequency domain | LR | Binary class | Sen = 100%, Spe = 99% | |
| Kraft et al., 2020 [9] | UP-FALL | 6/5 | A | 1 | Raw data | CNN using Rectifier Linear Unit | Binary class | F1 = 99% |
| Domain | Features | Definition | Applied Components |
|---|---|---|---|
| Time | µ | Mean | ax, ay, az, arms, φ, θ |
| σ2 | Variance | ax, ay, az, φ, θ | |
| σ | Standard deviation | ax, ay, az | |
| Diff = max(x)-min(x) | Difference | ax, ay, az | |
| R | Correlation | (ax, ay), (ax, az), (az, ay) | |
| ZC | Zero crossings | ax, ay, az | |
| PAR | Peak to average ratio | ax, ay, az | |
| SMA | Signal magnitude area | ax, ay, az, arms | |
| SVM | Signal vector magnitude | arms | |
| DSVM | Differential signal vector magnitude | arms | |
| I | Integration | φ, θ | |
| Frequency | EFFT | Energy | ax, ay, az, arms |
| En | Entropy | ax, ay, az | |
| Hjorth | A | Activity | arms |
| M | Mobility | arms | |
| C | Complexity | arms |
| Dataset | Year | ADLs | Falls | Subjects | Gender | Age | Height (cm) | Weight (kg) | |
|---|---|---|---|---|---|---|---|---|---|
| Male | Female | ||||||||
| MobiAct | 2016 | 12 | 4 | 67 | 48 | 19 | 20–47 | 158–193 | 50–120 |
| UpFall | 2019 | 6 | 5 | 17 | 9 | 8 | 18–24 | 157–175 | 53–99 |
| Activity | Label | Trials | Duration | Description | |
|---|---|---|---|---|---|
| Falls | Back-sitting-chair | BSC | 3 | 10 s | Fall backward while trying to sit on a chair |
| Front-knees-lying | FKL | 3 | 10 s | Fall forward from standing, the first impact on knees | |
| Forward-lying | FOL | 3 | 10 s | Fall Forward from standing, use of hands to dampen fall | |
| Sideward-lying | SDL | 3 | 10 s | Fall sidewards from standing, bending legs | |
| Daily activities | Sit to stand (chair up) | CHU | 6 | 6 s | Transition from sitting to standing |
| Car-step in | CSI | 6 | 6 s | Step in a car | |
| Car-step out | CSO | 6 | 6 s | Step out a car | |
| Jogging | JOG | 3 | 30 s | Jogging | |
| Jumping | JUM | 3 | 30 s | Continuous jumping | |
| Lying | LYI | 12 | - | Activity has taken from the lying period after a fall | |
| Stand to sit (sit on chair) | SCH | 6 | 6 s | Transition from standing to sitting | |
| Sitting on chair | SIT | 1 | 1 min | Sitting on a chair with subtle movements | |
| Standing | STD | 1 | 5 min | Standing with subtle movements | |
| Stairs down | STN | 6 | 10 s | Stairs down (10 stairs) | |
| Stairs up | STU | 6 | 10 s | Stairs up (10 stairs) | |
| Walking | WAL | 1 | 5 min | Normal walking | |
| Activity | Label | Duration (Seconds) | Description |
|---|---|---|---|
| Falls | FH | 10 | Forward using hands |
| FF | 10 | Forward using knees | |
| FB | 10 | Backward | |
| FS | 10 | Sideward | |
| FE | 10 | Attempting to sit in an empty chair | |
| Daily activities | W | 60 | Walking |
| ST | 60 | Standing | |
| SI | 60 | Sitting | |
| P | 10 | Picking up an object | |
| J | 30 | Jumping | |
| L | 60 | Laying |
| Domains | Sets of Features | Number of Features |
|---|---|---|
| Time | T | 34 |
| Frequency | F | 07 |
| Hjorth | H | 03 |
| Time + Frequency | T + F | 41 |
| Time + Hjorth | T + H | 37 |
| Time + Frequency + Hjorth | T + F + H | 44 |
| No. | Algorithms | Parameters |
|---|---|---|
| 1 | RF | Size of each bag P = 100; number of iterations I = 100; number of execution slots = 1; number of attributes to randomly investigate K = 0. |
| 2 | J48 | Set confidence threshold for pruning C = 0.25; set minimum number of instances per leaf M = 2 |
| 3 | k-NN | Number of nearest neighbors (k) used in classification K = 1; maximum number of training instances maintained. Training instances are dropped FIFO W = no window; the nearest neighbor search algorithm to use weka.core.neighboursearch.LinearNNSearch. |
| 4 | ANN | Learning rate for the backpropagation algorithm L = 0.3; momentum rate for the backpropagation algorithm M = 0.2; number of epochs to train through N = 500; percentage size of validation set to use to terminate training V = 0; the value used to seed the random number generator S = 0; the number of consecutive increases of error allowed for validation testing before training terminates, E = 20. |
| 5 | SVM | The complexity constant C = 1; the tolerance parameter L = 0.001; the epsilon for round-off error. P = 1.0 × 10⁻¹²; whether to 0 = normalize/1 = standardize/2 = neither N = 0 = normalize; the number of folds for the internal cross-validation V = −1, use training data. |
| Activity | Code | Classifier | |||||
|---|---|---|---|---|---|---|---|
| ANN | J48 | k-NN | RF | SVM | |||
| Falls | Back-sitting-chair | BSC | 0.681 | 0.822 | 0.862 | 0.940 | 0.524 |
| Front-knees-lying | FKL | 0.610 | 0.832 | 0.878 | 0.939 | 0.491 | |
| Forward-lying | FOL | 0.542 | 0.818 | 0.869 | 0.932 | 0.458 | |
| Sideward-lying | SDL | 0.715 | 0.848 | 0.921 | 0.935 | 0.672 | |
| Daily activities | Sit to stand | CHU | 0.664 | 0.845 | 0.815 | 0.946 | 0.550 |
| Car step in | CSI | 0.847 | 0.814 | 0.900 | 0.929 | 0.726 | |
| Car step out | CSO | 0.904 | 0.941 | 0.920 | 0.979 | 0.838 | |
| Jogging | JOG | 0.990 | 0.984 | 0.996 | 0.995 | 0.978 | |
| Jumping | JUM | 0.996 | 0.991 | 0.999 | 0.999 | 0.988 | |
| Lying | LYI | 0.779 | 0.953 | 0.859 | 0.987 | 0.431 | |
| Stand to sit | SCH | 0.725 | 0.833 | 0.882 | 0.945 | 0.625 | |
| Sitting on chair | SIT | 0.889 | 0.983 | 0.99 | 0.998 | 0.714 | |
| Standing | STD | 0.991 | 0.995 | 0.995 | 0.997 | 0.982 | |
| Stairs down | STN | 0.850 | 0.846 | 0.902 | 0.924 | 0.726 | |
| Stairs up | STU | 0.865 | 0.854 | 0.903 | 0.94 | 0.771 | |
| Walking | WAL | 0.992 | 0.990 | 0.995 | 0.996 | 0.977 | |
| Weighted Avg. (F1-Score) | W.Avg. | 0.938 | 0.958 | 0.971 | 0.983 | 0.901 | |
| Activity | Code | Classifier | |||||
|---|---|---|---|---|---|---|---|
| ANN | J48 | k-NN | RF | SVM | |||
| Falls | Falling forward using hands | FH | 0.961 | 0.971 | 0.860 | 0.970 | 0.644 |
| Falling forward using knees | FF | 0.742 | 0.939 | 0.811 | 0.961 | 0.316 | |
| Falling backwards | FB | 0.800 | 0.857 | 0.808 | 0.907 | 0.725 | |
| Falling sideward | FS | 0.771 | 0.792 | 0.753 | 0.811 | 0.383 | |
| Falling sitting in empty chair | FE | 0.813 | 0.874 | 0.824 | 0.891 | 0.612 | |
| Daily activities | Walking | W | 0.978 | 0.998 | 0.993 | 0.999 | 0.884 |
| Standing | ST | 0.97 | 0.995 | 0.993 | 0.999 | 0.893 | |
| Sitting | SI | 0.972 | 0.988 | 0.988 | 0.998 | 0.949 | |
| Picking up an object | P | 0.854 | 0.962 | 0.918 | 1.000 | 0.674 | |
| Jumping | J | 0.948 | 0.997 | 0.97 | 0.997 | 0.644 | |
| Laying | L | 0.987 | 0.993 | 0.995 | 0.998 | 0.975 | |
| Weighted Avg. (F1-Score) | W.Avg. | 0.963 | 0.987 | 0.978 | 0.993 | 0.875 | |
| Activity (The MobiAct Dataset) | Code | F1-score | |
|---|---|---|---|
| Falls | Back-sitting-chair | BSC | 94.92% |
| Front-knees-lying | FKL | 95.58% | |
| Forward-lying | FOL | 95.28% | |
| Sideward-lying | SDL | 95.14% | |
| Weighted Average of falls | 95.23% | ||
| Daily activities | Sit to stand | CHU | 95.18% |
| Car step in | CSI | 94.75% | |
| Car step out | CSO | 98.33% | |
| Jogging | JOG | 99.49% | |
| Jumping | JUM | 99.91% | |
| Lying | LYI | 98.84% | |
| Stand to sit | SCH | 96.61% | |
| Sitting on chair | SIT | 99.84% | |
| Standing | STD | 99.96% | |
| Stairs down | STN | 95.02% | |
| Stairs up | STU | 95.50% | |
| Walking | WAL | 99.62% | |
| Weighted Average of non-falls | 99.11% | ||
| Weighted Average of all activities | 98.79% | ||
| Activity (The UP-Fall Dataset) | Code | F1-Score | |
|---|---|---|---|
| Falls | Falling forward using hands | FH | 99.67% |
| Falling forward using knees | FF | 99.69% | |
| Falling backwards | FB | 96.25% | |
| Falling sideward | FS | 90.49% | |
| Falling sitting in empty chair | FE | 94.20% | |
| Weighted Average of falls | 96.16% | ||
| Daily activities | Walking | W | 99.97% |
| Standing | ST | 99.92% | |
| Sitting | SI | 99.90% | |
| Picking up an object | P | 98.05% | |
| Jumping | J | 99.88% | |
| Laying | L | 99.92% | |
| Weighted Average of non-falls | 99.90% | ||
| Weighted Average of all activities | 99.60% | ||
Publisher’s Note: MDPI stays neutral with regard to jurisdictional claims in published maps and institutional affiliations. |
© 2022 by the authors. Licensee MDPI, Basel, Switzerland. This article is an open access article distributed under the terms and conditions of the Creative Commons Attribution (CC BY) license (https://creativecommons.org/licenses/by/4.0/).
Share and Cite
Le, H.-L.; Nguyen, D.-N.; Nguyen, T.-H.; Nguyen, H.-N. A Novel Feature Set Extraction Based on Accelerometer Sensor Data for Improving the Fall Detection System. Electronics 2022, 11, 1030. https://doi.org/10.3390/electronics11071030
Le H-L, Nguyen D-N, Nguyen T-H, Nguyen H-N. A Novel Feature Set Extraction Based on Accelerometer Sensor Data for Improving the Fall Detection System. Electronics. 2022; 11(7):1030. https://doi.org/10.3390/electronics11071030
Chicago/Turabian StyleLe, Hong-Lam, Duc-Nhan Nguyen, Thi-Hau Nguyen, and Ha-Nam Nguyen. 2022. "A Novel Feature Set Extraction Based on Accelerometer Sensor Data for Improving the Fall Detection System" Electronics 11, no. 7: 1030. https://doi.org/10.3390/electronics11071030