
Cross-Day EEG-Based Emotion Recognition Using Transfer Component Analysis


Abstract
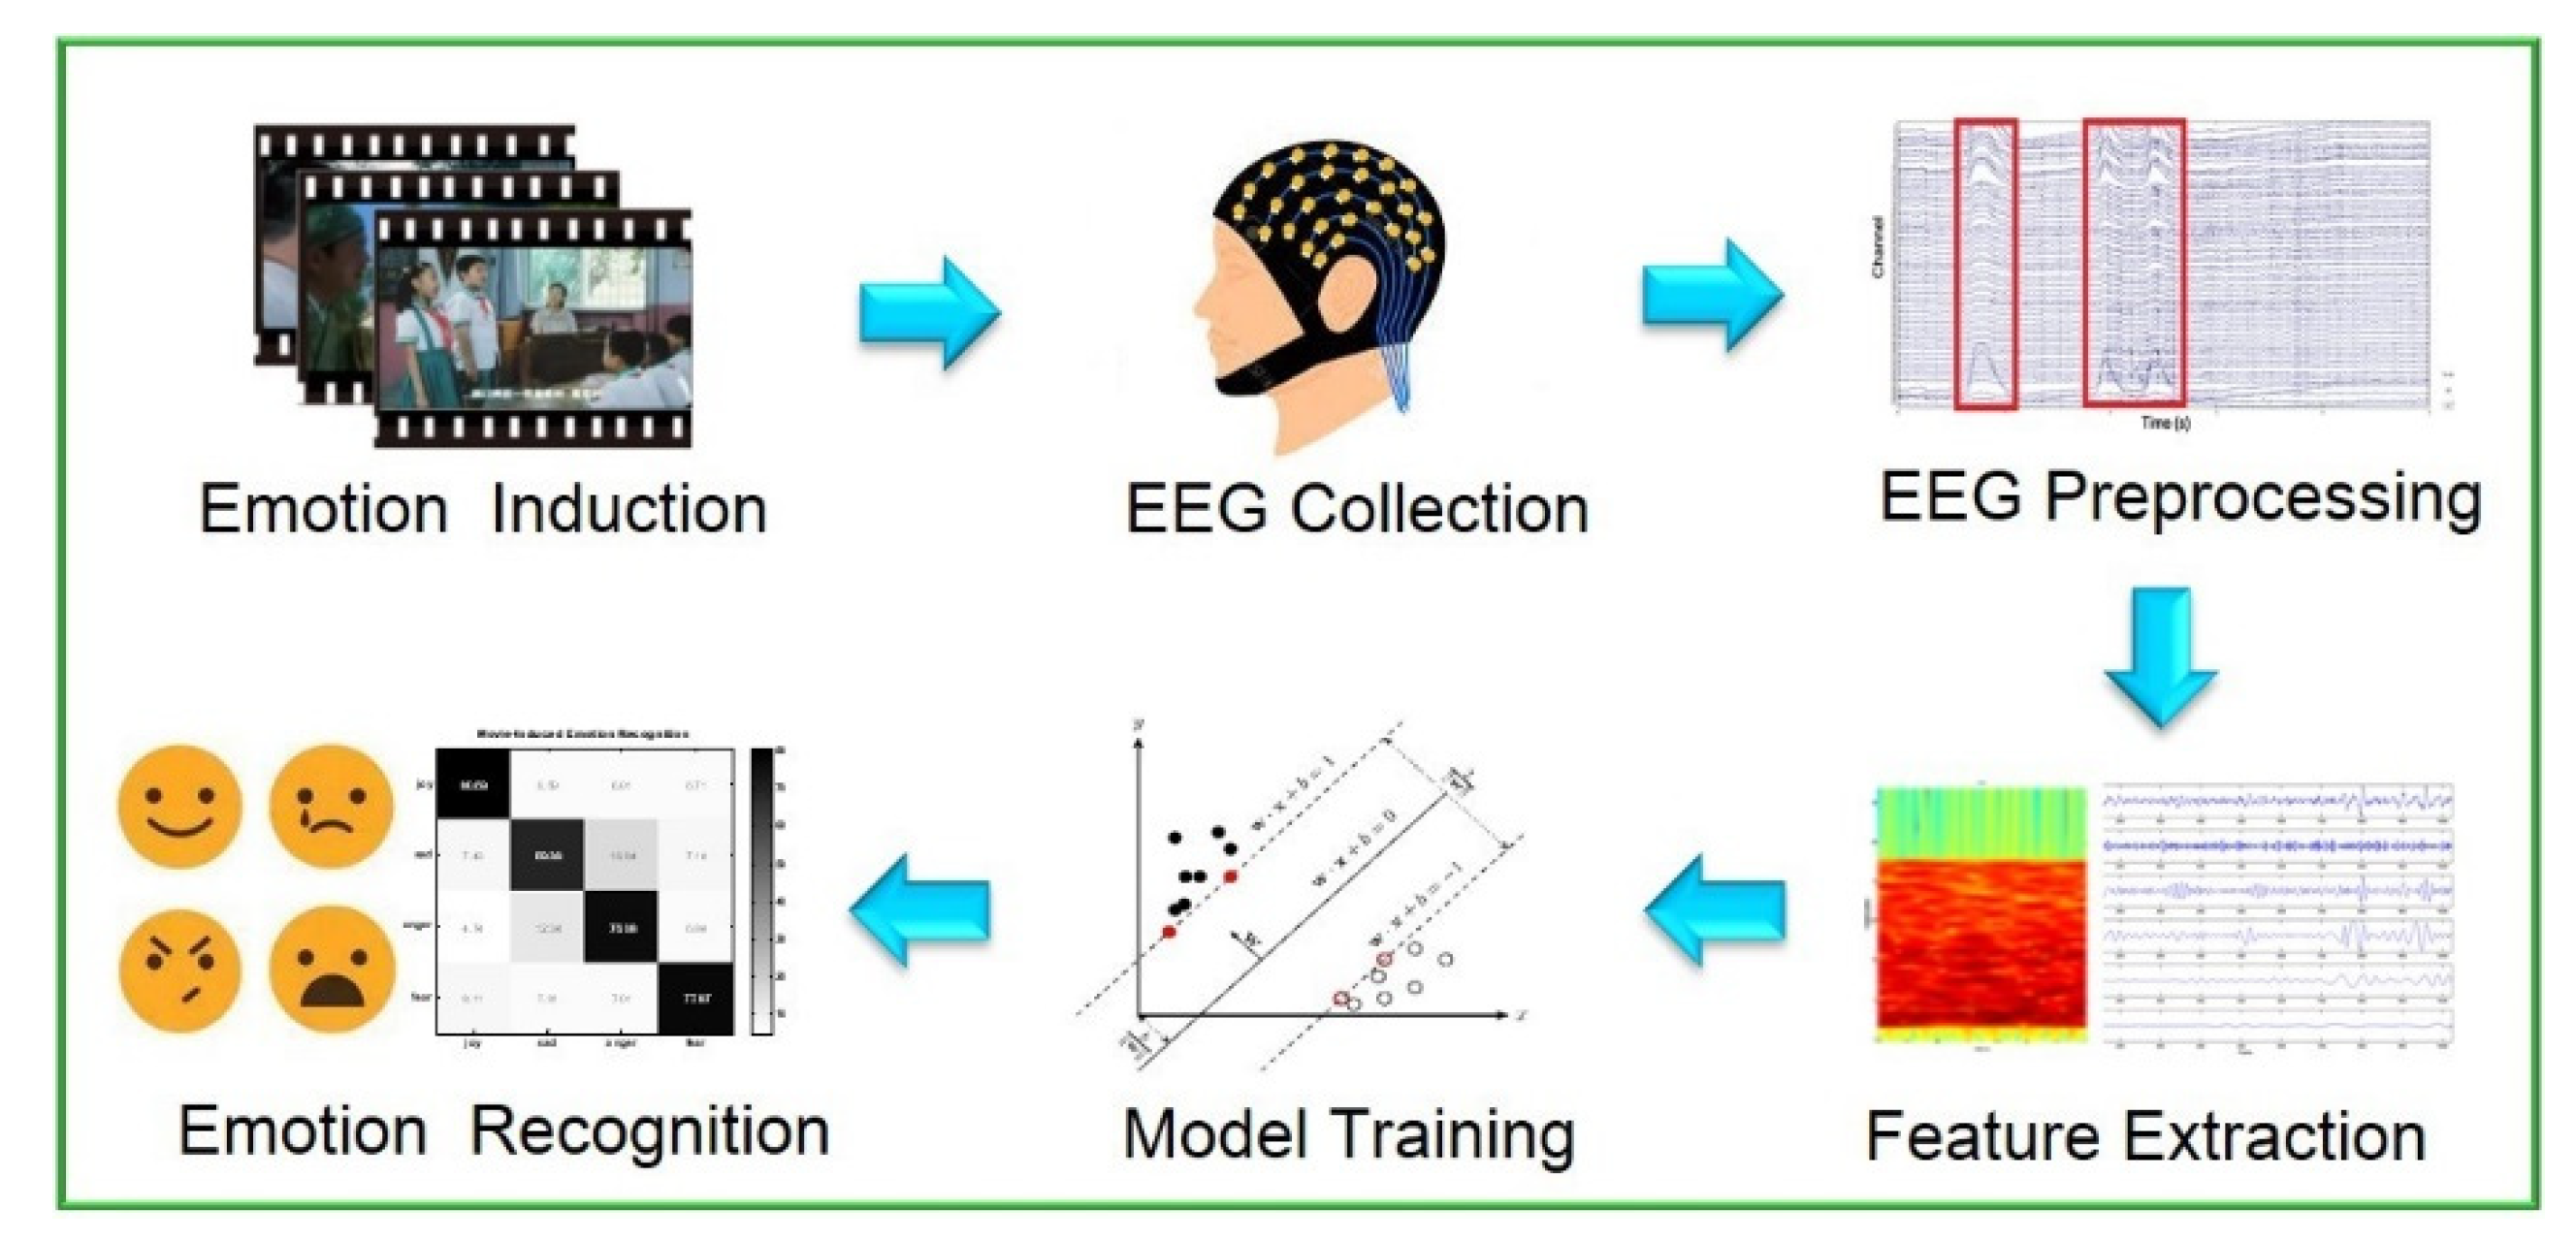
:1. Introduction
2. Materials and Methods
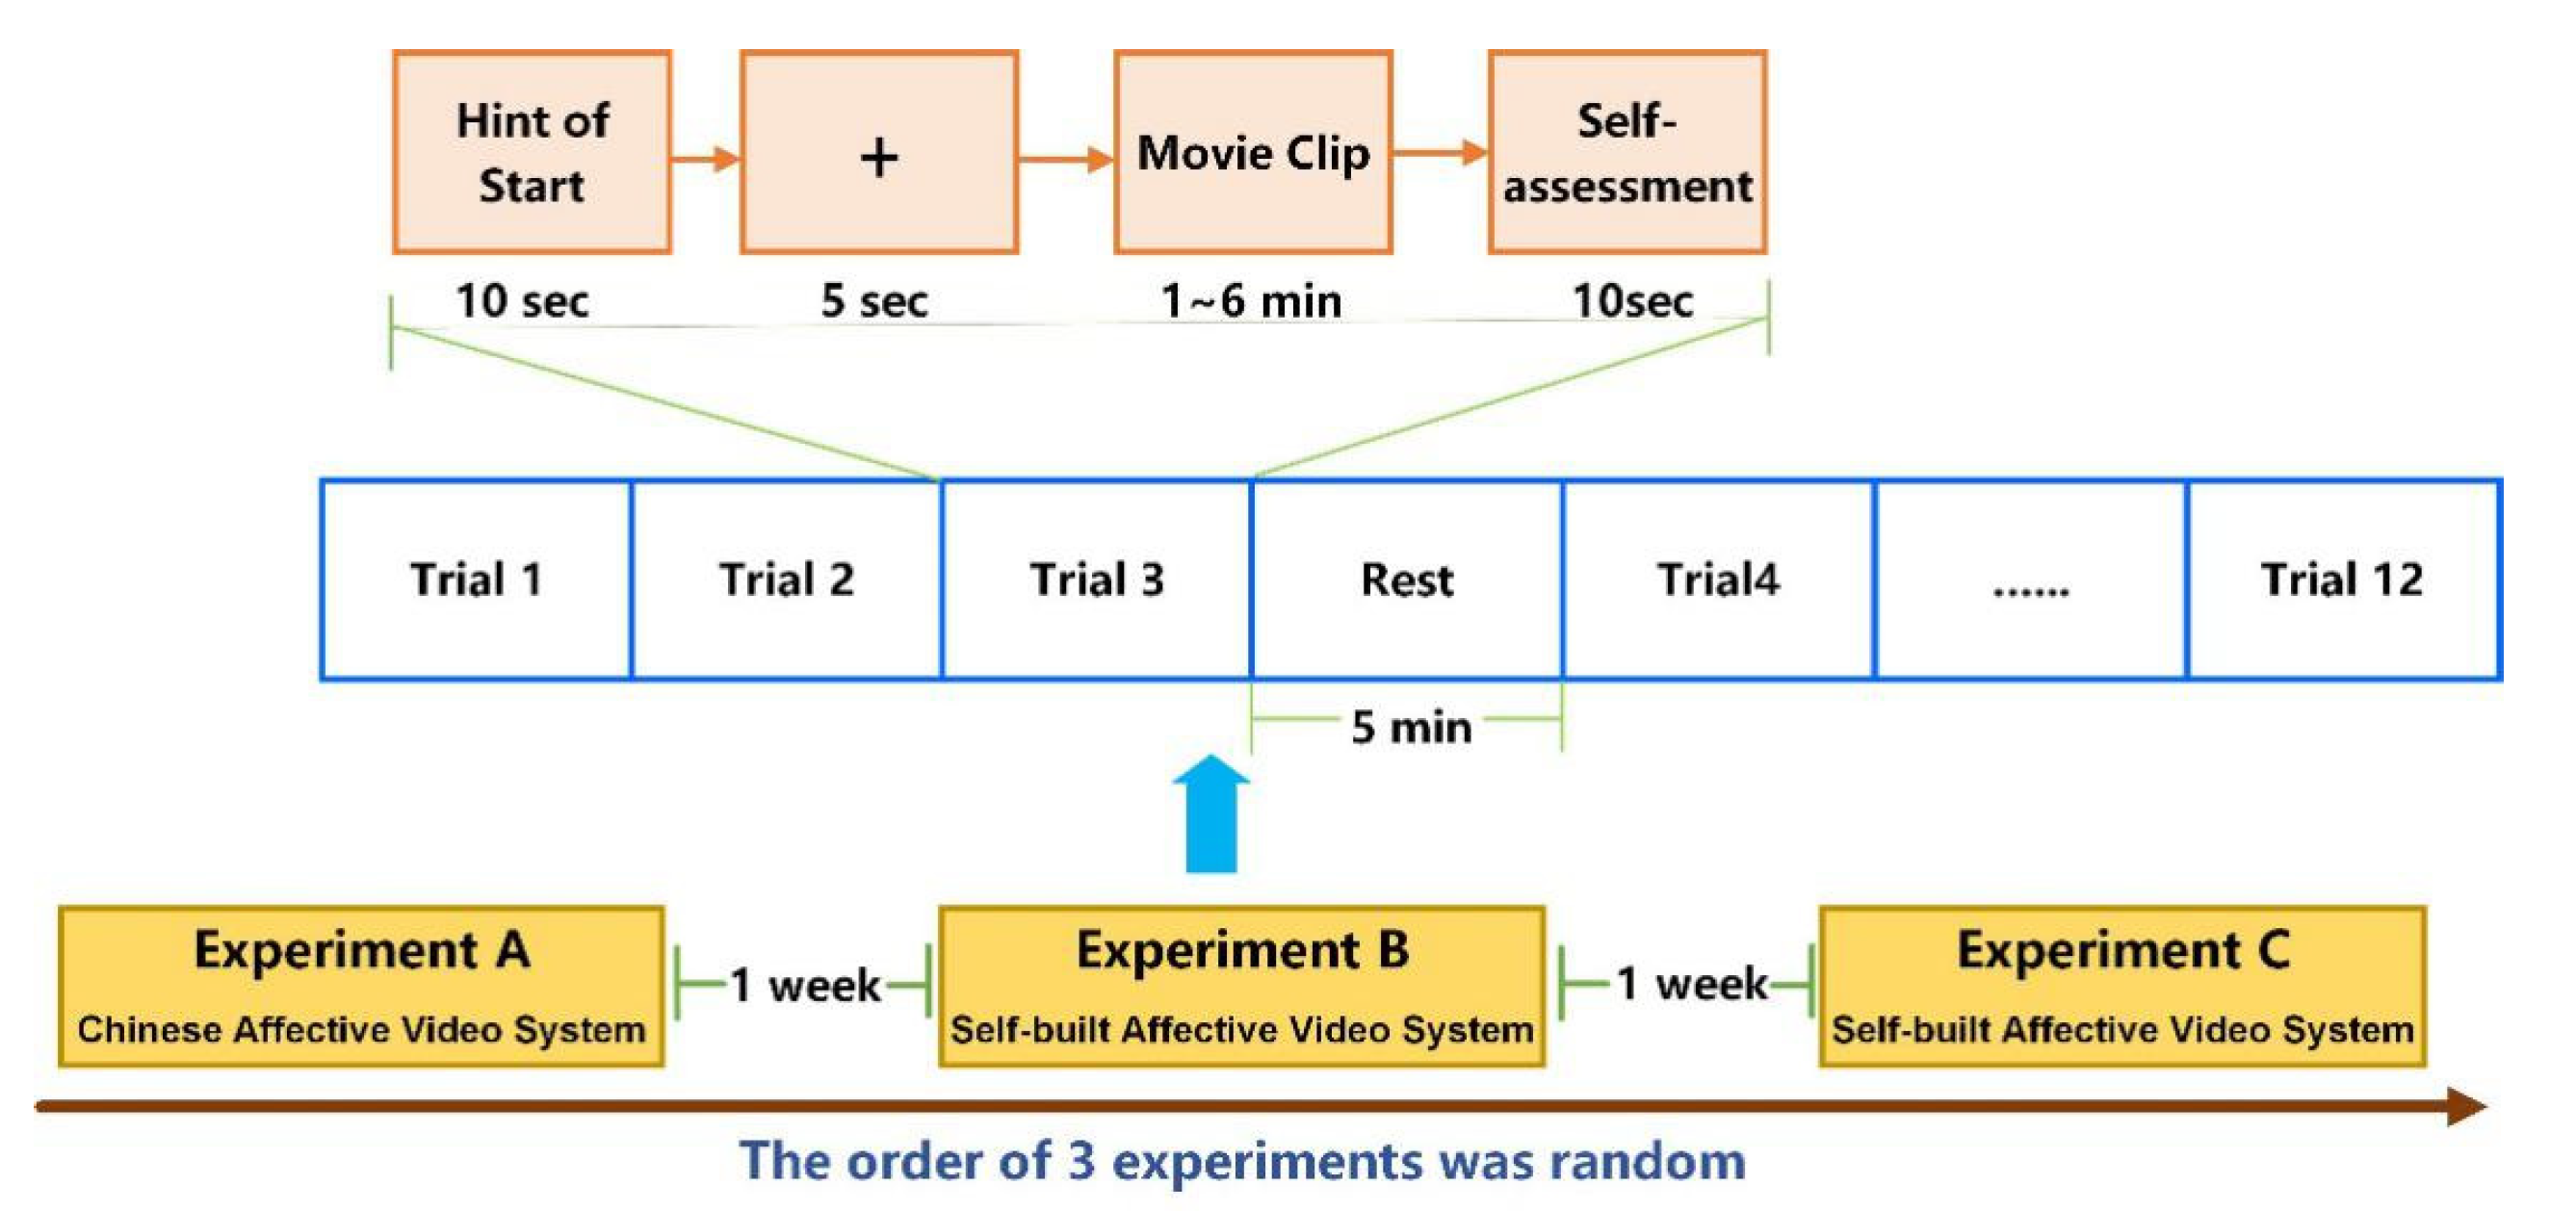
2.1. Experimental Design
- Before the movie clip starts, there will be a 10-s hint to inform the subject of the number of the current movie clip.
- Present the white fixation cross on a black background for 5 s.
- Play the emotion stimulus movie clips.
- The subject will self-assess the valence and arousal of the movie clips with reference to the Self-Assessment Manikin (SAM) scale. The valence scale ranges from 1(extremely unpleasant) to 9(extremely pleasant); and the arousal scale ranges from 1 (calm) to 9 (extremely excited), and the subject will click the corresponding numbers on the keyboard to directly input the ratings.
2.2. Data Collection
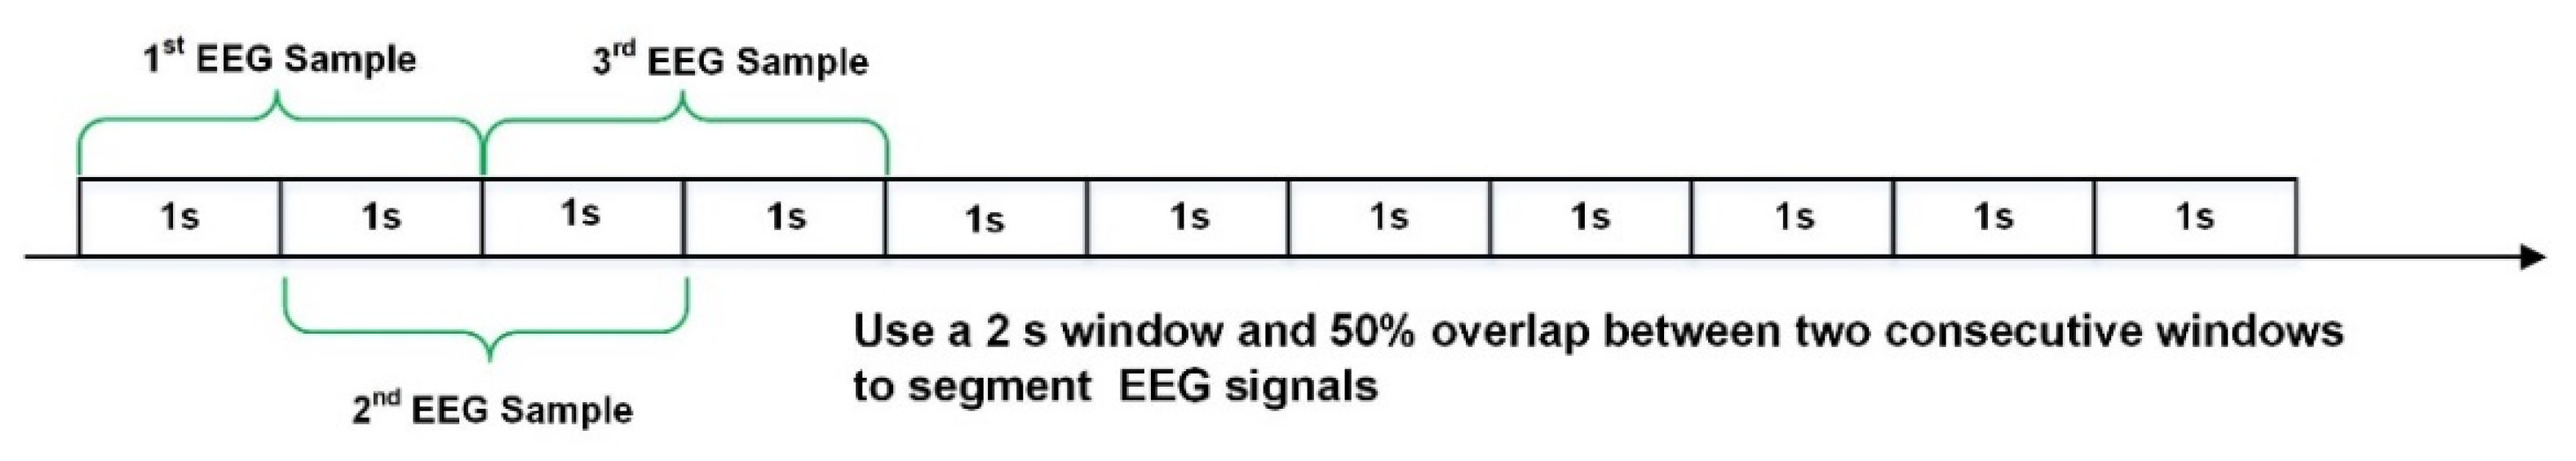
2.3. Data Preprocessing
- Data extraction. Extracted the EEG data corresponding to the film clips being played (Pre-stimulus duration was 5 s, and post-stimulus duration was that of the video stimulus material).
- Bad channel averaging. Checked for corrupted channels where no EEG data had been collected, and replaced the data from the corrupted channel with the average data from the adjacent channels.
- Artifact removal. EEG was decomposed into independent components using ICA algorithm to remove artifacts such as EOG, EMG, and ECG, and then reconstructed to obtain an artifact-free EEG signal.
- Signal filtering. The signal passed through a bandpass filter of 0.1–64 Hz.
- Baseline correction. The baseline correction was performed 5 s before watching the movie stimulus.
2.4. Transfer Component Analysis
2.5. Emotion Recognition
- Intra-day case
- Cross-day case
3. Results
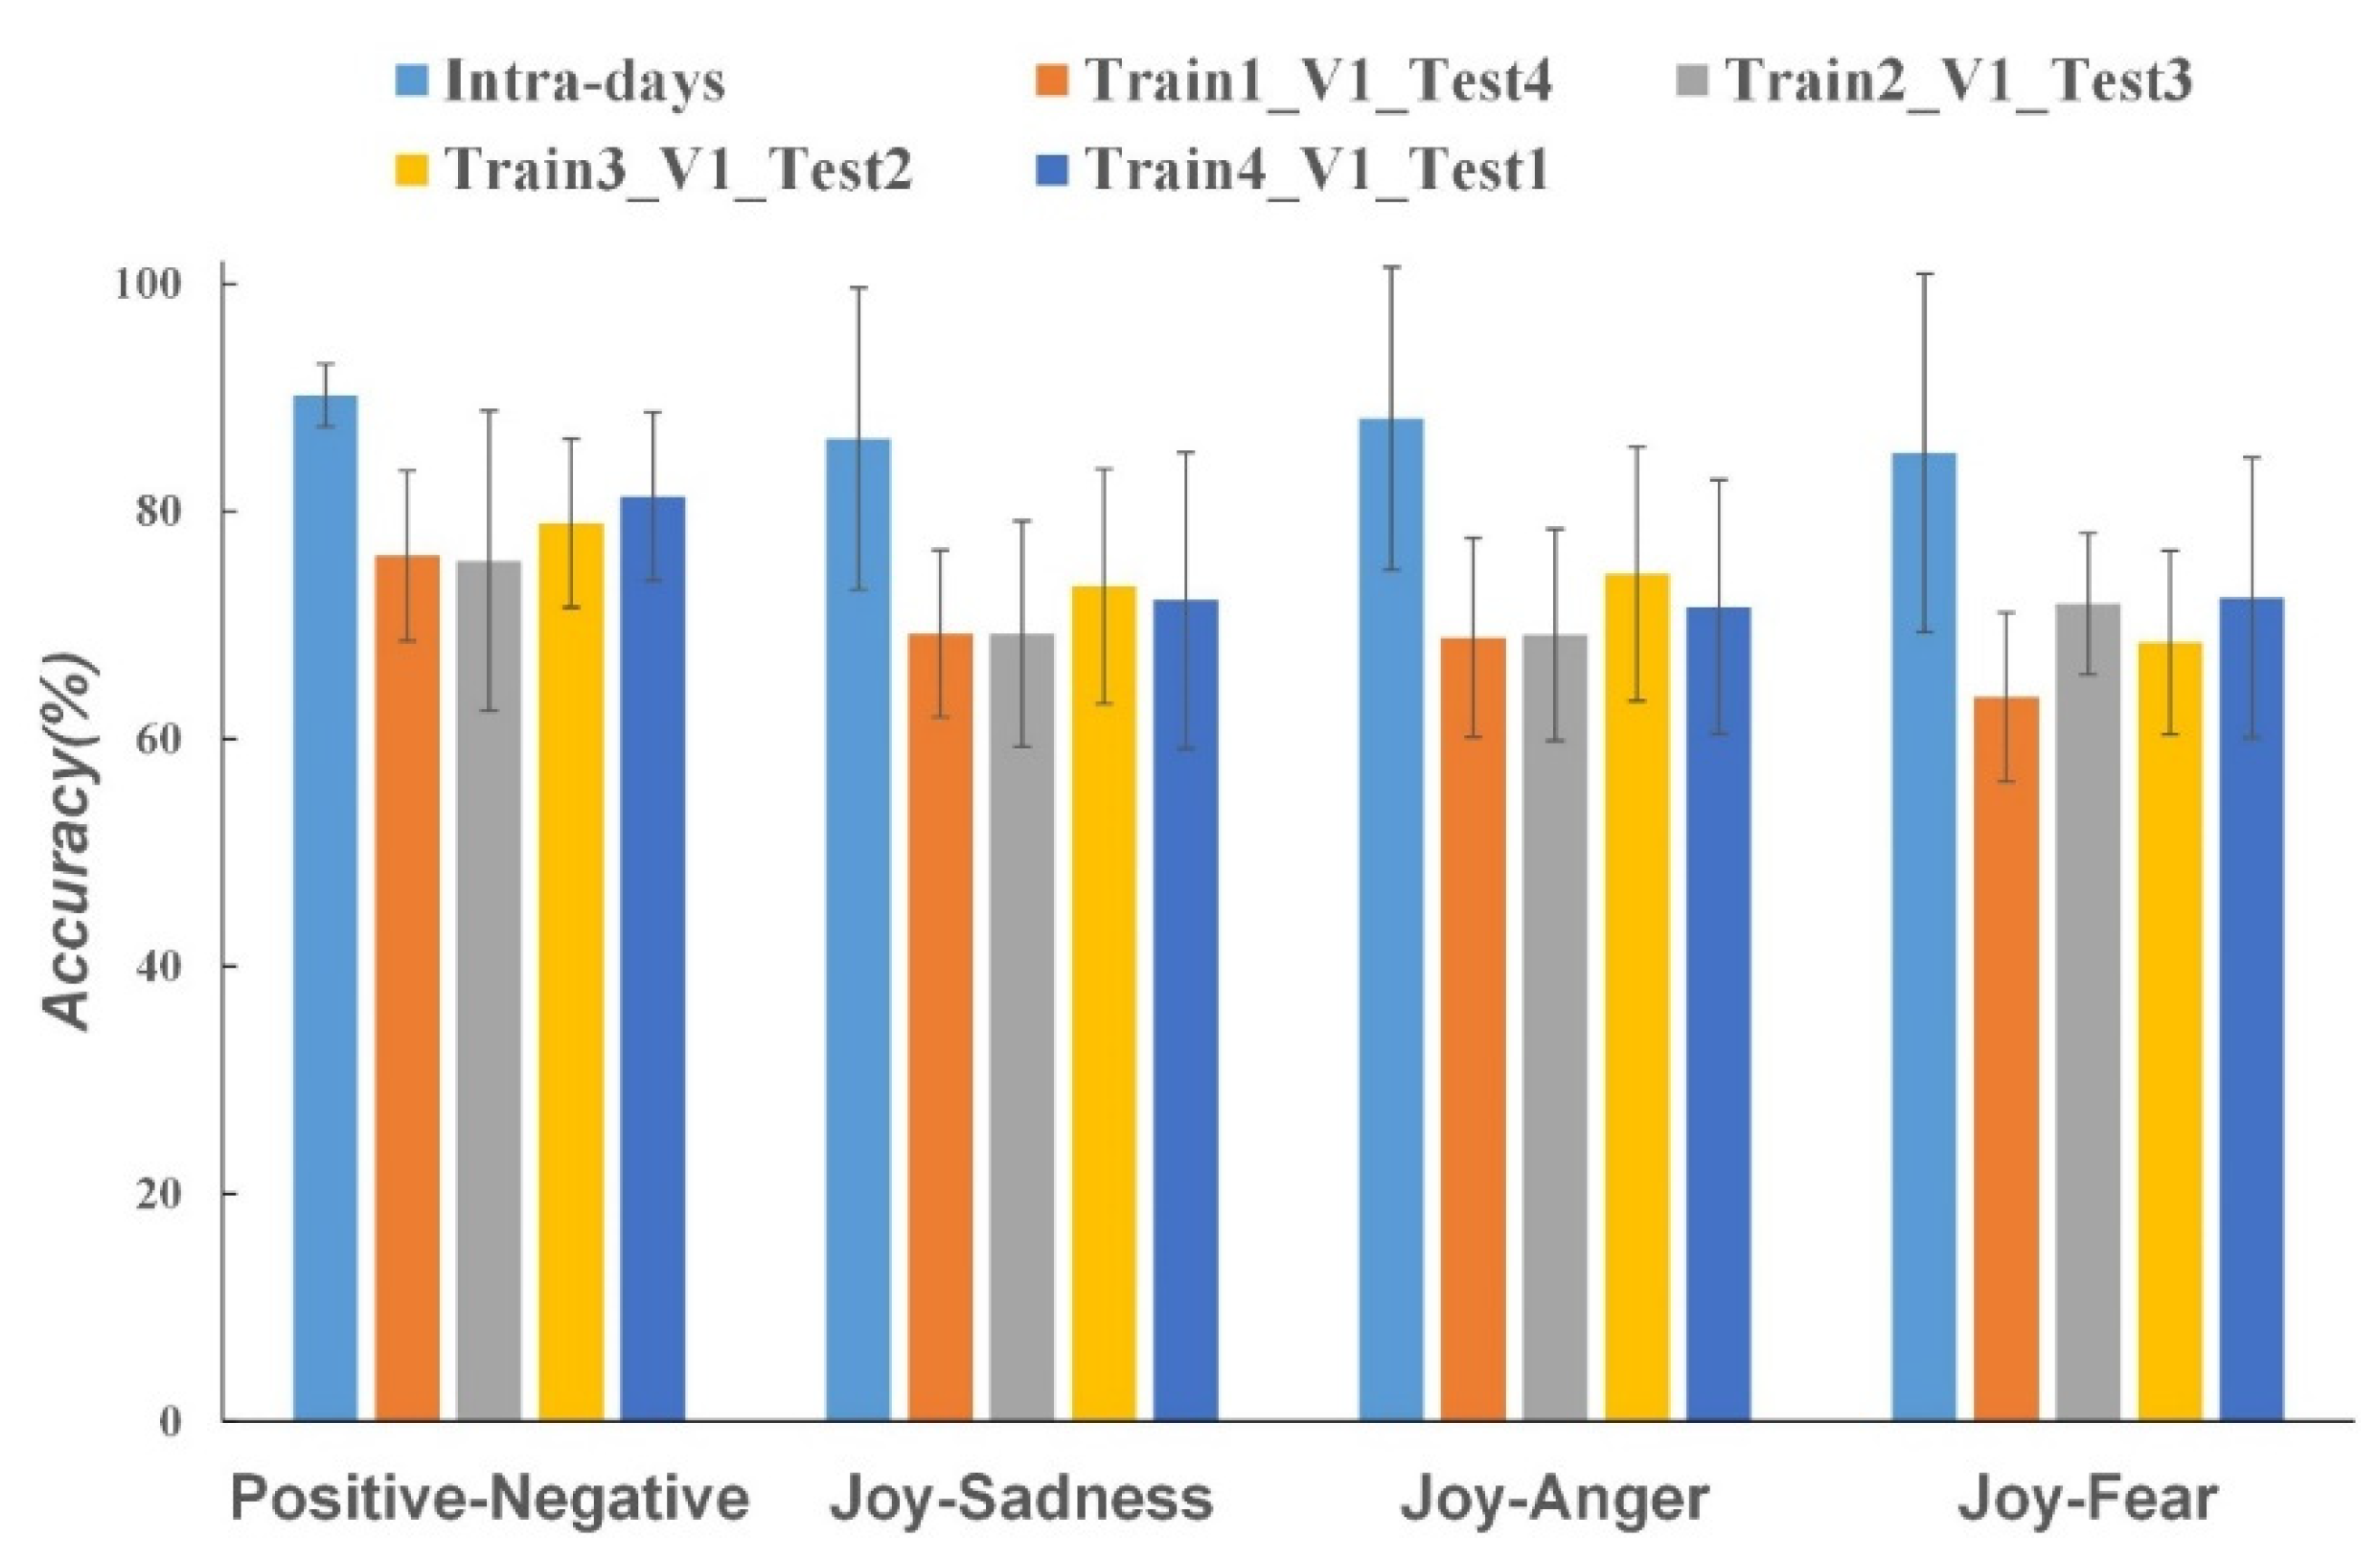
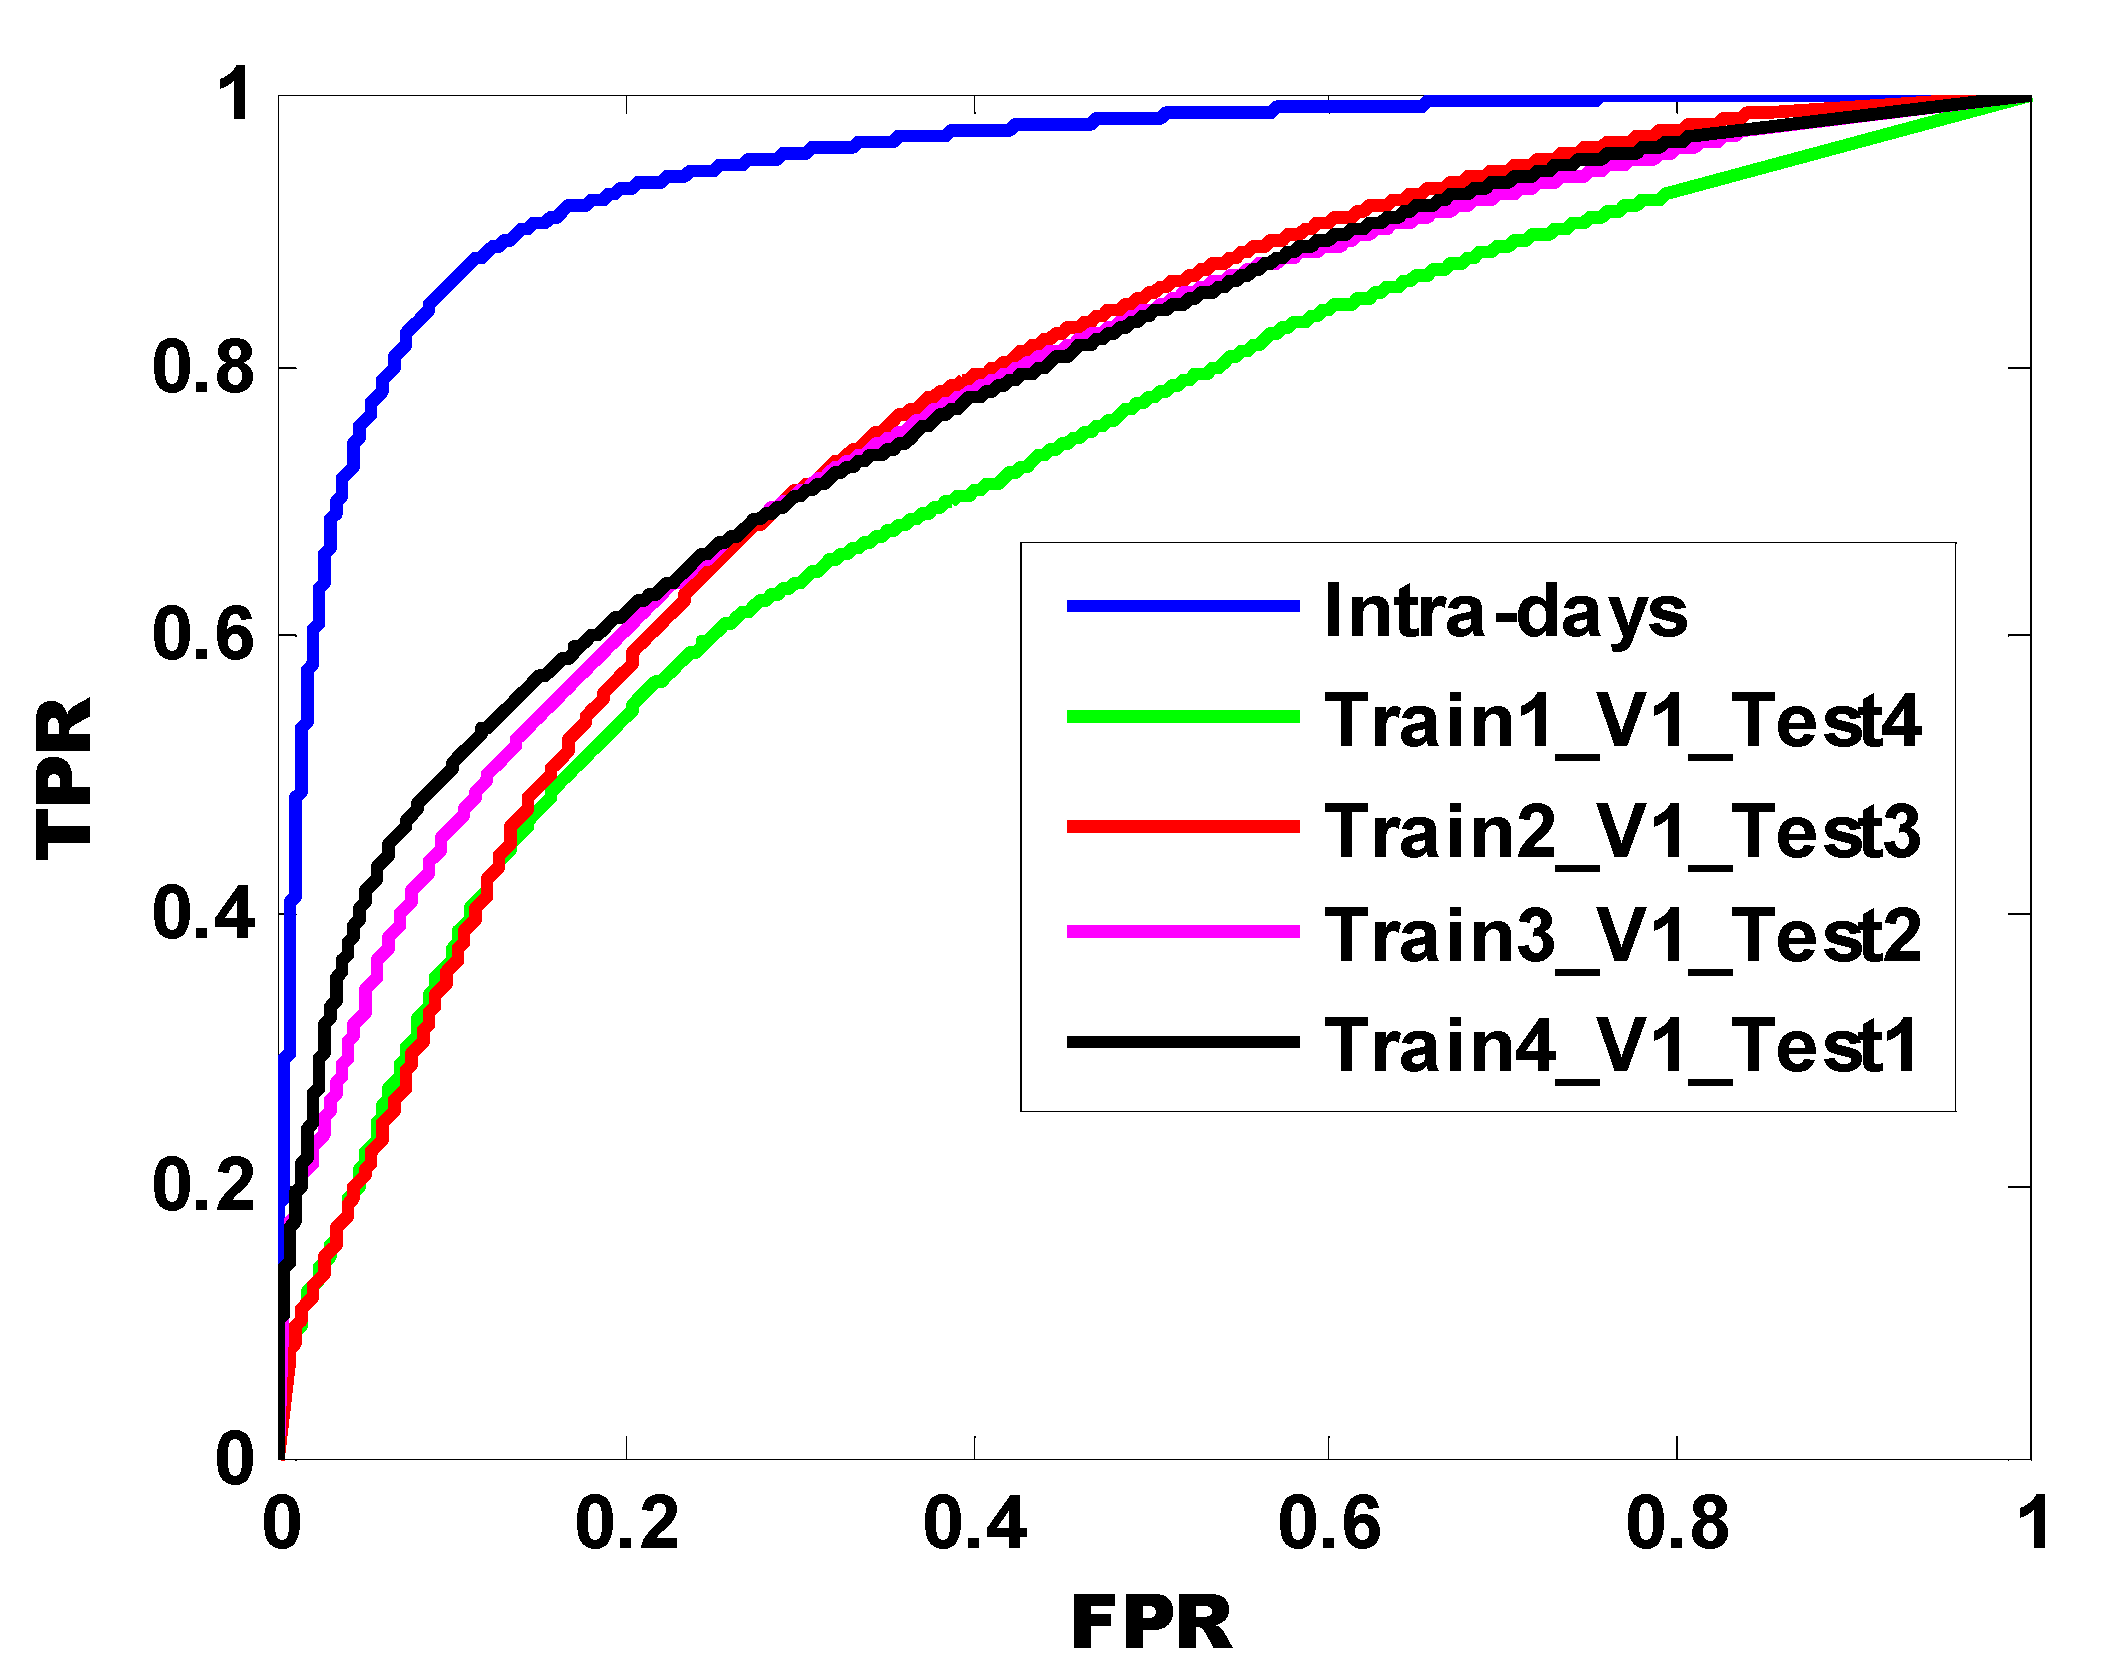
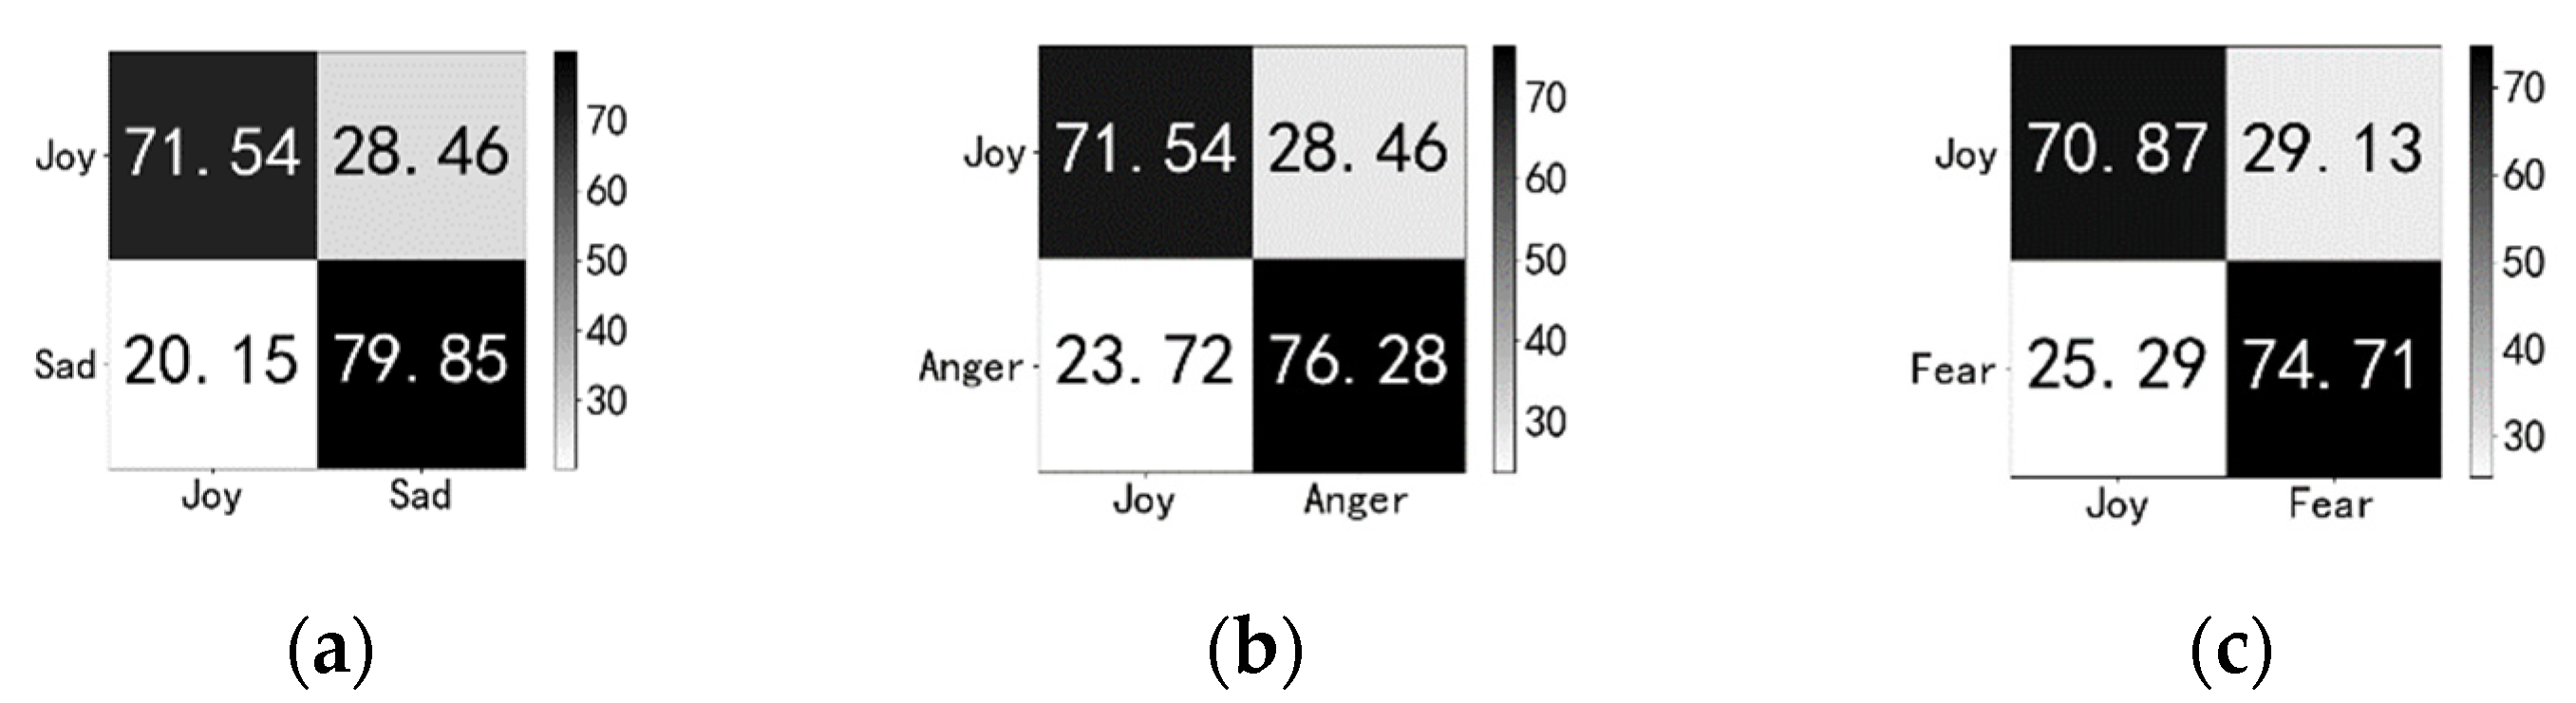
3.1. Cross-Day and Intra-Day Emotion Recognition
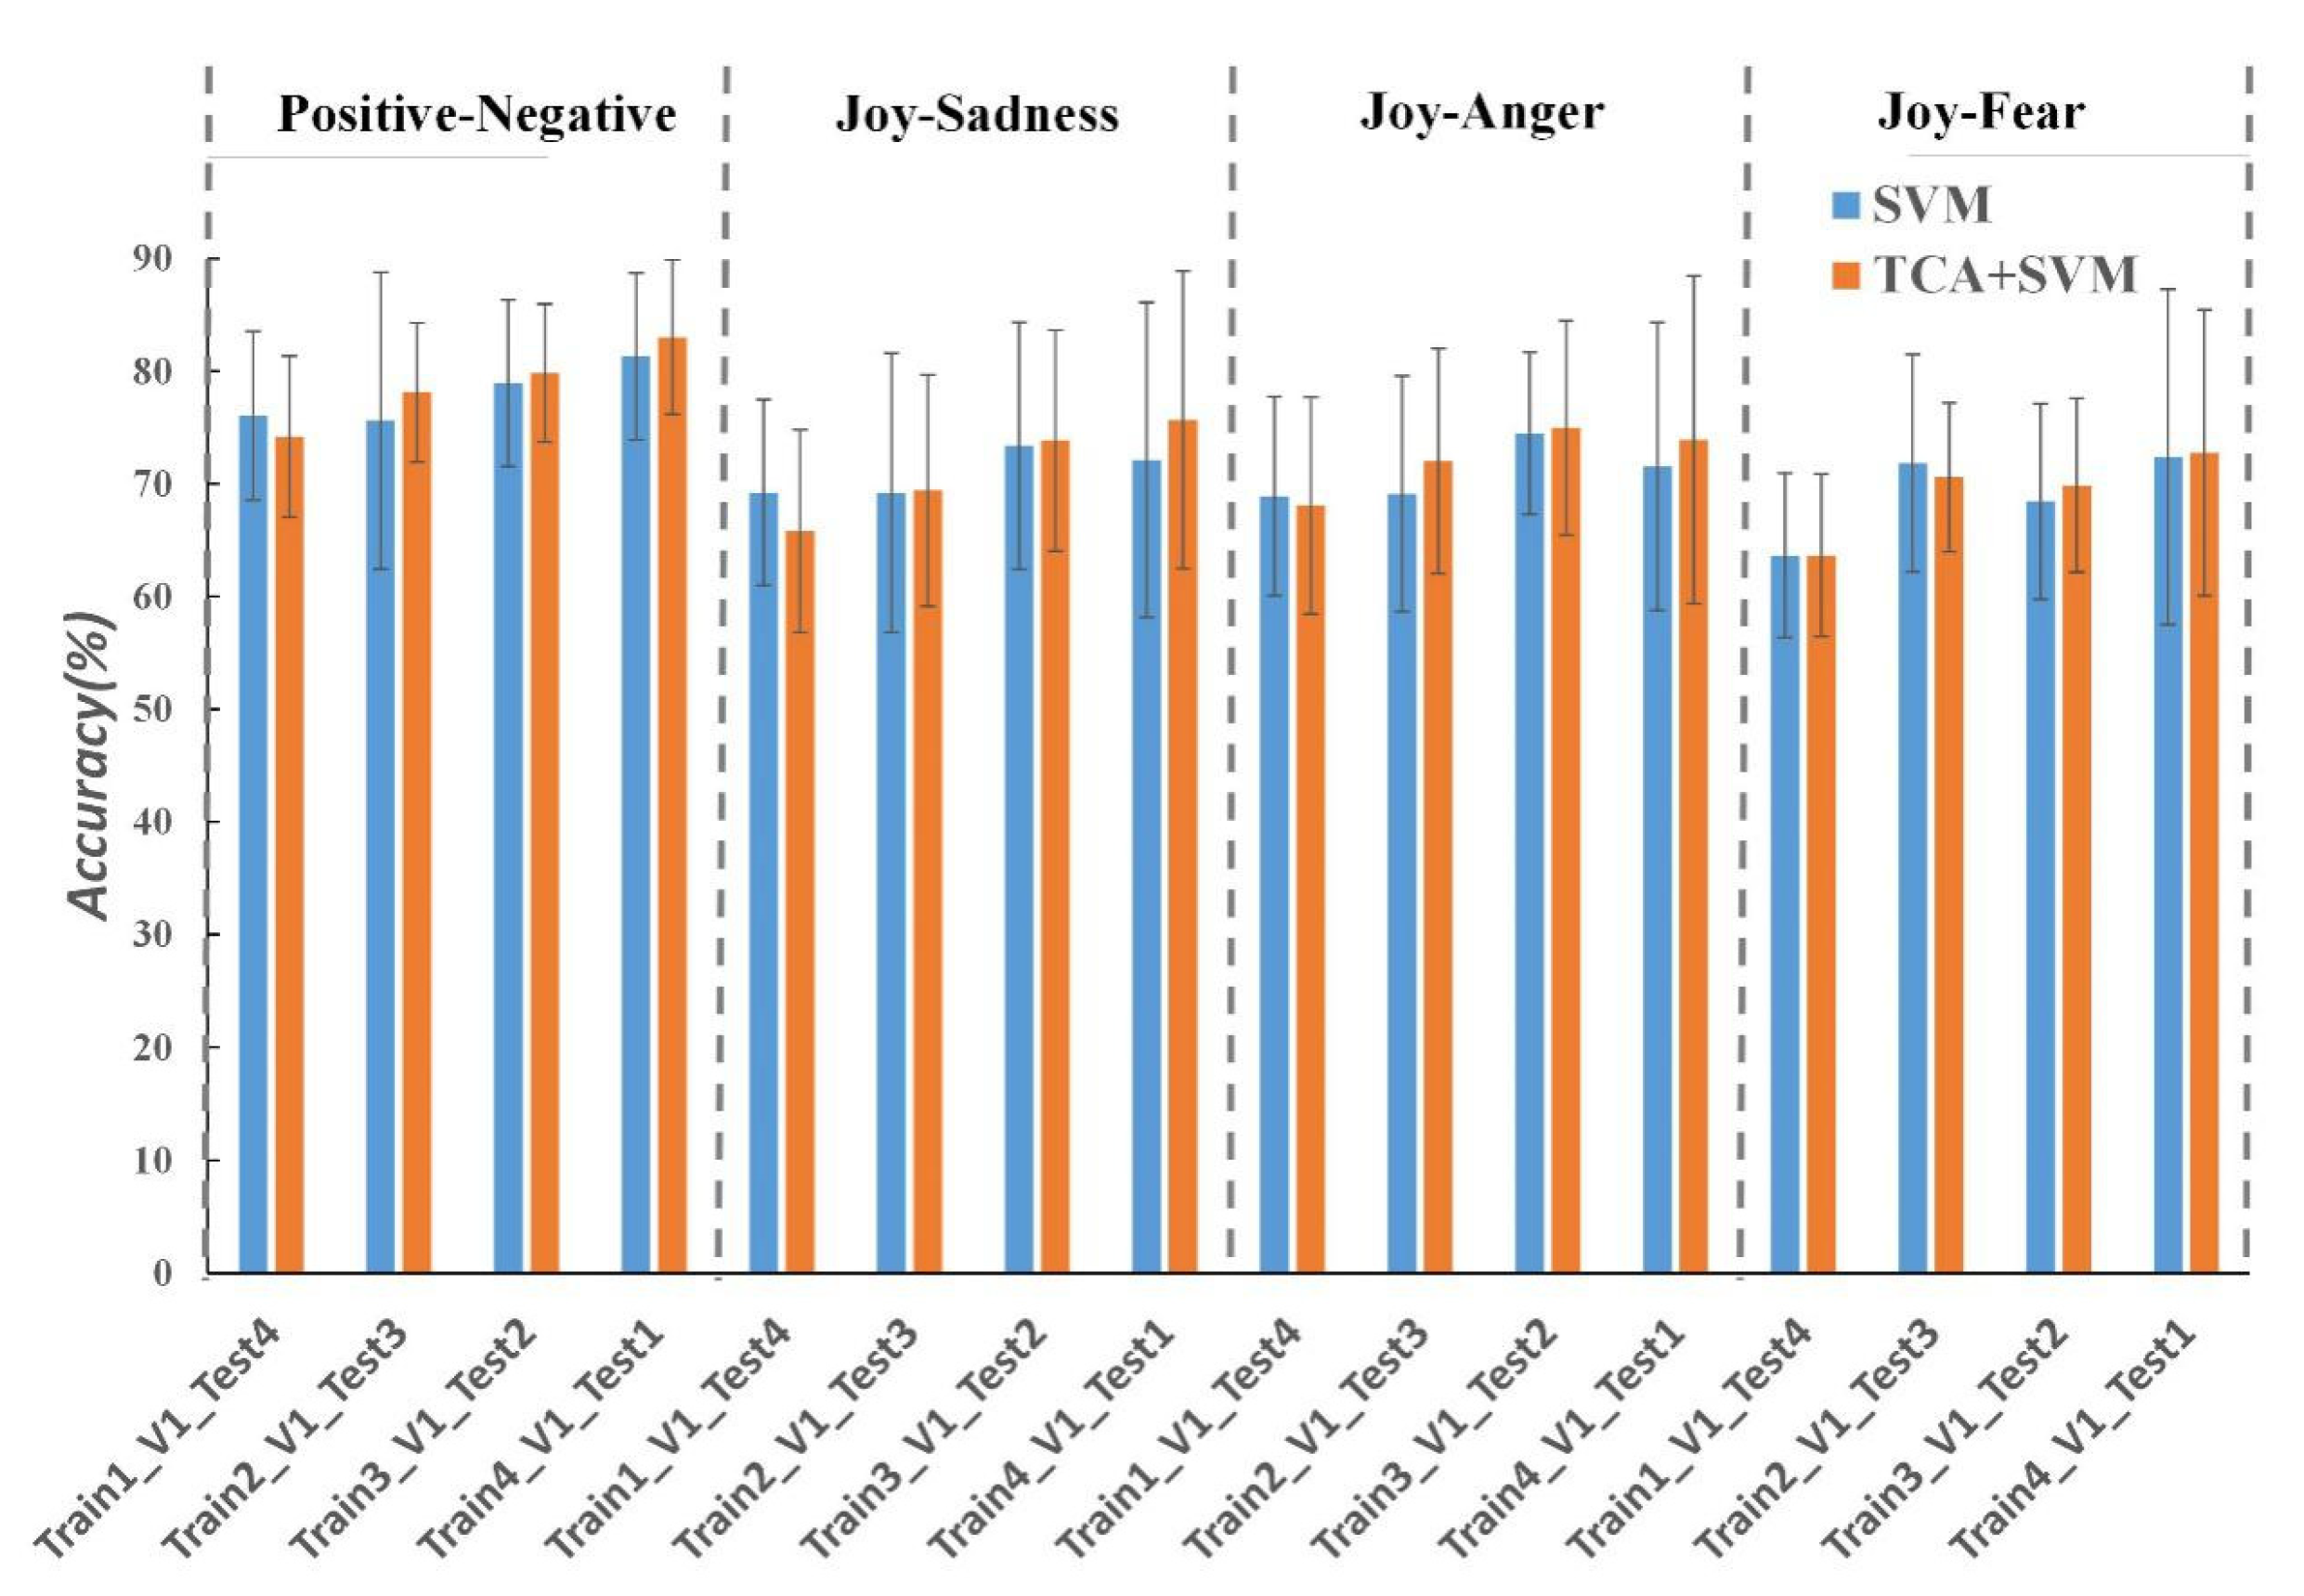
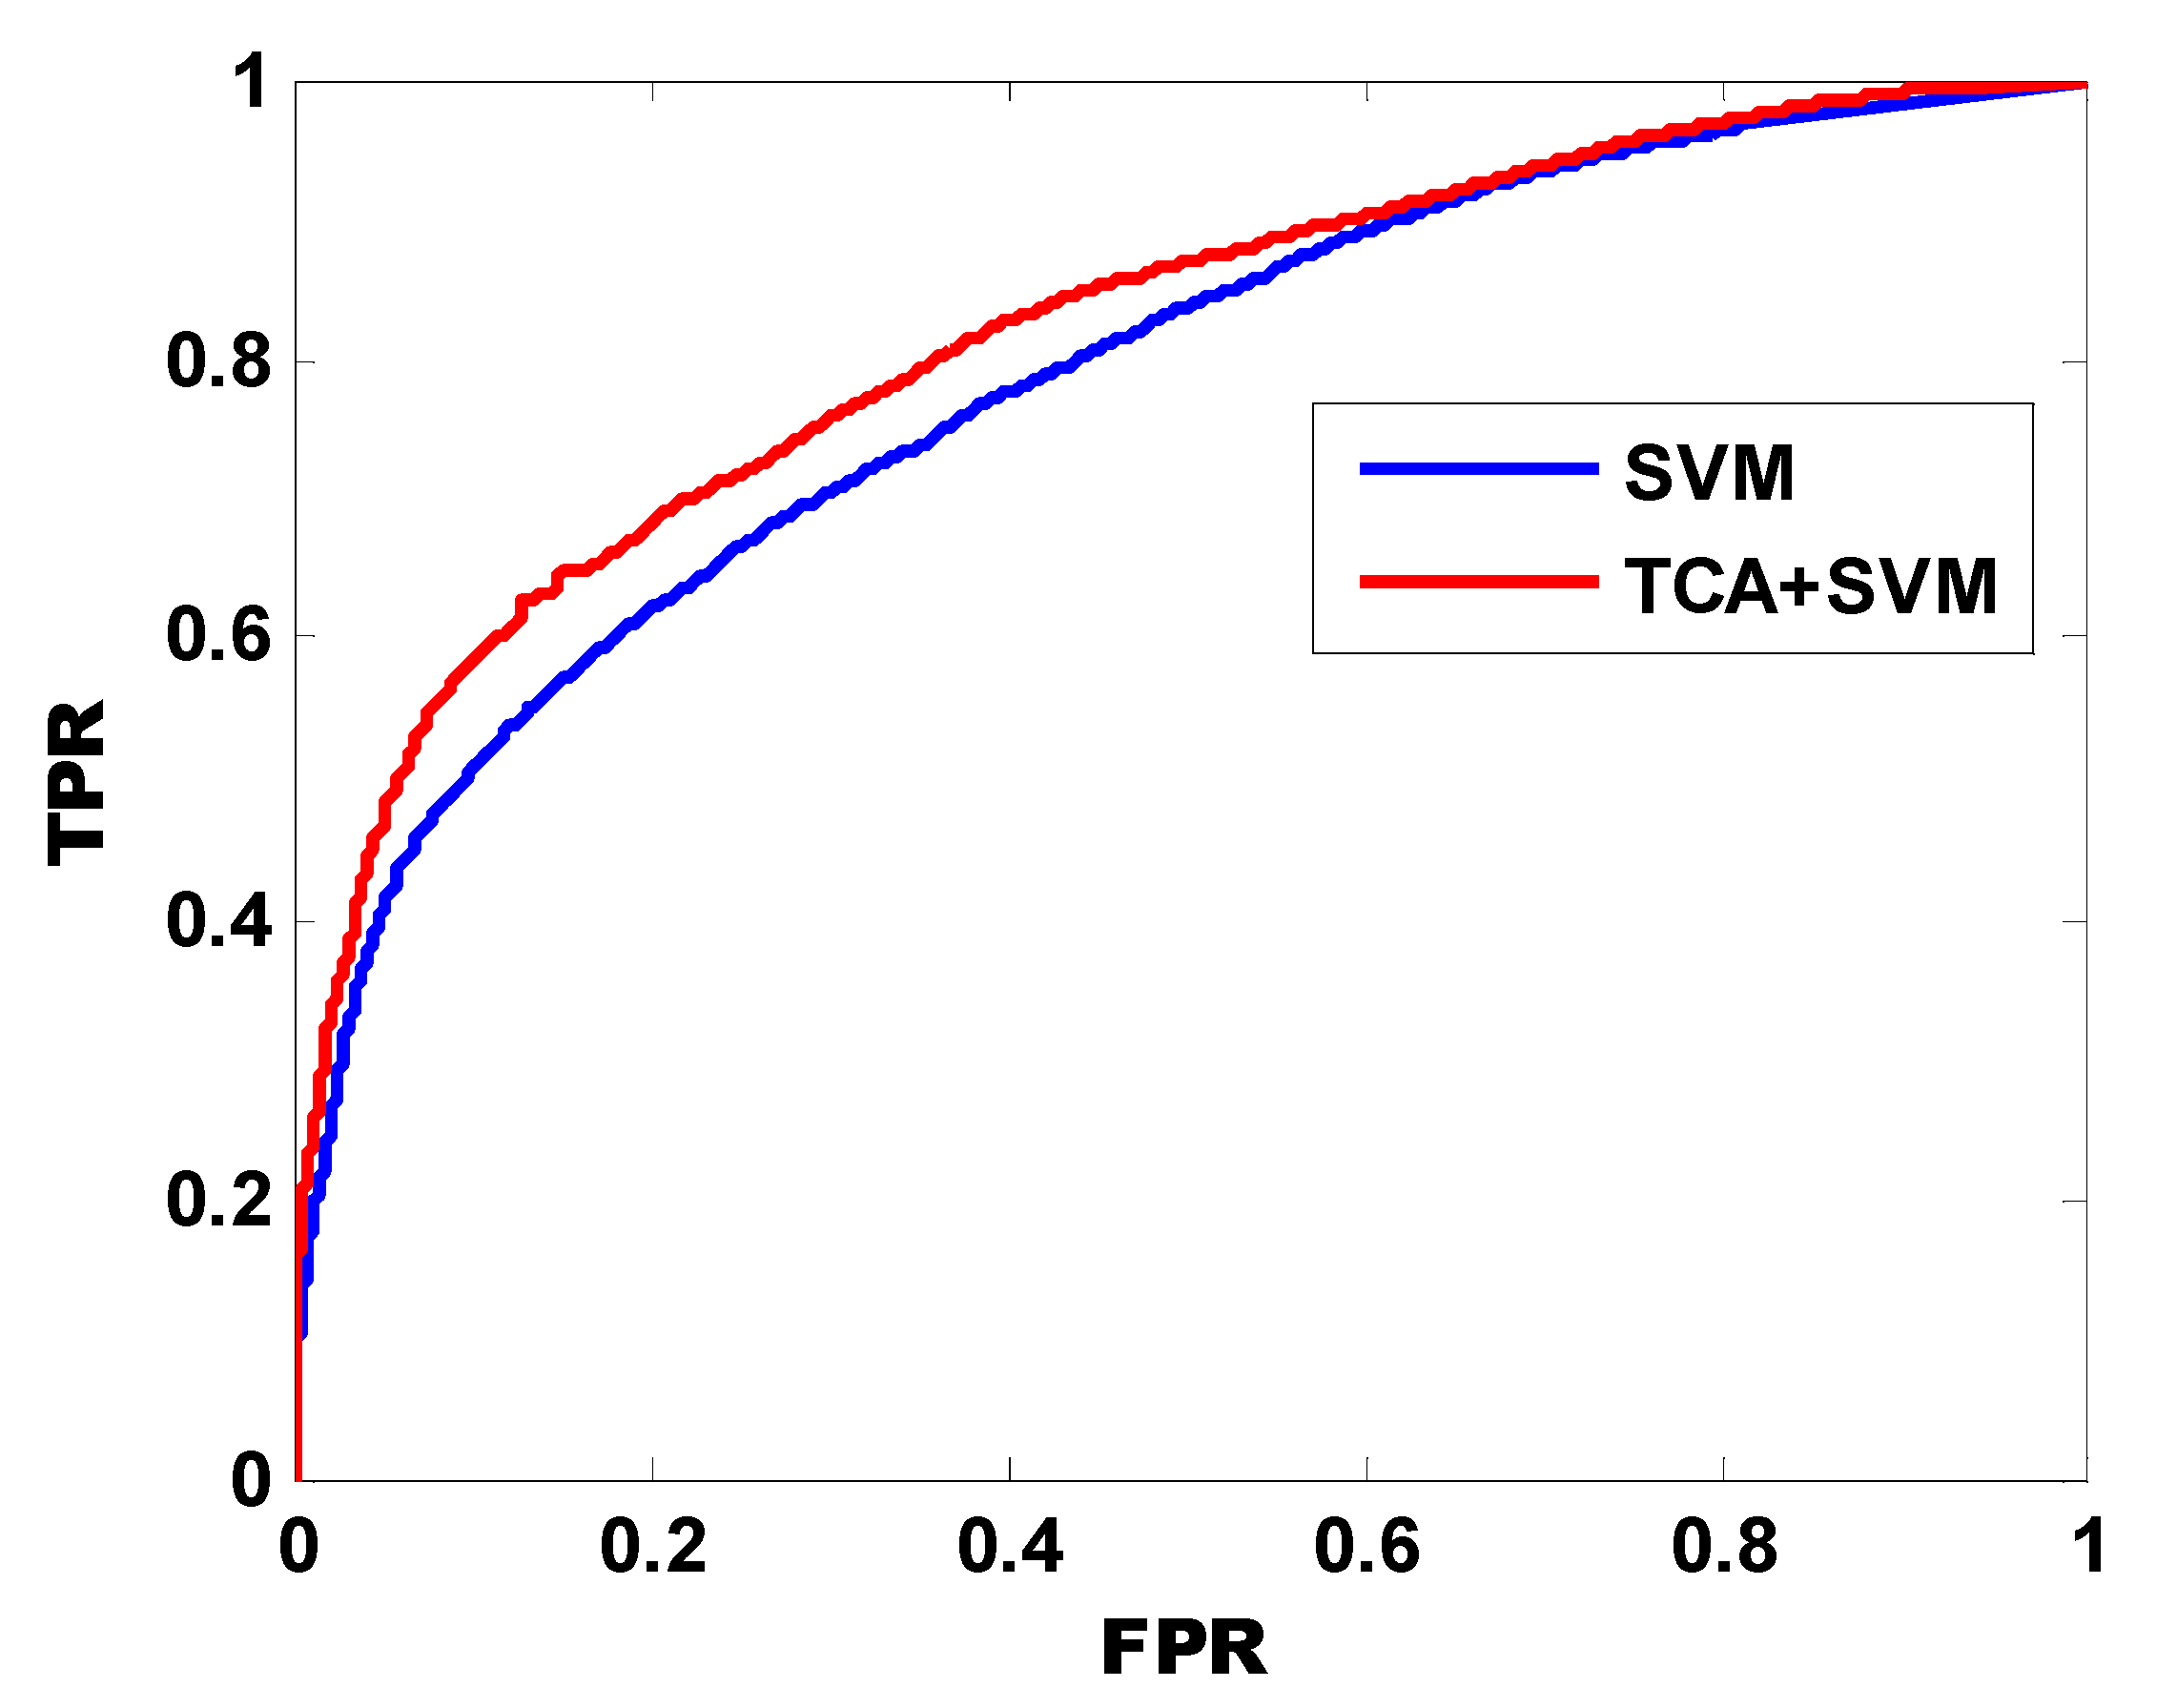
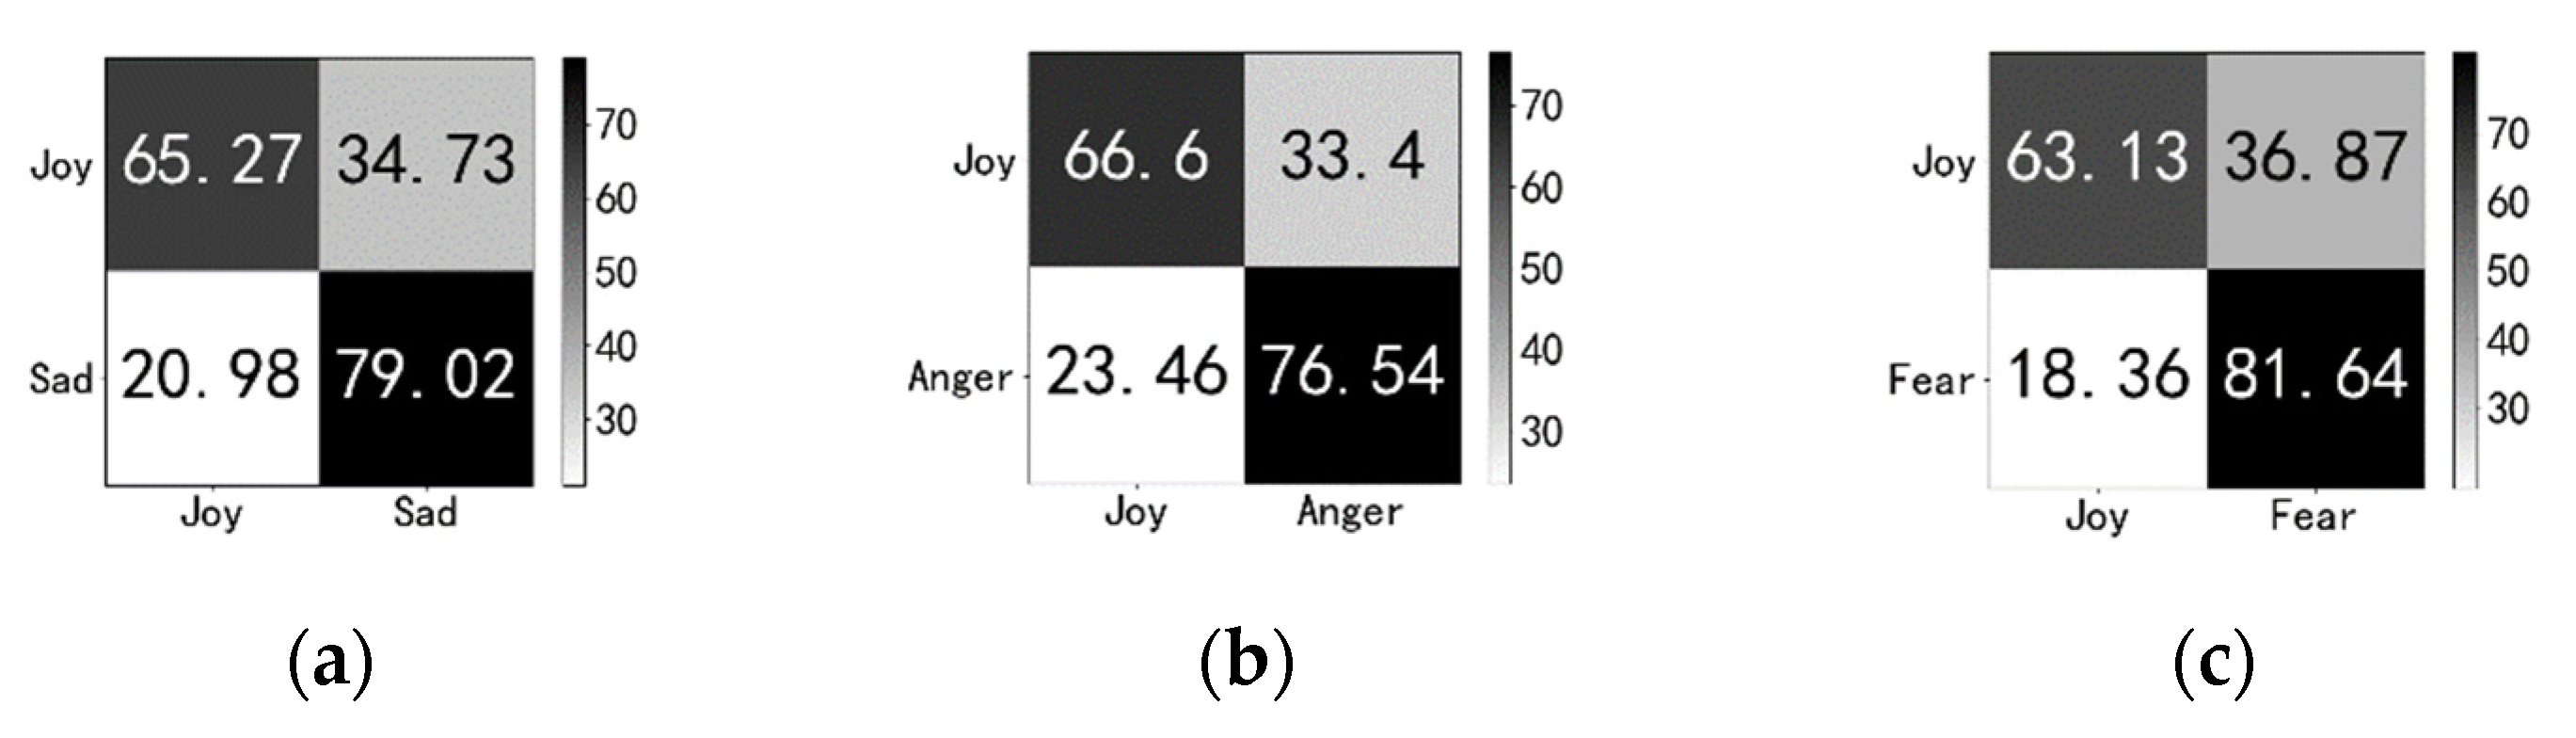
3.2. Cross-Day Emotion Recognition Based on the Domain Adaption Algorithm
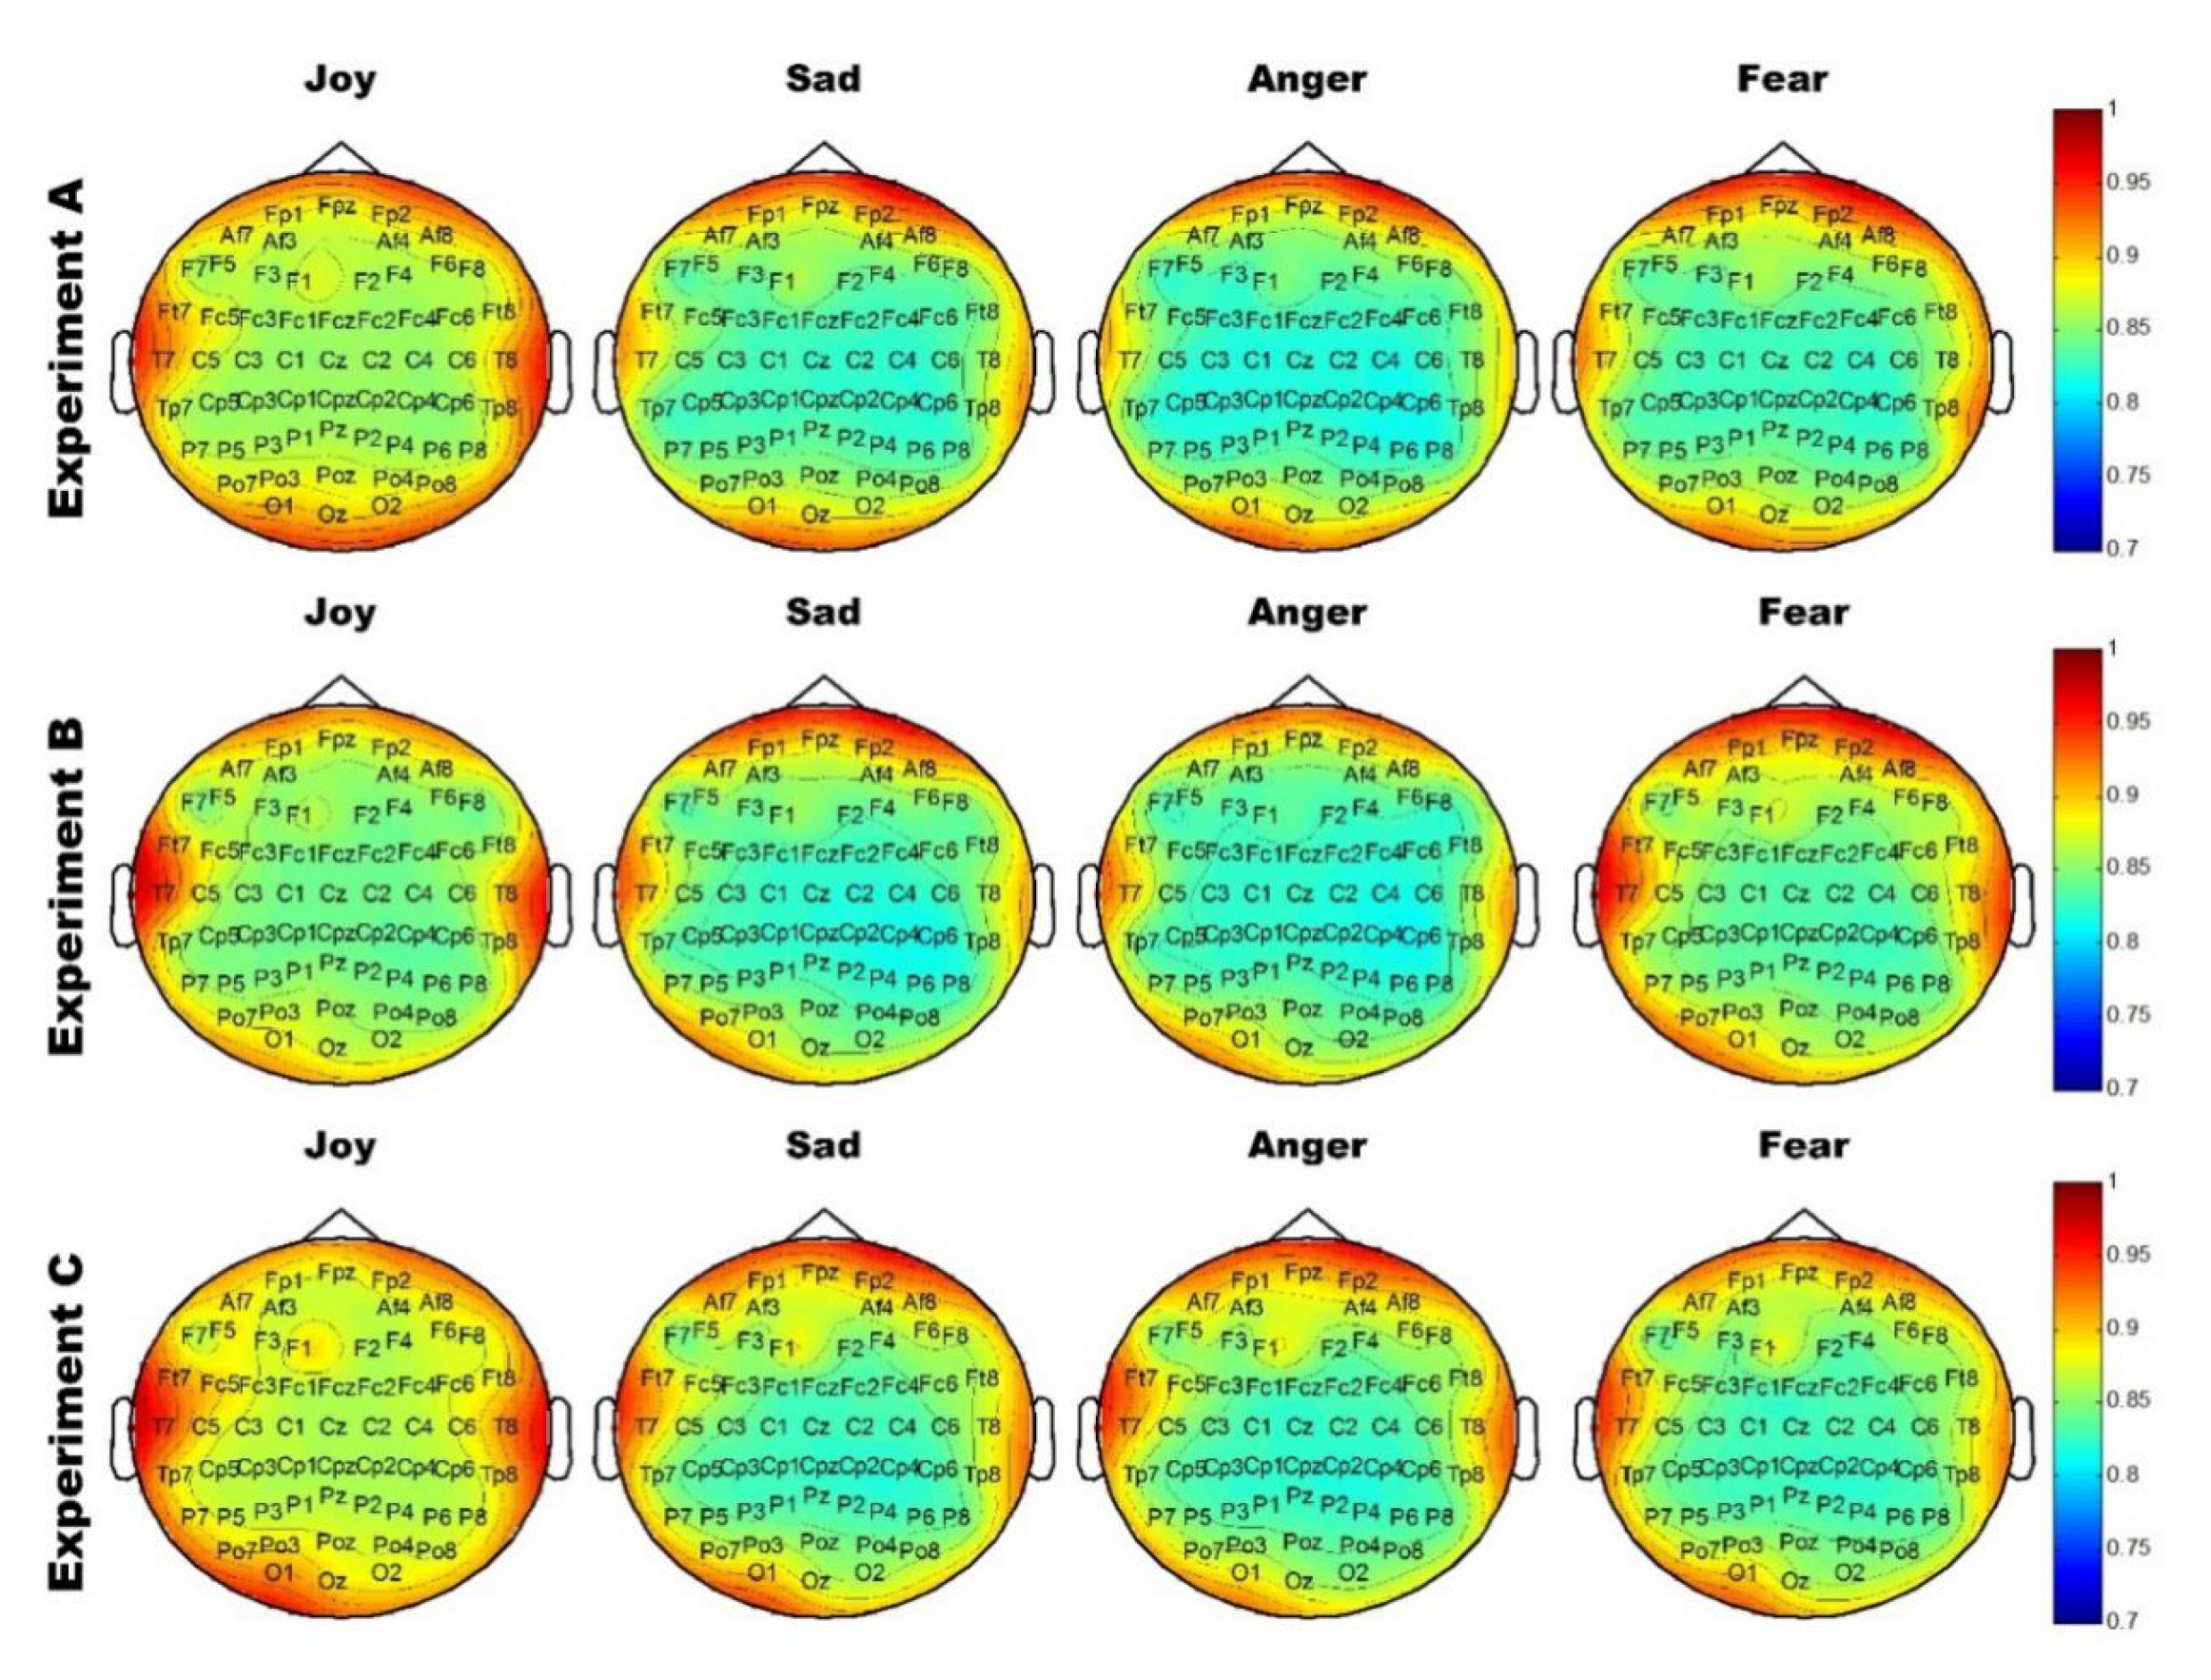
3.3. Analysis of Brain Topography
4. Discussion
- The performance of emotion recognition within the same experiment is better than the emotion recognition cross-day.
- Domain adaptation algorithm can improve the performance of cross-day emotion recognition
- The EEG database can provide a reliable data basis for emotion recognition across time domains
5. Conclusions
Author Contributions
Funding
Institutional Review Board Statement
Informed Consent Statement
Acknowledgments
Conflicts of Interest
Appendix A
- Part A

| Category of Emotion | Name of the Video | Label | Time (ms) |
|---|---|---|---|
| Joy | j2.avi Eat Hot Tofu Slowly | 1 | 109,000 |
| j3.avi A Big Potato | 2 | 142,000 | |
| j5.avi Flirting Scholar | 3 | 112,000 | |
| Sadness | s12.avi Roots and Branches | 4 | 146,000 |
| s14.avi My Beloved | 5 | 137,000 | |
| s15.avi Warm Spring | 6 | 102,000 | |
| Anger | a23.avi Fist of Fury (2) | 7 | 66,000 |
| a24.avi Kang Xi Kingdom | 8 | 94,000 | |
| a25.avi Conman In Tokyo | 9 | 107,000 | |
| Fear | f27.avi Save Me | 10 | 50,000 |
| f28.avi The Game of Killing (1) | 11 | 159,000 | |
| f31.avi Help | 12 | 247,000 |
- Part B
| Category of Emotion | Name of the Video | Label | Time (ms) |
|---|---|---|---|
| Joy | H2.avi East Meets West, Hong Qi expressed love to his cousin-sister | 1 | 228,000 |
| H3.avi A World Without Thieves, the clip of robbing | 2 | 191,000 | |
| H5.avi Chaplin Comedy | 3 | 244,000 | |
| Sadness | S2.avi Darling, Tian Wenjun looked for his sun | 4 | 182,000 |
| S3.avi Aftershock | 5 | 335,000 | |
| S4.avi Darling, Mom watched her daughter through the window | 6 | 120,000 | |
| Anger | A1.avi Yip Man 2, The boxing champion mocked Chinese martial arts | 7 | 172,000 |
| A2.avi Never Talk to Strangers | 8 | 205,000 | |
| a22.avi Fist of Fury (1) | 9 | 258,000 | |
| Fear | F1.avi Lights out, the film clip of shadows after lights out | 10 | 134,000 |
| F5.avi F_05, Four men lying on the ground at the beginning of the film | 11 | 291,000 | |
| F7.avi The film clip of big snake eating people | 12 | 158,000 |
- Part C
| Category of Emotion | Name of the Video | Label | Time (ms) |
|---|---|---|---|
| Joy | H1.avi Lost on Journey, Check-in part | 1 | 281,000 |
| H6.avi Home with Kids | 2 | 187,000 | |
| j4.avi East Meets West, Hong Qi jumped off the cliff part | 3 | 53,000 | |
| Sadness | S5.avi English movie, a man calling in the snow | 4 | 142,000 |
| S8.avi Echoes of the Rainbow, the part of typhoon blowing | 5 | 241,000 | |
| s13.avi Rob-B-Hood, saving the baby part | 6 | 234,000 | |
| Anger | A3.avi The film clip of Japanese invasion | 7 | 96,000 |
| A4.avi Blind Mountain, villagers stopped the abducted woman from being saved | 8 | 275,000 | |
| A5.avi Wildlife hunt | 9 | 148,000 | |
| Fear | F2.avi Lying in bed and the quilt lifted by itself | 10 | 162,000 |
| F3.avi Ju-on: The Grudge, Japanese girl watching TV | 11 | 167,000 | |
| F6.avi F_06, A woman hanging around with a gun | 12 | 190,000 |
References
- Picard, R.W. Affective Computing; MIT Press: Cambridge, MA, USA, 1997. [Google Scholar]
- Minsky, M. Emotion Machine: Commonsense Thinking, Artificial Intelligence, and the Future of the Human Mind; Simon & Schuster: New York, NY, USA, 2007. [Google Scholar]
- Lazar, J.; Feng, H.J.; Hochheiser, H. Case studies. In Research Methods in Human Computer Interaction II; Elsevier: Amsterdam, The Netherlands, 2017; pp. 153–185. [Google Scholar]
- Mühl, C.; Allison, B.; Nijholt, A.; Chanel, G. A survey of affective brain computer interfaces: Principles, state-of-the-art, and challenges. Brain Comput. Interfaces 2014, 1, 66–84. [Google Scholar] [CrossRef] [Green Version]
- Shanechi, M.M. Brain–machine interfaces from motor to mood. Nat. Neurosci. 2019, 22, 1554–1564. [Google Scholar] [CrossRef]
- Lang, P.J.; Bradley, M.M.; Cuthbert, B.N. International Affective Picture System (IAPS): Technical Manual and Affective Ratings; Technical Report A-4; University of Florida: Gainesville, FL, USA, 1999. [Google Scholar]
- Lang, P.; Bradley, M.; Cuthbert, B. International Affective Picture System (IAPS): Affective Ratings of Pictures and Instruction Manual (Rep. No. A-8); Technical Report A-8; University of Florida: Gainesville, FL, USA, 2008. [Google Scholar]
- Gross, J.J. Emotion elicitation using films: Cognition and Emotion. Cogn. Emot. 1995, 9, 87–108. [Google Scholar] [CrossRef]
- Liu, T.S.; Luo, Y.J.; Ma, H.; Huang, Y.X. The establishment and assessment of a native affective sound system. Psychol. Sci. 2006, 2, 406–408. [Google Scholar]
- Koelstra, S. DEAP: A Database for Emotion Analysis; Using Physiological Signals. IEEE Trans. Affect. Comput. 2012, 3, 18–31. [Google Scholar] [CrossRef] [Green Version]
- Soleymani, M. A Multimodal Database for Affect Recognition and Implicit Tagging. IEEE Trans. Affect. Comput. 2012, 3, 42–55. [Google Scholar] [CrossRef] [Green Version]
- Zheng, W.L.; Zhu, J.Y.; Lu, B.L. Identifying Stable Patterns over Time for Emotion Recognition from EEG. IEEE Trans. Affect. Comput. 2017, 10, 417–429. [Google Scholar] [CrossRef] [Green Version]
- Takahashi, K. Remarks on emotion recognition from multi-modal bio potential signals. JES Ergon. 2010, 3, 1138–1143. [Google Scholar]
- Sourina, O.; Liu, Y. A Fractal-based Algorithm of Emotion Recognition from EEG using Arousal-Valence Model. In Proceedings of the Biosignals-International Conference on Bio-Inspired Systems & Signal Processing, Rome, Italy, 26–29 January 2011. [Google Scholar]
- Liu, Y.; Sourina, O. Real-Time Subject-Dependent EEG-Based Emotion Recognition Algorithm. In Transactions on Computational Science XXIII; Springer: Berlin/Heidelberg, Germany, 2014. [Google Scholar]
- Jie, X.; Cao, R.; Li, L. Emotion recognition based on the sample entropy of EEG. Bio-Med. Mater. Eng. 2014, 24, 1185. [Google Scholar] [CrossRef] [PubMed]
- Kroupi, E.; Yazdani, A.; Ebrahimi, T. EEG Correlates of Different Emotional States Elicited during Watching Music Videos. In Affective Computing and Intelligent Interaction; Springer: Berlin/Heidelberg, Germany, 2011. [Google Scholar]
- Hjorth, B. EEG analysis based on time domain properties. Electroencephalogr. Clin. Neurophysiol. 1970, 29, 306–310. [Google Scholar] [CrossRef]
- Petrantonakis, P.C.; Hadjileontiadis, L.J. Emotion Recognition from EEG Using Higher Order Crossings. IEEE Trans. Inf. Technol. Biomed. 2010, 14, 186. [Google Scholar] [CrossRef]
- Duan, R.N.; Zhu, J.Y.; Lu, B.L. Differential entropy feature for EEG-based emotion classification. In Proceedings of the 2013 6th International IEEE/EMBS Conference on Neural Engineering (NER), San Diego, CA, USA, 6–8 November 2013. [Google Scholar]
- Lin, Y.P.; Wang, C.H.; Jung, T.P.; Wu, T.L.; Jeng, S.K.; Duann, J.R.; Chen, J.H. EEG-based emotion recognition in music listening. IEEE Trans. Biomed. Eng. 2010, 57, 1798–1806. [Google Scholar]
- Chanel, G.; Ansari-Asl, K.; Pun, T. Valence-arousal evaluation using physiological signals in an emotion recall paradigm. In Proceedings of the IEEE International Conference on Systems, Man and Cybernetics, Montreal, QC, Canada, 7–10 October 2007. [Google Scholar]
- Uzun, S.; Yildirim, S.; Yildirim, E. Emotion primitives estimation from EEG signals using Hilbert Huang Transform. In Proceedings of the 2012 IEEE-EMBS International Conference on Biomedical and Health Informatics, Hong Kong, China, 5–7 January 2012. [Google Scholar] [CrossRef]
- Huang, N.E.; Shen, Z.; Long, S.R.; Wu, M.C.; Shih, H.H.; Zheng, Q.; Yen, N.-C.; Tung, C.C.; Liu, H.H. The empirical mode decomposition and the Hilbert spectrum for nonlinear and non-stationary time series analysis. Proc. Math. Phys. Eng. Sci. 1998, 454, 903–995. [Google Scholar] [CrossRef]
- Özerdem, M.S.; Polat, H. Emotion recognition based on EEG features in movie clips with channel selection. Brain Inform. 2017, 4, 241–252. [Google Scholar] [CrossRef]
- Mohammadi, Z.; Frounchi, J.; Amiri, M. Wavelet-based emotion recognition system using EEG signal. Neural Comput. Appl. 2017, 28, 1985–1990. [Google Scholar] [CrossRef]
- Murugappan, M. Human emotion classification using wavelet transform and KNN. In Proceedings of the 2011 International Conference on Pattern Analysis and Intelligent Robotics, ICPAIR 2011, Kuala Lumpur, Malaysia, 28–29 June 2011; Volume 1. [Google Scholar] [CrossRef]
- Wichakam, I.; Vateekul, P. An evaluation of feature extraction in EEG-based emotion prediction with support vector machines. In Proceedings of the 2014 11th International Joint Conference on Computer Science and Software Engineering (JCSSE), Chon Buri, Thailand, 14–16 May 2014. [Google Scholar]
- Mert, A.; Akan, A. Emotion recognition from EEG signals by using multivariate empirical mode decomposition. Pattern Anal. Appl. 2016, 21, 81–89. [Google Scholar] [CrossRef]
- Ning, Z.; Ying, Z.; Li, T.; Chi, Z.; Hanming, Z.; Bin, Y. Emotion Recognition from EEG Signals Using Multidimensional Information in EMD Domain. BioMed Res. Int. 2017, 2017, 8317357. [Google Scholar]
- Zheng, W.L.; Lu, B.L. Investigating Critical Frequency Bands and Channels for EEG-Based Emotion Recognition with Deep Neural Networks. IEEE Trans. Auton. Ment. Dev. 2015, 7, 162–175. [Google Scholar] [CrossRef]
- Yang, Y.; Jonathan Wu, Q.M.; Zheng, W.L.; Lu, B.L. EEG-Based Emotion Recognition Using Hierarchical Network with Subnetwork Nodes. IEEE Trans. Cogn. Dev. Syst. 2018, 10, 408–419. [Google Scholar] [CrossRef]
- Zhang, T.; Zheng, W.; Cui, Z.; Zong, Y.; Li, Y. Spatial–Temporal Recurrent Neural Network for Emotion Recognition. IEEE Trans. Cybern. 2018, 49, 839–847. [Google Scholar] [CrossRef] [Green Version]
- Li, J.; Zhang, Z.; He, H. Hierarchical Convolutional Neural Networks for EEG-Based Emotion Recognition. Cogn. Comput. 2017, 10, 368–380. [Google Scholar] [CrossRef]
- Xing, X.; Li, Z.; Xu, T.; Shu, L.; Xu, X. SAE+LSTM: A New Framework for Emotion Recognition from Multi-Channel EEG. Front. Neurorobotics 2019, 13, 37. [Google Scholar] [CrossRef] [PubMed]
- Picard, R.W.; Vyzas, E.; Healey, J. Toward machine emotional intelligence: Analysis of affective physiological state. IEEE Trans. Pattern Anal. Mach. Intell. 2001, 23, 1175–1191. [Google Scholar] [CrossRef] [Green Version]
- Lin, Y.-P.; Jao, P.-K.; Yang, Y.-H. Improving Cross-Day EEG-Based Emotion Classification Using Robust Principal Component Analysis. Front. Comput. Neurosci. 2017, 11, 64. [Google Scholar] [CrossRef]
- Liu, S.; Chen, L.; Guo, D.; Liu, X.; Sheng, Y.; Ke, Y.; Xu, M.; An, X.; Yang, J.; Ming, D. Incorporation of Multiple-Days Information to Improve the Generalization of EEG-Based Emotion Recognition Over Time. Front. Hum. Neurosci. 2018, 12, 267. [Google Scholar] [CrossRef] [PubMed]
- Bao, G.; Zhuang, N.; Tong, L.; Yan, B.; Shu, J.; Wang, L.; Zeng, Y.; Shen, Z. Two-Level Domain Adaptation Neural Network for EEG-Based Emotion Recognition. Front. Hum. Neurosci. 2021, 14, 605246. [Google Scholar] [CrossRef]
- Julian, L.J. Measures of anxiety: State-Trait Anxiety Inventory (STAI), Beck Anxiety Inventory (BAI), and Hospital Anxiety and Depression Scale-Anxiety (HADS-A). Arthritis Care Res. 2011, 63, S467–S472. [Google Scholar] [CrossRef] [Green Version]
- Shear, M.K.; Bilt, J.V.; Rucci, P.; Endicott, J.; Lydiard, B.; Otto, M.W.; Pollack, M.H.; Chandler, L.; Williams, J.; Ali, A.; et al. Reliability and validity of a structured interview guide for the Hamilton Anxiety Rating Scale (SIGH-A). Depress. Anxiety 2001, 13, 166–178. [Google Scholar] [CrossRef]
- Williams, J.B.W. A structured interview guide for the Hamilton Depression Rating Scale. Arch. Gen. Psychiatry 1988, 45, 742. [Google Scholar] [CrossRef] [PubMed]
- Yao, D. A method to standardize a reference of scalp EEG recordings to a point at infinity. Physiol. Meas. 2001, 22, 693–711. [Google Scholar] [CrossRef] [PubMed]
- Yao, D.; Qin, Y.; Hu, S.; Dong, L.; Vega, M.L.B.; Sosa, P.A.V. Which Reference Should We Use for EEG and ERP practice? Brain Topogr. 2019, 32, 530–549. [Google Scholar] [CrossRef] [PubMed] [Green Version]
- Hyvarinen, A. Fast and robust fixed-point algorithms for independent component analysis. IEEE Trans. Neural Netw. 2002, 10, 626–634. [Google Scholar] [CrossRef] [PubMed] [Green Version]
- Liu, Y.-J.; Yu, M.; Zhao, G.; Song, J.; Ge, Y.; Shi, Y. Real-Time Movie-Induced Discrete Emotion Recognition from EEG Signals. IEEE Trans. Affect. Comput. 2018, 9, 550–562. [Google Scholar] [CrossRef]
- Pan, S.J.; Tsang, I.; Kwok, J.T.; Yang, Q. Domain Adaptation via Transfer Component Analysis. IEEE Trans. Neural Netw. 2011, 22, 199–210. [Google Scholar] [CrossRef] [Green Version]


| Intra-Day | Train1_V1_Test4 | Train2_V1_Test3 | Train3_V1_Test2 | Train4_V1_Test1 | ||||||
|---|---|---|---|---|---|---|---|---|---|---|
| Actual Predicted | Positive | Negative | Positive | Negative | Positive | Negative | Positive | Negative | Positive | Negative |
| Positive | 8081 | 1657 | 8129 | 7728 | 6284 | 5684 | 6511 | 4284 | 3934 | 1709 |
| Negative | 2503 | 30,095 | 7747 | 39,900 | 7828 | 36,652 | 7601 | 38,052 | 4886 | 24,751 |
| Sensitivity (%) | 76.35 | 51.20 | 44.53 | 46.14 | 44.60 | |||||
| Specificity (%) | 94.78 | 83.77 | 86.57 | 89.88 | 93.54 | |||||
| Accuracy rate (%) | 90.17 | 75.63 | 76.06 | 78.95 | 81.31 | |||||
| SVM | TCA + SVM | |||
|---|---|---|---|---|
| Actual Predicted | Positive | Negative | Positive | Negative |
| Positive | 3934 | 1709 | 4362 | 1530 |
| Negative | 4886 | 24,751 | 4458 | 24,930 |
| Sensitivity (%) | 44.60 | 49.46 | ||
| Specificity (%) | 93.54 | 94.22 | ||
| Accuracy rate (%) | 81.31 | 83.03 | ||
Publisher’s Note: MDPI stays neutral with regard to jurisdictional claims in published maps and institutional affiliations. |
© 2022 by the authors. Licensee MDPI, Basel, Switzerland. This article is an open access article distributed under the terms and conditions of the Creative Commons Attribution (CC BY) license (https://creativecommons.org/licenses/by/4.0/).
Share and Cite
He, Z.; Zhuang, N.; Bao, G.; Zeng, Y.; Yan, B. Cross-Day EEG-Based Emotion Recognition Using Transfer Component Analysis. Electronics 2022, 11, 651. https://doi.org/10.3390/electronics11040651
He Z, Zhuang N, Bao G, Zeng Y, Yan B. Cross-Day EEG-Based Emotion Recognition Using Transfer Component Analysis. Electronics. 2022; 11(4):651. https://doi.org/10.3390/electronics11040651
Chicago/Turabian StyleHe, Zhongyang, Ning Zhuang, Guangcheng Bao, Ying Zeng, and Bin Yan. 2022. "Cross-Day EEG-Based Emotion Recognition Using Transfer Component Analysis" Electronics 11, no. 4: 651. https://doi.org/10.3390/electronics11040651