
Full-Reference Image Quality Assessment Based on Grünwald–Letnikov Derivative, Image Gradients, and Visual Saliency


Abstract
:1. Introduction
1.1. Literature Review
1.2. Organization of the Paper
2. Proposed Method
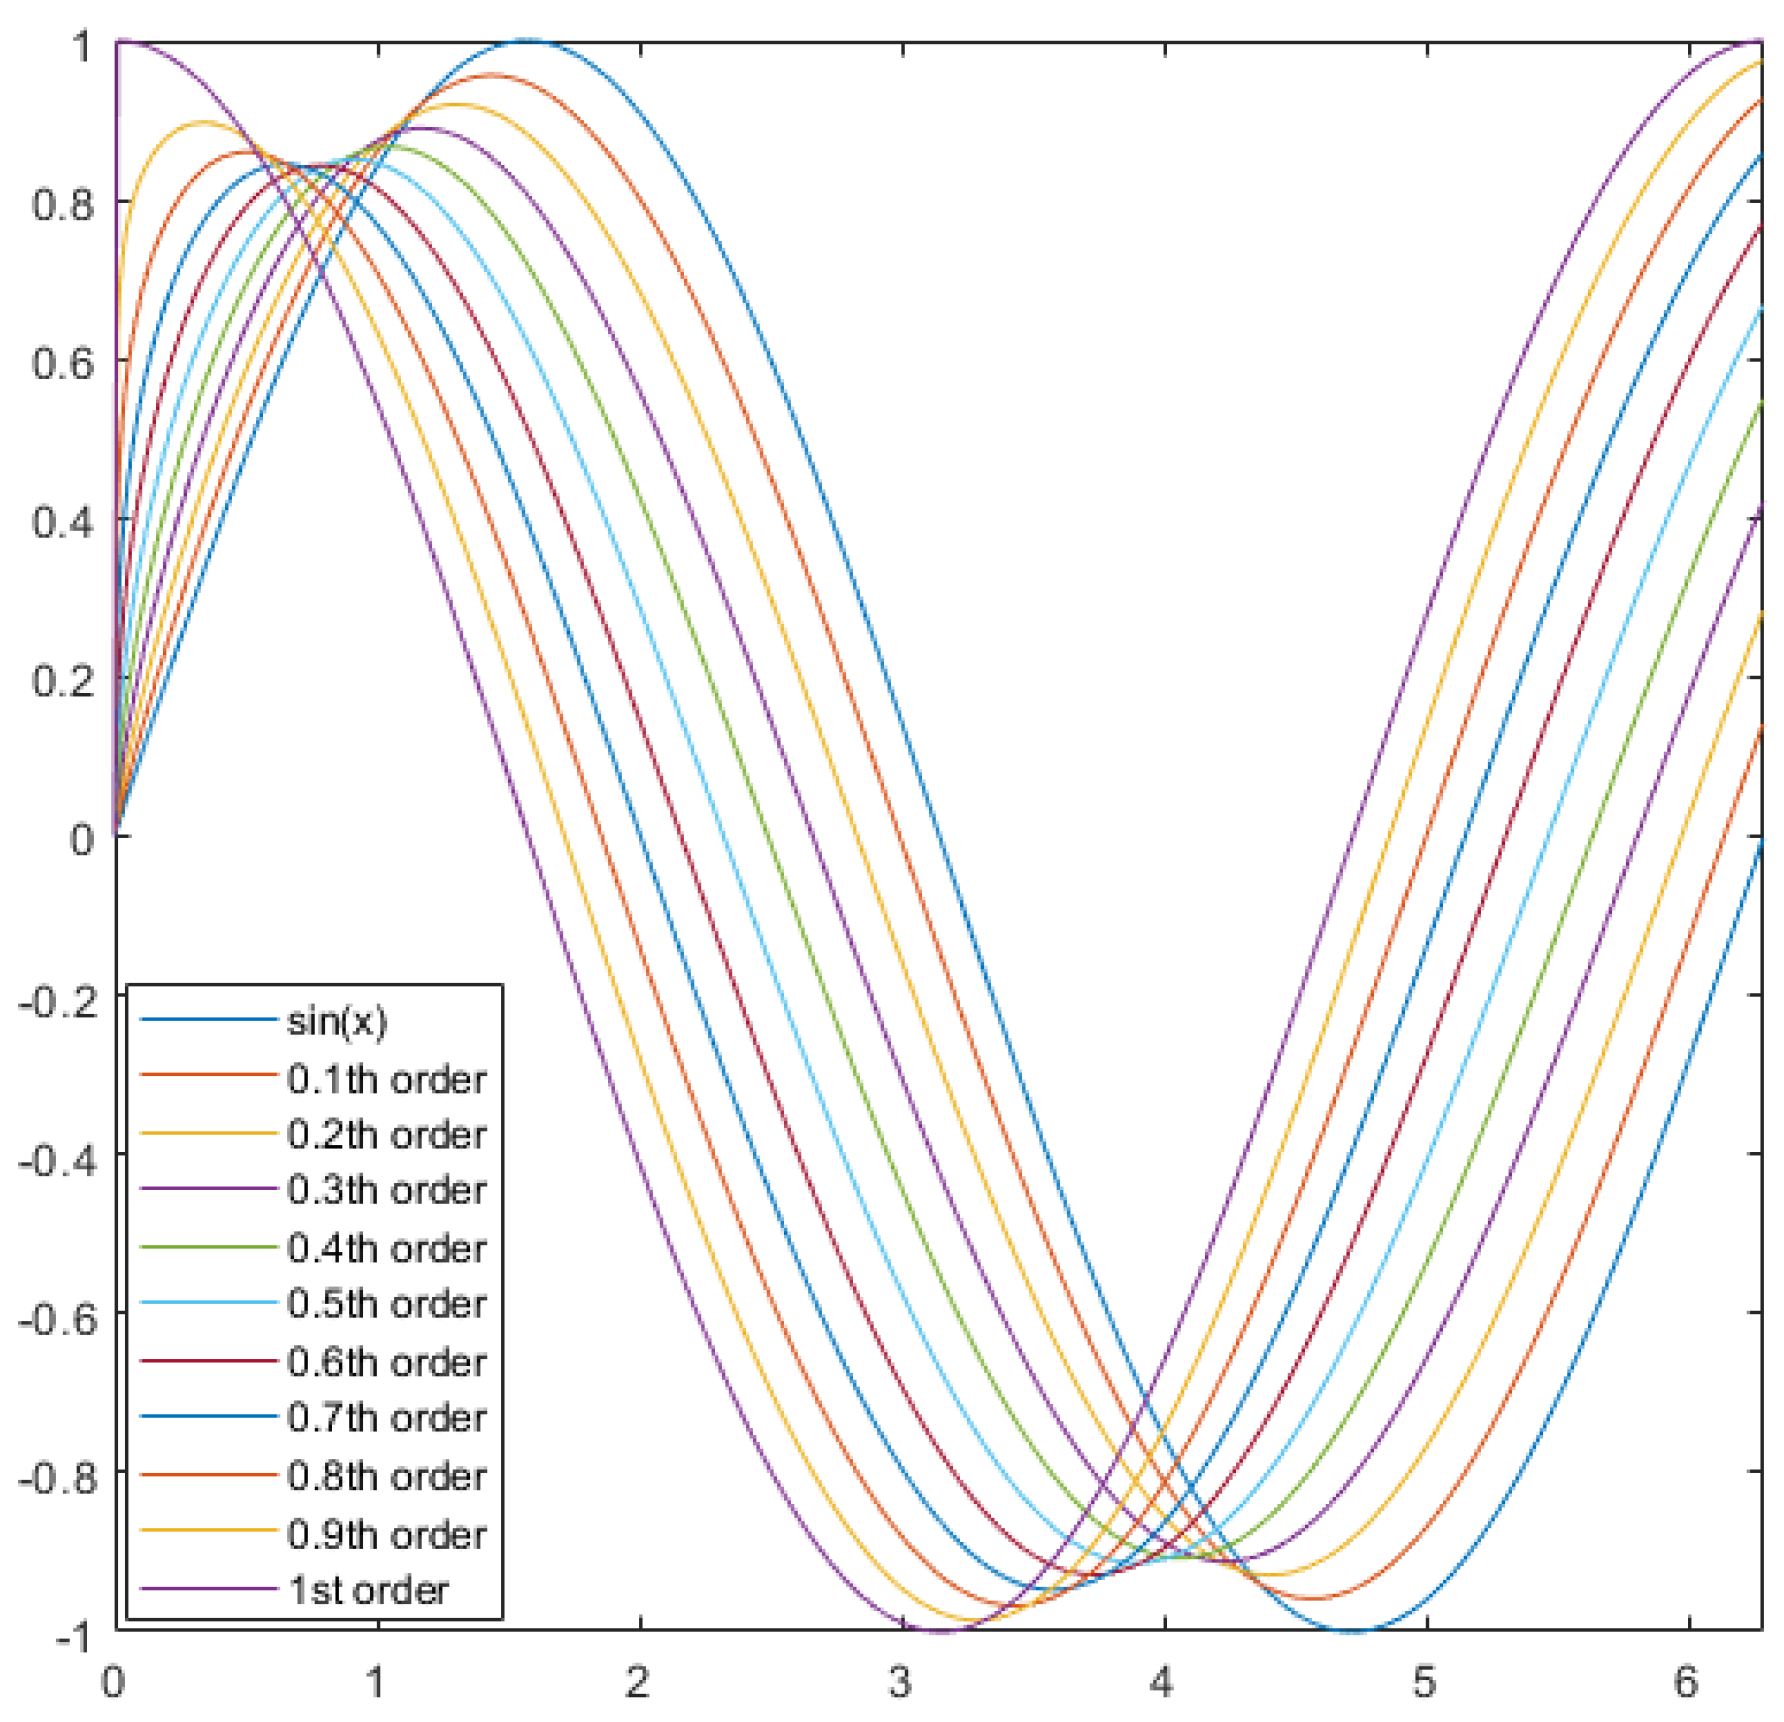
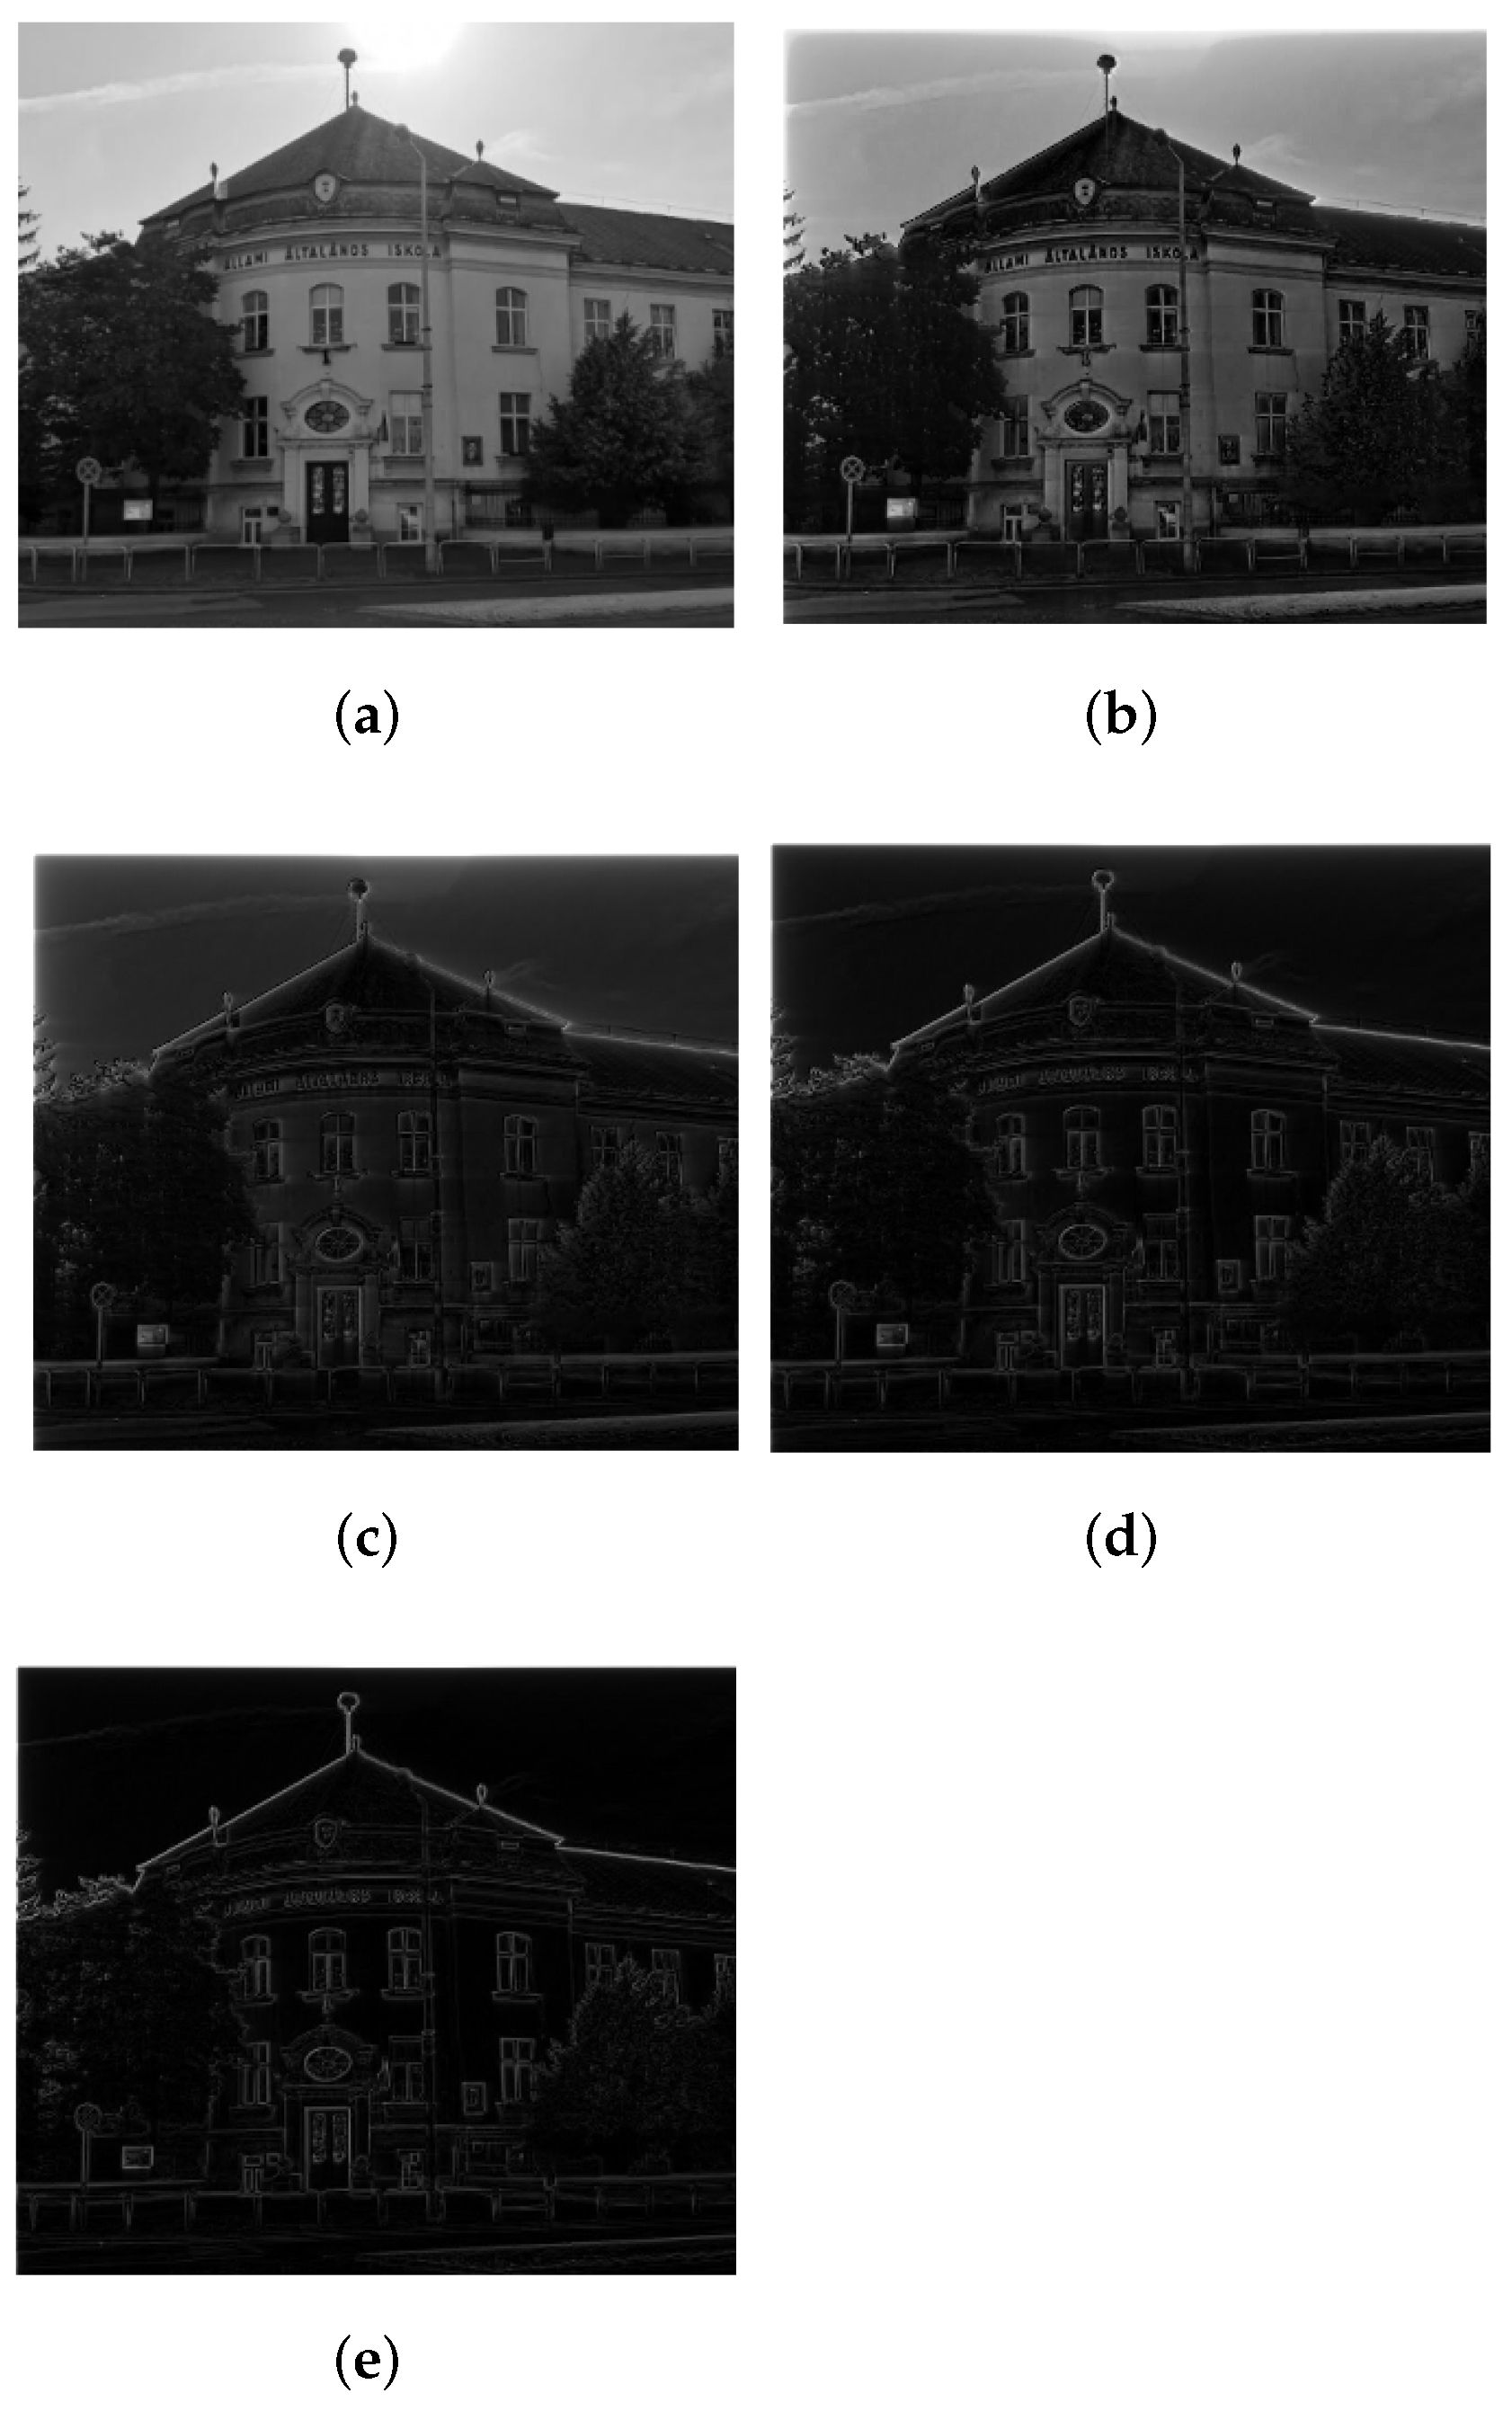
2.1. Preliminaries
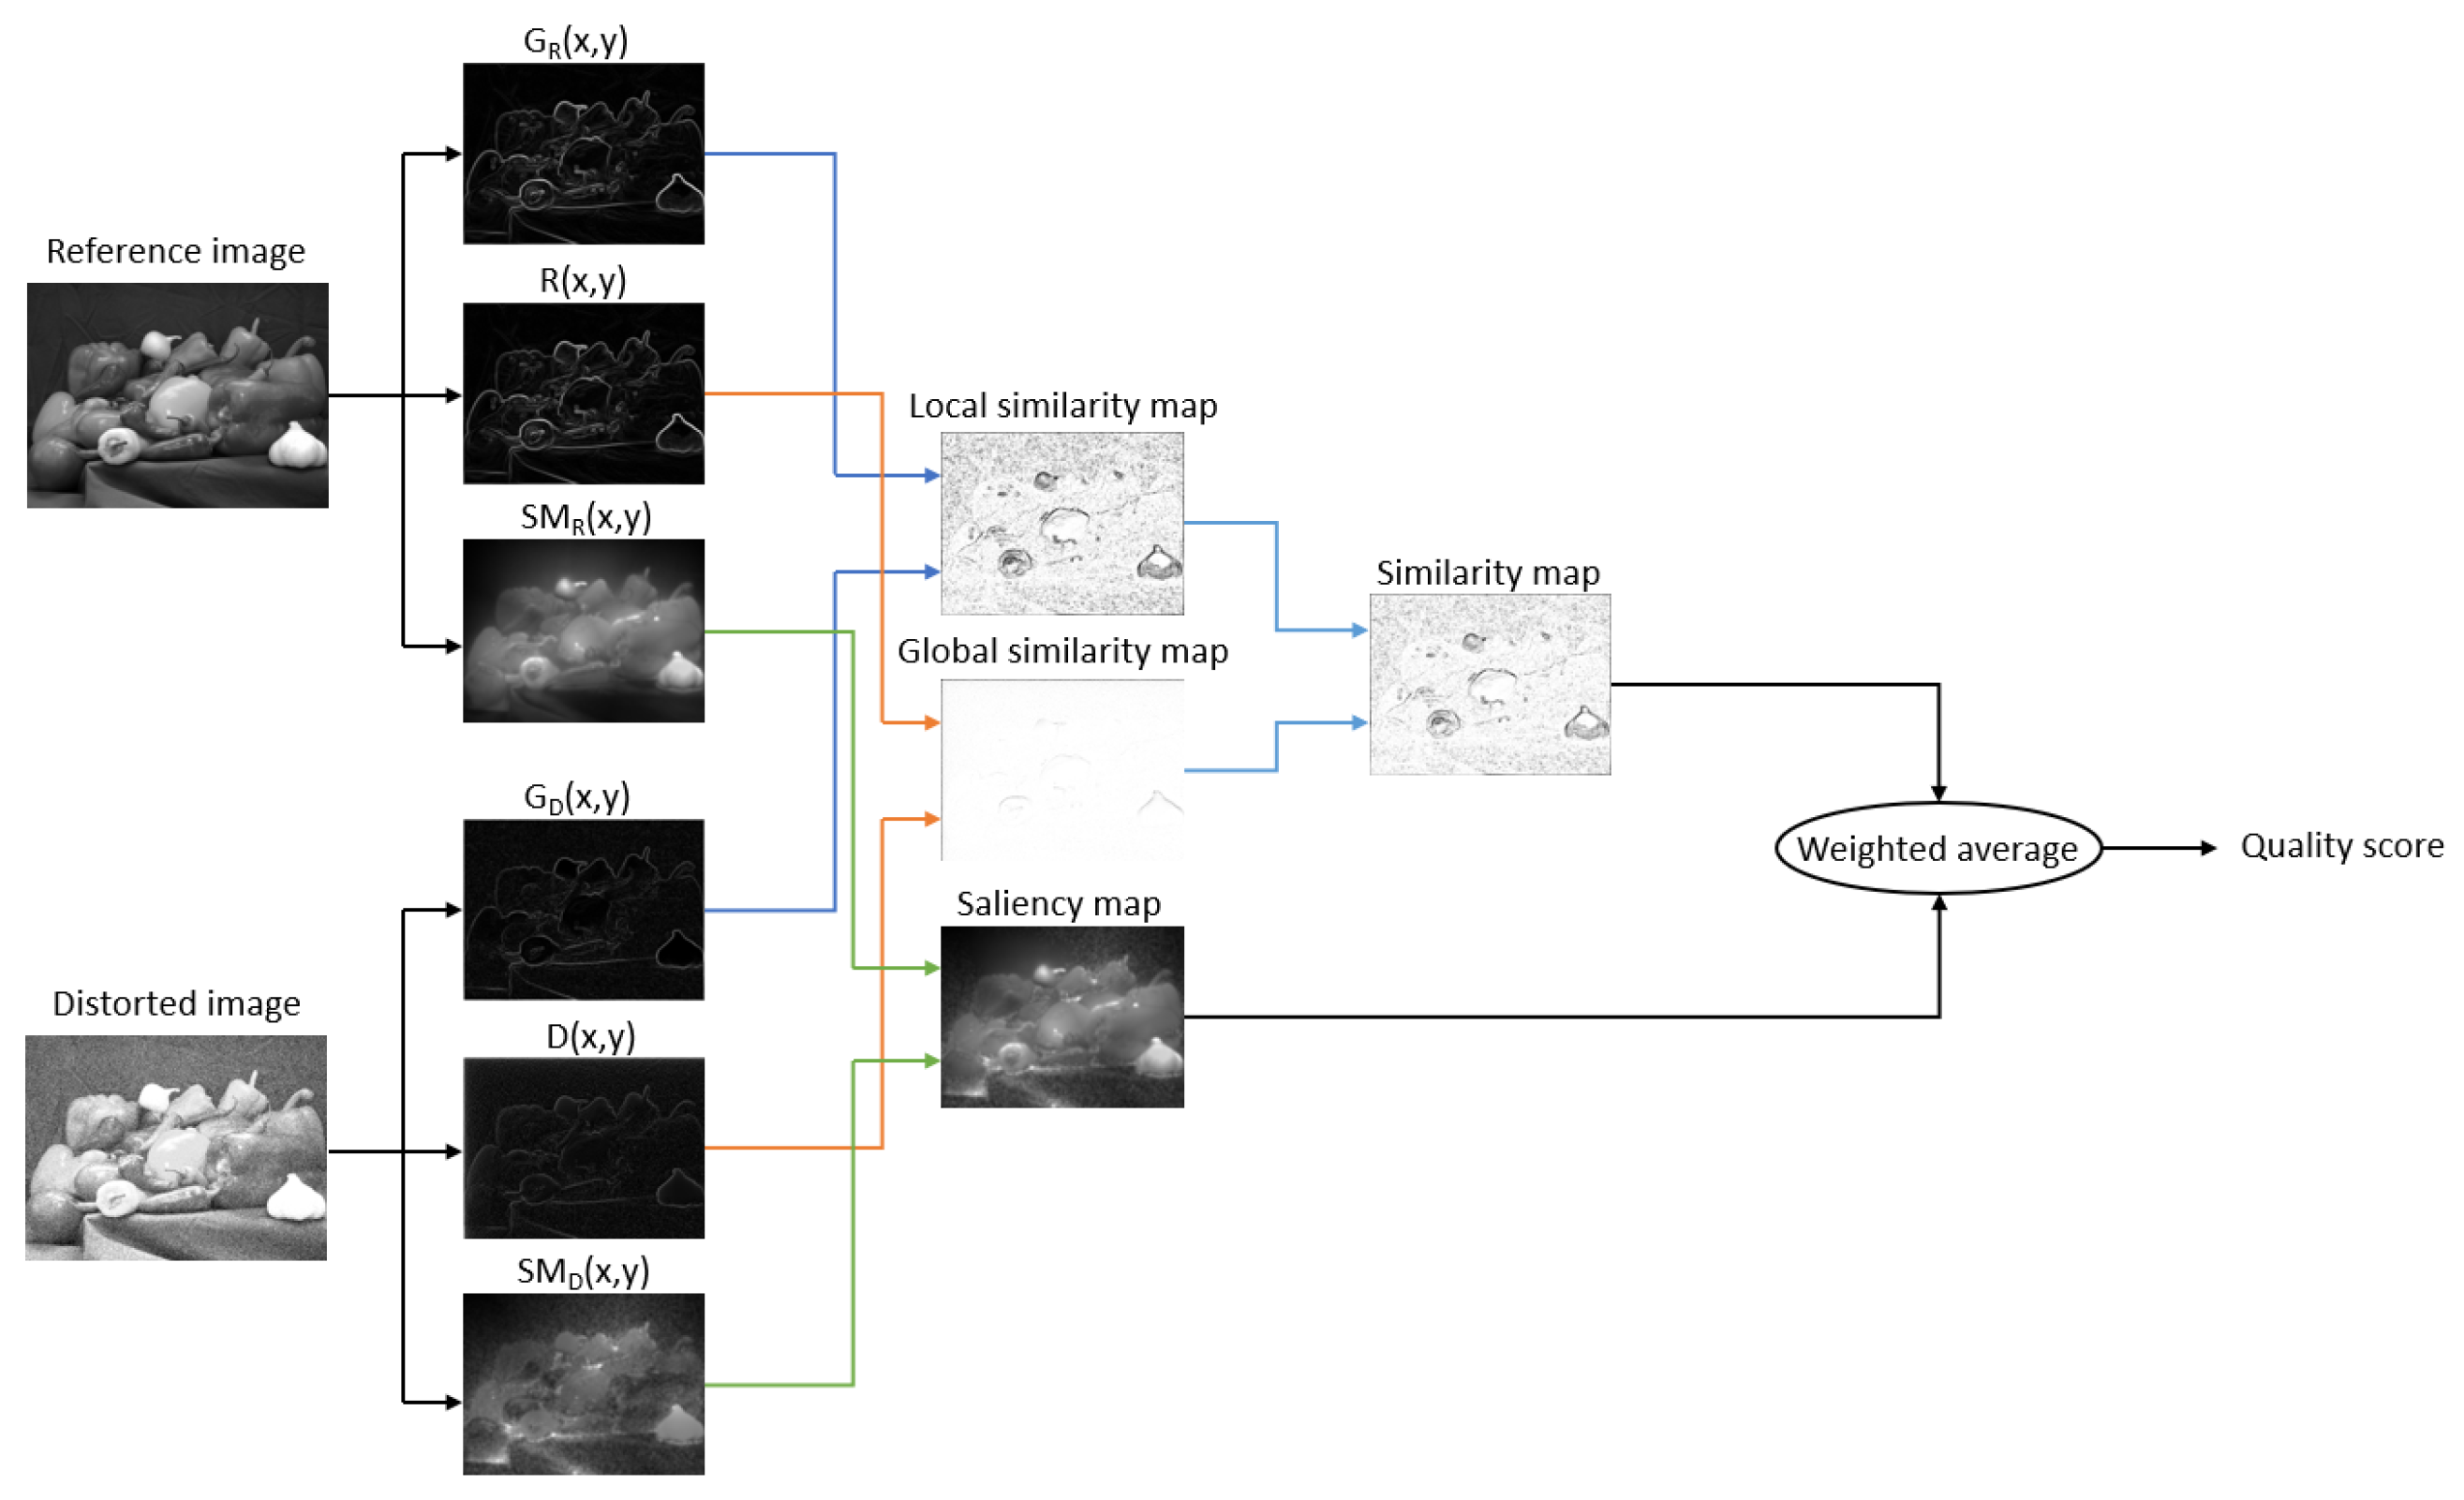
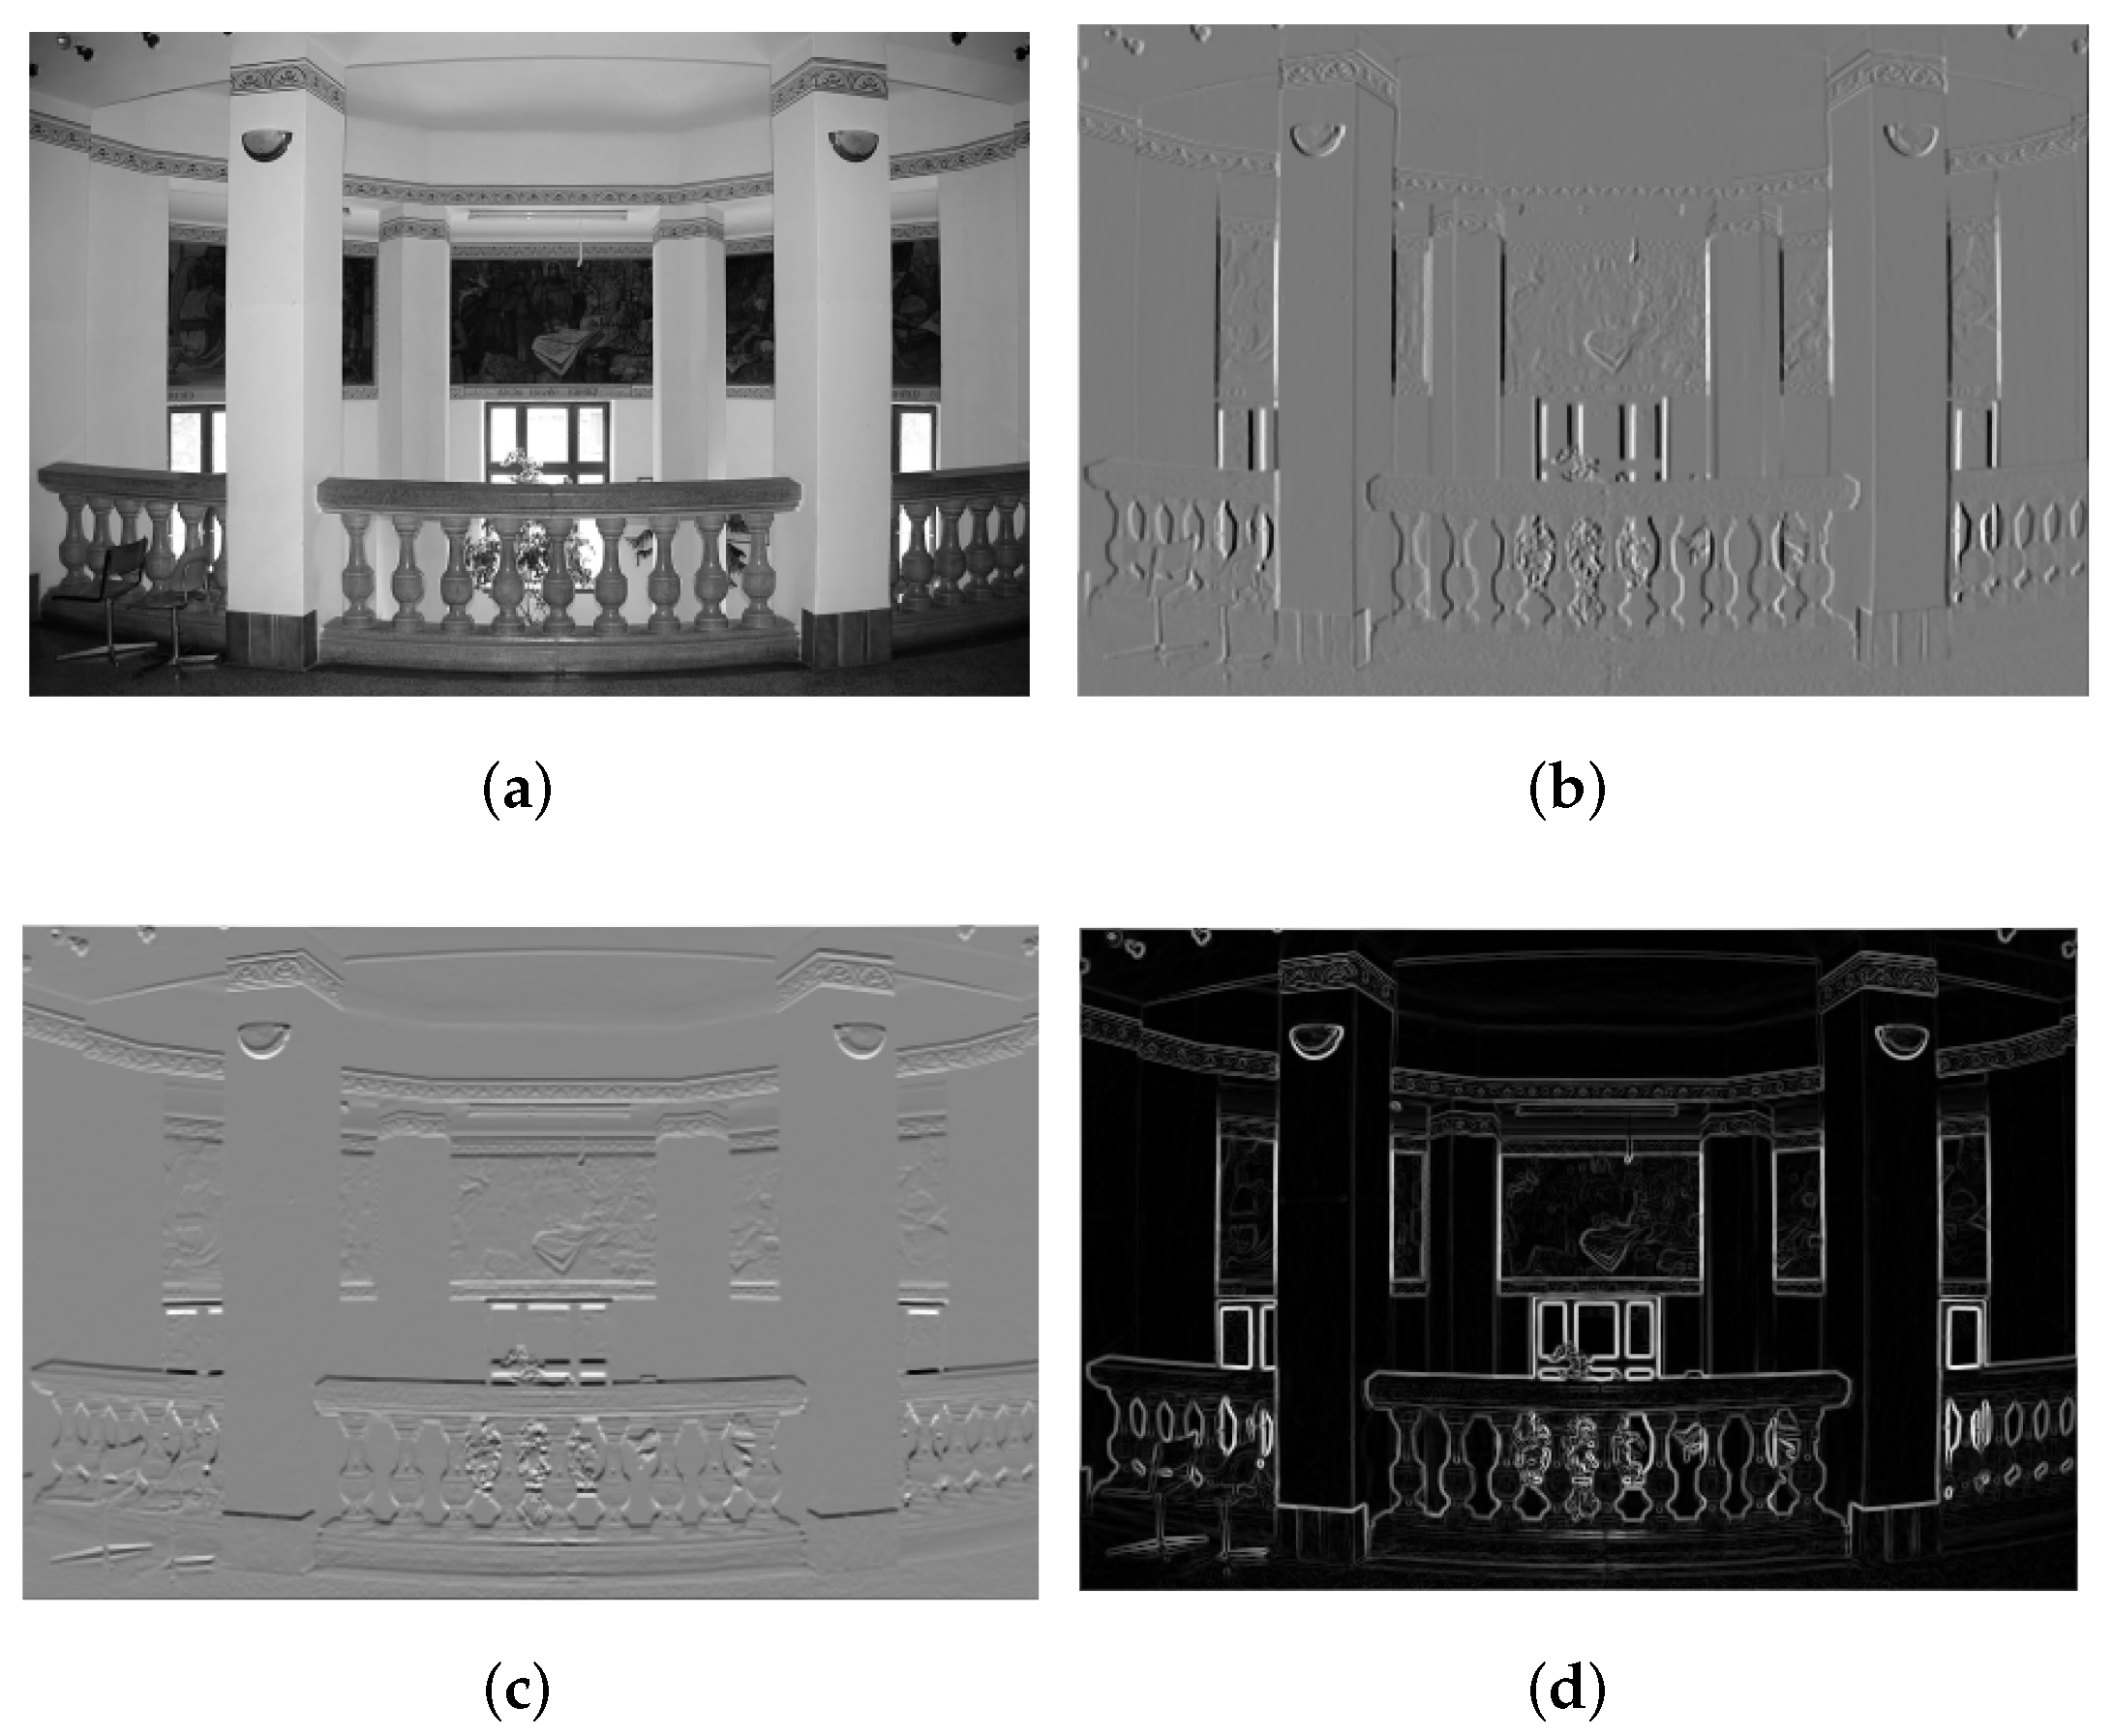
2.2. Proposed Metric
3. Experimental Results and Analysis
3.1. Evaluation Metrics and Protocol
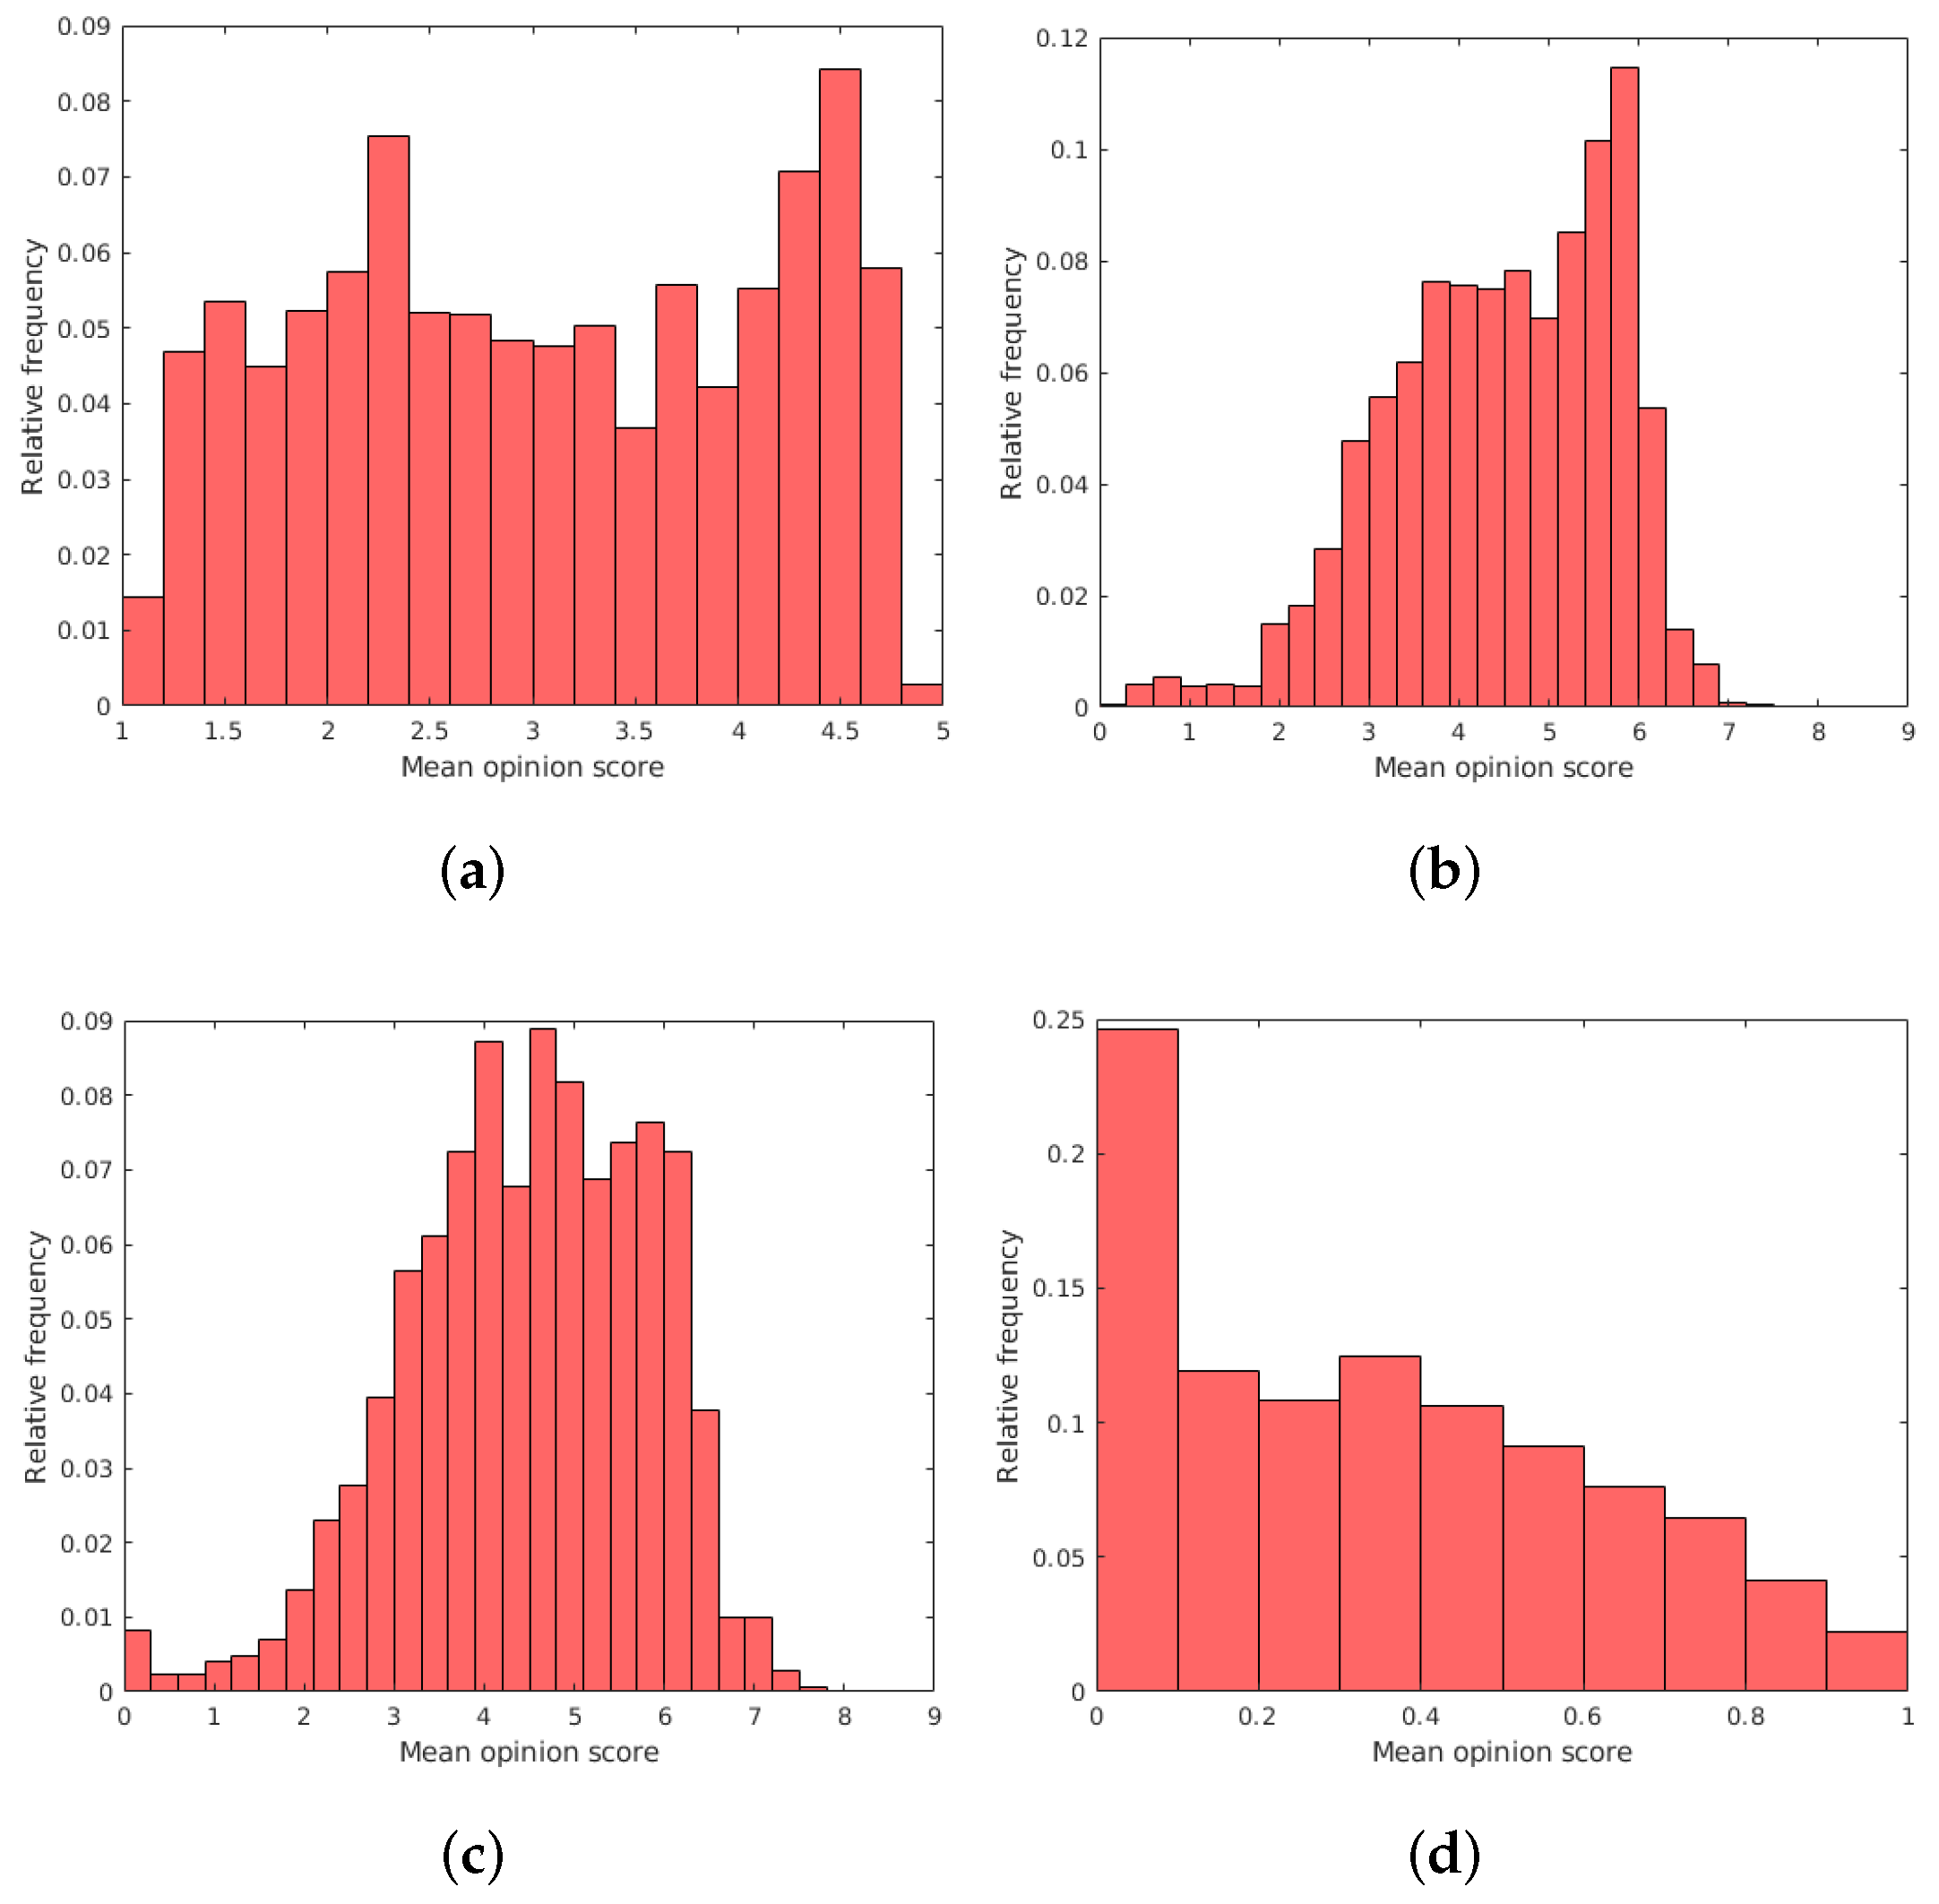
3.2. Databases
3.3. Comparison to the State-of-the-Art
4. Conclusions
Funding
Data Availability Statement
Acknowledgments
Conflicts of Interest
Abbreviations
| AGN | additive Gaussian noise |
| ANC | additive noise in color components |
| CA | chromatic aberrations |
| CC | contrast change |
| CCS | change of color saturation |
| CN | comfort noise |
| CSIQ | categorical image quality |
| DCR | degradation category ratings |
| DISTS | deep image structure and texture similarity |
| FR-IQA | full-reference image quality assessment |
| GB | Gaussian blur |
| GSM | gradient similarity measure |
| HFN | high frequency noise |
| ICQD | image color quantization with dither |
| IN | impulse noise |
| IQA | image quality assessment |
| JGTE | JPEG transmission error |
| JPEG | Joint Photographic Experts Group |
| KADID | Konstanz artificially distorted image quality database |
| KROCC | Kendall’s rank order correlation coefficient |
| LCNI | lossy compression of noisy image |
| LGV | local and global variations |
| MAD | most apparent distortion |
| MGN | multiplicative Gaussian noise |
| MN | masked noise |
| MOS | mean opinion score |
| MS | mean shift |
| MS-SSIM | multi-scale structural similarity index measure |
| NEPN | non-eccentricity pattern noise |
| NR-IQA | no-reference image quality assessment |
| PLCC | Pearson’s linear correlation coefficient |
| PSNR | peak signal-to-noise ratio |
| QN | quantization noise |
| ReSIFT | reliability-weighted scale invariant feature transform |
| RR-IQA | reduced-reference image quality assessment |
| RVSIM | Riesz transform and visual contrast sensitivity-based feature similarity index |
| SCN | spatially correlated noise |
| SROCC | Spearman’s rank order correlation coefficient |
| SSIM | structural similarity index measure |
| SWLGV | saliency weighted local and global variations |
| TID | Tampere image database |
References
- Chubarau, A.; Akhavan, T.; Yoo, H.; Mantiuk, R.K.; Clark, J. Perceptual image quality assessment for various viewing conditions and display systems. Electron. Imaging 2020, 2020, 67-1. [Google Scholar] [CrossRef]
- Saupe, D.; Hahn, F.; Hosu, V.; Zingman, I.; Rana, M.; Li, S. Crowd workers proven useful: A comparative study of subjective video quality assessment. In Proceedings of the QoMEX 2016: 8th International Conference on Quality of Multimedia Experience, Lisbon, Portugal, 6–8 June 2016. [Google Scholar]
- Ponomarenko, N.; Ieremeiev, O.; Lukin, V.; Egiazarian, K.; Jin, L.; Astola, J.; Vozel, B.; Chehdi, K.; Carli, M.; Battisti, F.; et al. Color image database TID2013: Peculiarities and preliminary results. In European Workshop on Visual Information Processing (EUVIP); IEEE: New York, NJ, USA, 2013; pp. 106–111. [Google Scholar]
- Lin, H.; Hosu, V.; Saupe, D. KonIQ-10K: Towards an ecologically valid and large-scale IQA database. arXiv 2018, arXiv:1803.08489. [Google Scholar]
- Lin, H.; Hosu, V.; Saupe, D. KADID-10k: A large-scale artificially distorted IQA database. In Proceedings of the 2019 Eleventh International Conference on Quality of Multimedia Experience (QoMEX), Berlin, Germany, 5–7 June 2019; pp. 1–3. [Google Scholar]
- Chen, G.H.; Yang, C.L.; Xie, S.L. Gradient-based structural similarity for image quality assessment. In Proceedings of the 2006 International Conference on Image Processing, Atlanta, GA, USA, 8–11 October 2006; pp. 2929–2932. [Google Scholar]
- Zhu, J.; Wang, N. Image quality assessment by visual gradient similarity. IEEE Trans. Image Process. 2011, 21, 919–933. [Google Scholar] [PubMed]
- Liu, A.; Lin, W.; Narwaria, M. Image quality assessment based on gradient similarity. IEEE Trans. Image Process. 2011, 21, 1500–1512. [Google Scholar]
- Xue, W.; Zhang, L.; Mou, X.; Bovik, A.C. Gradient magnitude similarity deviation: A highly efficient perceptual image quality index. IEEE Trans. Image Process. 2013, 23, 684–695. [Google Scholar] [CrossRef] [Green Version]
- De Cesarei, A.; Loftus, G.R. Global and local vision in natural scene identification. Psychon. Bull. Rev. 2011, 18, 840–847. [Google Scholar] [CrossRef] [PubMed]
- Ding, K.; Ma, K.; Wang, S.; Simoncelli, E.P. Comparison of full-reference image quality models for optimization of image processing systems. Int. J. Comput. Vis. 2021, 129, 1258–1281. [Google Scholar] [CrossRef]
- Bovik, A.C. Handbook of Image and Video Processing; Academic Press: Cambridge, MA, USA, 2010. [Google Scholar]
- Hore, A.; Ziou, D. Image quality metrics: PSNR vs. SSIM. In Proceedings of the 2010 20th International Conference on Pattern Recognition, Istanbul, Turkey, 23–26 August 2010; pp. 2366–2369. [Google Scholar]
- Ponomarenko, N.; Silvestri, F.; Egiazarian, K.; Carli, M.; Astola, J.; Lukin, V. On between-coefficient contrast masking of DCT basis functions. In Proceedings of the Third International Workshop on Video Processing and Quality Metrics, Scottsdale, AZ, USA, 25–26 January 2007; Volume 4. [Google Scholar]
- Wang, Z.; Bovik, A.C.; Sheikh, H.R.; Simoncelli, E.P. Image quality assessment: From error visibility to structural similarity. IEEE Trans. Image Process. 2004, 13, 600–612. [Google Scholar] [CrossRef] [Green Version]
- Wang, Z.; Simoncelli, E.P.; Bovik, A.C. Multiscale structural similarity for image quality assessment. In Proceedings of the The Thrity-Seventh Asilomar Conference on Signals, Systems & Computers, Pacific Grove, CA, USA, 9–12 November 2003; Volume 2, pp. 1398–1402. [Google Scholar]
- Li, C.; Bovik, A.C. Content-weighted video quality assessment using a three-component image model. J. Electron. Imaging 2010, 19, 011003. [Google Scholar]
- Li, C.; Bovik, A.C. Content-partitioned structural similarity index for image quality assessment. Signal Process. Image Commun. 2010, 25, 517–526. [Google Scholar] [CrossRef]
- Liu, L.; Wang, Y.; Wu, Y. A wavelet-domain structure similarity for image quality assessment. In Proceedings of the 2009 2nd International Congress on Image and Signal Processing, Tianjin, China, 17–19 October 2009; pp. 1–5. [Google Scholar]
- Sampat, M.P.; Wang, Z.; Gupta, S.; Bovik, A.C.; Markey, M.K. Complex wavelet structural similarity: A new image similarity index. IEEE Trans. Image Process. 2009, 18, 2385–2401. [Google Scholar] [CrossRef] [PubMed]
- Wang, Z.; Li, Q. Information content weighting for perceptual image quality assessment. IEEE Trans. Image Process. 2010, 20, 1185–1198. [Google Scholar] [CrossRef] [PubMed]
- Sun, W.; Liao, Q.; Xue, J.H.; Zhou, F. SPSIM: A superpixel-based similarity index for full-reference image quality assessment. IEEE Trans. Image Process. 2018, 27, 4232–4244. [Google Scholar] [CrossRef] [Green Version]
- Neubert, D.I.P. Superpixels and Their Application for Visual Place Recognition in Changing Environments. 2015. Available online: https://nbn-resolving.org/urn:nbn:de:bsz:ch1-qucosa-190241 (accessed on 5 February 2022).
- Frackiewicz, M.; Szolc, G.; Palus, H. An improved SPSIM index for image quality assessment. Symmetry 2021, 13, 518. [Google Scholar] [CrossRef]
- Sheikh, H.R.; Bovik, A.C.; De Veciana, G. An information fidelity criterion for image quality assessment using natural scene statistics. IEEE Trans. Image Process. 2005, 14, 2117–2128. [Google Scholar] [CrossRef] [Green Version]
- Wu, J.; Ma, J.; Liang, F.; Dong, W.; Shi, G.; Lin, W. End-to-end blind image quality prediction with cascaded deep neural network. IEEE Trans. Image Process. 2020, 29, 7414–7426. [Google Scholar] [CrossRef]
- Xu, J.; Zhou, W.; Chen, Z. Blind omnidirectional image quality assessment with viewport oriented graph convolutional networks. IEEE Trans. Circuits Syst. Video Technol. 2020, 31, 1724–1737. [Google Scholar] [CrossRef]
- Zhu, H.; Li, L.; Wu, J.; Dong, W.; Shi, G. Generalizable No-Reference Image Quality Assessment via Deep Meta-learning. IEEE Trans. Circuits Syst. Video Technol. 2021. [Google Scholar] [CrossRef]
- Tang, Z.; Zheng, Y.; Gu, K.; Liao, K.; Wang, W.; Yu, M. Full-reference image quality assessment by combining features in spatial and frequency domains. IEEE Trans. Broadcast. 2018, 65, 138–151. [Google Scholar] [CrossRef]
- Bosse, S.; Maniry, D.; Müller, K.R.; Wiegand, T.; Samek, W. Deep neural networks for no-reference and full-reference image quality assessment. IEEE Trans. Image Process. 2017, 27, 206–219. [Google Scholar] [CrossRef] [Green Version]
- Ahn, S.; Choi, Y.; Yoon, K. Deep Learning-Based Distortion Sensitivity Prediction for Full-Reference Image Quality Assessment. In Proceedings of the IEEE/CVF Conference on Computer Vision and Pattern Recognition, Nashville, TN, USA, 20–25 June 2021; pp. 344–353. [Google Scholar]
- Okarma, K. Combined full-reference image quality metric linearly correlated with subjective assessment. In Proceedings of the International Conference on Artificial Intelligence and Soft Computing, Zakopane, Poland, 13–17 June 2010; pp. 539–546. [Google Scholar]
- Okarma, K. Combined image similarity index. Opt. Rev. 2012, 19, 349–354. [Google Scholar] [CrossRef]
- Okarma, K. Extended hybrid image similarity–combined full-reference image quality metric linearly correlated with subjective scores. Elektron. Elektrotechnika 2013, 19, 129–132. [Google Scholar] [CrossRef] [Green Version]
- Oszust, M. Image quality assessment with lasso regression and pairwise score differences. Multimed. Tools Appl. 2017, 76, 13255–13270. [Google Scholar] [CrossRef] [Green Version]
- Yuan, Y.; Guo, Q.; Lu, X. Image quality assessment: A sparse learning way. Neurocomputing 2015, 159, 227–241. [Google Scholar] [CrossRef]
- Liu, T.J.; Lin, W.; Kuo, C.C.J. Image quality assessment using multi-method fusion. IEEE Trans. Image Process. 2012, 22, 1793–1807. [Google Scholar] [CrossRef]
- Lukin, V.V.; Ponomarenko, N.N.; Ieremeiev, O.I.; Egiazarian, K.O.; Astola, J. Combining full-reference image visual quality metrics by neural network. In Human Vision and Electronic Imaging XX; International Society for Optics and Photonics: Bellingham, DC, USA, 2015; Volume 9394, p. 93940K. [Google Scholar]
- Oszust, M. Decision fusion for image quality assessment using an optimization approach. IEEE Signal Process. Lett. 2015, 23, 65–69. [Google Scholar] [CrossRef]
- Merzougui, N.; Djerou, L. Multi-gene Genetic Programming based Predictive Models for Full-reference Image Quality Assessment. J. Imaging Sci. Technol. 2021, 65, 60409-1. [Google Scholar] [CrossRef]
- Amirshahi, S.A.; Pedersen, M.; Beghdadi, A. Reviving traditional image quality metrics using CNNs. In Color and Imaging Conference; Society for Imaging Science and Technology: Bellingham, DC, USA, 2018; Volume 2018, pp. 241–246. [Google Scholar]
- Krizhevsky, A.; Sutskever, I.; Hinton, G.E. Imagenet classification with deep convolutional neural networks. Adv. Neural Inf. Process. Syst. 2012, 25, 1097–1105. [Google Scholar] [CrossRef]
- Pedersen, M.; Hardeberg, J.Y. Full-reference image quality metrics: Classification and evaluation. Found. Trends® Comput. Graph. Vis. 2012, 7, 1–80. [Google Scholar]
- Zhang, L.; Zhang, L.; Mou, X.; Zhang, D. A comprehensive evaluation of full reference image quality assessment algorithms. In Proceedings of the 2012 19th IEEE International Conference on Image Processing, Orlando, FL, USA, 30 September–3 October 2012; pp. 1477–1480. [Google Scholar]
- Phadikar, B.S.; Maity, G.K.; Phadikar, A. Full reference image quality assessment: A survey. In Industry Interactive Innovations in Science, Engineering and Technology; Springer: Berlin, Germany, 2018; pp. 197–208. [Google Scholar]
- Wasson, V.; Kaur, B. Full Reference Image Quality Assessment from IQA Datasets: A Review. In Proceedings of the 2019 6th International Conference on Computing for Sustainable Global Development (INDIACom), New Delhi, India, 13–15 March 2019; pp. 735–738. [Google Scholar]
- Sabatier, J.; Agrawal, O.P.; Machado, J.T. Advances in Fractional Calculus; Springer: Berlin, Germany, 2007; Volume 4. [Google Scholar]
- Abadias, L.; De León-Contreras, M.; Torrea, J.L. Non-local fractional derivatives. Discrete and continuous. J. Math. Anal. Appl. 2017, 449, 734–755. [Google Scholar] [CrossRef] [Green Version]
- Jia, H.; Pu, Y. Fractional calculus method for enhancing digital image of bank slip. In Proceedings of the 2008 Congress on Image and Signal Processing, Sanya, China, 27–30 May 2008; Volume 3, pp. 326–330. [Google Scholar]
- Pu, Y.F.; Zhou, J.L.; Yuan, X. Fractional differential mask: A fractional differential-based approach for multiscale texture enhancement. IEEE Trans. Image Process. 2009, 19, 491–511. [Google Scholar] [PubMed]
- Zhang, L.; Zhang, L.; Mou, X.; Zhang, D. FSIM: A feature similarity index for image quality assessment. IEEE Trans. Image Process. 2011, 20, 2378–2386. [Google Scholar] [CrossRef] [Green Version]
- Zhang, X.; Feng, X.; Wang, W.; Xue, W. Edge strength similarity for image quality assessment. IEEE Signal Process. Lett. 2013, 20, 319–322. [Google Scholar] [CrossRef]
- Imamoglu, N.; Lin, W.; Fang, Y. A saliency detection model using low-level features based on wavelet transform. IEEE Trans. Multimed. 2012, 15, 96–105. [Google Scholar] [CrossRef]
- Xu, L.; Lin, W.; Kuo, C.C.J. Visual Quality Assessment by Machine Learning; Springer: Berlin, Germany, 2015. [Google Scholar]
- Sheikh, H.R.; Sabir, M.F.; Bovik, A.C. A statistical evaluation of recent full reference image quality assessment algorithms. IEEE Trans. Image Process. 2006, 15, 3440–3451. [Google Scholar] [CrossRef] [PubMed]
- Ponomarenko, N.; Lukin, V.; Zelensky, A.; Egiazarian, K.; Carli, M.; Battisti, F. TID2008-a database for evaluation of full-reference visual quality assessment metrics. Adv. Mod. Radioelectron. 2009, 10, 30–45. [Google Scholar]
- Larson, E.C.; Chandler, D.M. Most apparent distortion: Full-reference image quality assessment and the role of strategy. J. Electron. Imaging 2010, 19, 011006. [Google Scholar]
- Yu, X.; Bampis, C.G.; Gupta, P.; Bovik, A.C. Predicting the quality of images compressed after distortion in two steps. IEEE Trans. Image Process. 2019, 28, 5757–5770. [Google Scholar] [CrossRef]
- Temel, D.; AlRegib, G. CSV: Image quality assessment based on color, structure, and visual system. Signal Process. Image Commun. 2016, 48, 92–103. [Google Scholar] [CrossRef] [Green Version]
- Ding, K.; Ma, K.; Wang, S.; Simoncelli, E.P. Image quality assessment: Unifying structure and texture similarity. arXiv 2020, arXiv:2004.07728. [Google Scholar] [CrossRef] [PubMed]
- Temel, D.; AlRegib, G. ReSIFT: Reliability-weighted sift-based image quality assessment. In Proceedings of the 2016 IEEE International Conference on Image Processing (ICIP), Phoenix, AZ, USA, 25–28 September 2016; pp. 2047–2051. [Google Scholar]
- Yang, G.; Li, D.; Lu, F.; Liao, Y.; Yang, W. RVSIM: A feature similarity method for full-reference image quality assessment. EURASIP J. Image Video Process. 2018, 2018, 6. [Google Scholar] [CrossRef] [Green Version]


| Attribute | KADID-10k [5] | TID2013 [3] | TID2008 [56] | CSIQ [57] |
|---|---|---|---|---|
| Year | 2019 | 2013 | 2008 | 2010 |
| Number of reference images | 85 | 25 | 25 | 30 |
| Number of distorted images | 10,125 | 3000 | 1700 | 866 |
| Number of distortion types | 25 | 24 | 17 | 6 |
| Number of distortion levels | 5 | 5 | 4 | 4–5 |
| Subjective testing method | DCR | Custom | Custom | Custom |
| Resolution | ||||
| MOS range | 1–5 | 0–9 | 0–9 | 0–1 |
| KADID-10k [5] | TID2013 [3] | |||||
|---|---|---|---|---|---|---|
| FR-IQA Metric | PLCC | SROCC | KROCC | PLCC | SROCC | KROCC |
| 2stepQA [58] | 0.768 | 0.771 | 0.571 | 0.736 | 0.733 | 0.550 |
| CSV [59] | 0.671 | 0.669 | 0.531 | 0.852 | 0.848 | 0.657 |
| DISTS [60] | 0.809 | 0.814 | 0.626 | 0.759 | 0.711 | 0.524 |
| GSM [8] | 0.780 | 0.780 | 0.588 | 0.789 | 0.787 | 0.593 |
| MAD [57] | 0.716 | 0.724 | 0.535 | 0.827 | 0.778 | 0.600 |
| MS-SSIM [16] | 0.819 | 0.821 | 0.630 | 0.794 | 0.785 | 0.604 |
| ReSIFT [61] | 0.648 | 0.628 | 0.468 | 0.630 | 0.623 | 0.471 |
| RVSIM [62] | 0.728 | 0.719 | 0.540 | 0.763 | 0.683 | 0.520 |
| SSIM [15] | 0.670 | 0.671 | 0.489 | 0.618 | 0.616 | 0.437 |
| LGV | 0.640 | 0.820 | 0.630 | 0.832 | 0.801 | 0.631 |
| SWLGV | 0.685 | 0.840 | 0.655 | 0.855 | 0.804 | 0.637 |
| TID2008 [56] | CSIQ [57] | |||||
|---|---|---|---|---|---|---|
| FR-IQA Metric | PLCC | SROCC | KROCC | PLCC | SROCC | KROCC |
| 2stepQA [58] | 0.757 | 0.769 | 0.574 | 0.841 | 0.849 | 0.655 |
| CSV [59] | 0.852 | 0.851 | 0.659 | 0.933 | 0.933 | 0.766 |
| DISTS [60] | 0.705 | 0.668 | 0.488 | 0.930 | 0.930 | 0.764 |
| GSM [8] | 0.782 | 0.781 | 0.578 | 0.906 | 0.910 | 0.729 |
| MAD [57] | 0.831 | 0.829 | 0.639 | 0.950 | 0.947 | 0.796 |
| MS-SSIM [16] | 0.838 | 0.846 | 0.648 | 0.913 | 0.917 | 0.743 |
| ReSIFT [61] | 0.627 | 0.632 | 0.484 | 0.884 | 0.868 | 0.695 |
| RVSIM [62] | 0.789 | 0.743 | 0.566 | 0.923 | 0.903 | 0.728 |
| SSIM [15] | 0.669 | 0.675 | 0.485 | 0.812 | 0.812 | 0.606 |
| LGV | 0.778 | 0.874 | 0.687 | 0.779 | 0.926 | 0.760 |
| SWLGV | 0.811 | 0.884 | 0.705 | 0.776 | 0.922 | 0.755 |
| Direct Average | Weighted Average | |||||
|---|---|---|---|---|---|---|
| FR-IQA Metric | PLCC | SROCC | KROCC | PLCC | SROCC | KROCC |
| 2stepQA [58] | 0.776 | 0.781 | 0.587 | 0.765 | 0.768 | 0.572 |
| CSV [59] | 0.827 | 0.825 | 0.653 | 0.740 | 0.738 | 0.582 |
| DISTS [60] | 0.801 | 0.781 | 0.601 | 0.795 | 0.785 | 0.599 |
| GSM [8] | 0.814 | 0.815 | 0.622 | 0.789 | 0.789 | 0.596 |
| MAD [57] | 0.831 | 0.820 | 0.643 | 0.763 | 0.758 | 0.573 |
| MS-SSIM [16] | 0.841 | 0.842 | 0.656 | 0.821 | 0.822 | 0.633 |
| ReSIFT [61] | 0.697 | 0.688 | 0.530 | 0.655 | 0.641 | 0.483 |
| RVSIM [62] | 0.801 | 0.762 | 0.589 | 0.752 | 0.725 | 0.549 |
| SSIM [15] | 0.692 | 0.694 | 0.504 | 0.668 | 0.669 | 0.485 |
| LGV | 0.757 | 0.855 | 0.677 | 0.699 | 0.828 | 0.644 |
| SWLGV | 0.782 | 0.863 | 0.688 | 0.736 | 0.842 | 0.662 |
| 2stepQA [58] | CSV [59] | DISTS [60] | GSM [8] | MAD [57] | MS-SSIM [16] | ReSIFT [61] | RVSIM [62] | SSIM [15] | LGV | SWLGV | |
|---|---|---|---|---|---|---|---|---|---|---|---|
| Level 1 | 0.246 | 0.424 | 0.235 | 0.372 | 0.388 | 0.166 | 0.181 | 0.248 | 0.204 | 0.401 | 0.398 |
| Level 2 | 0.394 | 0.626 | 0.440 | 0.512 | 0.368 | 0.049 | 0.401 | 0.430 | 0.276 | 0.605 | 0.610 |
| Level 3 | 0.539 | 0.635 | 0.367 | 0.523 | 0.442 | 0.240 | 0.415 | 0.416 | 0.084 | 0.630 | 0.632 |
| Level 4 | 0.571 | 0.749 | 0.606 | 0.669 | 0.284 | 0.172 | 0.699 | 0.702 | 0.208 | 0.728 | 0.735 |
| Level 5 | 0.663 | 0.787 | 0.664 | 0.745 | 0.308 | 0.397 | 0.788 | 0.803 | 0.202 | 0.746 | 0.747 |
| All | 0.733 | 0.848 | 0.711 | 0.787 | 0.778 | 0.785 | 0.623 | 0.683 | 0.616 | 0.801 | 0.804 |
| 2stepQA [58] | CSV [59] | DISTS [60] | GSM [8] | MAD [57] | MS-SSIM [16] | ReSIFT [61] | RVSIM [62] | SSIM [15] | LGV | SWLGV | |
|---|---|---|---|---|---|---|---|---|---|---|---|
| Level 1 | 0.470 | 0.638 | 0.566 | 0.639 | 0.432 | 0.067 | 0.457 | 0.634 | 0.368 | 0.644 | 0.649 |
| Level 2 | 0.619 | 0.683 | 0.381 | 0.636 | 0.520 | 0.221 | 0.437 | 0.513 | 0.105 | 0.701 | 0.703 |
| Level 3 | 0.573 | 0.774 | 0.581 | 0.677 | 0.239 | 0.059 | 0.707 | 0.761 | 0.190 | 0.779 | 0.782 |
| Level 4 | 0.610 | 0.829 | 0.628 | 0.718 | 0.232 | 0.275 | 0.788 | 0.825 | 0.241 | 0.841 | 0.845 |
| All | 0.769 | 0.851 | 0.668 | 0.781 | 0.829 | 0.846 | 0.632 | 0.743 | 0.675 | 0.874 | 0.884 |
| 2stepQA [58] | CSV [59] | DISTS [60] | GSM [8] | MAD [57] | MS-SSIM [16] | ReSIFT [61] | RVSIM [62] | SSIM [15] | LGV | SWLGV | |
|---|---|---|---|---|---|---|---|---|---|---|---|
| AGN | 0.817 | 0.938 | 0.845 | 0.899 | 0.912 | 0.624 | 0.831 | 0.886 | 0.848 | 0.921 | 0.936 |
| ANC | 0.590 | 0.862 | 0.786 | 0.823 | 0.800 | 0.387 | 0.749 | 0.836 | 0.779 | 0.911 | 0.904 |
| SCN | 0.860 | 0.939 | 0.859 | 0.927 | 0.929 | 0.683 | 0.839 | 0.868 | 0.851 | 0.887 | 0.930 |
| MN | 0.395 | 0.748 | 0.814 | 0.704 | 0.658 | 0.372 | 0.702 | 0.734 | 0.775 | 0.821 | 0.842 |
| HFN | 0.828 | 0.927 | 0.868 | 0.884 | 0.902 | 0.704 | 0.869 | 0.895 | 0.889 | 0.916 | 0.874 |
| IN | 0.715 | 0.848 | 0.674 | 0.813 | 0.743 | 0.766 | 0.824 | 0.865 | 0.810 | 0.759 | 0.795 |
| QN | 0.886 | 0.892 | 0.810 | 0.911 | 0.895 | 0.720 | 0.745 | 0.869 | 0.817 | 0.866 | 0.956 |
| GB | 0.853 | 0.933 | 0.926 | 0.954 | 0.915 | 0.762 | 0.937 | 0.970 | 0.910 | 0.952 | 0.961 |
| DEN | 0.900 | 0.952 | 0.899 | 0.955 | 0.922 | 0.819 | 0.907 | 0.926 | 0.876 | 0.984 | 0.976 |
| JPEG | 0.867 | 0.944 | 0.897 | 0.933 | 0.924 | 0.784 | 0.905 | 0.930 | 0.893 | 0.970 | 0.952 |
| JP2K | 0.891 | 0.966 | 0.931 | 0.934 | 0.929 | 0.790 | 0.928 | 0.946 | 0.806 | 0.945 | 0.968 |
| JGTE | 0.806 | 0.800 | 0.906 | 0.866 | 0.768 | 0.582 | 0.712 | 0.831 | 0.701 | 0.895 | 0.900 |
| J2TE | 0.854 | 0.887 | 0.865 | 0.893 | 0.854 | 0.742 | 0.835 | 0.882 | 0.813 | 0.918 | 0.874 |
| NEPN | 0.775 | 0.811 | 0.833 | 0.804 | 0.803 | 0.792 | 0.693 | 0.771 | 0.634 | 0.719 | 0.795 |
| BLOCK | 0.044 | 0.183 | 0.302 | 0.588 | −0.322 | 0.382 | 0.440 | 0.545 | 0.564 | 0.603 | 0.601 |
| MS | 0.660 | 0.654 | 0.752 | 0.728 | 0.708 | 0.732 | 0.418 | 0.559 | 0.738 | 0.677 | 0.756 |
| CC | 0.430 | 0.227 | 0.464 | 0.466 | 0.420 | 0.027 | −0.055 | 0.132 | 0.355 | 0.659 | 0.667 |
| CCS | −0.258 | 0.809 | 0.789 | 0.676 | −0.059 | −0.055 | −0.209 | 0.366 | 0.742 | 0.750 | 0.758 |
| MGN | 0.747 | 0.884 | 0.790 | 0.831 | 0.888 | 0.653 | 0.765 | 0.853 | 0.804 | 0.819 | 0.841 |
| CN | 0.858 | 0.924 | 0.907 | 0.902 | 0.904 | 0.596 | 0.882 | 0.914 | 0.797 | 0.838 | 0.859 |
| LCNI | 0.902 | 0.965 | 0.932 | 0.945 | 0.950 | 0.713 | 0.897 | 0.933 | 0.877 | 0.873 | 0.917 |
| ICQD | 0.808 | 0.919 | 0.832 | 0.901 | 0.867 | 0.739 | 0.770 | 0.871 | 0.820 | 0.845 | 0.864 |
| CA | 0.702 | 0.845 | 0.879 | 0.835 | 0.760 | 0.568 | 0.838 | 0.871 | 0.740 | 0.793 | 0.788 |
| SSR | 0.926 | 0.976 | 0.944 | 0.961 | 0.949 | 0.801 | 0.944 | 0.956 | 0.822 | 0.800 | 0.810 |
| All | 0.733 | 0.848 | 0.711 | 0.787 | 0.778 | 0.785 | 0.623 | 0.683 | 0.616 | 0.801 | 0.804 |
| 2stepQA [58] | CSV [59] | DISTS [60] | GSM [8] | MAD [57] | MS-SSIM [16] | ReSIFT [61] | RVSIM [62] | SSIM [15] | LGV | SWLGV | |
|---|---|---|---|---|---|---|---|---|---|---|---|
| AGN | 0.766 | 0.922 | 0.812 | 0.855 | 0.872 | 0.610 | 0.771 | 0.840 | 0.805 | 0.913 | 0.922 |
| ANC | 0.627 | 0.893 | 0.811 | 0.821 | 0.803 | 0.354 | 0.762 | 0.829 | 0.780 | 0.898 | 0.897 |
| SCN | 0.814 | 0.932 | 0.838 | 0.904 | 0.901 | 0.727 | 0.810 | 0.837 | 0.800 | 0.917 | 0.914 |
| MN | 0.450 | 0.781 | 0.830 | 0.736 | 0.673 | 0.304 | 0.728 | 0.760 | 0.797 | 0.809 | 0.843 |
| HFN | 0.818 | 0.936 | 0.870 | 0.889 | 0.894 | 0.749 | 0.881 | 0.886 | 0.871 | 0.918 | 0.908 |
| IN | 0.659 | 0.819 | 0.626 | 0.764 | 0.650 | 0.767 | 0.777 | 0.836 | 0.776 | 0.786 | 0.786 |
| QN | 0.850 | 0.894 | 0.770 | 0.903 | 0.851 | 0.708 | 0.730 | 0.836 | 0.784 | 0.887 | 0.941 |
| GB | 0.877 | 0.923 | 0.909 | 0.948 | 0.896 | 0.759 | 0.904 | 0.963 | 0.866 | 0.959 | 0.960 |
| DEN | 0.919 | 0.970 | 0.931 | 0.971 | 0.928 | 0.786 | 0.923 | 0.939 | 0.873 | 0.967 | 0.971 |
| JPEG | 0.895 | 0.948 | 0.894 | 0.937 | 0.931 | 0.774 | 0.914 | 0.926 | 0.880 | 0.953 | 0.948 |
| JP2K | 0.910 | 0.984 | 0.953 | 0.949 | 0.941 | 0.837 | 0.935 | 0.970 | 0.745 | 0.975 | 0.984 |
| JGTE | 0.851 | 0.790 | 0.907 | 0.871 | 0.781 | 0.606 | 0.735 | 0.860 | 0.666 | 0.879 | 0.901 |
| J2TE | 0.845 | 0.852 | 0.833 | 0.880 | 0.802 | 0.742 | 0.778 | 0.854 | 0.769 | 0.902 | 0.901 |
| NEPN | 0.803 | 0.752 | 0.882 | 0.784 | 0.801 | 0.749 | 0.761 | 0.732 | 0.588 | 0.727 | 0.793 |
| Block | 0.441 | 0.770 | 0.618 | 0.843 | −0.362 | 0.765 | 0.743 | 0.782 | 0.804 | 0.896 | 0.897 |
| MS | 0.655 | 0.594 | 0.681 | 0.638 | 0.563 | 0.711 | 0.322 | 0.525 | 0.629 | 0.699 | 0.774 |
| CC | 0.597 | 0.330 | 0.649 | 0.634 | 0.548 | 0.042 | −0.018 | 0.194 | 0.502 | 0.669 | 0.693 |
| All | 0.769 | 0.851 | 0.668 | 0.781 | 0.829 | 0.846 | 0.632 | 0.743 | 0.675 | 0.874 | 0.884 |
Publisher’s Note: MDPI stays neutral with regard to jurisdictional claims in published maps and institutional affiliations. |
© 2022 by the author. Licensee MDPI, Basel, Switzerland. This article is an open access article distributed under the terms and conditions of the Creative Commons Attribution (CC BY) license (https://creativecommons.org/licenses/by/4.0/).
Share and Cite
Varga, D. Full-Reference Image Quality Assessment Based on Grünwald–Letnikov Derivative, Image Gradients, and Visual Saliency. Electronics 2022, 11, 559. https://doi.org/10.3390/electronics11040559
Varga D. Full-Reference Image Quality Assessment Based on Grünwald–Letnikov Derivative, Image Gradients, and Visual Saliency. Electronics. 2022; 11(4):559. https://doi.org/10.3390/electronics11040559
Chicago/Turabian StyleVarga, Domonkos. 2022. "Full-Reference Image Quality Assessment Based on Grünwald–Letnikov Derivative, Image Gradients, and Visual Saliency" Electronics 11, no. 4: 559. https://doi.org/10.3390/electronics11040559