
Energy Efficiency and Throughput Maximization Using Millimeter Waves–Microwaves HetNets


Abstract
:1. Introduction
2. Related Work
Contribution
- A mathematical formulation of a model for throughput and EE maximization.
- A solution to the formulated problem using OAA.
- Extensive evaluation of results for validation of our method.
- Comparison of the proposed algorithm with existing state-of-the-art algorithms.
3. System Model and Problem Formulation
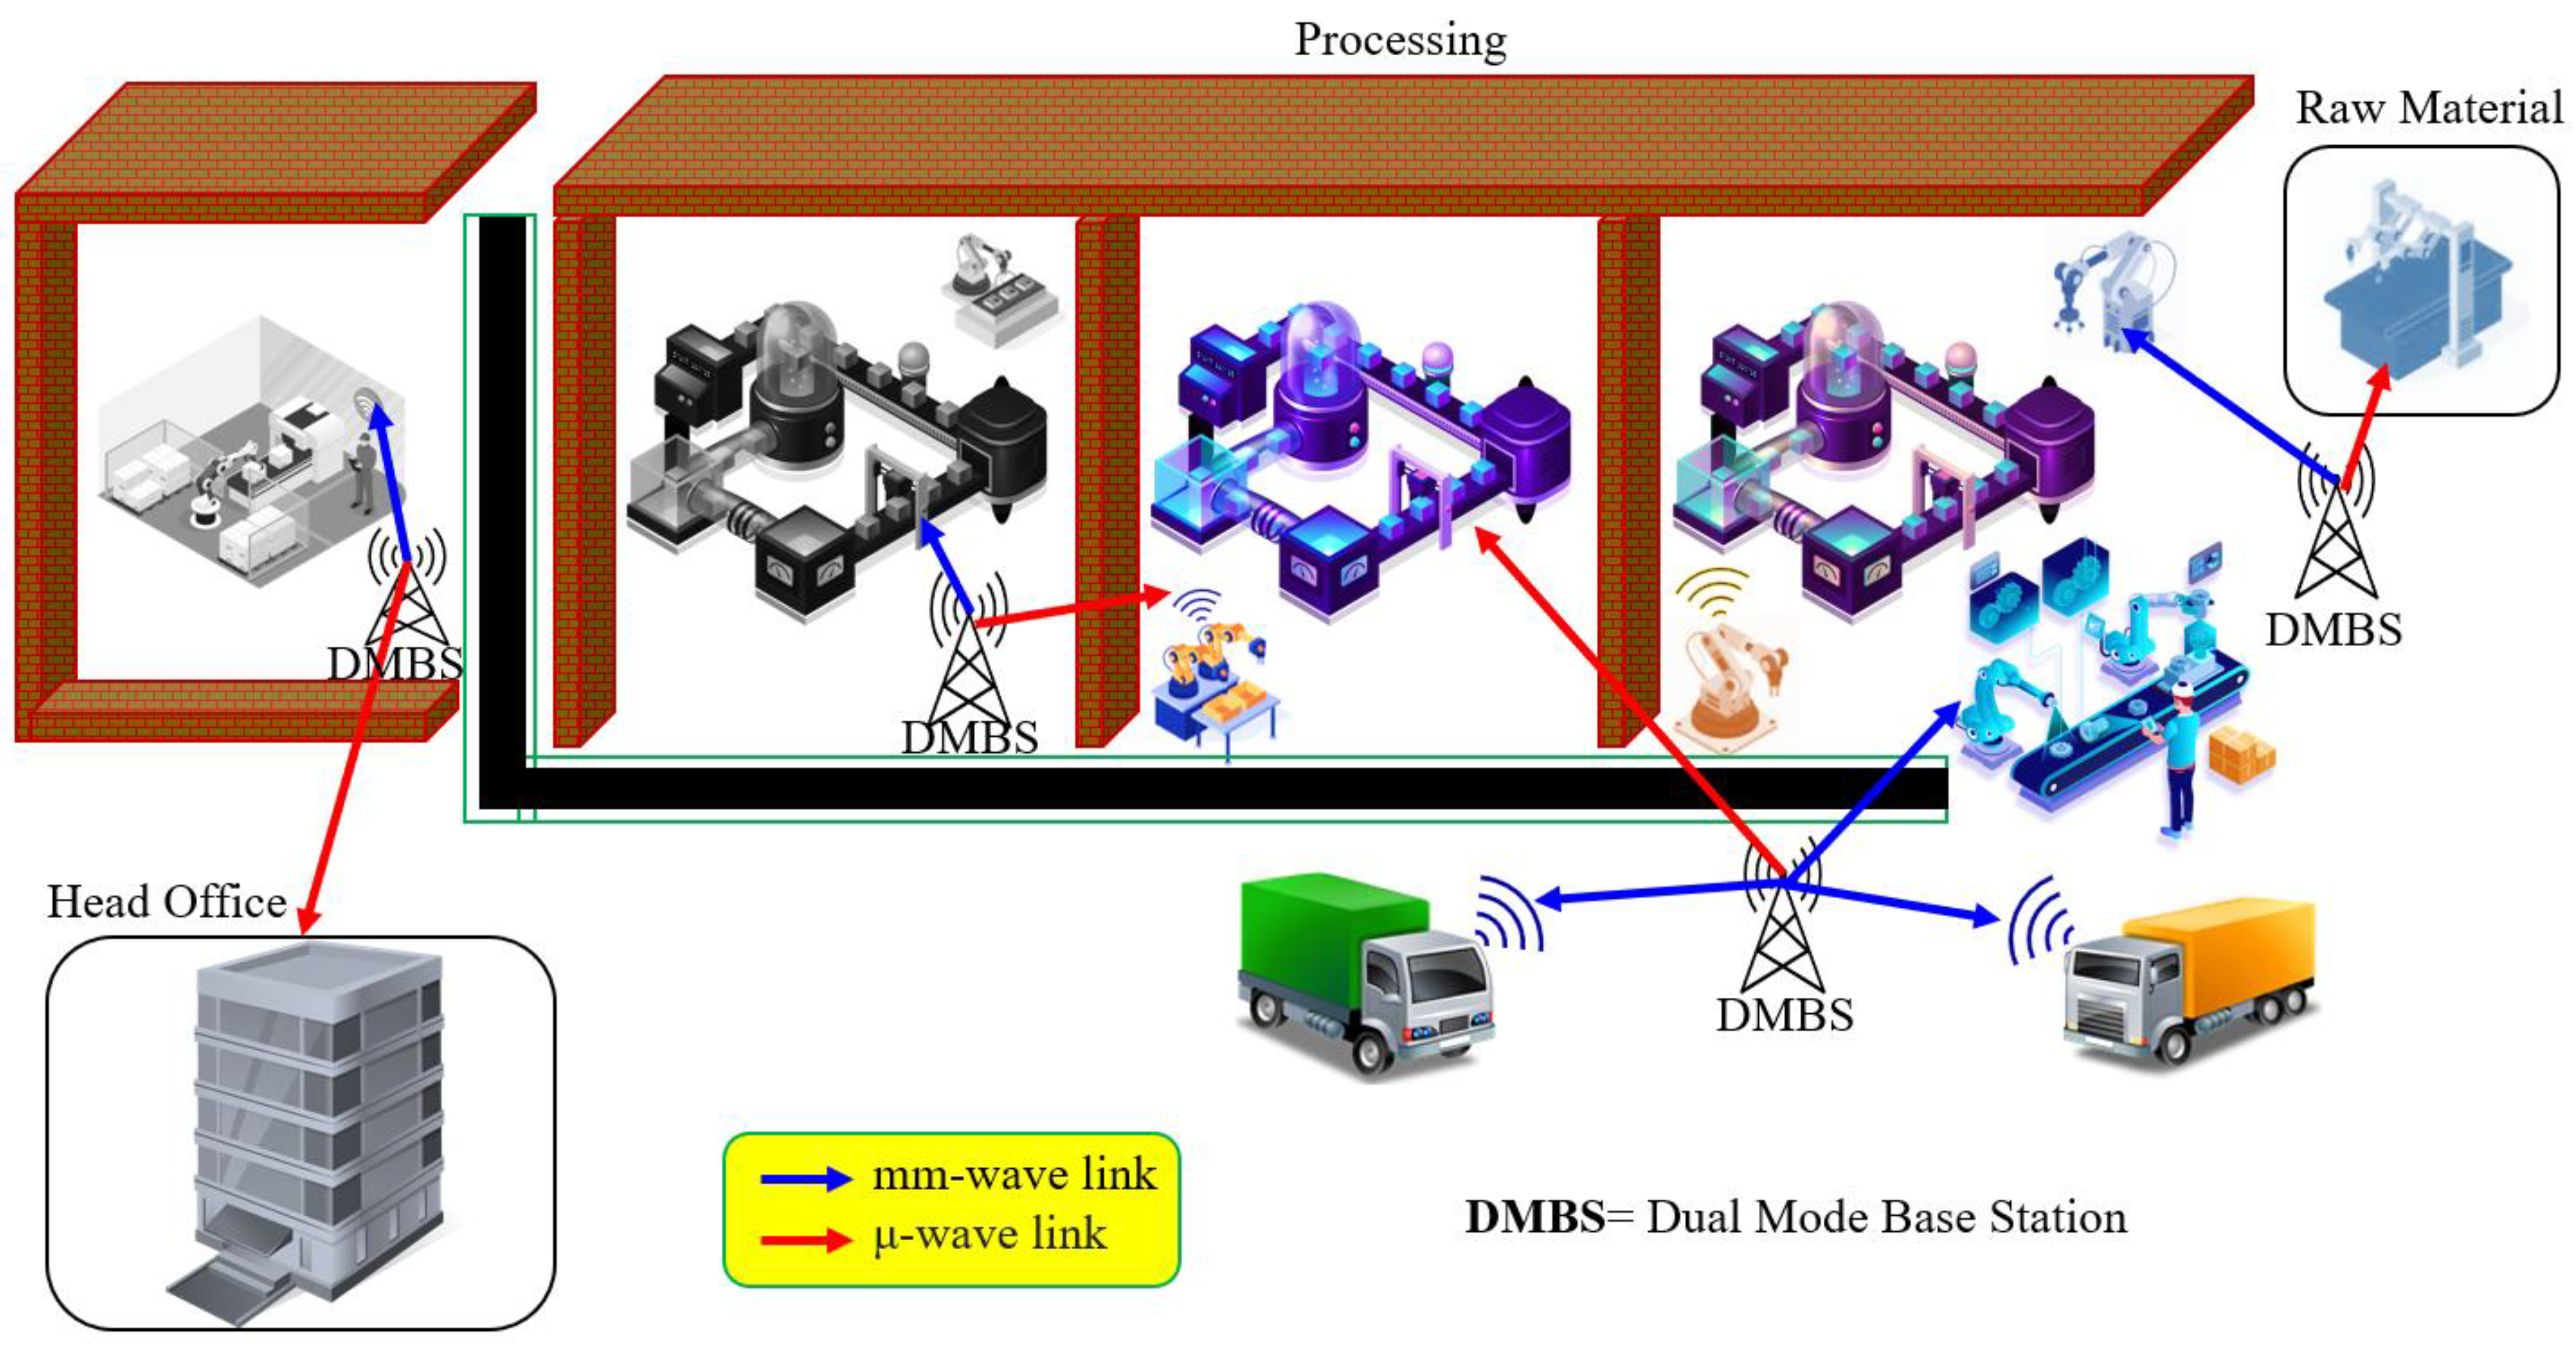
3.1. Scenario of Indoor Factory
3.2. Indoor Factory (InF)
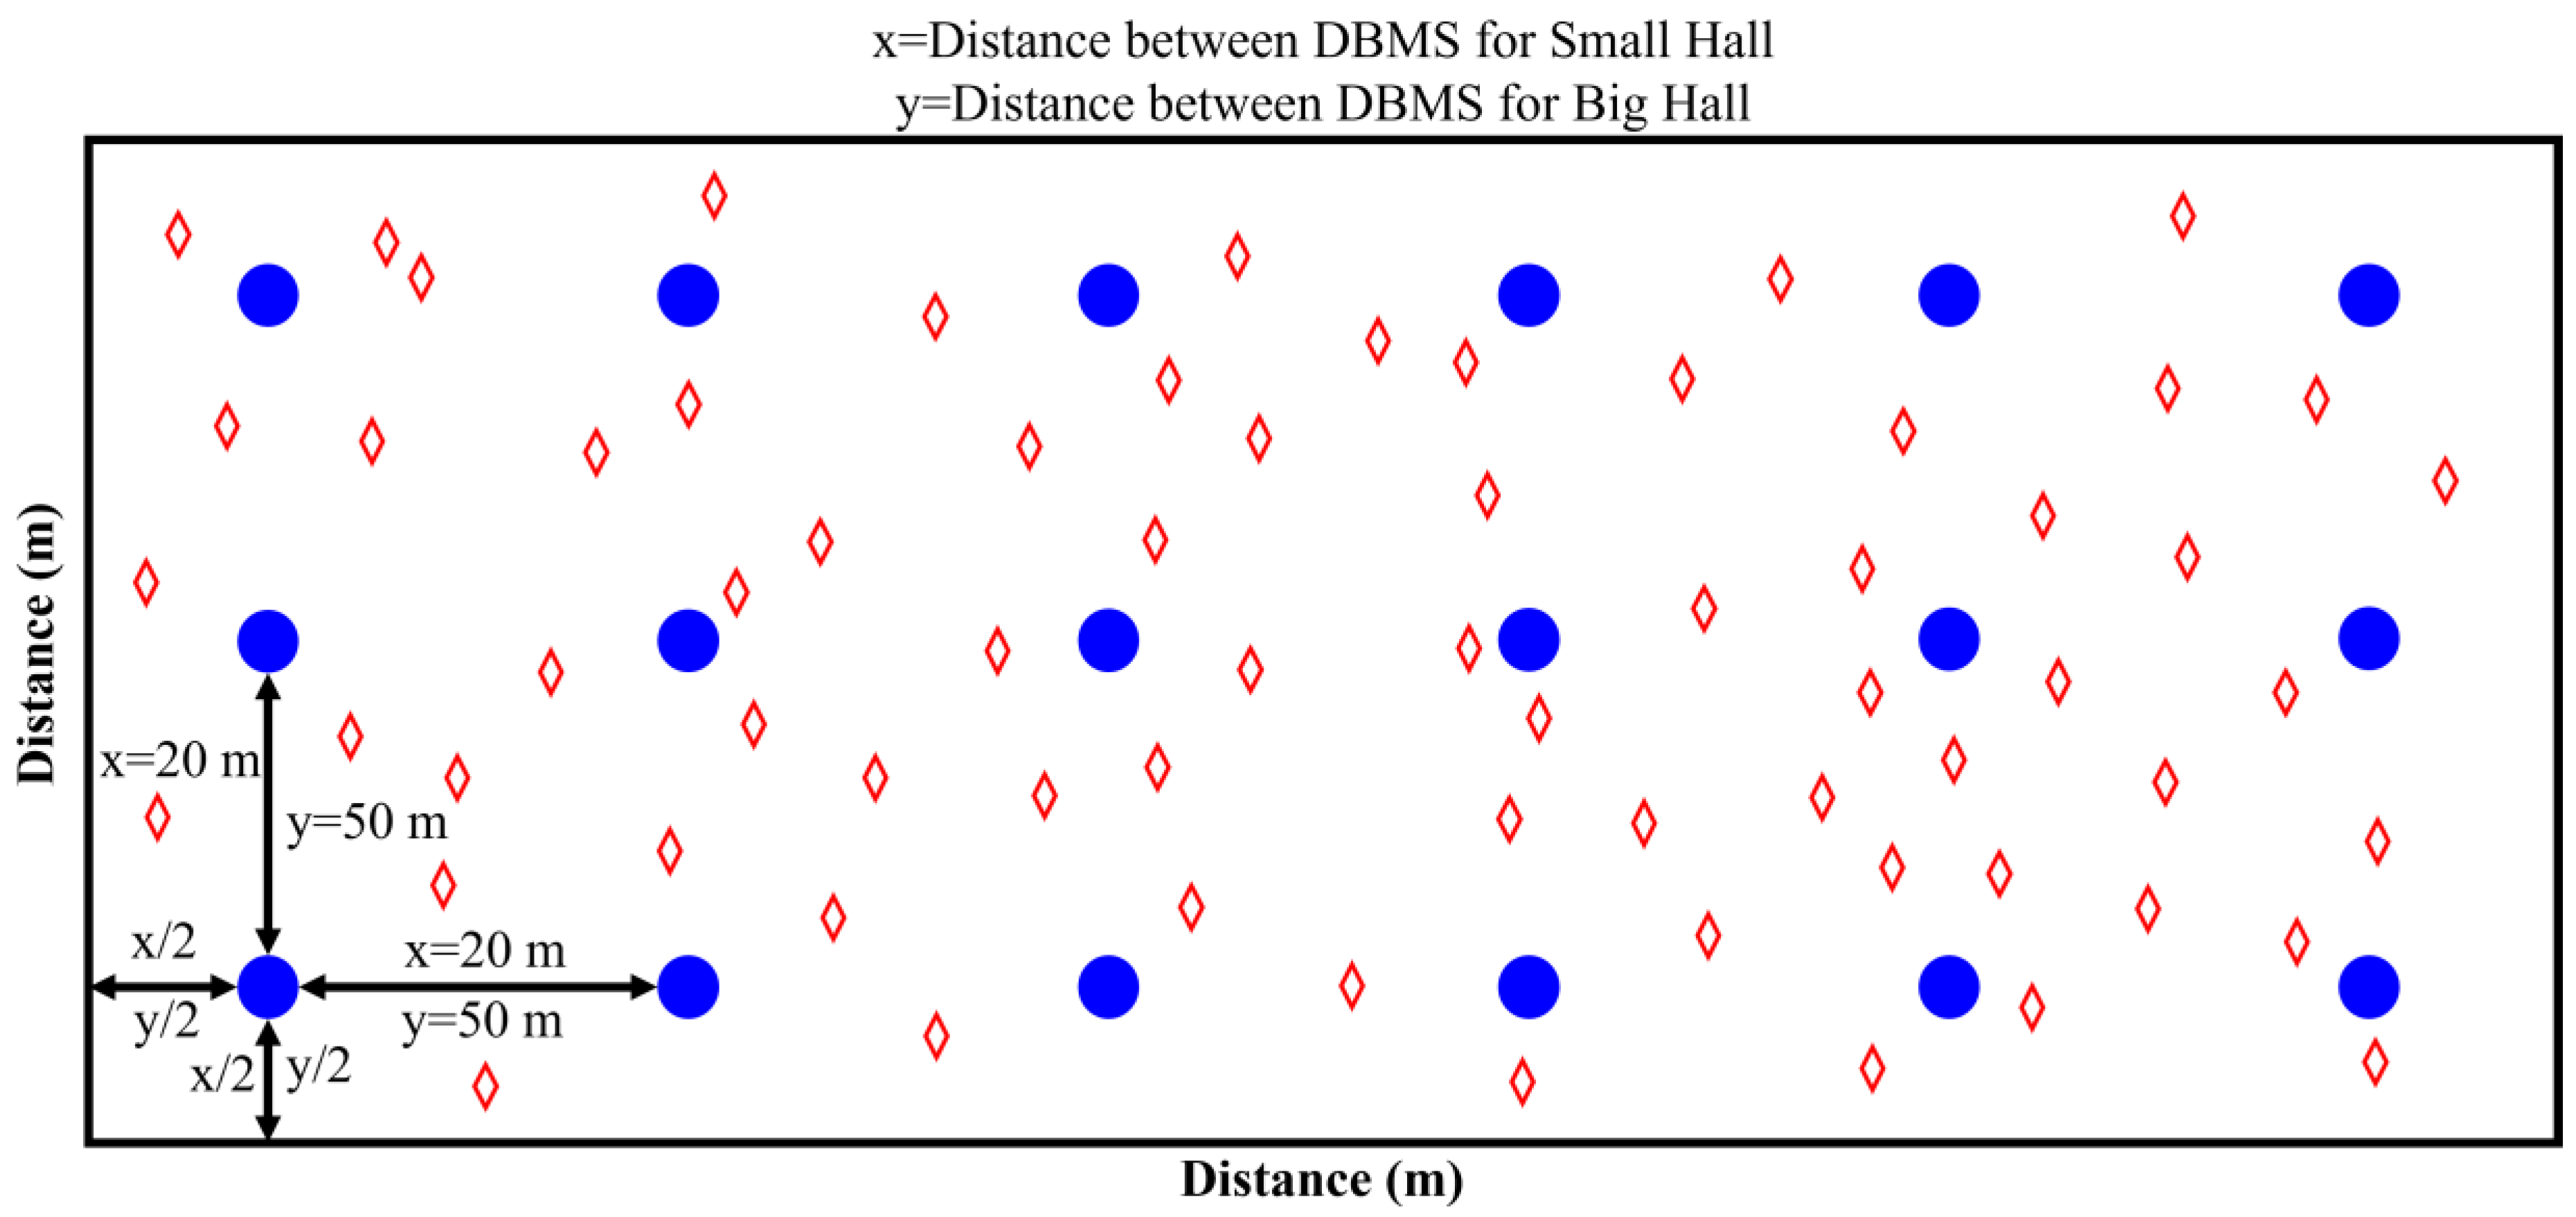
3.2.1. Big Hall of Indoor Factory
3.2.2. Small Hall of Indoor Factory
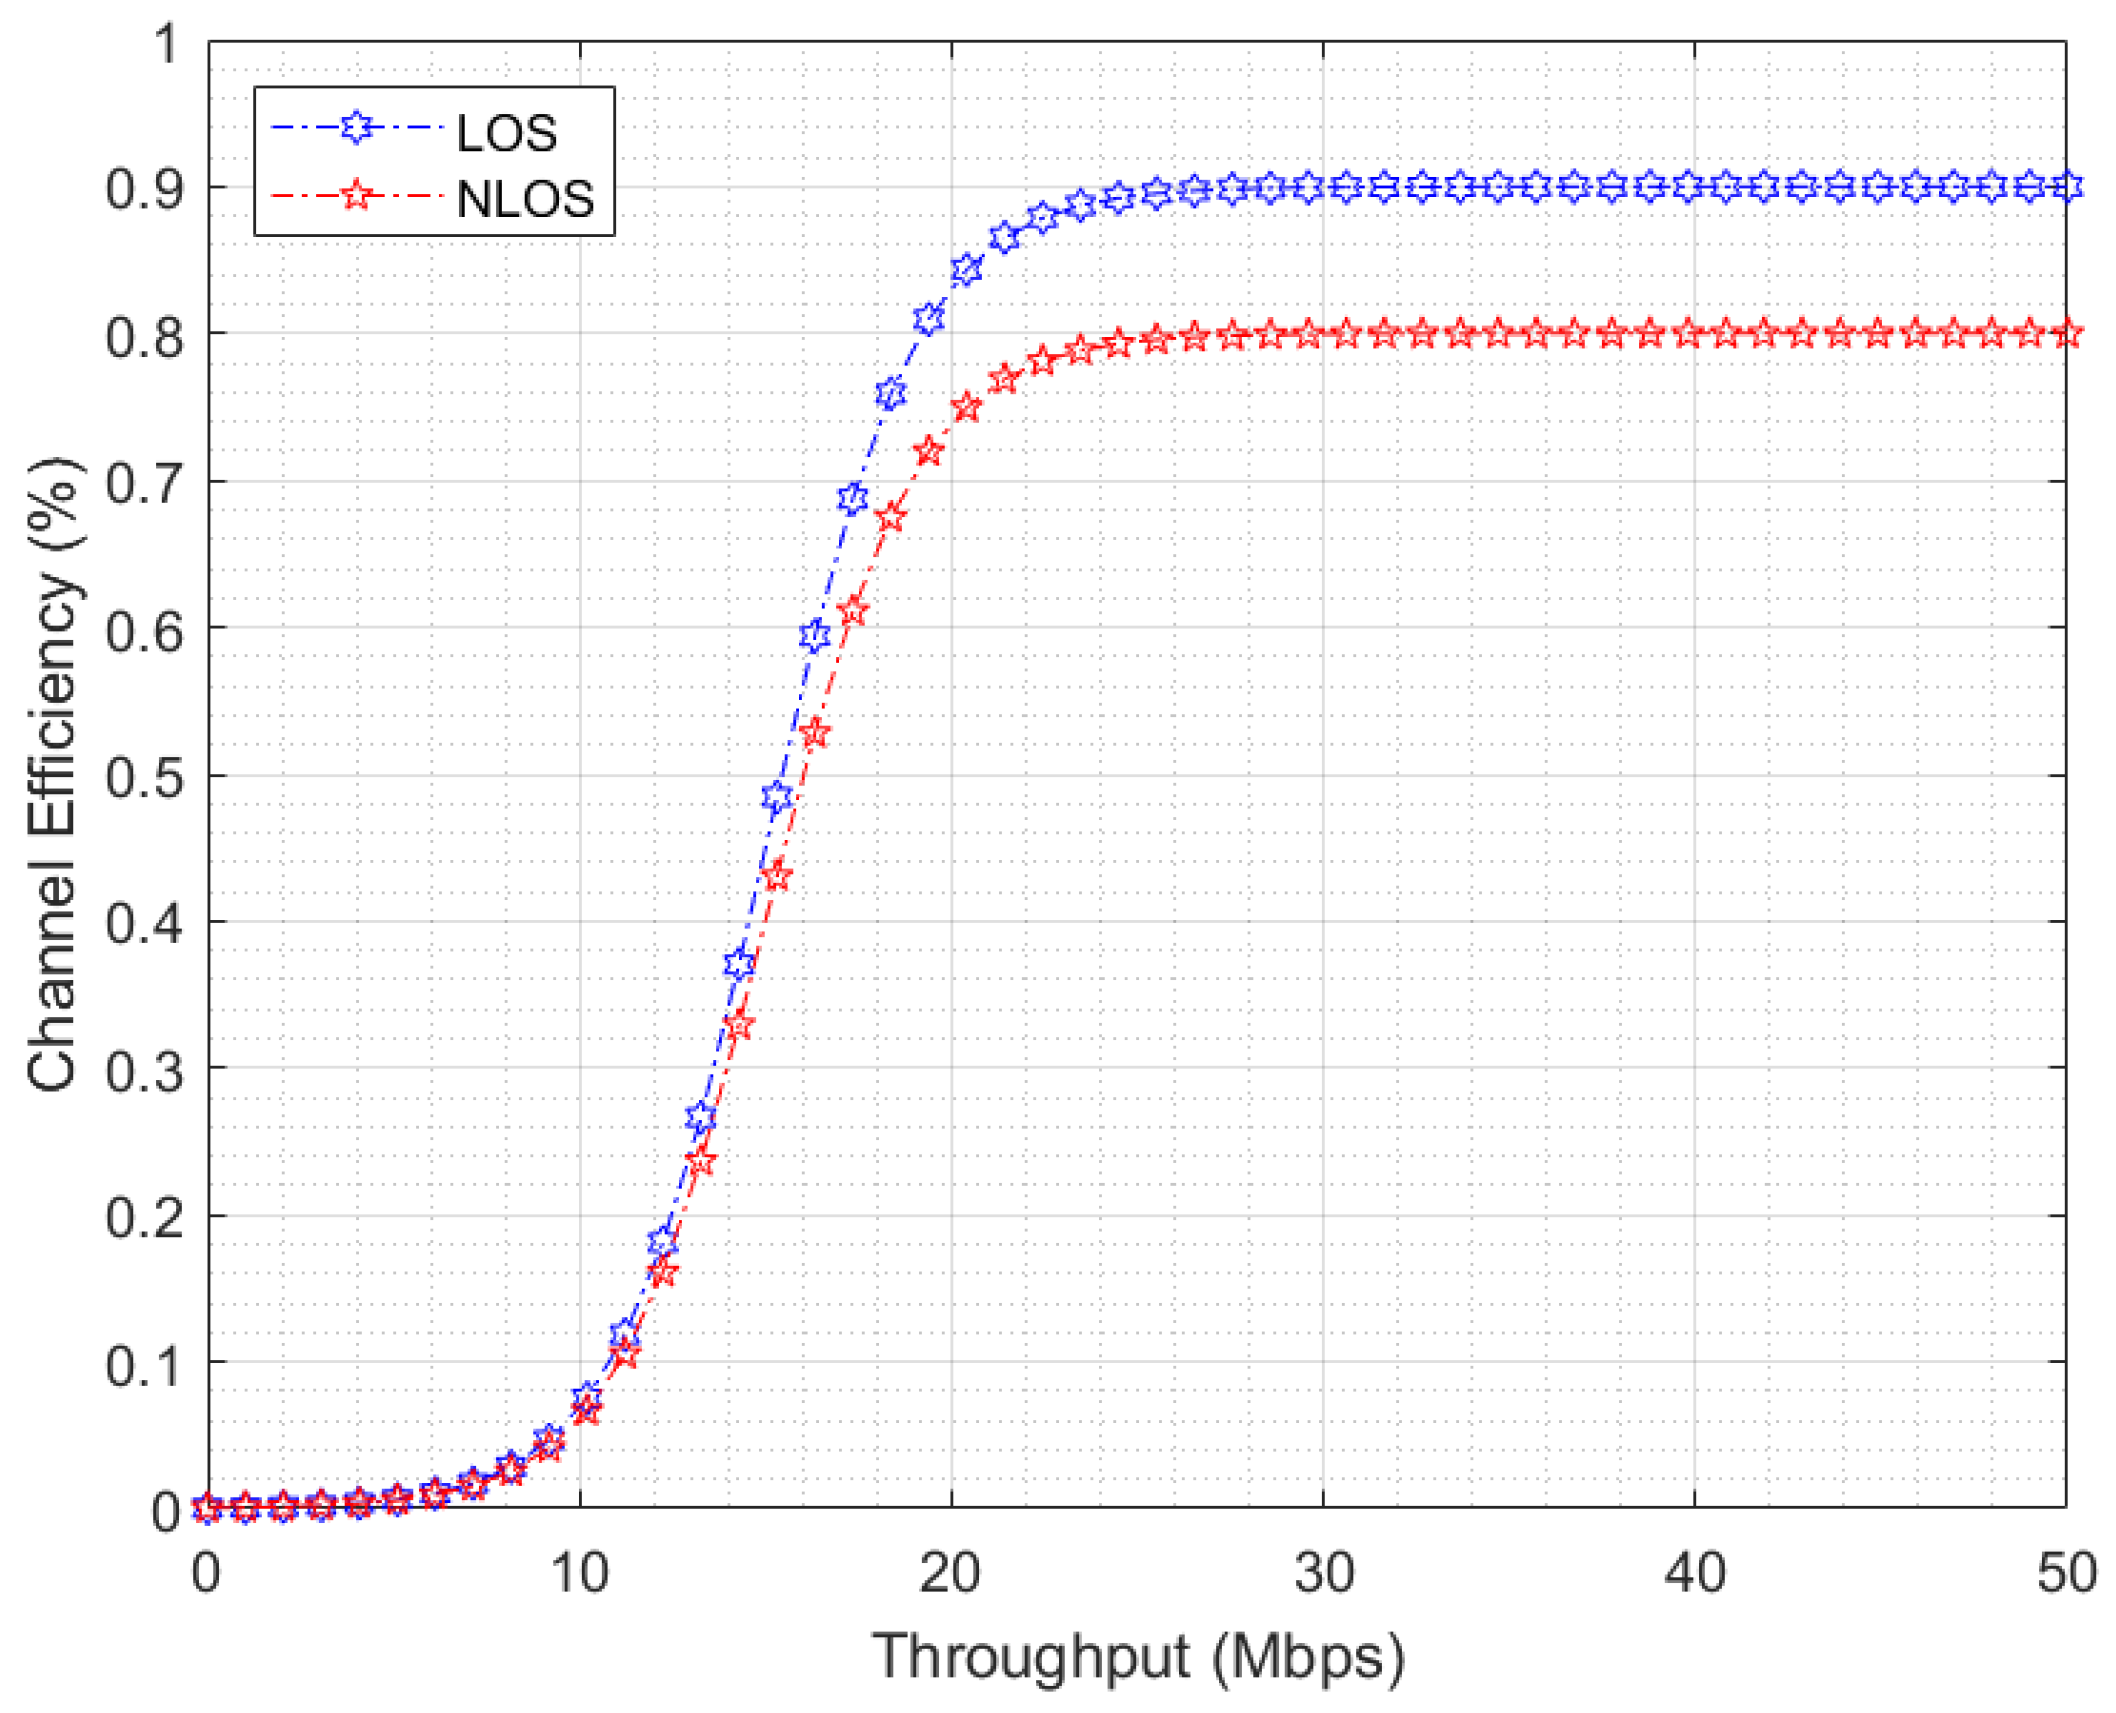
3.2.3. LOS and NLOS Path Loss
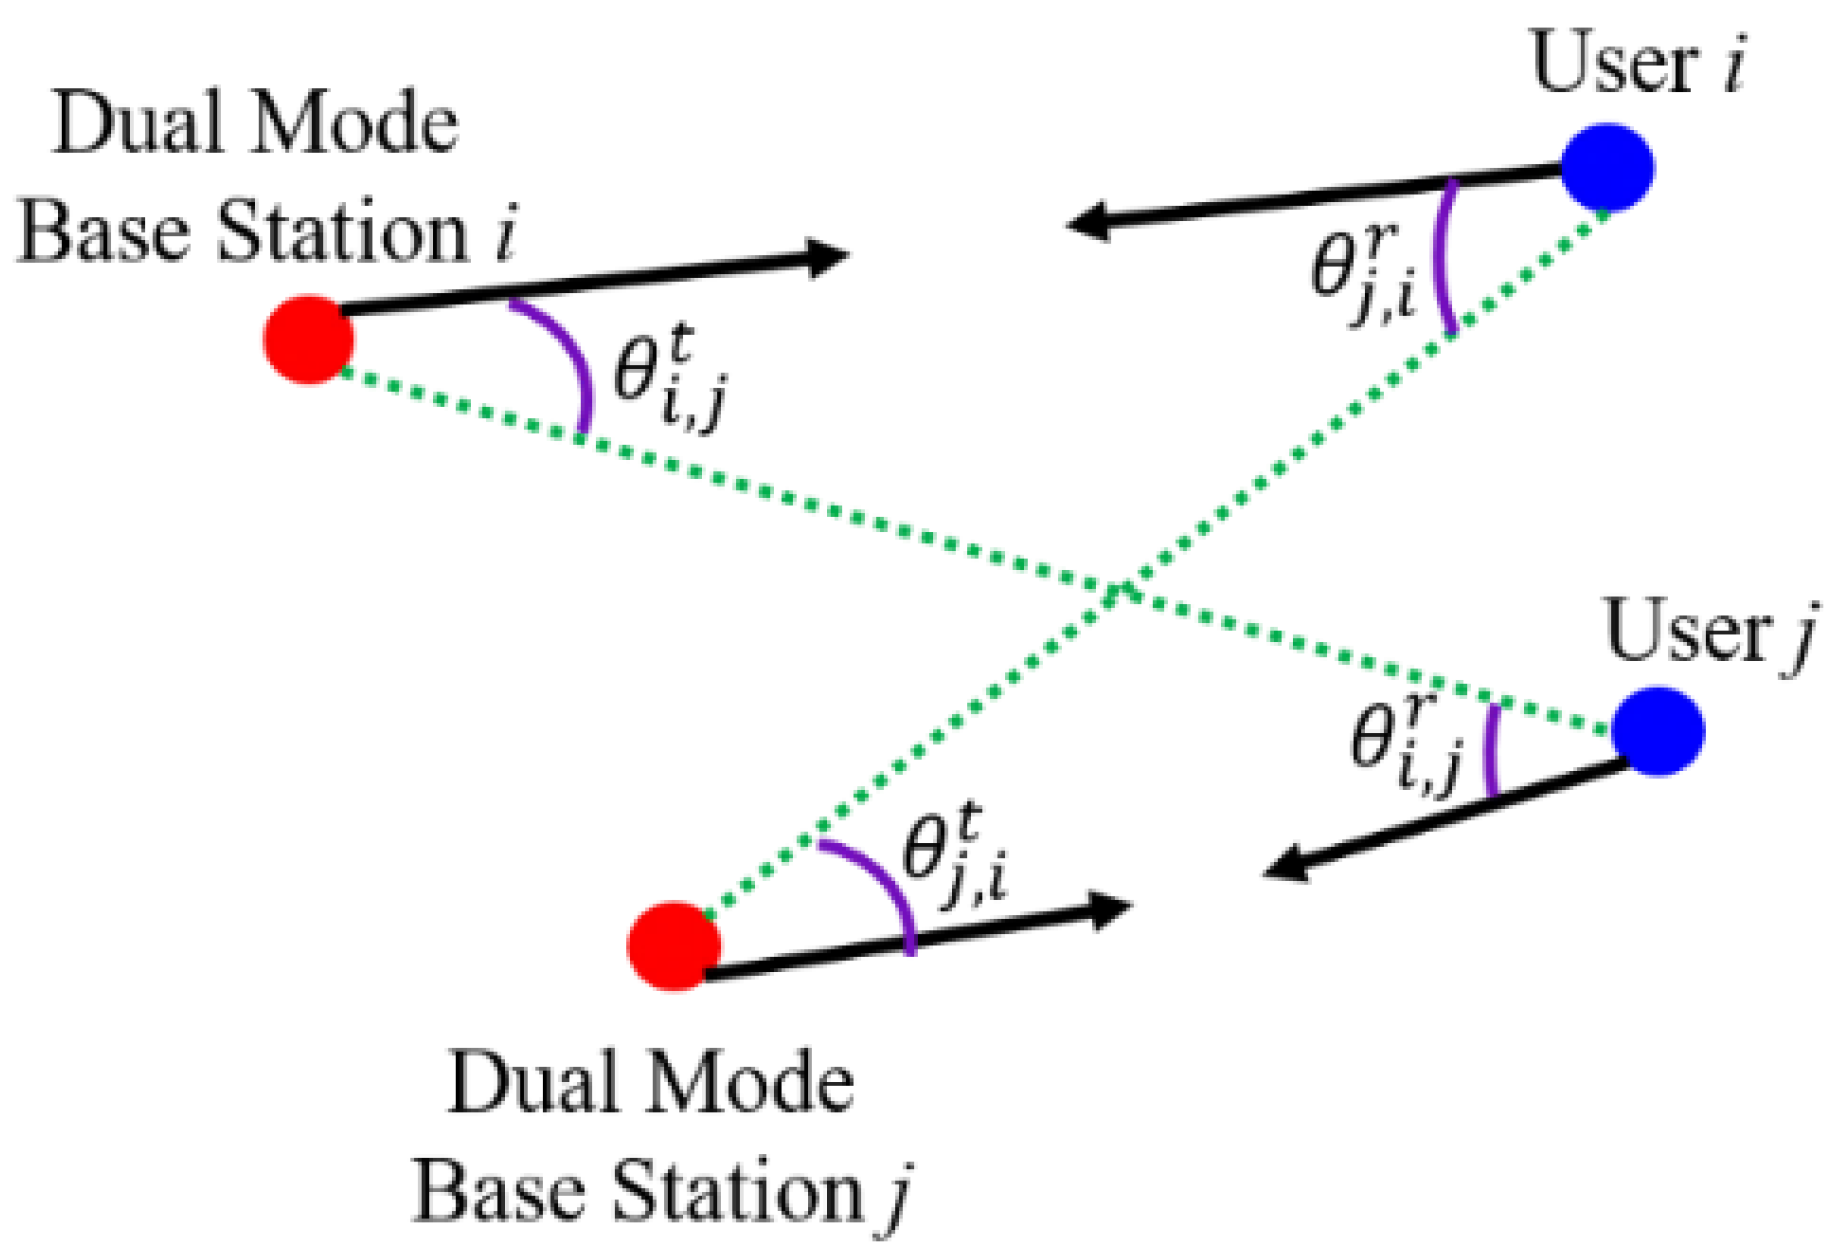
3.2.4. Mathematical Model
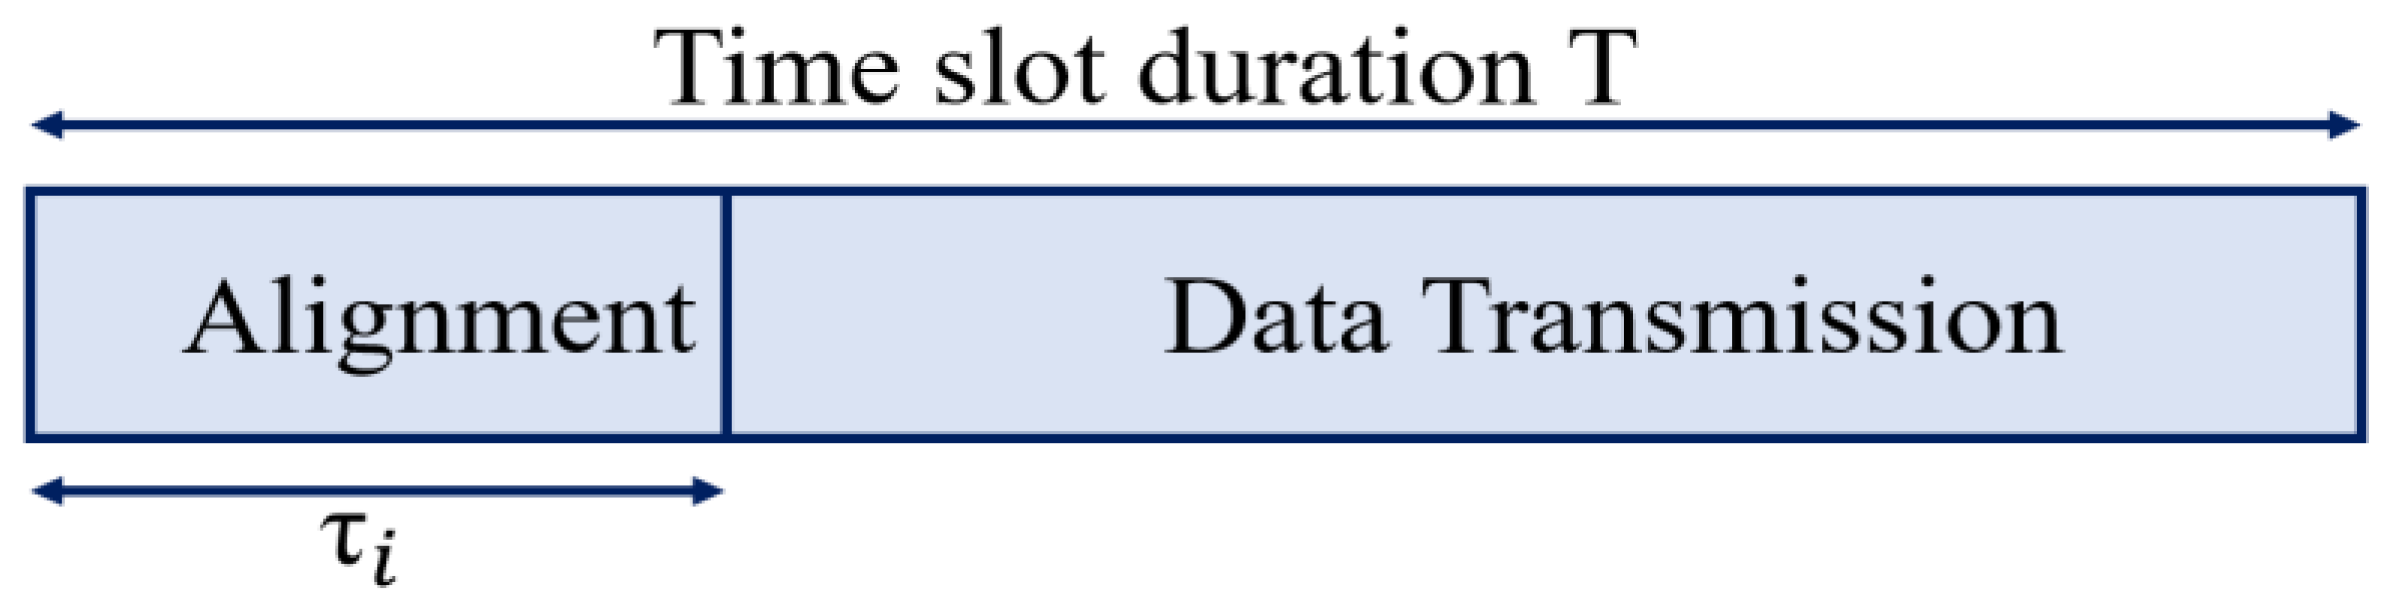
3.2.5. Overhead of Alignment
3.2.6. The Effective Rate of Transmission
3.2.7. The Energy Efficiency (EE) of Network
3.3. Objectives and Constraints
3.3.1. Objectives
3.3.2. First Objective
3.3.3. Second Objective
3.3.4. Constraints
- According to Equations (18a) and (19a), for any ith transmitter, the sector level beamwidth must be greater than or equal to the beam level beamwidth.
- According to Equations (18b) and (19b), for any ith receiver, the sector level beamwidth must be greater than or equal to the beam level beamwidth.
- According to Equations (18c) and (19c), the maximum power level is always more significant than the power of any ith link.
- According to the fourth constraints Equations (18d) and (19d), the rate of the ith link should be greater than the minimum rate for communication for successful communication.
- According to the fifth constraint Equations (18e) and (19e), the SINR of the ith link should be higher than or equal to the minimum level of SINR.
- The last constraint Equations (18f) and (19f) rationalize the corresponding lower bounds on the accessible bandwidth.
4. Proposed Algorithm
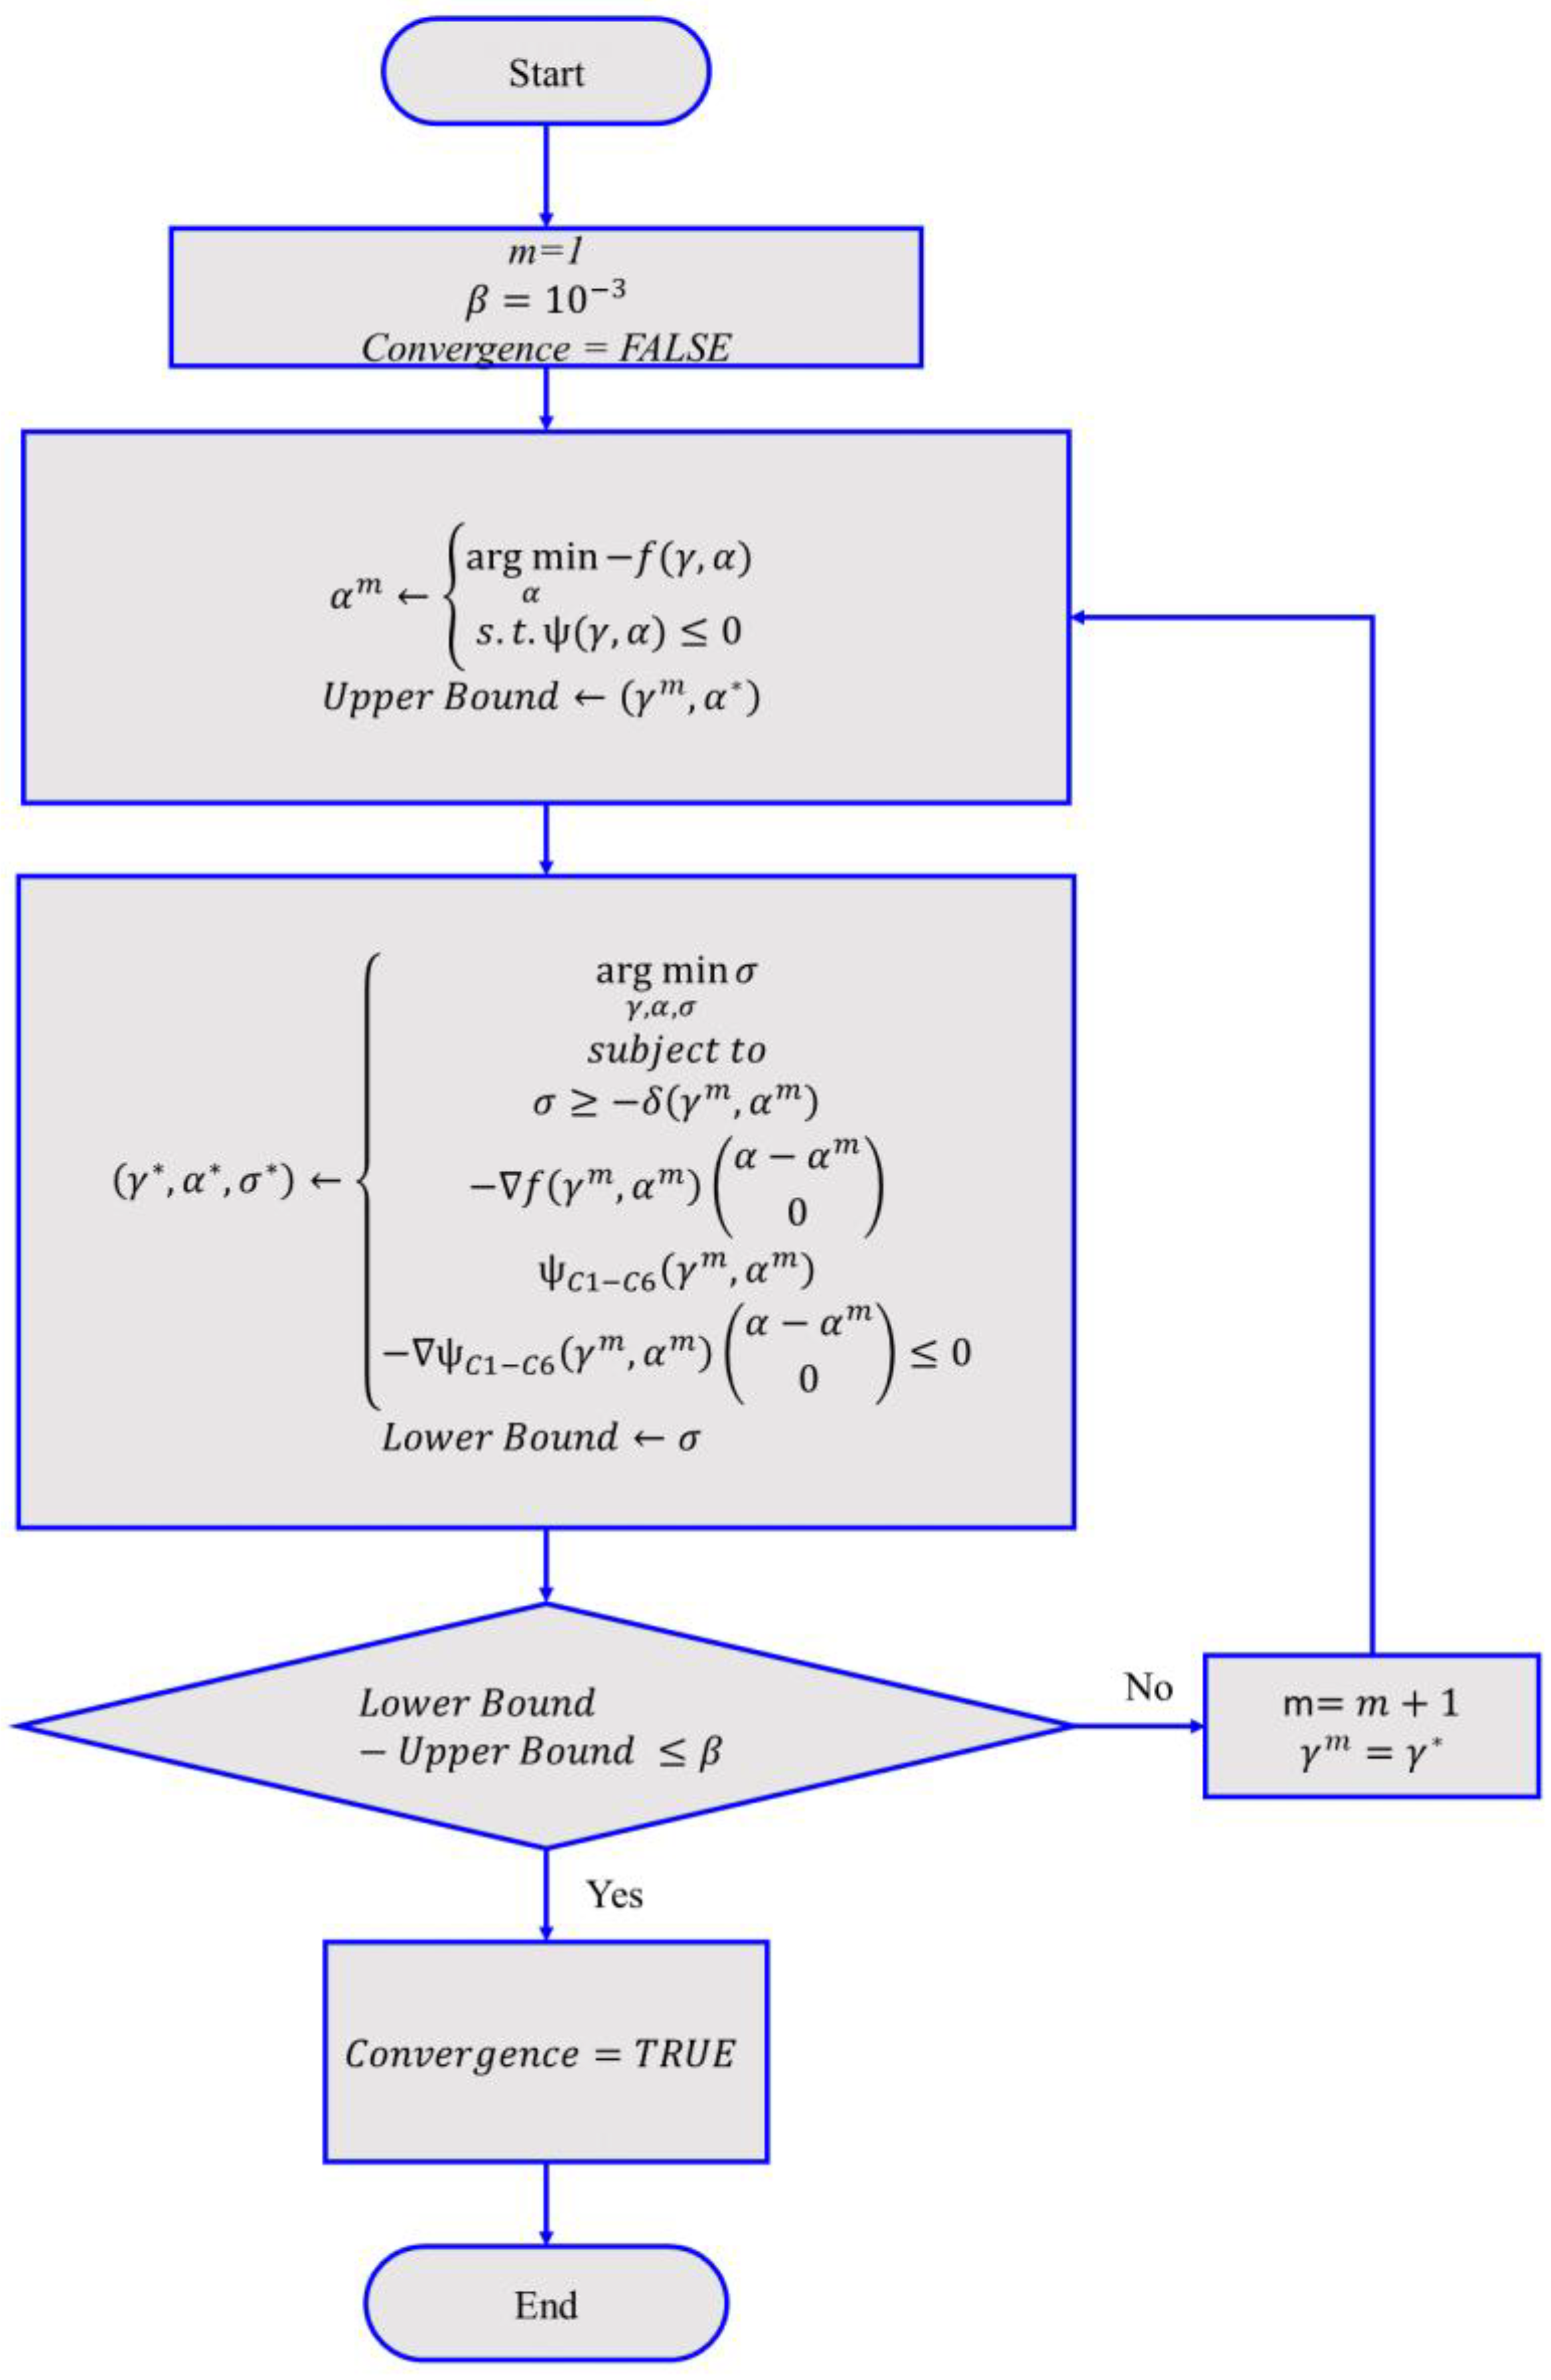
4.1. Outer Approximation Algorithm (OAA)
| Algorithm 1: Outer Approximation Algorithm |
End |
Explanation of the Algorithm
- The objective function f and are convex in α for a specified value of γ because α is nonempty, convex, and compact.
- Continuous differentiation of objective function f and must be possible.
- By fixing the value of γ, the solution of every non-linear continuous sub-problem qualifies the constraints.
- After solving γ, the appropriate solution NLP problem is obtained.
5. Results and Experiments
Simulation Parameters
6. Conclusions
Author Contributions
Funding
Conflicts of Interest
Appendix A

| Algorithm | Parameters | Values |
|---|---|---|
| NOMAD | DBMS power, p | 25 Watts |
| Minimum users | 2 | |
| Maximum users | 50 | |
| UE increment | 2 | |
| TP | 20 µ seconds | |
| T | 65,535 µ seconds | |
| FA | DBMS power | 25 Watts |
| Minimum rate | 1 kbps | |
| TP | 20 µ seconds | |
| T | 65,535 µ seconds | |
| CS | DBMS power | 25 Watts |
| Minimum rate | 1 kbps | |
| TP | 20 µ seconds | |
| T | 65,535 µ seconds | |
| Bandwidth | 180 kHz | |
| PSO | DBMS power | 25 Watts |
| Minimum rate | 1 kbps | |
| Maximum users | 50 | |
| Minimum users | 2 | |
| TP | 20 µ seconds | |
| T | 65,535 µ seconds | |
| Bandwidth | 180 kHz | |
| ABC | DBMS power | 25 Watts |
| Minimum rate | 1 kbps | |
| TP | 20 µ seconds | |
| T | 65,535 µ seconds | |
| TLBO | DBMS power | 25 Watts |
| Minimum rate | 1 kbps | |
| Pilot time | 30 µ seconds | |
| Bandwidth | 180 kHz | |
| SGO | DBMS power, p | 25 Watts |
| Minimum users | 2 | |
| Maximum users | 50 | |
| UE increment | 2 | |
| TP | 20 µ seconds | |
| T | 65,535 µ seconds | |
| BOMIN | DBMS power, p | 25 Watts |
| Minimum users | 2 | |
| Maximum users | 50 | |
| UE increment | 2 | |
| TP | 50 µ seconds | |
| T | 65,535 µ seconds | |
| GA | DBMS power | 25 Watts |
| Minimum rate | 1 kbps | |
| Pilot time | 40 µ seconds | |
| Bandwidth | 180 kHz |
References
- Rappaport, T.S.; Sun, S.; Mayzus, R.; Zhao, H.; Azar, Y.; Wang, K.; Wong, G.N.; Schulz, J.K.; Samimi, M.; Gutierrez, F. Millimeter Wave Mobile Communications for 5G Cellular: It will Work! IEEE Access 2013, 1, 335–349. [Google Scholar] [CrossRef]
- Haider, A.; Rahman, M.; Khan, T.; Niaz, M.T.; Kim, H.S. Multi-Gigabit Co-OFDM System over SMF and MMF Links for 5G URLLC Backhaul Network. Comput. Mater. Contin. 2021, 67, 1747–1758. [Google Scholar] [CrossRef]
- Fawad Khan, M.J.; Rahman, M.; Amin, Y.; Tenhunen, H. Low-Rank Multi-Channel Features for Robust Visual Object Tracking. Symmetry 2019, 11, 1155. [Google Scholar] [CrossRef] [Green Version]
- Perfecto, C.; Del Ser, J.; Bennis, M. Millimeter-Wave V2V Communications: Distributed Association and Beam Alignment. IEEE J. Sel. Areas Commun. 2017, 35, 2148–2162. [Google Scholar] [CrossRef] [Green Version]
- Jamil, S.; Fawad; Rahman, M.; Ullah, A.; Badnava, S.; Forsat, M.; Mirjavadi, S.S. Malicious UAV Detection Using Integrated Audio and Visual Features for Public Safety Applications. Sensors 2020, 20, 3923. [Google Scholar] [CrossRef]
- Agiwal, M.; Roy, A.; Saxena, N. Next Generation 5G Wireless Networks: A Comprehensive Survey. IEEE Commun. Surv. Tutor. 2016, 18, 1617–1655. [Google Scholar] [CrossRef]
- Ansari, R.I.; Pervaiz, H.; Chrysostomou, C.; Hassan, S.A.; Mahmood, A.; Gidlund, M. Control-Data Separation Architecture for Dual-Band mm wave Networks: A New Dimension to Spectrum Management. IEEE Access 2019, 7, 34925–34937. [Google Scholar] [CrossRef]
- Haider, A.; Khan, M.A.; Rehman, A.; Rahman, M.U.; Kim, H.S. A Real-Time Sequential Deep Extreme Learning Machine Cybersecurity Intrusion Detection System. Comput. Mater. Contin. 2021, 66, 1785–1798. [Google Scholar] [CrossRef]
- Kim, D.; Choi, M. Non-Orthogonal Multiple Access in Distributed Antenna Systems for Max-Min Fairness and Max-Sum-Rate. IEEE Access 2021, 9, 69467–69480. [Google Scholar] [CrossRef]
- Xu, L.; Zhou, X.; Tao, Y.; Liu, L.; Yu, X.; Kumar, N. Intelligent Security Performance Prediction for IoT-Enabled Healthcare Networks Using an Improved CNN. IEEE Trans. Ind. Inform. 2022, 18, 2063–2074. [Google Scholar] [CrossRef]
- Chergui, H.; Tourki, K.; Lguensat, R.; Benjillali, M.; Verikoukis, C.V.; Debbah, M. Classification Algorithms for Semi-Blind Uplink/Downlink Decoupling in Sub-6 GHz/mmWave 5G Networks. In Proceedings of the 2019 15th International Wireless Communications and Mobile Computing Conference (IWCMC), Tangier, Morocco, 24–28 June 2019; pp. 2031–2035. [Google Scholar]
- Semiari, O.; Saad, W.; Bennis, M. Joint Millimeter Wave and Microwave Resources Allocation in Cellular Networks with Dual Mode Base Stations. IEEE Trans. Wirel. Commun. 2017, 16, 4802–4816. [Google Scholar] [CrossRef]
- Semiari, O.; Saad, W.; Bennis, M.; Debbah, M. Integrated Millimeter Wave and Sub-6 GHz Wireless Networks: A Roadmap for Joint Mobile Broadband and Ultra-Reliable Low-Latency Communications. IEEE Wirel. Commun. 2019, 26, 109–115. [Google Scholar] [CrossRef] [Green Version]
- Shokri-Ghadikolaei, H.; Gkatzikis, L.; Fischione, C. Beamsearching and transmission scheduling in millimeter wave communications. In Proceedings of the 2015 IEEE International Conference on Communications (ICC), London, UK, 8–12 June 2015; pp. 1292–1297. [Google Scholar]
- Mismar, F.B.; Evans, B.L. Partially Blind Handovers for mm wave New Radio Aided by Sub-6 GHz LTE Signaling. In Proceedings of the 2018 IEEE International Conference on Communications Workshops, Kansas City, MO, USA, 20–24 May 2018; pp. 1–5. [Google Scholar]
- Okamoto, H.; Nishio, T.; Morikura, M.; Yamamoto, K.; Murayama, D.; Nakahira, K. Machine-Learning-Based Throughput Estimation Using Images for mmWave Communications. In Proceedings of the 2017 IEEE 85th Vehicular Technology Conference (VTC Spring), Sydney, NSW, Australia, 4–7 June 2017; pp. 1–6. [Google Scholar]
- Math, S.; Tam, P.; Kim, S. Reliable Federated Learning Systems Based on Intelligent Resource Sharing Scheme for Big Data Internet of Things. IEEE Access 2021, 9, 108091–108100. [Google Scholar] [CrossRef]
- Niknam, S.; Nasir, A.A.; Mehrpouyan, H.; Natarajan, B. A Multiband Ofdma Heterogeneous Network for Millimeter Wave 5G Wireless Applications. IEEE Access 2016, 4, 5640–5648. [Google Scholar] [CrossRef]
- Haider, A.; Rahman, M.; Ahmad, H.; NaghshvarianJahromi, M.; Niaz, M.T.; Kim, H.S. Frequency-Agile WLAN Notch UWB Antenna for URLLC Applications. Comput. Mater. Contin. 2021, 67, 2243–2254. [Google Scholar] [CrossRef]
- Fadel, A.; Cousin, B.; Khalil, A. User Selection in 5G Heterogeneous Networks Based on Millimeter-Wave and Beamforming. In Proceedings of the 2018 IEEE 20th International Conference on High Performance Computing and Communications; IEEE 16th International Conference on Smart City; IEEE 4th International Conference on Data Science and Systems (HPCC/SmartCity/DSS), Exeter, UK, 28–30 June 2018; pp. 503–509. [Google Scholar]
- Munir, H.; Pervaiz, H.; Hassan, S.A.; Musavian, L.; Ni, Q.; Imran, M.A.; Tafazolli, R. Computationally Intelligent Techniques for Resource Management in mm wave Small Cell Networks. IEEE Wirel. Commun. 2018, 25, 32–39. [Google Scholar] [CrossRef] [Green Version]
- Busari, S.A.; Huq, K.M.S.; Felfel, G.; Rodriguez, J. Adaptive resource allocation for energy-efficient millimeter-wave massive mimo networks. In Proceedings of the 2018 IEEE Global Communications Conference (GLOBECOM), Abu Dhabi, United Arab Emirates, 9–13 December 2018; pp. 1–6. [Google Scholar]
- Hao, W.; Zeng, M.; Chu, Z.; Yang, S.; Sun, G. Energy-Efficient Resource Allocation for mm wave Massive MIMO HetNets with Wireless Backhaul. IEEE Access 2018, 6, 2457–2471. [Google Scholar] [CrossRef]
- Zeng, M.; Hao, W.; Dobre, O.A.; Poor, H.V. Energy-Efficient Power Allocation in Uplink mm wave Massive MIMO with NOMA. IEEE Trans. Veh. Technol. 2019, 68, 3000–3004. [Google Scholar] [CrossRef] [Green Version]
- Pu, W.; Li, X.; Yuan, J.; Yang, X. Resource Allocation for Millimeter Wave Self-Backhaul Network using Markov Approximation. IEEE Access 2019, 7, 61283–61295. [Google Scholar] [CrossRef]
- Shi, J.; Xiao, P.; Kelly, J.; Si, J. Resource Allocation and Interference Management in Hybrid Millimeter Wave Networks. In Proceedings of the 2017 IEEE/CIC International Conference on Communications in China (ICCC), Qingdao, China, 22–24 October 2017; pp. 1–6. [Google Scholar]
- Chaieb, C.; Mlika, Z.; Abdelkefi, F.; Ajib, W. On The User Association and Resource Allocation in HetNets With mm wave Base Stations. In Proceedings of the 2017 IEEE 28th Annual International Symposium on Personal, Indoor, and Mobile Radio Communications (PIMRC), Montreal, QC, Canada, 8–13 October 2017; pp. 1–5. [Google Scholar]
- Jamil, S.; Rahman, M.; Haider, A. Bag of Features (BoF) Based Deep Learning Framework for Bleached Corals Detection. Big Data Cogn. Comput. 2021, 5, 53. [Google Scholar] [CrossRef]
- Mesodiakaki, A.; Adelantado, F.; Alonso, L.; Di Renzo, M.; Verikoukis, C. Energy- and Spectrum-Efficient User Association in Millimeter-Wave Backhaul Small-Cell Networks. IEEE Trans. Veh. Technol. 2017, 66, 1810–1821. [Google Scholar] [CrossRef] [Green Version]
- Mesodiakaki, A.; Zola, E.; Kassler, A. User association in 5G heterogeneous networks with mesh millimeter wave backhaul links. In Proceedings of the 2017 IEEE 18th International Symposium on a World of Wireless, Mobile and Multimedia Networks (WoWMoM), Macau, China, 12–15 June 2017; pp. 1–6. [Google Scholar]
- Selvakumar, B.; Muneeswaran, K. Firefly Algorithm-Based Feature Selection for Network Intrusion Detection. Comput. Secur. 2019, 81, 148–155. [Google Scholar]
- Mareli, M.; Twala, B. An Adaptive Cuckoo Search Algorithm for Optimization. Appl. Comput. Inform. 2018, 14, 107–115. [Google Scholar] [CrossRef]
- Sengupta, S.; Basak, S.; Peters, R.A., II. Particle swarm optimization: A survey of historical and recent developments with hybridization perspectives. Mach. Learn. Knowl. Extr. 2019, 1, 157–191. [Google Scholar] [CrossRef] [Green Version]
- Xu, X.; Hao, J.; Zheng, Y. Multi-Objective Artificial Bee Colony Algorithm for Multi-Stage Resource Leveling Problem in Sharing Logistics Network. Comput. Ind. Eng. 2020, 142, 106338. [Google Scholar] [CrossRef]
- Zou, F.; Chen, D.; Xu, Q. A Survey of Teaching Learning-Based Optimization. Neurocomputing 2019, 335, 366–383. [Google Scholar] [CrossRef]
- Praveen, S.P.; Rao, K.T.; Janakiramaiah, B. Effective Allocation of Resources and Task Scheduling in Cloud Environment using Social Group Optimization. Arab. J. Sci. Eng. 2018, 43, 4265–4272. [Google Scholar] [CrossRef]
- Cimorelli, L.; Fecarotta, O. Optimal Regulation of Variable Speed Pumps in Sewer Systems. Environ. Sci. Proc. 2020, 2, 2058. [Google Scholar] [CrossRef]
- Guerrero, C.; Lera, I.; Juiz, C. Genetic Algorithm for Multi-Objective Optimization of Container Allocation in Cloud Architecture. J. Grid Comput. 2018, 16, 113–135. [Google Scholar] [CrossRef]
- Ayesha, A.; Rahman, M.; Haider, A.; Majeed Chaudhry, S. On Self-Interference Cancellation and Non-Idealities Suppression in Full-Duplex Radio Transceivers. Mathematics 2021, 9, 1434. [Google Scholar] [CrossRef]
- Ahmed, N.M.; Rikli, N.E. QoS-based Data Aggregation and Resource Allocation Algorithm for Machine Type Communication Devices in Next-Generation Networks. IEEE Access 2021, 9, 119735–119754. [Google Scholar] [CrossRef]
- Ali, S.; Haider, A.; Rahman, M.; Sohail, M.; Zikria, Y.B. Deep Learning (DL) based Joint Resource Allocation and RRH Association in 5G-multi-tier Networks. IEEE Access 2021, 9, 118357–118366. [Google Scholar] [CrossRef]


| Ref. No. | Het Nets | mm- Waves | InF | Objective | Constraints | Sample Approach | Limitations |
|---|---|---|---|---|---|---|---|
| [11] | 🗷 | 🗹 | 🗷 | Maximum reliability and low latency | LOS, path loss | Semi blind decoupling approach | Low accuracy with NLOS |
| [12] | 🗹 | 🗷 | 🗷 | Resource allocation | QoS, CSI, QoE, LOS | Q-learning | Increased probability of outage due to beam overhead training |
| [13] | 🗹 | 🗷 | 🗷 | Ultra-Reliable Low latency | Radio interference | Reinforcement learning- Q-learning | Applicable in C-plane and U-plane |
| [14] | 🗷 | 🗹 | 🗷 | Throughput maximization | Beamwidth of transmitter and receiver, power | Scheduling algorithm | Network throughput decreased with increase in transmission beamwidth |
| [15] | 🗷 | 🗹 | 🗷 | Throughput maximization | Beamwidth, power | Matching theory | Short range mm-wave scenarios |
| [16] | 🗹 | 🗷 | 🗷 | Throughput estimation | Online learning | AROW algorithm | Applicable for throughput less than 1Gbps |
| [17] | 🗹 | 🗷 | 🗷 | Data rate and energy utilization | Power, interference | Game theory | Worked within specified radius |
| [18] | 🗹 | 🗷 | 🗷 | Data-rate maximization | Power exclusive pairing, minimum rate | Joint resource allocation algorithm and greedy algorithm | Used E-band, V-band, and LTE band for resource allocation |
| [20] | 🗹 | 🗷 | 🗷 | Throughput maximization | Power, resource selection | Exhaustive search and greedy zero forcing dirty paper | Multiuser selection in MIMO-OFDMA |
| [21] | 🗹 | 🗷 | 🗷 | EE maximization | Power, interference, network rate | Matching theory and matching game theory | Applicable to small cells only |
| [22] | 🗹 | 🗷 | 🗷 | EE maximization | Power, interference, QoS | ARA algorithm | Based on massive MIMO |
| [23] | 🗹 | 🗷 | 🗷 | EE maximization | Interference, power, LOS | DBMBOLA algorithm | Two tier massive MIMO HetNet with wireless backhaul |
| [24] | 🗷 | 🗹 | 🗷 | EE maximization | Power, interference, QoS | EEPA algorithm | Based on E-NOMA |
| [25] | 🗷 | 🗹 | 🗷 | Throughput maximization | LOS, interference, path loss | RAMA algorithm | Based on dense deployment of mm-wave-SBH |
| [26] | 🗹 | 🗷 | 🗷 | Throughput maximization | LOS, interference, path loss, power | HIM algorithm | Based on SIR |
| [27] | 🗹 | 🗷 | 🗷 | Coverage and capacity maximization | Interference, QoS | HUA algorithm | Lack of mm-wave propagation probabilities |
| [29] | 🗷 | 🗹 | 🗷 | EE and SE maximization | Power, SINR, traffic | Heuristic algorithm | Only focused on small cell network |
| [30] | 🗹 | 🗷 | 🗷 | User association | Power, LOS | Backhaul routing algorithm | Computationally complex approach |
| This paper | 🗹 | 🗹 | 🗹 | EE and throughput maximization | Power, rate, LOS | OAA | Applicable to InF having dual mode base stations |
| Abbreviation | Description |
|---|---|
| InF | Indoor factory |
| InF-SL | Indoor factory with sparse clutter and low base station height |
| InF-SH | Indoor factory with sparse clutter and high base station height |
| InF-DL | Indoor factory with dense clutter and low base station height |
| InF-DH | Indoor factory with dense clutter and high base station height |
| DMBS | Dual mode base station |
| UE | User |
| Symbol | Description | Symbol | Description |
|---|---|---|---|
| Beam level beamwidth of a transmitter | Beam level beamwidth of the receiver | ||
| Sector beamwidth of a transmitter | Sector level beamwidth of the receiver | ||
| Pilot transmission time | Total transmission time | ||
| Alignment time | Gain of transmitter | ||
| Gain of receiver | Channel gain | ||
| Power of the ith base station | Error frame | ||
| Data rate of the ith link | Noise | ||
| Transmission angle | Reception angle | ||
| Energy | Network rate | ||
| Maximum number of links | - | - |
| Parameter | Value |
|---|---|
| DBMS power, p | 25 Watts |
| Minimum users | 2 |
| Maximum users | 50 |
| UE increment | 2 |
| TP | 20 µ seconds |
| T | 65,535 µ seconds |
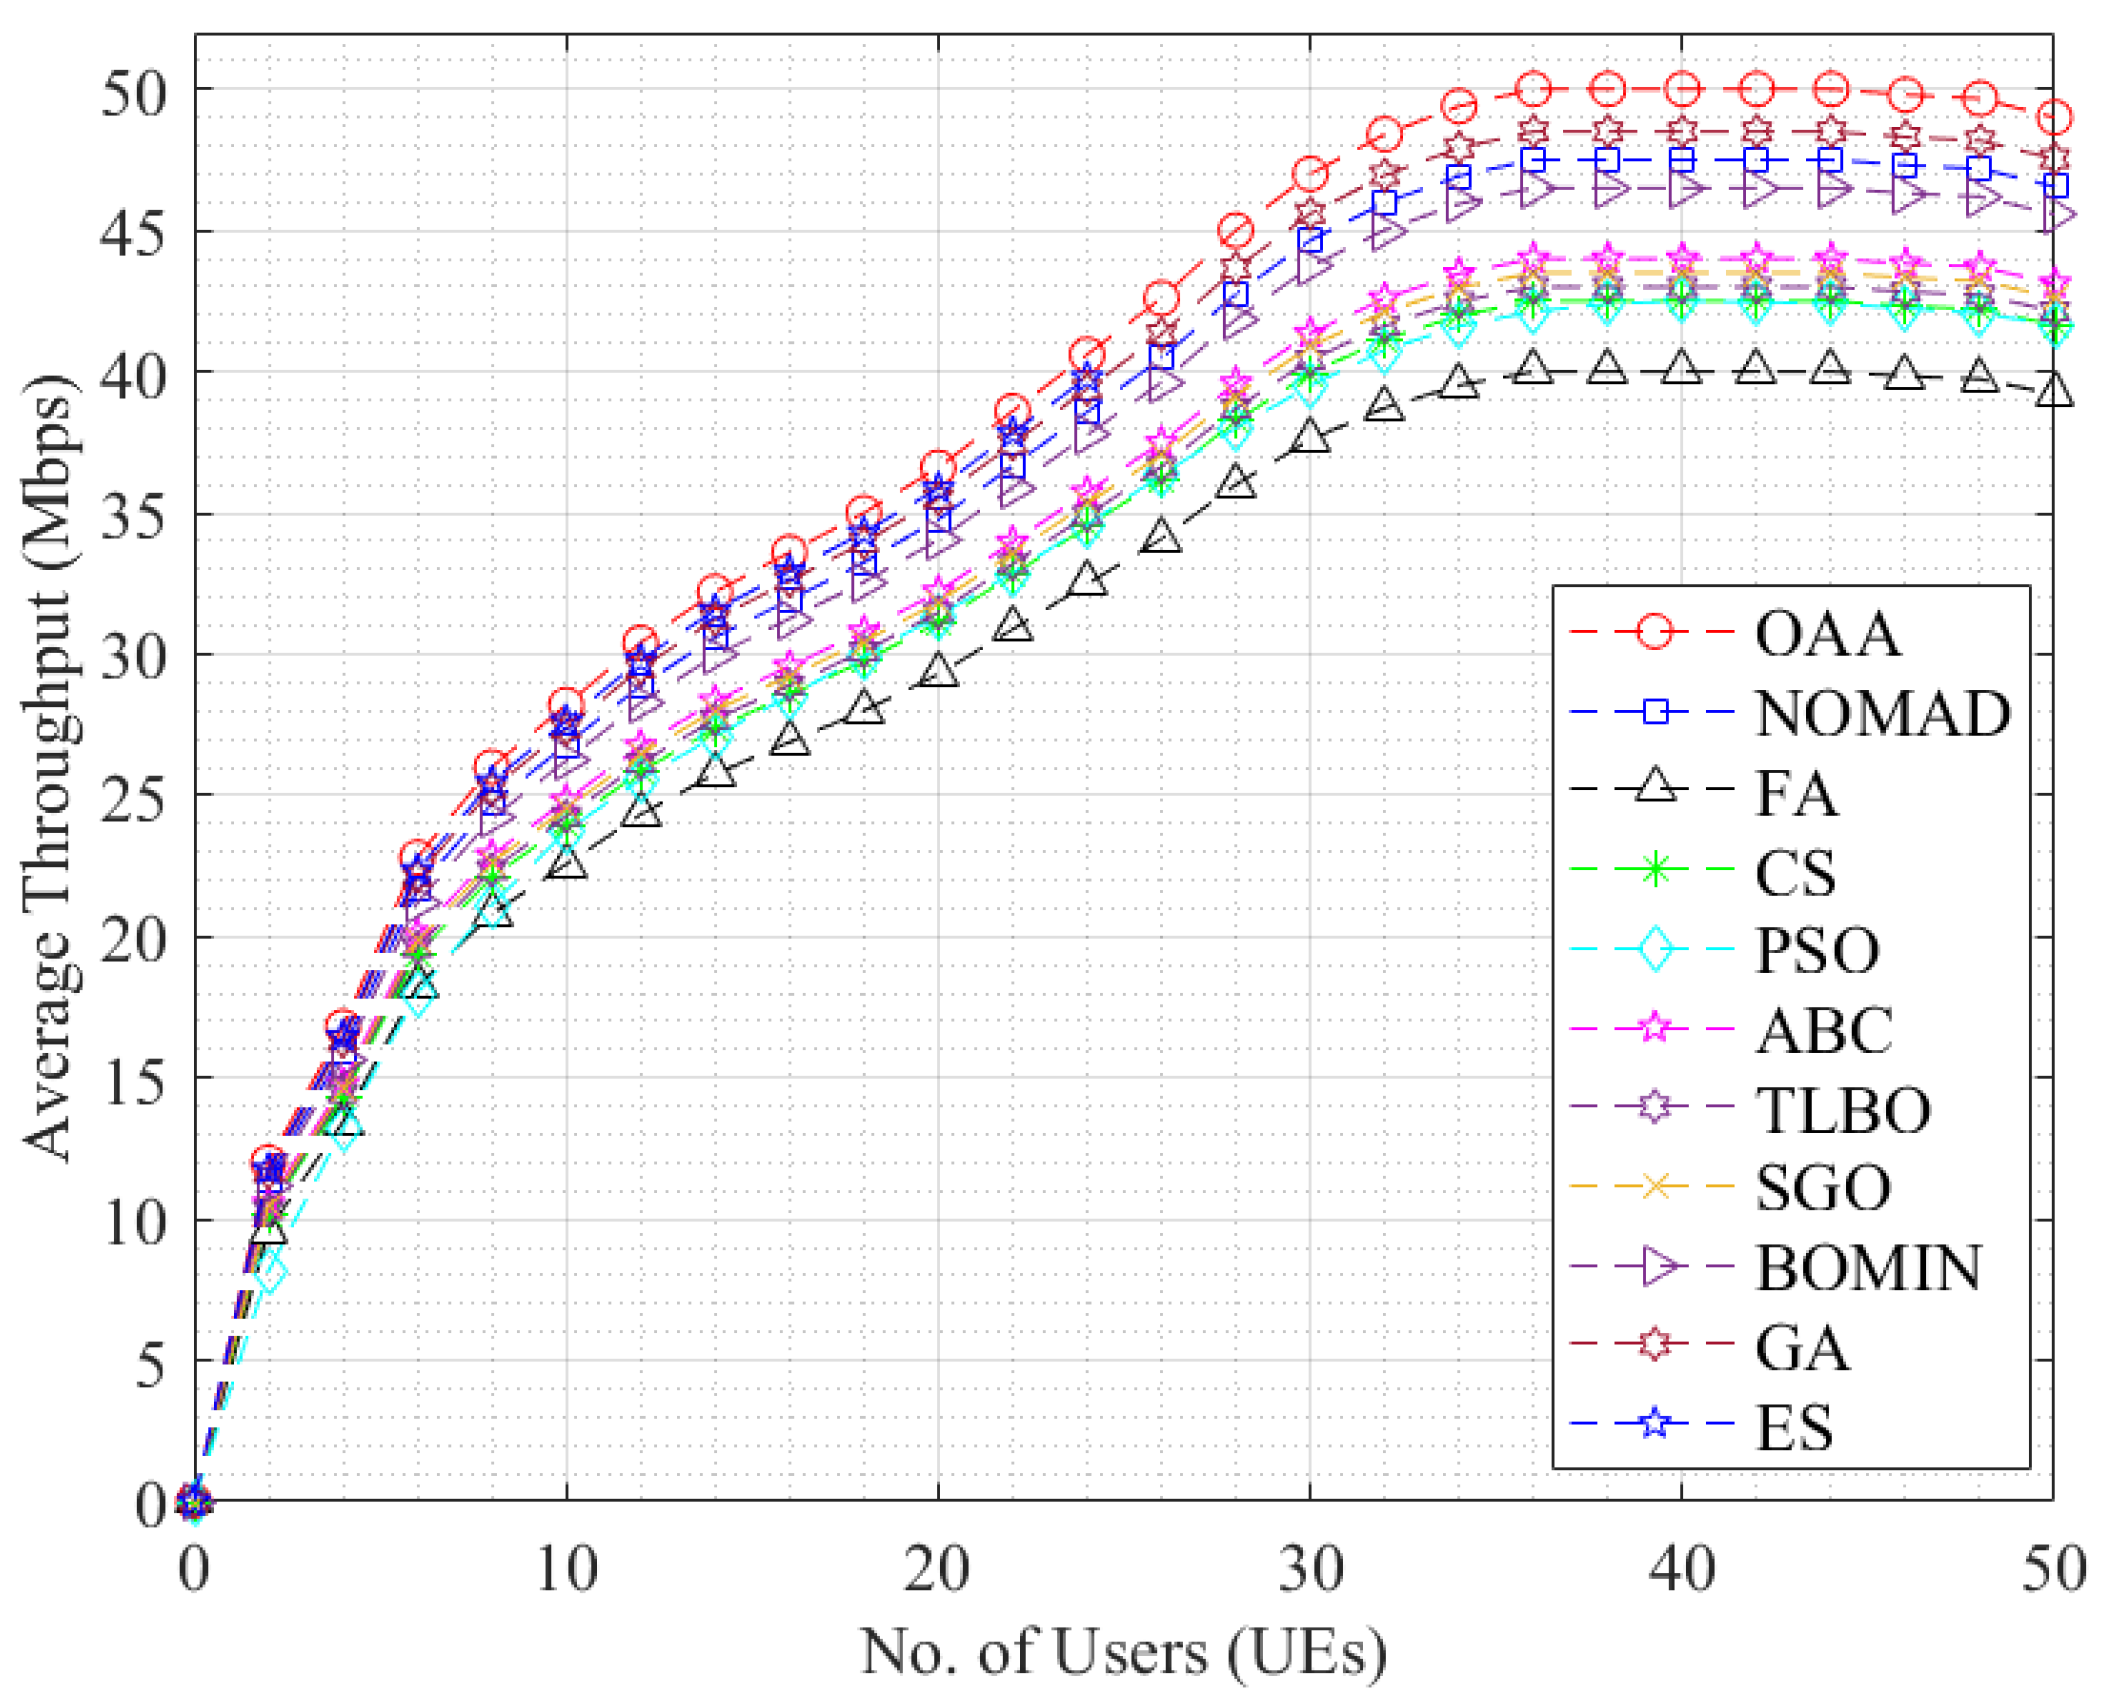
| Algorithm | Optimal EE (MbJ−1) | Gain in the EE | Optimal Throughput (Mbps) | Gain in the Throughput |
|---|---|---|---|---|
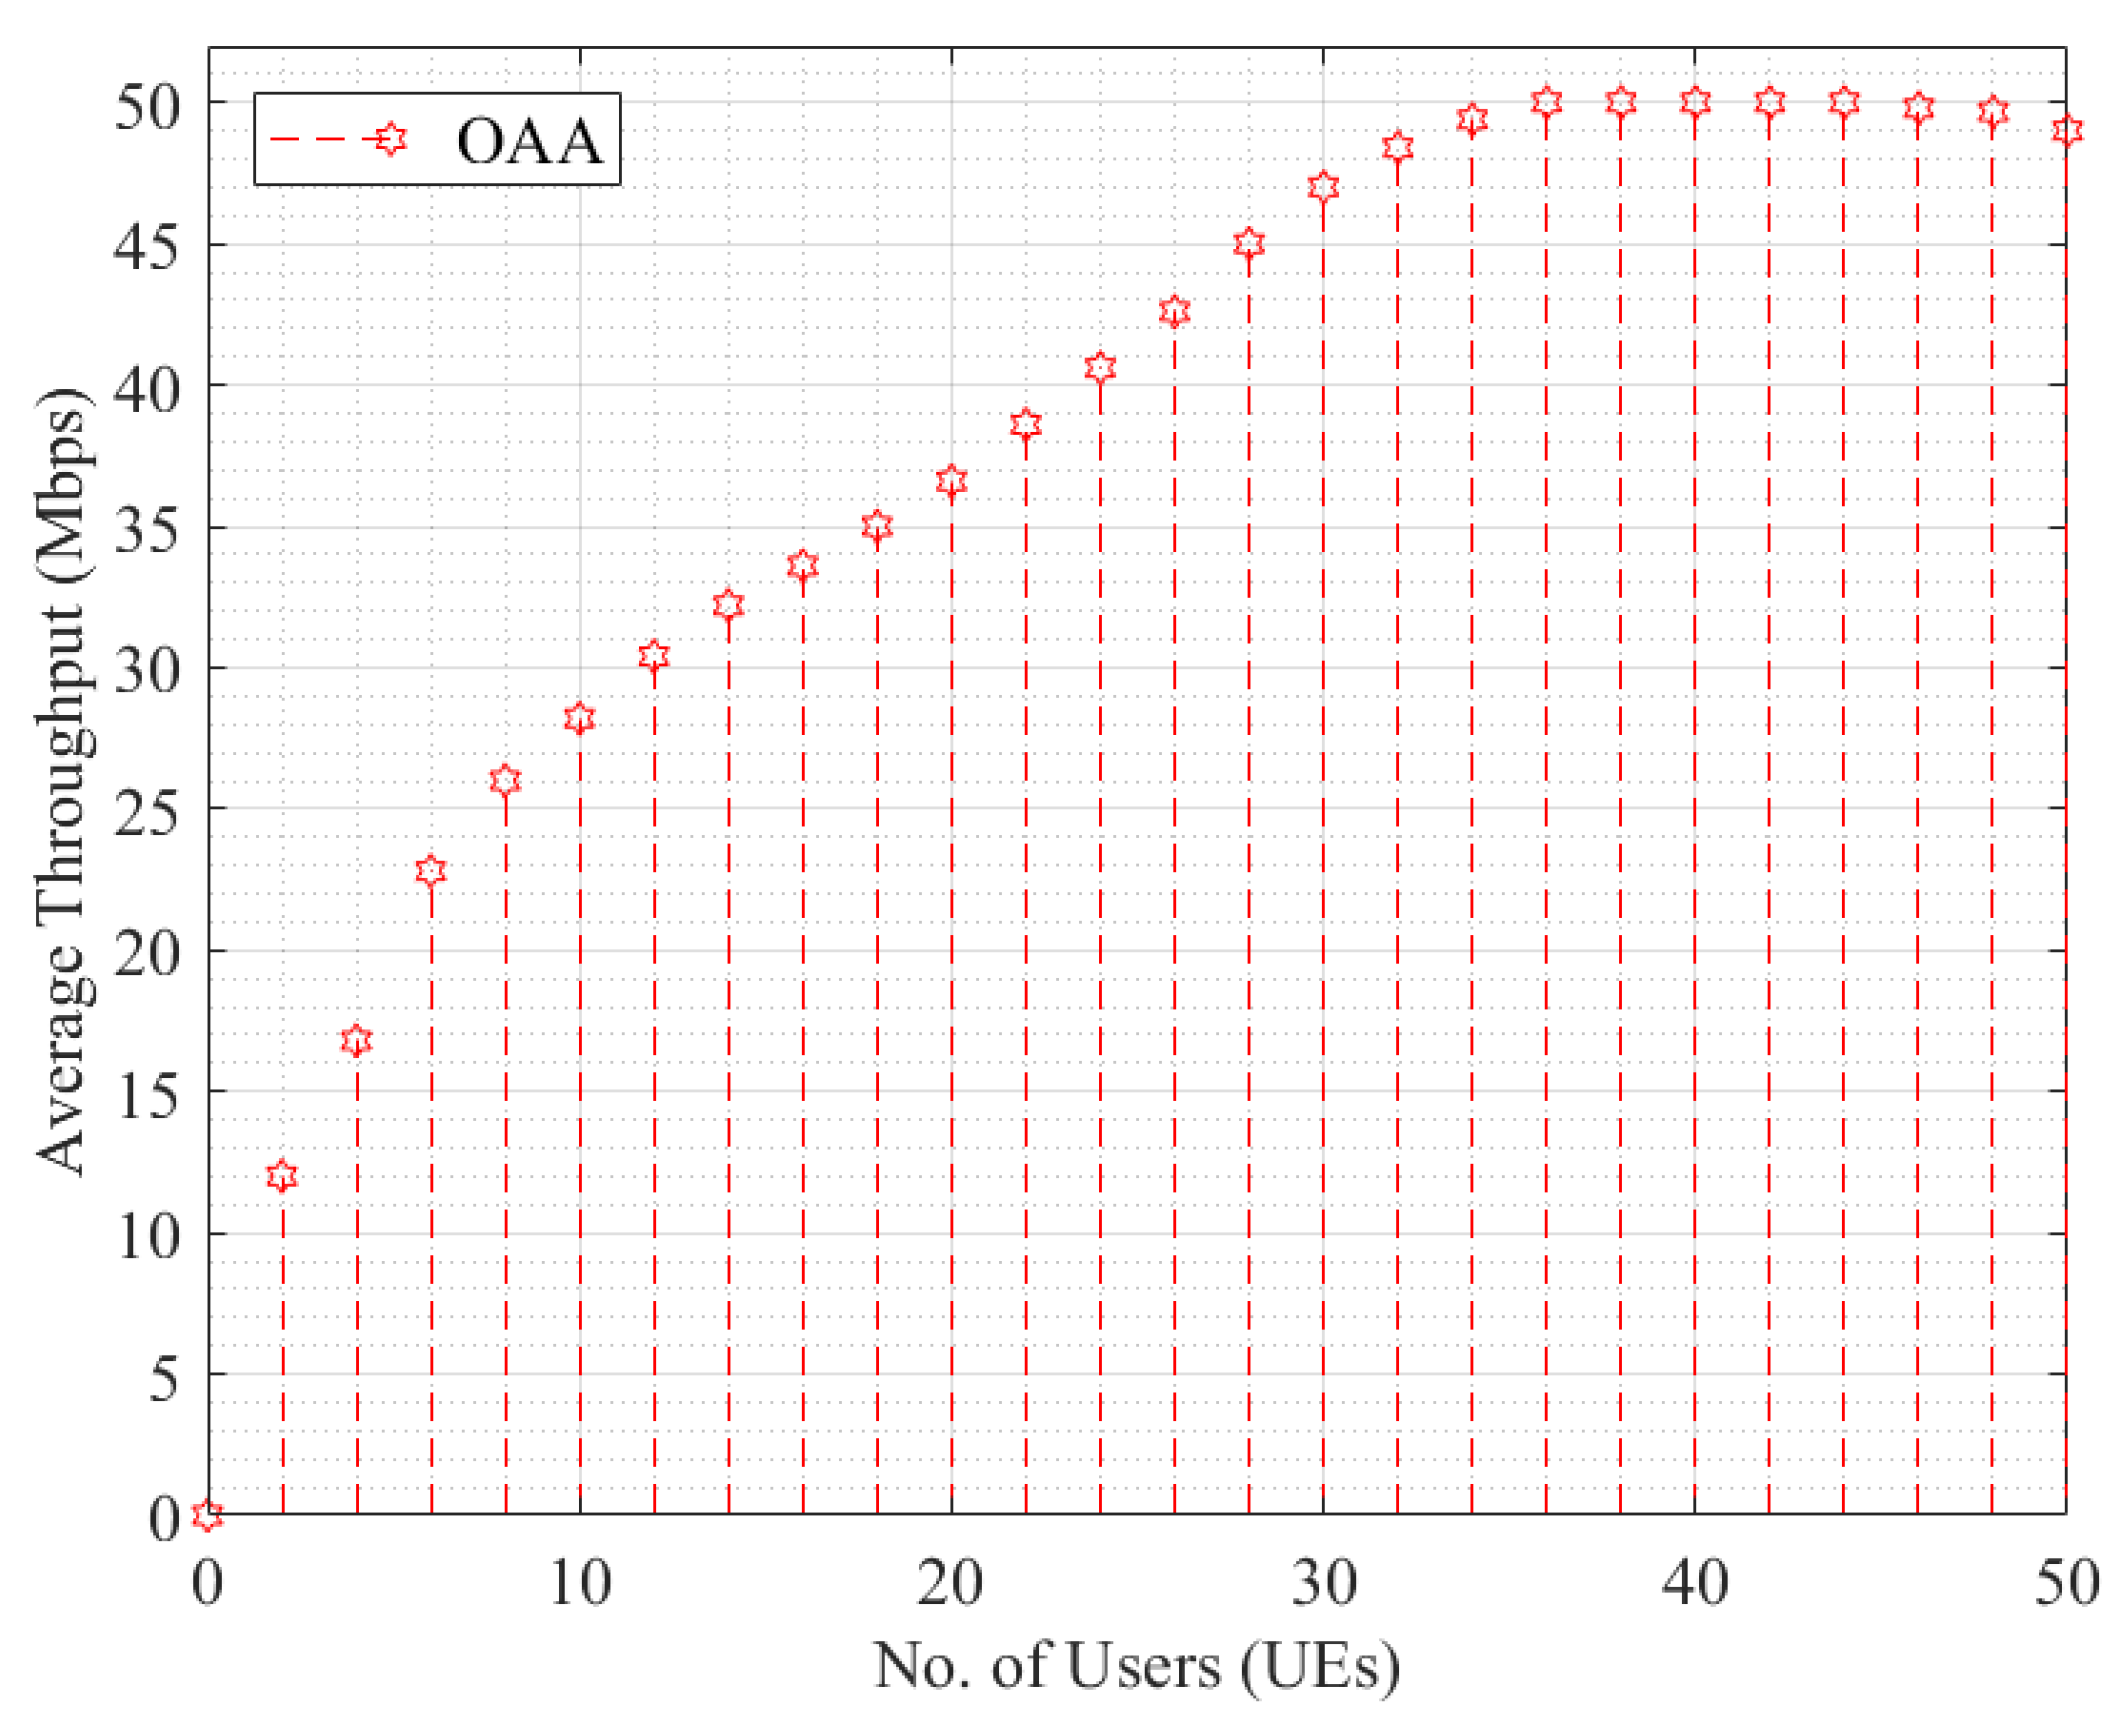
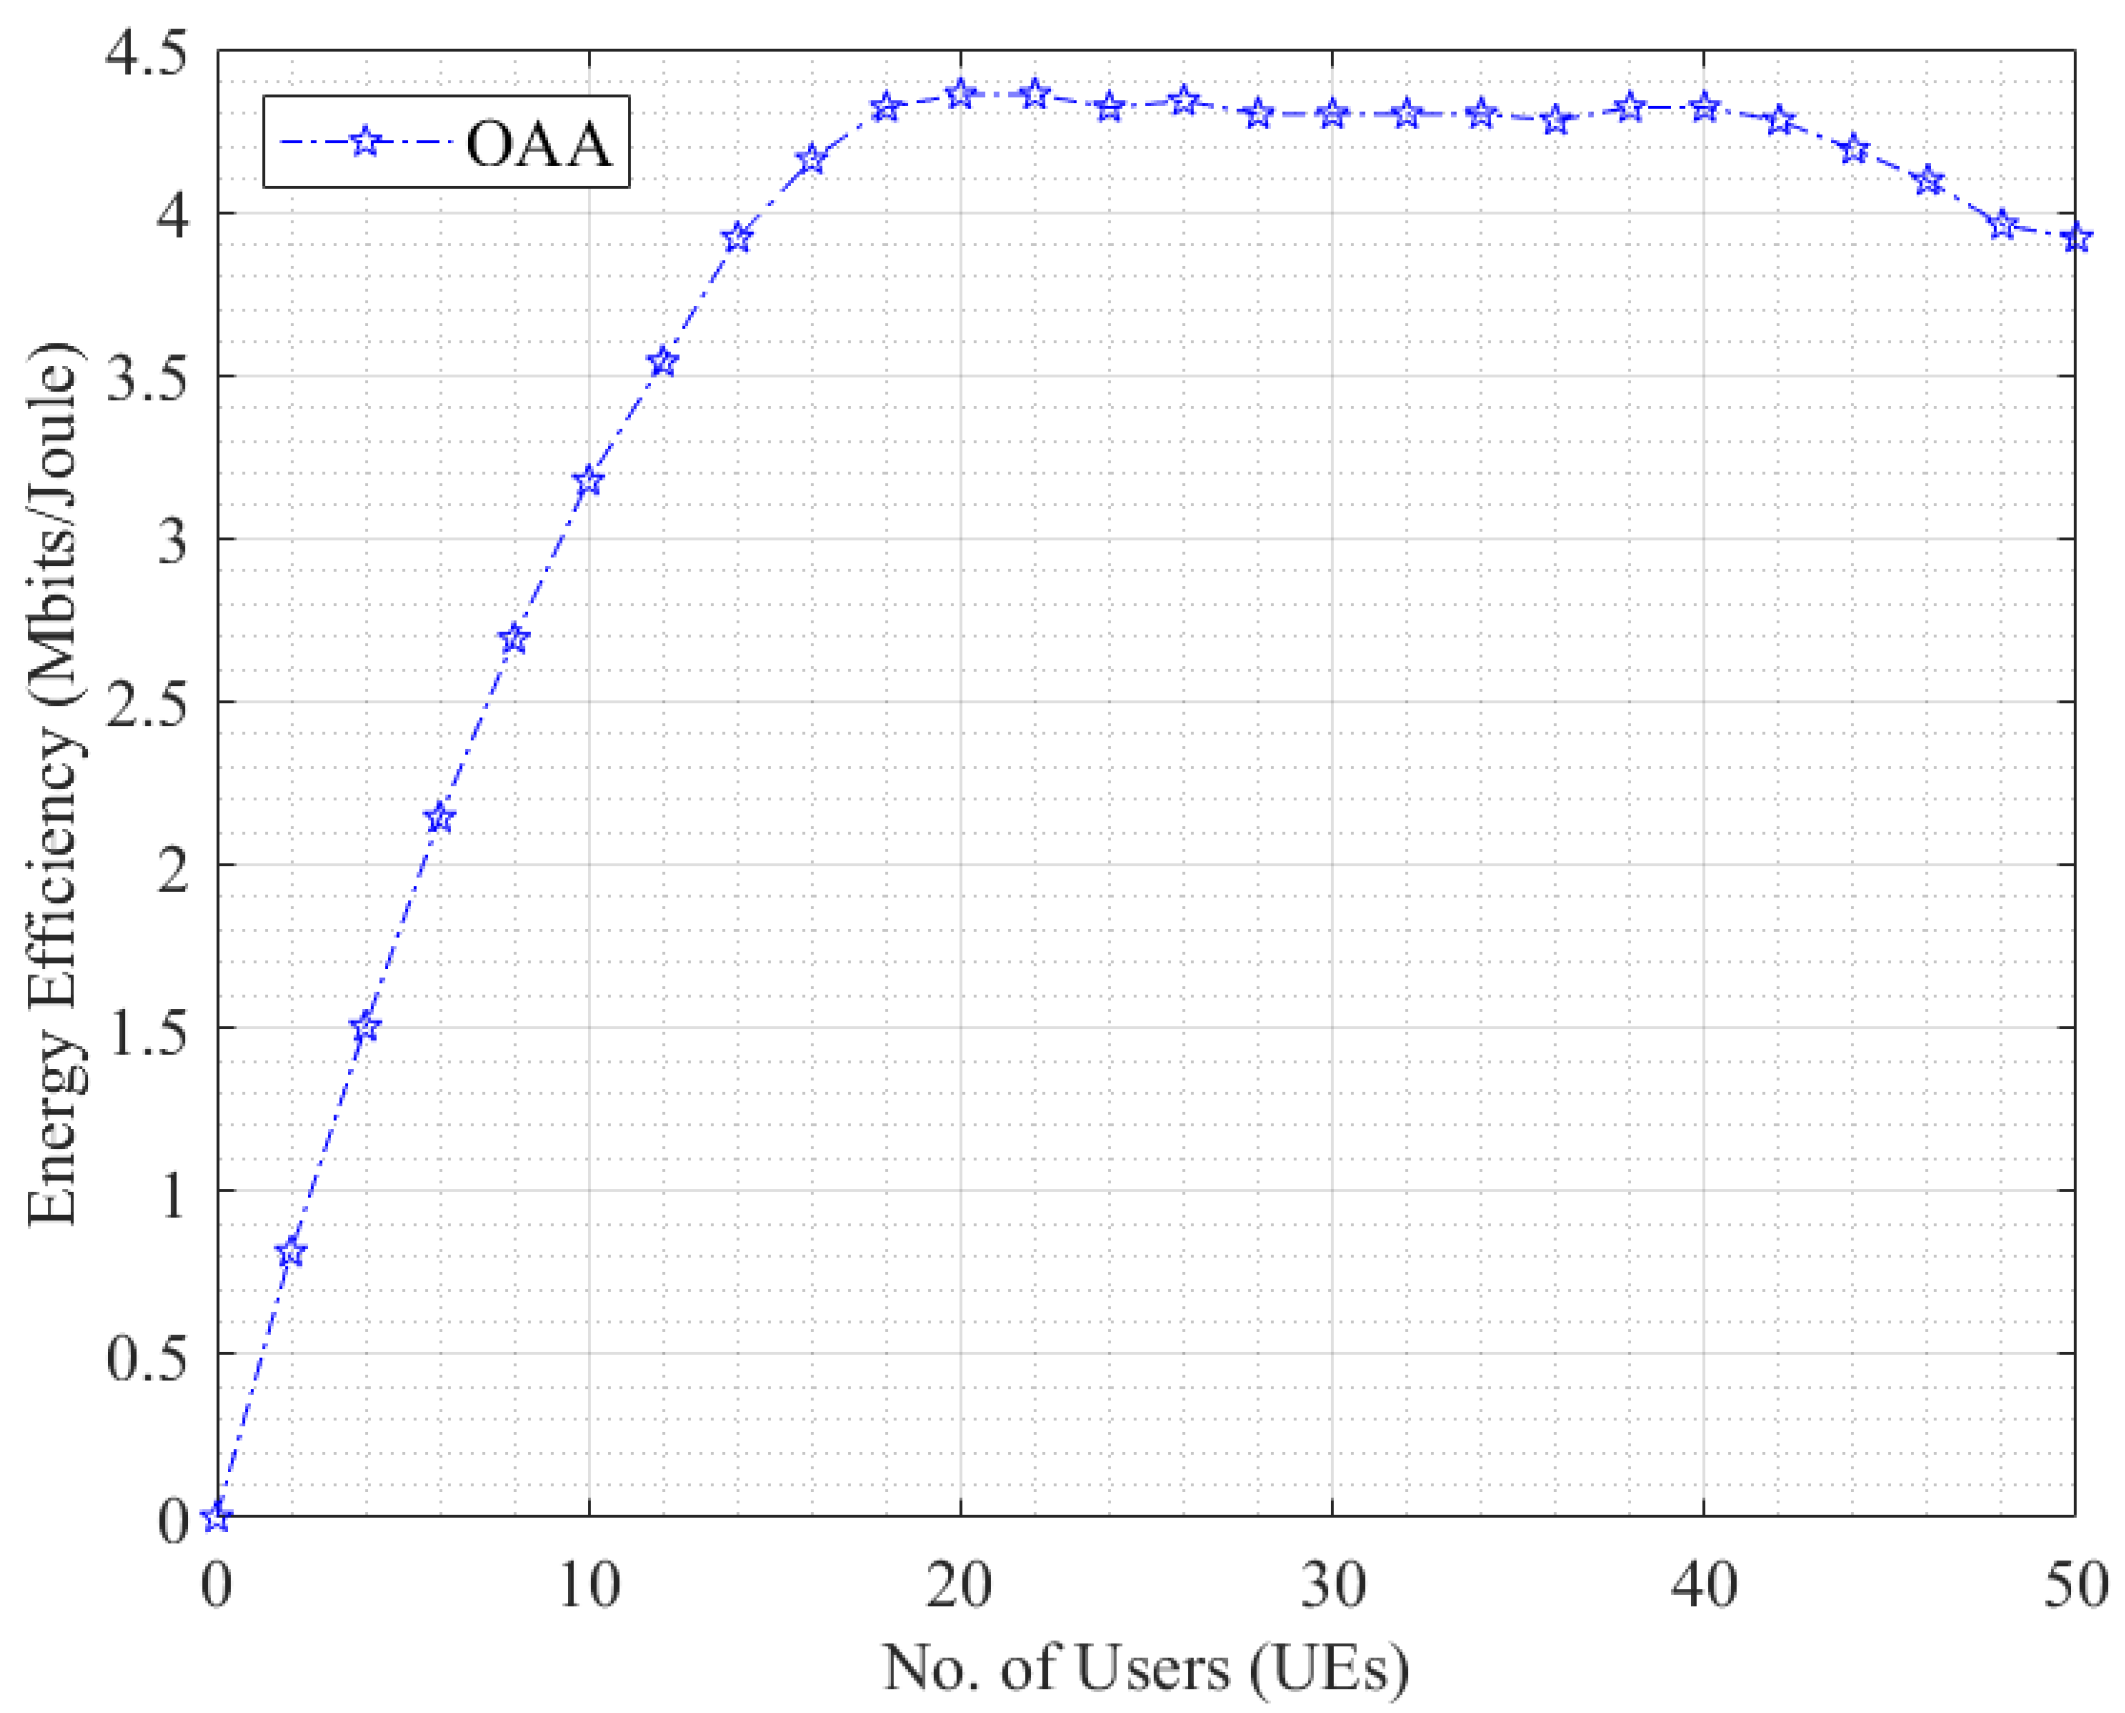
| OAA | 4.50 | 7.4% | 50.00 | 4.34% |
| NOMAD | 4.10 | 46.93 | ||
| FA | 3.46 | 39.52 | ||
| CS | 3.67 | 41.99 | ||
| PSO | 3.59 | 41.61 | ||
| ABC | 3.80 | 43.47 | ||
| TLBO | 3.71 | 42.48 | ||
| SGO | 3.75 | 42.98 | ||
| BOMIN | 4.01 | 45.94 | ||
| GA | 4.19 | 47.92 |
| Algorithm | Runtime Complexity (GPU) | Difference | Overall Gain | Runtime Complexity (CPU) | Difference | Overall Gain |
|---|---|---|---|---|---|---|
| OAA | 0.8 s | 0s | 47.06% | 46 s | 0 s | 45.10% |
| NOMAD | 4 s | 3.2 s | 224 s | 178 s | ||
| FA | 3 s | 2.2 s | 168 s | 122 s | ||
| CS | 6 s | 5.2 s | 336 s | 290 s | ||
| PSO | 2.5 s | 1.7 s | 90 s | 44 s | ||
| ABC | 1.7 s | 0.9 s | 102 s | 56 s | ||
| TLBO | 5 s | 4.2 s | 280 s | 234 s | ||
| SGO | 9 s | 8.2 s | 504 s | 458 s | ||
| BOMIN | 11 s | 10.2 s | 616 s | 570 s | ||
| GA | 4 s | 3.2 s | 224 s | 178 s | ||
| ES | 30 s | 29.2 s | 1680 s | 1634 s |
Publisher’s Note: MDPI stays neutral with regard to jurisdictional claims in published maps and institutional affiliations. |
© 2022 by the authors. Licensee MDPI, Basel, Switzerland. This article is an open access article distributed under the terms and conditions of the Creative Commons Attribution (CC BY) license (https://creativecommons.org/licenses/by/4.0/).
Share and Cite
Jamil, S.; Rahman, M.; Tanveer, J.; Haider, A. Energy Efficiency and Throughput Maximization Using Millimeter Waves–Microwaves HetNets. Electronics 2022, 11, 474. https://doi.org/10.3390/electronics11030474
Jamil S, Rahman M, Tanveer J, Haider A. Energy Efficiency and Throughput Maximization Using Millimeter Waves–Microwaves HetNets. Electronics. 2022; 11(3):474. https://doi.org/10.3390/electronics11030474
Chicago/Turabian StyleJamil, Sonain, MuhibUr Rahman, Jawad Tanveer, and Amir Haider. 2022. "Energy Efficiency and Throughput Maximization Using Millimeter Waves–Microwaves HetNets" Electronics 11, no. 3: 474. https://doi.org/10.3390/electronics11030474