1. Introduction
Rapid increase in the demand for electric energy in the residential sector, which is more than 30% of total consumed energy in the USA [
1], along with growing concern about the environmental effect, makes renewable energy and clean power technologies an essential component of future sustainable energy systems. Hybrid Renewable Energy Systems (HRES), which consist of multiple renewable sources or renewable sources with Energy Storage Systems (ESS) and Three-Port Converters (TPC), are essential to overcome the intermittent nature of renewable energy sources. HRES is becoming increasingly popular as part of the microgrid distributed generation concept, in which many HRESs operate on the same microgrid [
2]. Using energy storage systems at HERS, such as batteries, the generated power by the renewable sources can be stored to use when renewable energy sources are not available. Consequently, HRES outperforms a single renewable technology in all operational situations [
3].
Many TPC configurations have recently been reported and classified depending on several criteria, including the type of renewable sources (e.g., PV, wind turbines, etc.), the number of DC ports, and the application for which TPCs are being used [
4,
5,
6].
TPCs can be divided into a single-stage connection that is directly inverted from a RES to the AC bus, and multi-stage connectivity where a DC power passes via the DC bus before being inverted into the AC bus. Additionally, TPCs can be divided into non-insulated TPCs and isolated TPCs, in which the RESs are connected to the output terminals via an isolation transformer to interface with the utility grid.
The conventional three-port non-isolated multi-stage DC-DC converter, in which each renewable energy source is connected to the DC bus through a unidirectional converter while the ESS is connected to the DC bus through a bidirectional converter, is shown in
Figure 1a. [
7,
8,
9,
10,
11,
12,
13,
14]. The drawbacks of this configuration are the use of a high number of components, which reduces efficiency and reliability and increases the size and cost.
To overcome the drawbacks of conventional non-isolated multi-stage DC-DC converters, the integrated three-port non-isolated multi-stage DC-DC converters are presented as shown in
Figure 1b.
Different TPCs have been reported in the literature for building-integrated PV Systems [
15,
16,
17,
18,
19] and are formed based on the classical boost, buck-boost converters. Therefore, they have a low voltage gain, and the battery charging voltage and current restricts the system design. Two boost converters with an active clamp auxiliary circuit for zero-voltage switching are used in [
20,
21]. However, the voltage gain is limited. Although the proposed TPC in [
22], where a coupled inductor technique is used, has a high voltage gain, it needs an additional DC source to increase the reliability of the PV systems.
The suggested converters in [
23] provide an additional power flow path to the input side by incorporating a battery, switch, and diode cell into the conventional boost and buck-boost converters. The proposed TPC has a limited voltage gain and the voltage and current stresses over the main switch are high, which reduces the efficiency.
Based on an interleaved converter with switched capacitors, refs. [
24,
25,
26] presents a unidirectional TPC. The proposed TPC using cascaded switched capacitors to boost the voltage, which decreases the voltage stresses over the converter components. On the other hand, reliability and efficiency are decreased. Furthermore, the input sources must operate together to transfer the power to the load.
High efficiency with continuous input current is fulfilled in the TPC proposed in [
27]. However, the converter consists of a coupled inductor and a single inductor, which increases the size. The same problem occurs in the TPC proposed in [
28], in which four coupled inductors and a single inductor are used.
A bidirectional DC-DC converter with high step-up/down voltage gain is presented in [
29]. It has a high input current ripple and a low efficiency in battery charging mode. An extendable TPC is proposed in [
30]; the voltage stresses of the output diode and switch are higher than the output voltage.
This paper develops a low-cost highly efficient high-gain non-isolated TPC for Building-Integrated PV Systems (BIPVS). The DC sources of the proposed TPC have a low current ripple, and the main switch has a low voltage stress. Additionally, it has a high degree of flexibility in that more than three ports can be used, and the RES can have different characteristics and different operating voltages at the maximum power point.
Furthermore, eight operation modes are suggested based on a novel simple demand-side management (DSM) algorithm. The new DSM considers the time of high-rate electricity tariff and the maximum battery charging current beside the available DC power and the load demand. The used control scheme has six tasks, Maximum Power Point Tracker (MPPT) for the photovoltaic arrays, control of charging and discharging of the battery without any additional circuits, regulation of the DC bus voltage to the designed value, and control of the inverter output voltage, current, and frequency to meet the AC load requirements. The proposed system is simulated using PSIM to verify all possible operation modes.
The proposed converter is designed to deliver up to 3500 Watts with high-quality outputs, where the Total Harmonic Distortion (THD) is below 2% at a standalone power mode and less than 5.5% at grid-tied power mode, and with low input current ripple. The proposed HRES system consists of 2500 Watt PV arrays, a battery storage system, and a TPC with an inverter.
This paper is organized into six sections:
Section 1 provides an introduction.
Section 2 illustrates the proposed TPC.
Section 3 shows the power flow for different operational modes.
Section 4 discusses the control systems of the proposed TPC.
Section 5 shows the simulation results and decision. Finally,
Section 6 concludes the article.
2. The Proposed Three-Port Converter
The proposed Non-Isolated High-Gain Three-Port Converter (NHGTPC) is a multi-stage TPC as shown in
Figure 2. It uses a photovoltaic panel port, an ESS port, a high-gain three-port DC-DC converter, and a 5H inverter.
The ESS acts as an energy buffer, meaning it can be discharged and charged to balance the power flow in the PV/battery hybrid power system.
The novel NHGTPC is designed based on the Single-Switch High-Gain Converter (SSHGC) presented in [
31], which is a combination of the modified classical boost converter and one modified voltage multiplier cell All formulas, analysis, and simulation results of used SSHGC are discussed in detail in [
31].
The purpose of SSHGC is to increase the input voltage from around 36 V to 400 V, which is the DC bus voltage, and to handle home variable loads ranging from 50 Watts to 3500 Watts. A 5H single-phase voltage source inverter is used to connect the DC bus (C3) to the AC port (load and grid).
The NHGTPC has two DC input ports that provide the required energy for the residential load during the day. The batteries are connected to the input bus () via inductor (L1), and the photovoltaic panels are connected to the input bus through a classical boost converter, which tracks the maximum power point and controls battery charge and discharge.
The proposed NHGTPC could operate as a standalone or a grid-tied system. The residential load could be fed from the photovoltaic or the battery or both. The photovoltaic panels could charge the battery separately or while feeding the load. Additionally, the generated power from the DC sources could feed the load or be injected into the grid.
The PV output voltage can be managed to achieve MPPT by control over the duty cycle of switch S1, according to the boost operating concept, as battery voltage can be considered practically constant.
The DC ports could feed the AC port using three different scenarios: the battery feeds the AC port, the PV with the battery feeds the AC port, and the PV feeds the AC port.
The DC bus voltage–voltage over C3—when the battery feeds the load or the battery and the PV supply the load—is:
where D is the S2 switch duty ratio.
The relationship between the PV port voltage and the input DC bus voltage is written as:
where
is the classical boost converter duty ratio.
The DC bus voltage when the PV is feeding the load is:
That reduces the duty cycle for switches S1 and S2, but the efficiency will reduce because the current will pass through more elements.
The SSHGC meets several crucial requirements when it comes to constructing integrated photovoltaic hybrid systems. Additionally, the input current ripple is within the limits, and the voltage stress over the converter switch S2 is half of the DC bus output voltage, and the voltage gain is twice that of a traditional boost converter. [
31] studied the selected HGSSC in depth, and provided all calculations and equations.
The 5H inverter is formed by adding an extra switch to the H-bridge inverter between the DC-link capacitor and the traditional H-bridge inverter. It generates AC output voltage in standalone mode or injects current into the grid in grid-tied power mode. During zero-voltage conditions, the extra switch isolates the DC side from the grid side, which is an efficient way to limit leakage current in non-isolated systems. The 5H is very efficient, reduces common-mode, circulates currents, and has minimal DC-link voltage oscillations [
32].
The DC sources in the proposed NHGTPC system are independent of one another, so the system may run without one of them or add more renewable energy sources to the system. This arrangement gives the system more flexibility in terms of operating circumstances. Furthermore, the suggested approach allows for greater flexibility in selecting the battery’s rated voltage and the suitable boost ratio for the PV voltage. In addition, the technique does not require any additional electronic circuits to manage battery charging.
3. The Power Flow for Different Operational Modes
From the residential customer point of view, the DSM should not use utility grid power during the time of high-rate electricity tariff (THRET), which is also beneficial for the utility grid. Therefore, the DSM charges the battery using photovoltaic power during the low-rate electricity tariff and uses the stored power during the time of high-rate electricity tariff, which is when no photovoltaic power is generated. Furthermore, the DSM decides the state of the utility grid connection based on the load demand and available power.
The DSM choses the operation mode by calculating the available photovoltaic power () and the battery State of Charge (SoC) and comparing them with the load power demand (PL), considering the THRET and the Maximum Battery Charging Current (MBCC). To make the comparison, PV current (), PV voltage (), battery current (IB), battery voltage (), load current (IL), and load voltage must be measured.
Figure 3 depicts a simplified demand-side management flowchart for controlling power flow between DC sources, the utility grid, and the load. There are eight possible operation modes, four of which are in the standalone power mode, where the system is disconnected from the grid, and the other cases are in the grid-tied power mode.
The load could be fed from the PV or the battery or from both of them in standalone or grid-tied power modes based on the system’s operation time, the battery state of charge, the generated PV power, and the charging current of the battery, which must be under the maximum battery charging current value. The operating modes are described as follows:
3.1. Mode 1 (PV >>>> Load + Battery)
The generated PV power is higher than the load demand, and the battery state of charge is lower than 90%, to avoid battery overcharge. Therefore, the system works in a standalone power mode, the power generated by the photovoltaic feeds the load, and the extra generated power charges the batteries with the condition that the battery charging current is lower than the adjusted maximum charging current value of the battery.
Figure 4 shows the power flow for mode 1.
3.2. Mode 2 (Battery >>>> Load)
The DSM decides that the battery feeds the load demand when the photovoltaic-generated power is null, the system operates during the time of high-rate electricity tariff, and the battery state of charge is higher than 10%.
Figure 5 shows the power flow for mode 2.
3.3. Mode 3 (PV >>>> Battery and Grid >>>> Load)
When the system operates during the time of low-rate electricity tariff, photovoltaic power is lower than the load demand, and the battery state of charge is less than 90%, and the DC sources are isolated. The photovoltaic power charges the battery with the battery charging current being lower than the adjusted maximum battery charging current value, and the load is connected to the grid. The power flow for mode 3 is shown in
Figure 6.
3.4. Mode 4 (PV + Battery >>>> Load)
Solar and battery power serve the load in standalone power mode, which is decided in two scenarios: (1) the solar power output is less than the demand power, the battery SoC is between 10% and 90%, and the system works during the high-rate electricity tariff period. (2) the PV power generated is less than the demand power, and the battery SoC is over 90%.
Figure 7 shows the power flow for mode 4.
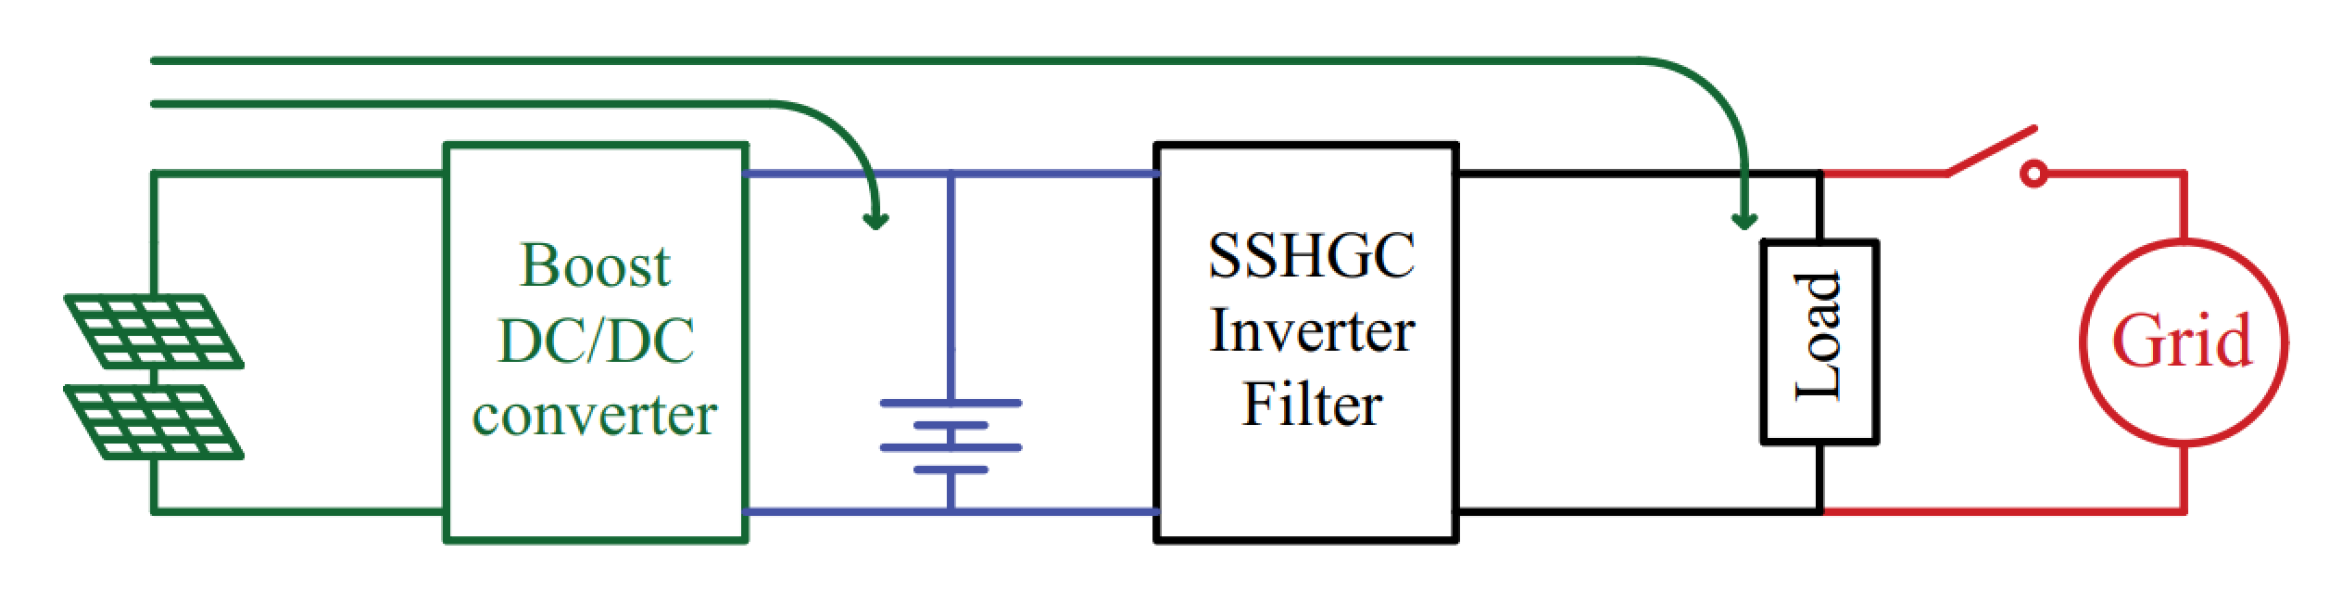
3.5. Mode 5 (PV >>>> Battery + Load + Grid)
The PV electricity charges the battery. The load, and the additional produced power is injected into the grid in this scenario, which is the first grid-tied operation mode.
Figure 8 shows the power flow for mode 5.
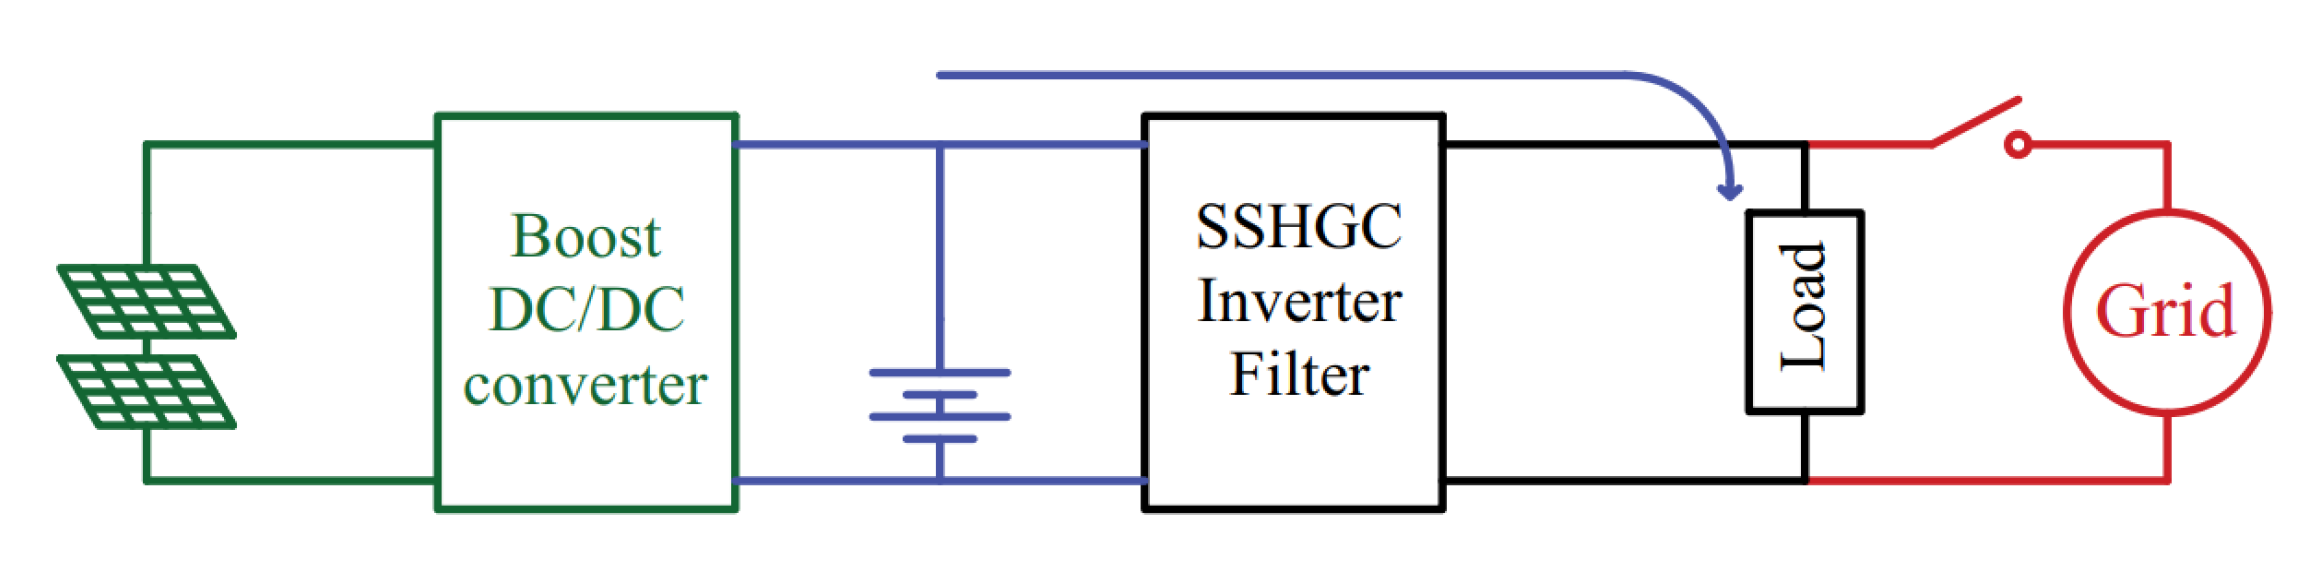
3.6. Mode 6 (PV >>>> Load <<<< Grid)
When the battery is empty and the solar-generated power is lower than the load demand during a high-rate energy tariff period, the solar feeds the load partially, with the additional load demand being met by the grid.
Figure 9 shows the power flow for mode 6.
3.7. Mode 7 (PV >>>> Load + Grid)
If the battery is completely charged, the SoC is greater than 90%, and the PV produced power exceeds the load requirement, the system operates in grid-tied power mode, with the surplus power injected into the grid. The power flow for mode 7 is seen in
Figure 10.
3.8. Mode 8 (PV >>>> Battery + Load <<<< Grid)
In cases where the battery is charged, the DSM checks the battery charging current and controls it under the adjustable maximum value as mentioned above. If the battery charging current exceeds the maximum value, the DSM must reduce it to the appropriate value, which provides extra photovoltaic power to cover a share of the load demand while the grid covers the rest of the load demand.
Figure 11 shows the power flow for mode 8.
Finally, the system shuts down and no power is sent from the DC sources to the load or the utility grid when: (1) Photovoltaic panels do not generate any power, and the system operates during the low-rate electricity tariff, (2) Photovoltaic panels do not generate any power, the system operates at a time of high-rate electricity tariff, and the battery is fully discharged.
4. Control Systems of the Proposed Converter
Different controllers should be used to verify that the proposed TPC fulfills the previously defined multi-stage power modes with a stable response and an acceptable steady-state error.
These controllers are used to manage the power supplied by solar panels, battery charging/discharging, keeping the DC bus voltage within the required limits to create AC voltage, and controlling power flow between system ports.
The overall control strategies of the proposed TPC are shown in
Figure 12. Three control loops could be implemented to control the whole circuit for all operation modes. The first loop controls the solar power and tracking of the maximum power point and controls the battery charged/discharged based on the load value or controlling the voltage across the input stage capacitor
value. The second control loop goal is to keep the voltage across the DC bus capacitor at 400 Volts.
The third control loop is used to control the invert and load voltage and current.
As discussed above, three stages of control are used to control the whole system: (1) the input stage that deals with the photovoltaic MPPT and battery charging and discharging, (2) the DC voltage lift stage that controls the voltage across the DC bus around the desired value, and (3) the output stage that generates the AC waveform in standalone power mode or injects current into the grid.
Several techniques, including perturb and observe, incremental conductance, parasitic capacitance, and constant voltage, can be used to perform maximum power point tracking.
In this paper, the incremental conductance technique was adopted as an MPPT technique. It has an advantage over perturb and observe in that it can remain at MPP after the MPPT has achieved the maximum power point, whereas the perturb and observe technique oscillates around the MPP. Furthermore, incremental conductance may follow the increase and decrease of irradiance conditions more accurately than perturb and observe.
The battery is charged by the photovoltaic during the daytime. This period is often the time of relatively low-rate electricity tariff in the residential sector. To increase the battery lifetime, the controller should avoid overcharging or over-discharging. Additionally, the battery charging current must not exceed the maximum charging current. As seen in the simple demand-side management flowchart,
Figure 3, the battery is charged in four operation modes 1, 3, 5, and 8. The battery current and voltage should be measured, and the state of charge should be estimated to apply the demand-side management algorithm. The proposed TPC does not include a special circuit for the battery charge/discharge, which decreases the system components. The DSM controls the battery and the charge/discharge control by controlling the voltage across the batteries and comparing the charging current with the maximum value.
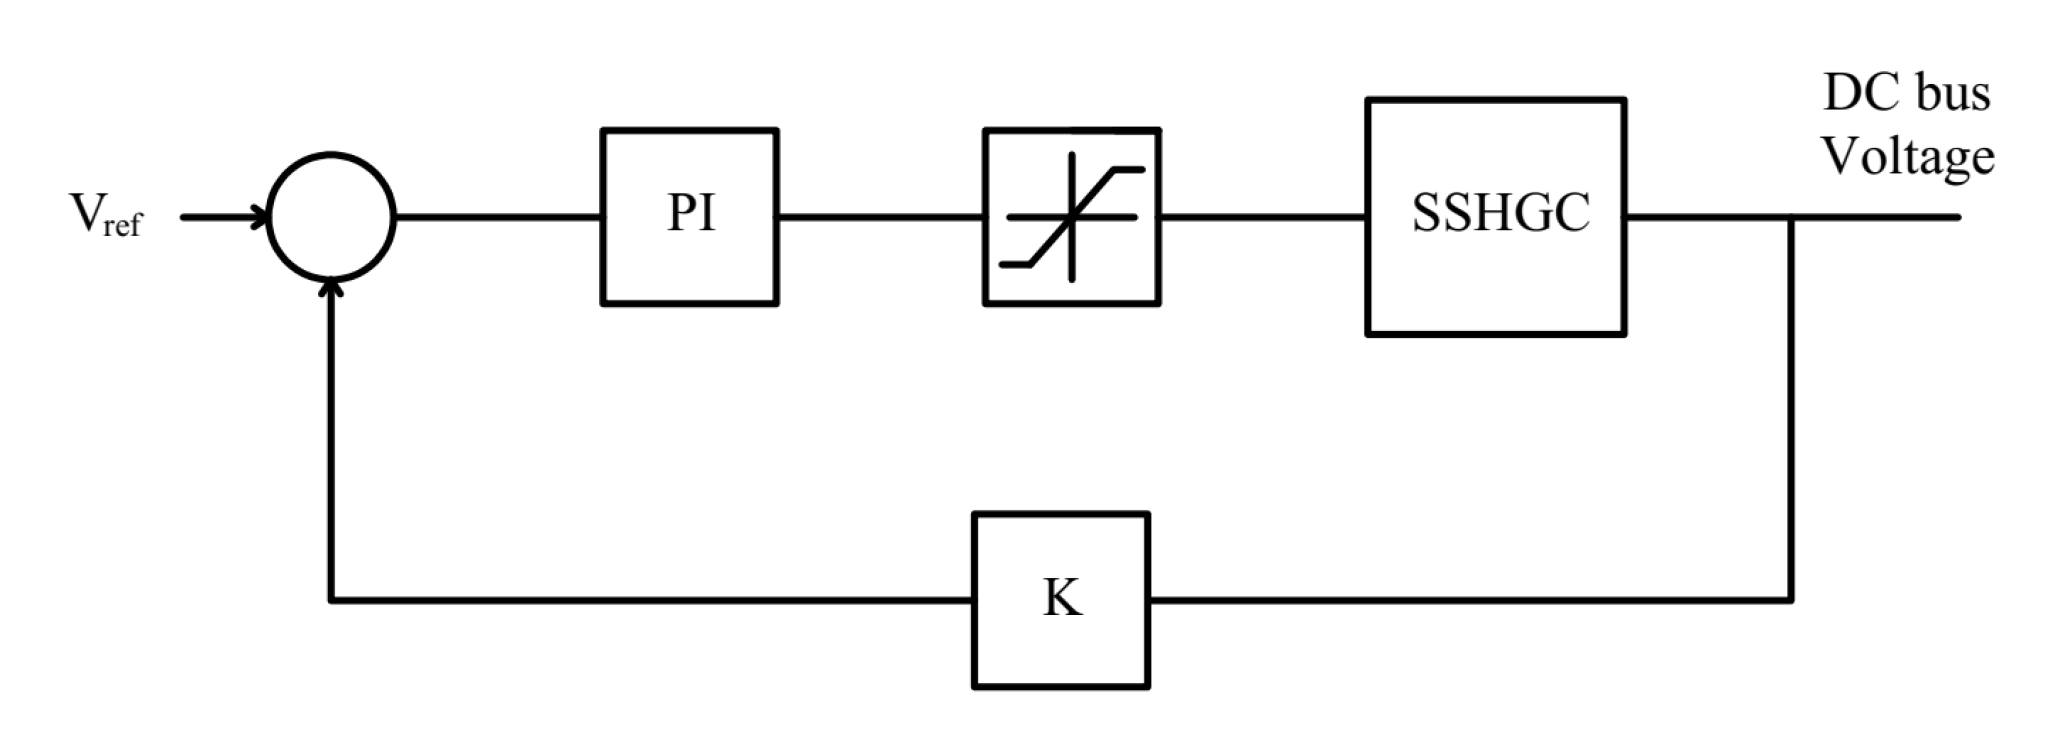
To feed the DC-AC voltage output stage, the single switch the high-gain converter must be able to lift the output voltage from 36 V to 400 V DC. The SSHGC is designed, and its efficiency is discussed in depth in [
31].
Figure 13 shows the used closed-loop control system with a Proportional-Integral (PI) controller, which is the commonly used control technique, to keep the DC bus voltage at 400 V.
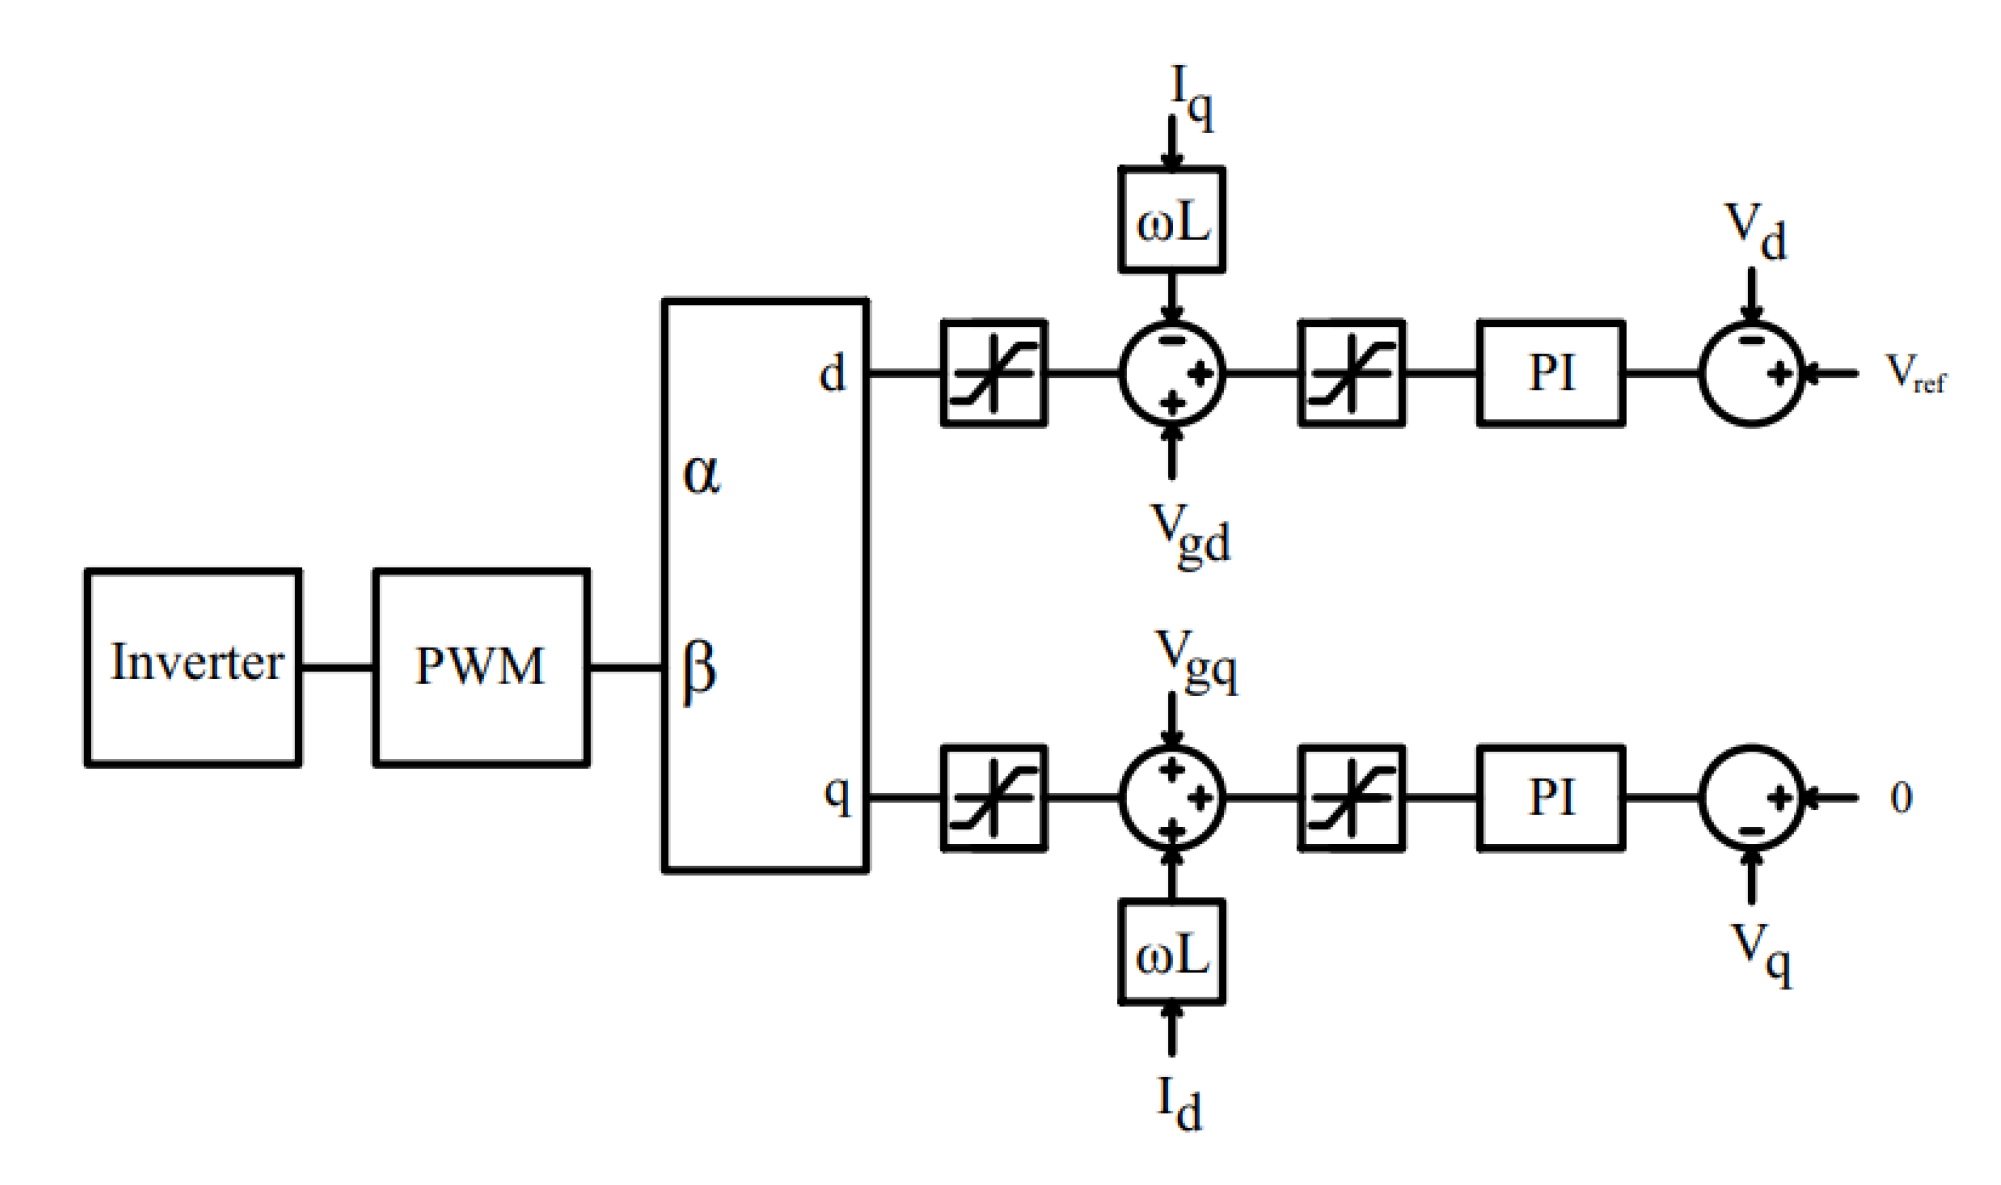
The well-known DQ rotating synchronous frame is used in this paper for both grid-tied and standalone power modes. DQ frame current controllers were first developed for three-phase inverters, but they were later expanded to single-phase current and voltage controls. DQ is a type of transformation that converts AC variables into comparable DC values that PI controllers can regulate more easily. Additionally, the DQ frame controller can control the injected active power and reactive power in the case of being grid-tied [
33]. The DQ components are defined as id, iq, for the injected current to the load ports, Vd, Vq for the voltage across the load, and Vgd, Vgq for the grid voltage.
Figure 14 shows the general block diagram of a single-phase inverter controlled by a DQ controller, where a single-phase 5H inverter serves the load in standalone power mode or injects power into the grid via a passive filter.
Figure 15 shows the DQ frame current controller for the grid-tied power mode. Phase-Locked-Loop (PLL) is also used, and the current injected into the grid is used to generate the DQ components to compare it with the current reference calculated from the available photovoltaic power.
A novel strategy is used to generate the AC signal in standalone power mode. The output voltage DQ components are compared with the affixed reference values, which control the amplitude of the sinusoidal wave. The grid voltage is used to control the voltage frequency;
Figure 16 shows the DQ controller for the standalone power operation mode.
5. Simulation Results
The proposed TPC is designed to supply a residential load varying from 50 Watts to 3500 Watts with a 0.9 power factor. The load feed from a battery and/or from 2500 Watts solar panels components are selected, and the system is simulated using PSIM software for all operation modes using the described control systems. The battery input voltage is 36 V, the PV panels voltage at MPP is 30 V, the DC bus voltage is 400 V, the output AC voltage is 230 V, and the switching frequency is 100kHz.
Table 1 demonstrates all the selected element’s values and parasitic resistance.
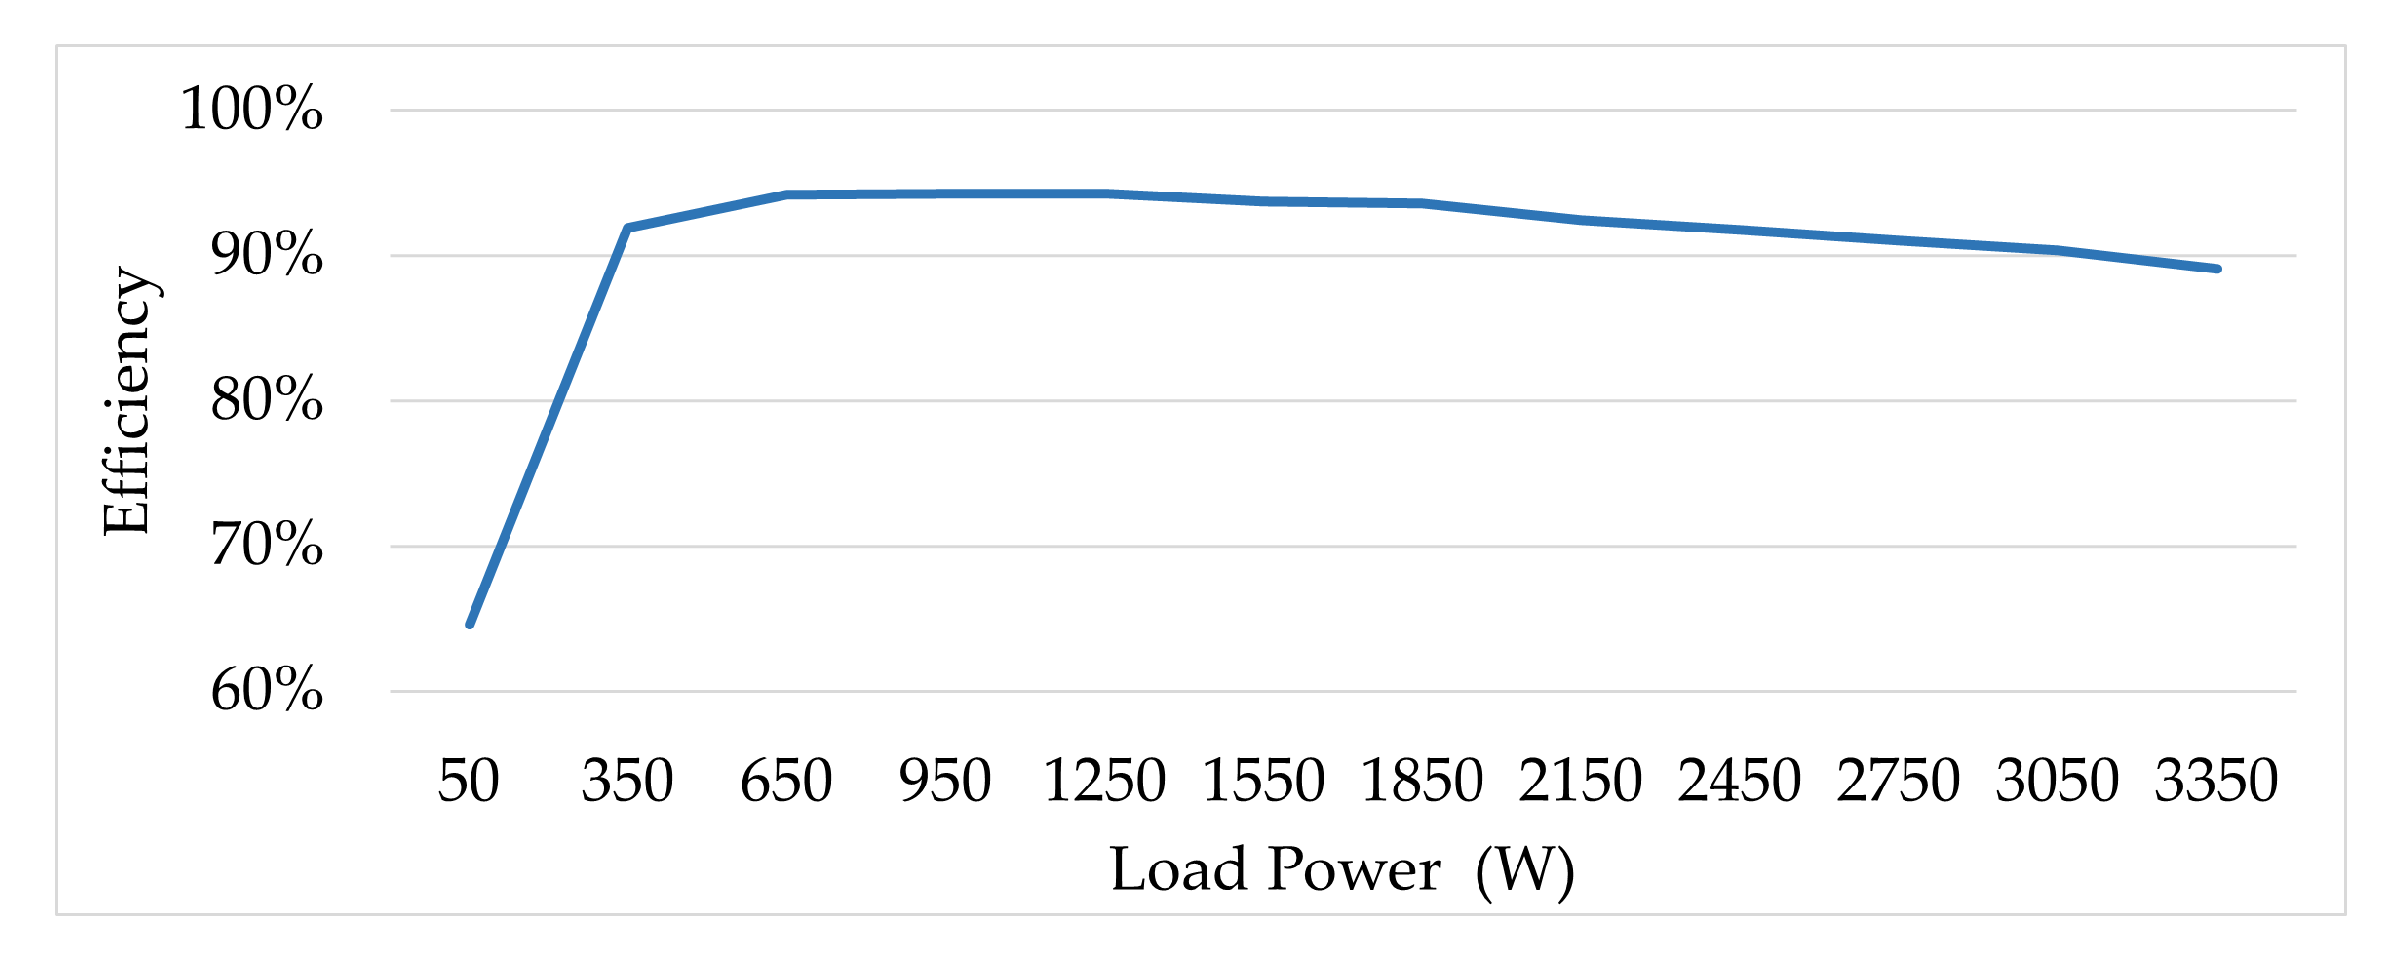
In operation mode 1, the photovoltaic power operates at its MPP (2500 Watts), the generated power supplies the load demand, which varies from 50 Watts to 2150 Watts, and the extra power charges the battery. The maximum battery charging current depends on several factors, such as battery Ah, temperature, etc.; therefore, the effect of this condition has not been considered in view of the relationship between efficiency and load power, which makes the results more general.
The DC bus voltage
is set to 400 V, and the PV voltage
is controlled close to its ideal value at 30 V because the MPPT is activated in this scenario, as shown in
Figure 17.
Figure 18 shows the PV current
and the battery charging current for power mode 1 at a load point of 650 Watts.
The relationship between efficiency and load power is shown in
Figure 19. Increasing the load makes more power pass through the SSHGC, which decreases the system efficiency. The efficiency is higher than 90% for loads less than 2000 Watts. This figure is also used to show the system performance in modes 5 and mode 8.
Operation mode 2 is designed to cover the second peak load of the residential load, which is the most critical period and has the highest tariff rate. Even though the system operates at its maximum nominal power, the system provides high efficiency during this operation mode as is shown in
Figure 20. The efficiency is generally higher than 90% and touches 95% for loads between 650 Watts and 1250 Watts. The voltages across the input capacitor and the DC bus, and the battery current at the load point of 1850 Watts, are shown in
Figure 21 and
Figure 22 respectively.
The DSM separated the DC ports, and the photovoltaic charges the battery using the classical boost converter, which has been thoroughly studied by many researchers, in operation mode 3.
Figure 23 shows the efficiency versus the photovoltaic power for power mode 4. The simulation conditions to examine this scenario are load demand fixed at 3400 Watts, photovoltaic operates at its maximum power, and the battery covers the rest of the load demand.
Efficiency is around 89% when the battery covers 3400 Watts. The value decreased to 87% when the battery covers 1050 Watts and the PV covers the remaining load of 3400 Watts. The efficiency decreased because of the classical boost converter losses, through which the power generated by photovoltaic passes.
Figure 24 shows the voltages over the input DC sources and the DC bus at the load of 3400 Watts and the power generated by the PV is 1188 Watts. The DC source currents are presented in
Figure 25 at the same operating conditions.
To examine the 6th and 7th operation modes, the load is connected to the grid, and the photovoltaic injects its maximum generated power to the output ports so that the grid absorbs the extra generated power or feeds the shortage of the load demand.
Figure 26 shows the relationship between the system efficiency and the injected current. The efficiency touched 92% at 1380 Watts, and it is generally above 91%.
The system is simulated to inject 1500 Watts from the PV to the grid.
Figure 27 and
Figure 28 show the DC bus voltage, and PV voltage and current.
Figure 17,
Figure 18,
Figure 21,
Figure 22,
Figure 24 and
Figure 25 show the DC bus voltage and the DC sources voltages and currents when the battery is connected to the system. It could be seen that the DC bus voltage is rippling with a 100 Hz ripple. This well-known ripple occurs because of the inverter, and many researchers have studied it and have proposed several techniques to minimize it.
The battery voltage and current absorb this ripple whenever it is connected to the system, and keep the PV voltage and current constant and stable. The PV received the effect of the ripple in power modes 6 and 7 as seen in
Figure 27 and
Figure 28.
Figure 29 shows the load current and voltage, the grid voltage, and the DC bus voltage for the PV feed the load in standalone and in grid-tied power modes. In the case of standalone, the generated waveforms have high quality, where the total harmonic distortion is around 1.5% for the current waveform and 2% for the voltage waveform. In grid-tied power mode with a 6 Amps current injected into the grid, the THD of the injected current is 5.5%.
The simulation results illustrate that the system can supply the varied residential load in standalone or grid-tied power mode, and the efficiency of the whole system is generally higher than 90%.
Table 2 presents the comparison of the proposed TPC with some of the recent non-isolated TPCs in the reviewed literature. The input and output voltages, the voltage gain, the ability of extension, switching type, state of input current, the number of components, and the number of operating modes are also presented in the table. The proposed TPC fulfills several required requirements for BIPV systems such as low input ripple, high efficiency, low cost, and size, and it does not require an additional circuit for battery charging. Additionally, it covers more power modes, which makes it the most suitable converter for BIPV.
6. Conclusions
This paper presents a new three-port non-isolated converter using a multi-stage technique. Additionally, A novel simple DSM is proposed to manage the load flow between the ports.
The proposed TPC is flexible to the addition of more renewable energy sources or more DC input ports, flexible to the changing of the rate of PV panels, and adding more batteries. The voltage stress over the switch is half of the classical boost converter, and the DC sources current ripple is low.
PSIM software was implemented to investigate all possible power modes. The results show the efficiency for all operation modes is higher than 90%, and touches 95% in some cases.
The simulation of the proposed TPC and the proposed control system definitely support experimental/hardware implementation of it in the future. In addition, soft switching could be implemented to improve system efficiency.


