1. Introduction
Information sharing and communication capabilities increase the ability to become more flexible, reliable, and robust. Systems with these characteristics are becoming common in our society, thanks to the evolution of computers and their miniaturization, network performance, and processing capabilities. The state of transportation is already populated with several standalone technologies—electronic tolling, traffic information systems, variable message signs, personal vehicles with navigation and notification systems, infrastructure to track and manage traffic—confirming that intelligent systems are gaining widespread acceptance within the transportation community and by the general public. As transportation technologies converge into more automated and advanced systems, the cooperative benefits of Intelligent Transport Systems (ITS) start to become more evident, as they can improve the overall proprietary systems’ performance and reliability through information from all the agents present in the road environment, thus creating more benefits in terms of transport security, safety, efficiency, and sustainability.
Through exclusive entities named ITS-Stations (ITS-Ss), applications encompassing relevant information for various road scenarios are deployed. These applications are fed by basic services that, with data provided by sensors, vehicle inputs, or central entities, construct, manage, and process different standardized messages. With some applications requiring low latency values to be considered useful, short-range access technologies such as ITS-G5 were developed to cope with some of the challenges in the dynamic road environment. With dedicated radio channels, this technology skips all the excessive time-consuming processes that regular wireless technologies use by creating ad-hoc vehicular networks based on the so-called Vehicle-to-Vehicle (V2V) and Vehicle-to-Infrastructure (V2I) interactions without relying on a management infrastructure. Other applications are intended to disseminate information over wider areas, and for that, cellular communications are used. With the advantage of supporting a larger amount of data, cellular networks enable access to specific ITS services (e.g., software updates, traffic information) and generic services for entertainment (e.g., video stream, points of interest). Another important element that can be exploited in cooperative systems is the roadside infrastructure that is deployed along the road. Its advantageous position and access to communication resources that are simply not available in the majority of vehicles today elevate its sensorization potential. Moreover, in more demanding scenarios, the infrastructure can be the only source of information dissemination to avoid communication channel congestion or even orchestrate a joint maneuver for a group of autonomous vehicles.
The Cooperative Awareness Service (CAS) is one of the ITS services that locally disseminates information in the form of Cooperative Awareness Messages—CAMs [
1]. The position, motion state, and dimension information of a certain ITS-S could be processed by the receiver, allowing it to predict, calculate, and avoid safety-critical situations. This service provides fundamental information to the road environment by transmitting the ITS-S status, which reduces uncertainties and overcomes awareness challenges unachievable by vehicle drivers alone. On the other hand, the penetration of Cooperative Intelligent Transport Systems (C-ITS) technologies into real-world implementation is going to be gradual, meaning that communications-enabled vehicles are going to coexist for a large period of time with vehicles without these communication capabilities, and even before that, the local awareness of fully ITS-enabled vehicles needs to be as high as possible to assure the higher performance and resilience of the system. To do so, the Collective Perception Service (CPS) emerges as a viable solution to cope with these difficulties and to extend the information sharing nature of C-ITS.
Rather than disseminating the station’s current state, i.e., position or velocity, the ITS-S can also share information regarding several agents that had been detected by their local sensory system. The Collective Perception (CP) aims to exchange the locally perceived objects (e.g., obstacles, vulnerable users, and legacy vehicles) in the network, reducing the uncertainty in the road environment for the ITS-Ss by contributing with information to their mutual Field-of-Views. With CAM aggregation information, this concept enhances and enables safety applications based on received information about objects located outside the range of an ITS-S’s perception sensors (e.g., warning of incoming traffic in an intersection without Line of Sight (LOS)) [
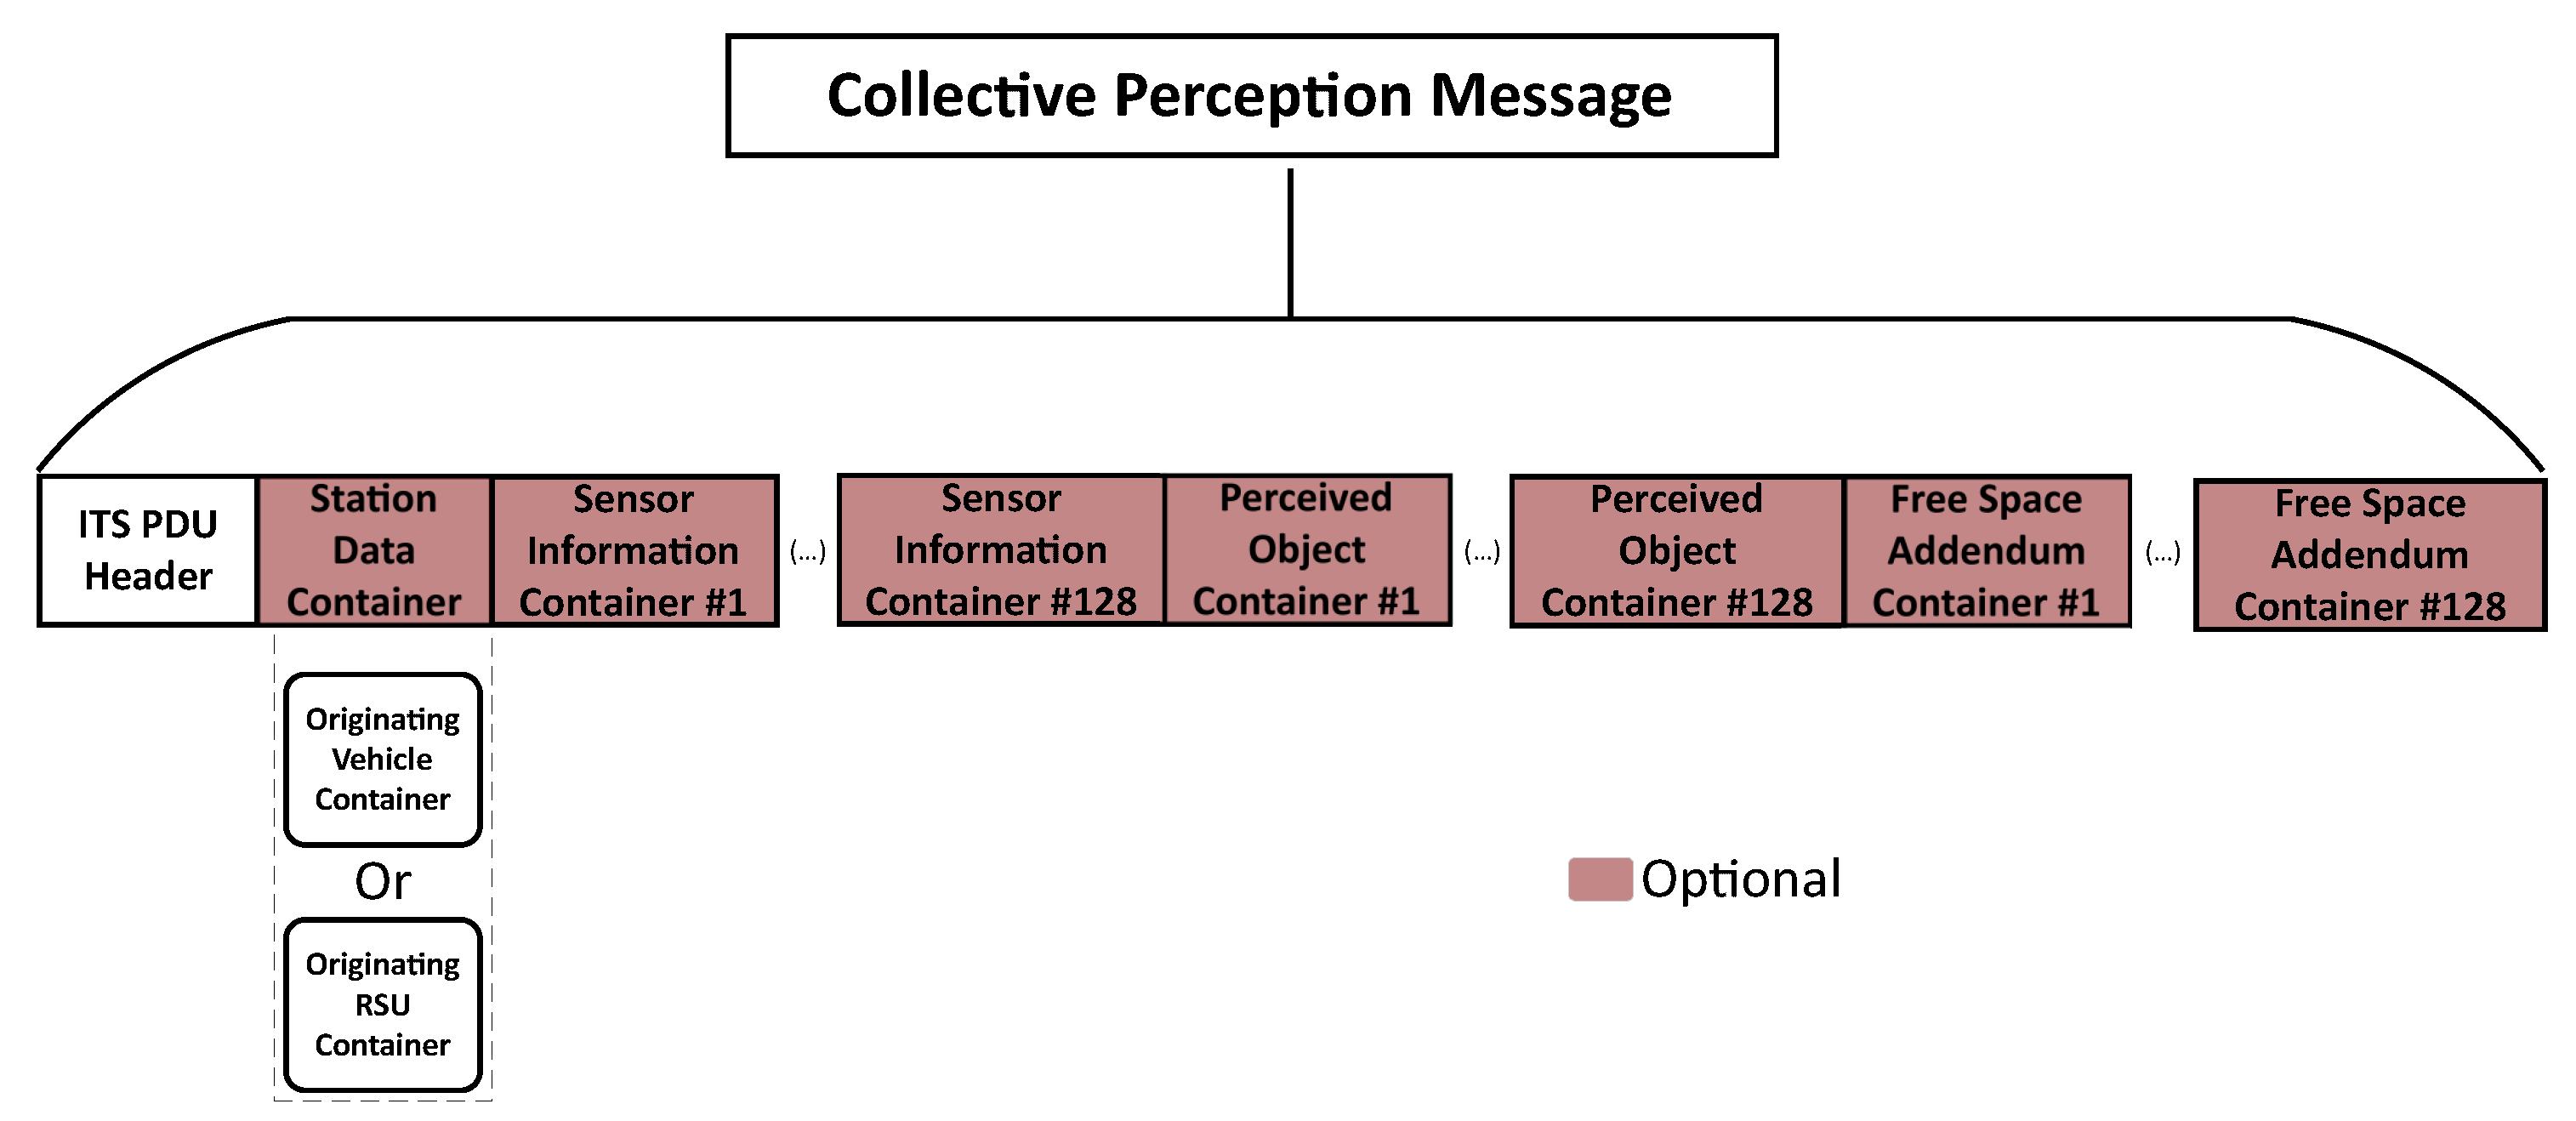
2]. The CPS is the entity located at the facilities layer responsible for generating, receiving, and processing Collective Perception Messages (CPMs), which contain information concerning the detected objects, as well as the information status regarding the originating ITS-S and its sensory capabilities. An object should be associated with a certain confidence level that is computed by a sensor fusion system, usually proprietary. The confidence level needs to be unanimous within the transmitting ITS-Ss; therefore, confidence metrics need to be harmonized in the road environment to avoid ambiguity upon reception. This parameter is also applicable at the free space measurements, i.e., the path between the sensor making the measurement and the object detected. To visualize the CPM structure,
Figure 1 illustrates the containers that constitute the message [
3]:
The message contains the common ITS headers that include protocol version, message type, station ID, and the information about the originating ITS-S such as reference position and ITS-S type. The remainder of the containers include the parameters concerning the detection sensors of the transmitting station, as well as the individual information regarding the dynamics and properties of each detected object and the free space area measured by each sensor.
It is expected that different ITS-Ss detect the same object, leading to redundant and worthless updates broadcasts, and therefore, increasing the network load unnecessarily, resulting in CPM losses and CPS performance degradation. Several mitigation rules could be applied, reducing the message length by omitting some perceived objects that fit pre-defined redundancy mitigation rules. Although maintaining a balanced network load is important, it only makes sense to apply these mitigation rules when the load surpasses a certain threshold, otherwise, the CPM needs to include all perceived objects to ensure maximum reliability within the road environment.
The CPM generation frequency is managed according to the channel usage requirements provided by the Decentralized Congestion Control (DCC), a mechanism (present in the ITS-G5 technology) to regulate radio channel load and reduce range degradation and self interference. Nevertheless, the frequency should be truncated between 1 Hz and 10 Hz for both vehicle ITS-Ss and roadside ITS-Ss. Even if no objects were detected or do not meet the requirements to be included in the message, the CPM should be transmitted anyway to report that objects are able to be detected. In the extreme scenario where the CPM is dropped by the DCC in the access layer (for example, due to channel congestion), the objects presented in the dropped CPM could be disseminated as soon as possible with subsequent CPM segments [
3,
4].
In this paper, following the European Telecommunications Standards Institute (ETSI) standards, an implementation of the CPS is developed in an ITS-S architecture, more precisely, in sensor-equipped RSUs that are integrated in a real road infrastructure. The CPMs are generated with information provided by a traffic radar, being disseminated locally through ITS-G5 and to a cloud Message Queuing Telemetry Transport (MQTT) broker for broader dissemination. Moreover, dynamic generation rules are applied to optimize the overall radio channel efficiency and maintain a balanced channel work load. After the implementation work, tests are performed in order to conclude if the service respects the delay boundaries of safety-critical applications as well as verifying the effectiveness of the dynamic generation rules.
The remainder of this paper is organized as follows. In
Section 2, the related work regarding the scalability and dissemination strategies of the CPS as well as the importance of the RSU within the CPS is presented. The overall system architecture and the implementation work performed is detailed in
Section 3. In
Section 4, in addition to the results obtained from the experimental tests, some discussion regarding the obtained values is performed. Finally, in
Section 5, some conclusions and guidelines for future work are presented.
2. Related Work
In conjunction with V2V communications, the design of a good support infrastructure can leverage the performance of the CPS by providing viable information (through I2V/V2I communications) in more demanding situations thanks to the advantageous position, computation, and communication capabilities of the RSU. The review work of this section focuses on examining some of the characteristics of the CPS, such as scalability and traffic load, and combining them with some of the features that a well-placed RSU could bring to potentiate the performance of the service.
With the C-ITS adoption scaling up, problems associated with communication channel load, obstruction, and latency start to become relevant and need to be addressed. Yicong Wang et al. [
5] approach this scaling problem by quantifying the performance of the CP to different penetration rates of sensing vehicles in the road traffic with two metrics: sensing redundancy and coverage. Through analytical models and simulation, it was shown that collaborative sensing is more reliable and robust (higher sensing redundancy) when a moderate vehicle density is achieved, while the coverage reliability is greater with higher density and penetration rates (even though a fairly high degree of reliability could be achieved with only a small percentage of sensing vehicles). Another factor was the relation between the scalability of the CPS and the V2I traffic load, showing that from the initial penetration rate, the V2I resources are critical to safety-related applications. This traffic load (V2I traffic) will tend to diminish with the evolution of the CP penetration rate while still maintaining great responsibility when it simply is not possible to achieve V2V communication.
Gokulnath Thandavarayan et al. [
6] also analyzed the scalability factor of the CPS, taking into account the CPM generation rules that serve as the measuring point between perception and channel load. In a first analysis, it was shown that the dynamic CPM generation policies adapt significantly better to the traffic density variations since the objects detected are only included in the CPM based on certain motion rules, and thus, a lesser number of objects are included in the CPMs without losing object awareness (e.g., the lowest the object’s speed, the less frequent the object is included in a CPM). This adaptation was also verified in the communication channel performance evaluation where the Channel Busy Ratio (CBR) and Packet Delivery Ratio (PDR) were measured. The CBR of the dynamic policies presented the lowest increase while maintaining a good PDR from a low traffic density to a high traffic density scenario.
Better perception can indeed be achieved with more frequent transmission of CPMs even with a certain level of redundancy, however, the implementation of certain rules for maintaining a balanced channel load are important for more demanding scenarios. G. Thandavarayan et al. [
6] also denotes that a frequent transmission of CPMs that report information about a small number of detected objects will result in redundant headers that can increase the channel load and reduce the reliability of the CPS. This fact is discussed in [
7], showing that the number of objects included in each CPM is lower than the effective number of objects detected in both highway and urban scenarios. Based on this, Gokulnath Thandavarayan et al. [
7] proposes an algorithm that is an improvement of the ETSI CPM’s generation rules. The algorithm assumes a constant acceleration of the object and predicts if any of the objects detected that are not included in a current CPM generation event and would be included in the following CPM should in fact be included in the current CPM, avoiding the subsequent CPM generation with less number of perceived objects.
To tackle the problem of redundant headers, Ameni Chtourou et al. [
8] explored the integration of strategic placed RSUs to avoid excessive CPM generation from On-Board Units (OBUs) in high traffic scenarios and take greater advantage of new emerging technologies such as, for example, mobile edge computing. In a first instance, by an analytical approach, the authors show that CPMs generated by RSUs tend to include more perceived vehicles at different traffic densities than the CPMs generated by OBUs. Allied to this, the I2V communications presents a higher PDR compared to a scenario where Vehicle-to-Everything (V2X) (both I2V and V2V) communications are employed. Although limited to the RSU coverage area, these analytical results were then confirmed in Veins simulations, concluding that I2V communications can reduce the channel load while maintaining collective perception.
In light of the French national project PAC-V2X, Pierre Merdrignac et al. [
9] presented a cooperative system with the objective to increase the autonomous vehicle perception in safety-critical zones by fusing information from their own perception system with the information received from CPMs and CAMs. This provides a level of redundancy and reliability to the cooperative system if the RSU is equipped with different sensors from the ones present in the communicating vehicles. In a first case, it was evaluated how Global Navigation Satellite System (GNSS) noise can impact the ability of an autonomous vehicle to localize surrounding vehicles by means of receiving CAMs or by local perception. The received CAMs show less resilience to GNSS noise, since it relies on these data to localize the transmitting vehicle. On the other the hand, the local perception provides more accurate results even in high levels of noise. In a second case, the RSU placement is evaluated in order to monitoring a certain region of interest, detecting all the vehicles in its range. As expected, the local awareness has grown exponentially as the RSU transmitted more CPMs, without loss of accuracy, even with the introduction of GNSS noise.
Beyond simulations that support the importance of RSUs in a collective perception environment, some real scenario projects have also been implementing infrastructure and evaluating the potential outcomes it could have in a automated road environment. Abhishek Jandial et al. [
10] address the insights and the metrics to take into account in order to assist Automated Vehicles (AVs) in specific areas. The requirements regarding location such as physical roadside conditions (e.g., building placement, site topology), object type detection (e.g., pedestrians, vehicles or both), and region of interest (e.g., search for blind spots) are evaluated to assure that the information provided by the infrastructure could be as valuable as possible and not provide redundant data already captured by the local perception system of the AV. Another metric taken into account was sensor qualification constraints and requirements. The results of the implementation ended up showing that all requirements surrounding the infrastructure implementation alter the performance of the system. Significant variations in distance accuracy measurements and message transmission range were observed, meaning that if a careful evaluation of the infrastructure components and the site is not made, the RSU could end up providing ambiguous information degrading the whole collaborative perception concept.
Mao Shan et al. [
11] conducted several experiments where a connected and AV relies only on the perception information provided by an RSU, equipped with several cameras and a LiDAR sensor. In addition to the demonstrations, it addressed several uncertainty problems associated with the information transmitted in the CPMs. One aspect is the fact that each sensor measurement is corrupted with noise that could compromise the real positioning of the detected object in the field of view. This uncertainty could be mitigated with the use of different sensors that feed unique information into a sensor fusion system. Another aspect is the self-localisation of the transmitting ITS-S, where even stationary ones such as RSUs are not completely free of localisation errors. Different mechanisms that can localize the stationary or moving ITS-S could complement each other to provide the best accuracy possible. Nevertheless, these uncertainties have to be taken into account. Three experiments were conducted in a real urban traffic environment in a CARLA simulator [
12] and in a controlled laboratory traffic site involving an AV and pedestrians. Based on the information provided by the RSU, the AV detected and predicted in advance the pedestrian’s presence and movement. These experiments highlight the importance of the CPS in road safety use cases, by improving the perception quality and reliability of the automated vehicle. In addition to V2V communications, the deployment of infrastructure provides a great source of valuable information that brings robustness for decision making of drivers and autonomous operations.
Similar to the tests run in [
11], European Union (EU) research projects such as Managing Automated Vehicles Enhances Network (MAVEN) [
13], Intelligent Maneuver Automation (IMAGinE) [
14], and Transition Areas for Infrastructure-Assisted Driving (TransAID) [
15] explore the CPS in real traffic environments. These projects enhance the importance of the CPS in the AV performance, more specifically in the infrastructure assisting information. TransAID focus on traffic management procedures and protocols, so non-connecting vehicles and AV can coexist in the road environment and how the CP could impact some use cases such as lane merging and hazard situations. Special attention is given to transition areas, which are special areas where AVs need to change their automation level to assure safety in different situations. Trials [
16] showed that the infrastructure, due to the advantageous positioning, provide information to AVs that resulted in less transitions of control (handover of the vehicles control to the automation system to the driver or vice versa) and less risky maneuvers that smoothed their interactions and, consequently, the traffic flow. MAVEN’s work focus on three intersection use cases (speed and lane change advisory, urban platooning, inclusion of non-cooperative vehicles and road users) in which the vehicles, using V2X communications, interact with the infrastructure and obtain the best possible advisory information for local perception, lane positioning, and maneuver coordination. In addition to the use of CAMs, Signal Phase and Timing Extended Message (SPATEMs), Map Extended Message (MAPEMs) (Infrastructure Messages), and the proposal of a new Lane Change Advice Message (LAM), the use of CPMs helps the AV to identify Vulnerable Road Users (VRUs) and legacy vehicles in intersections. Allied to CP, IMAGinE explores the integration of the Maneuver Coordination Service (MCS) into some use cases such as overtaking, highway speed and steering control, intersection turning, and strategic traffic distribution on the road.
The design of a good infrastructure support for the cooperative and automated road environment is essential to maintain the reliable service performance needed to assure road safety. The physical limitations of V2V communications in more demanding scenarios can be complemented with I2V communications to satisfy all applications requirements. With newer services emerging, such as MCS that are extremely dependable on the information provided by the CPS, the need for CP deployment becomes critical. Moreover, the RSUs act as communication points between the road and the traffic management center that helps to monitor and maintain order in the road environment.
3. Architecture and Implementation
3.1. Architecture
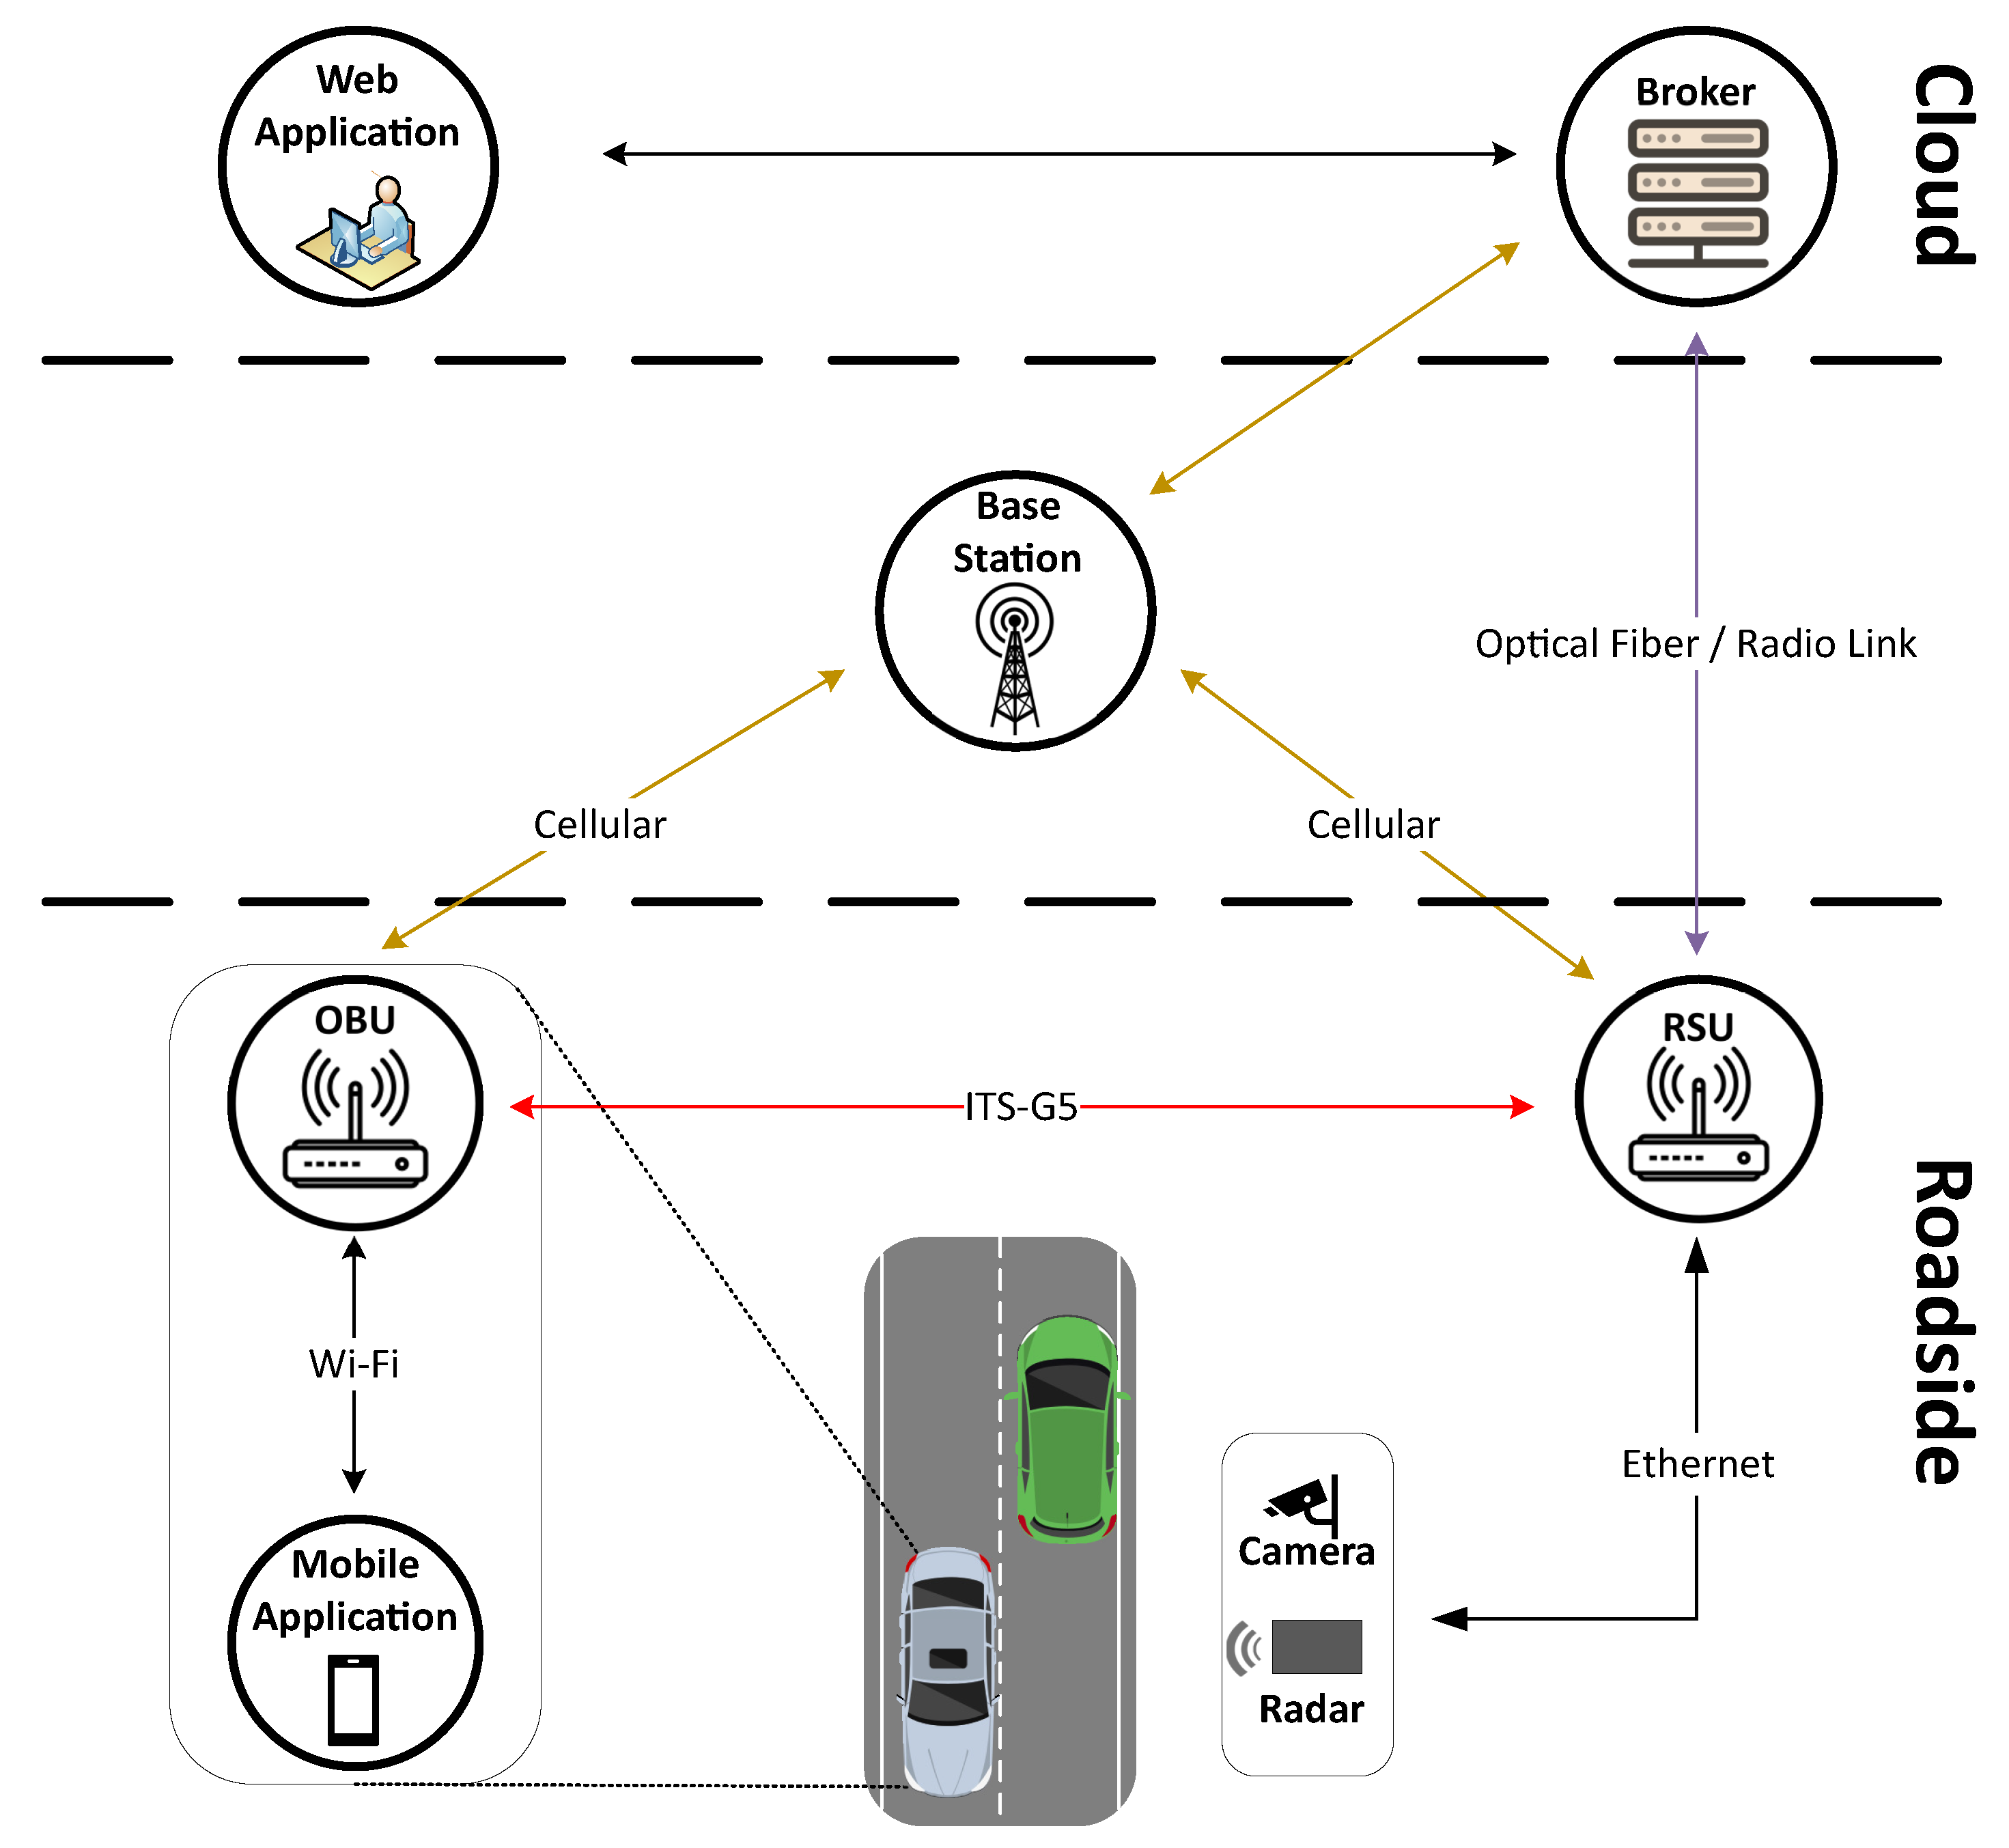
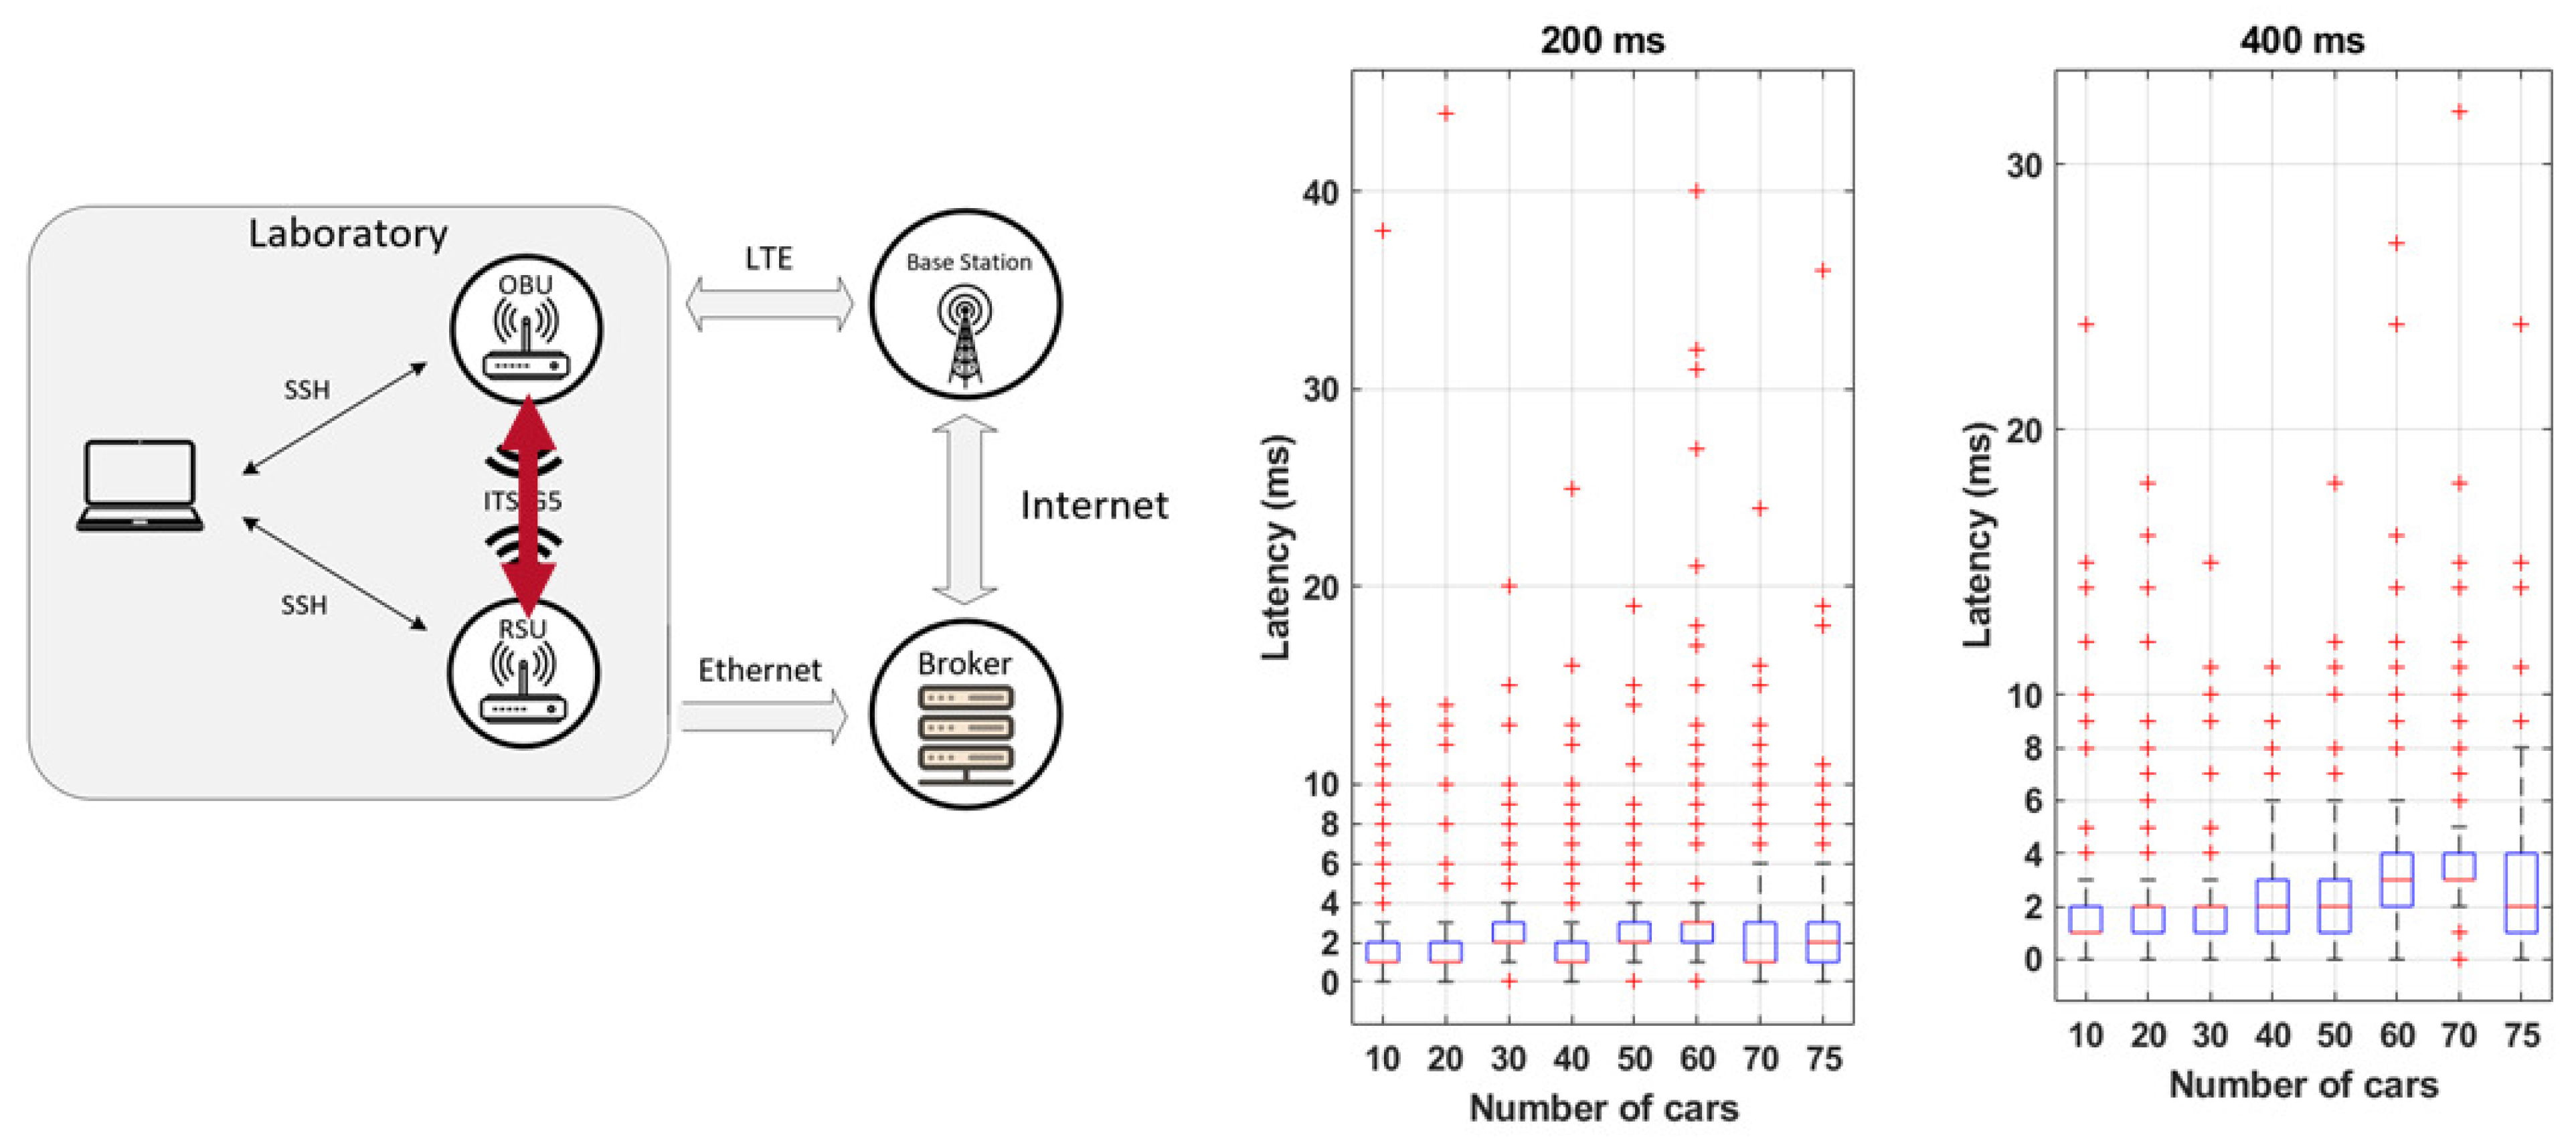
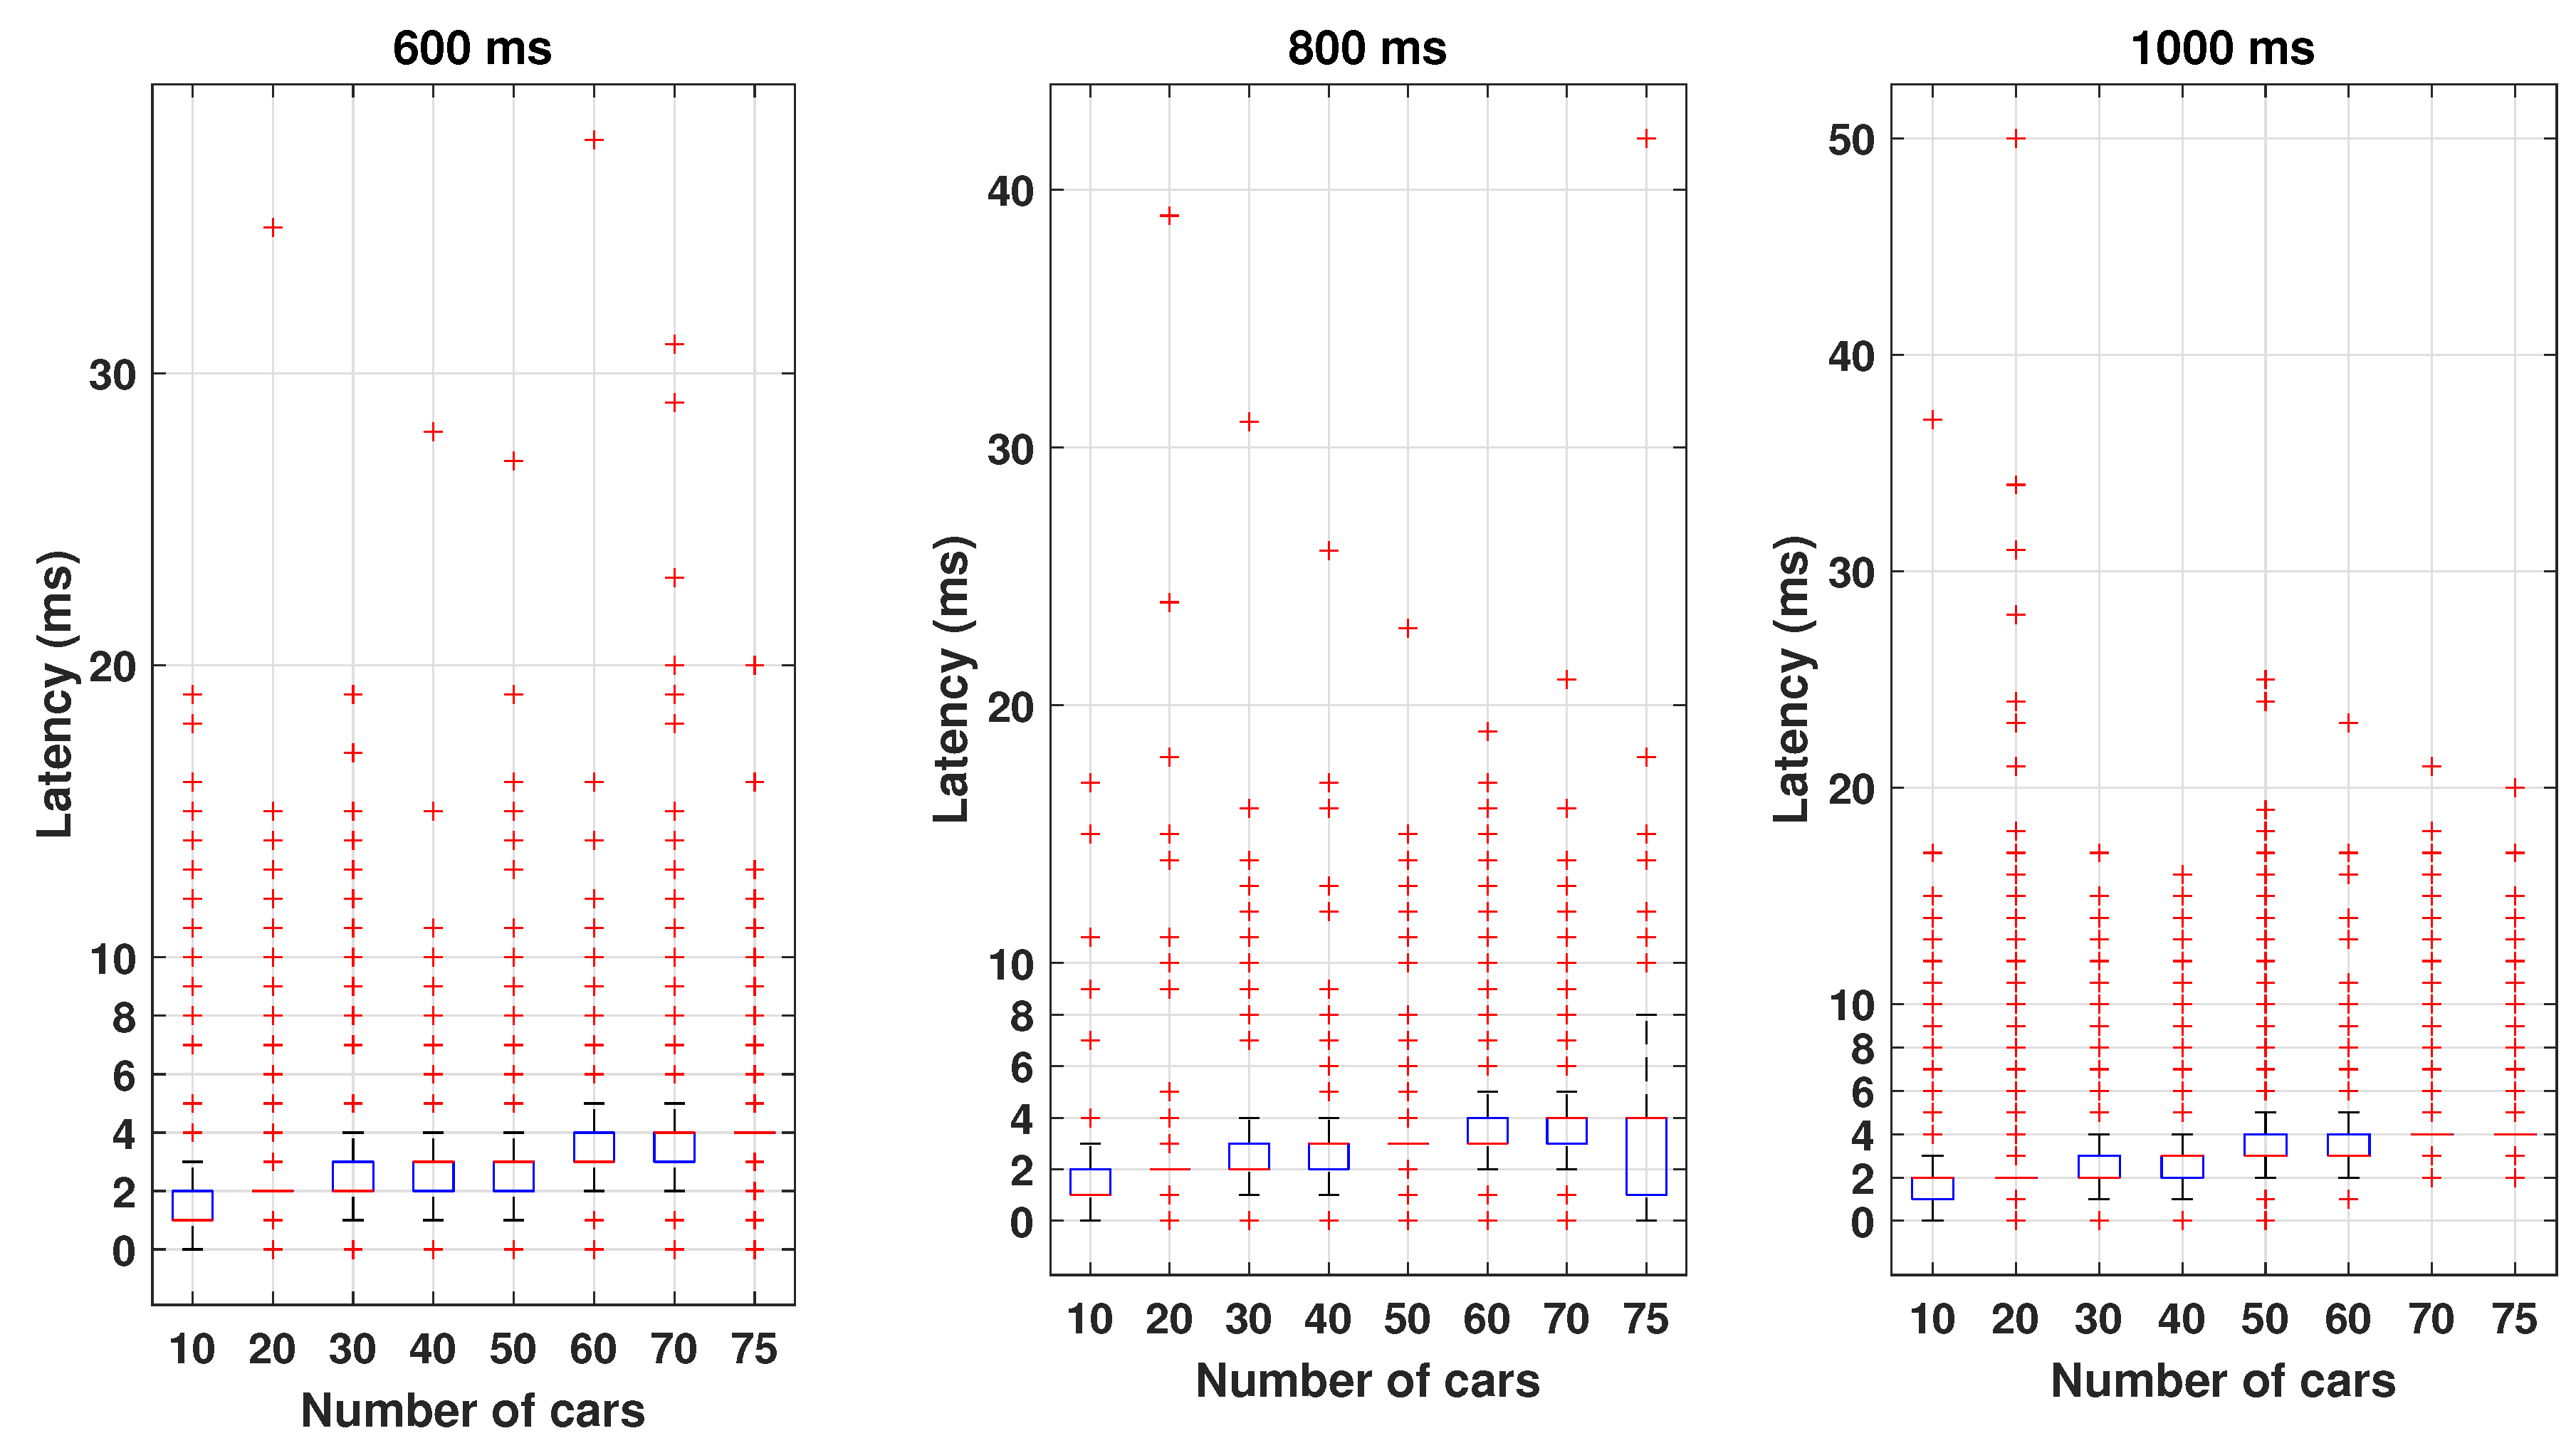
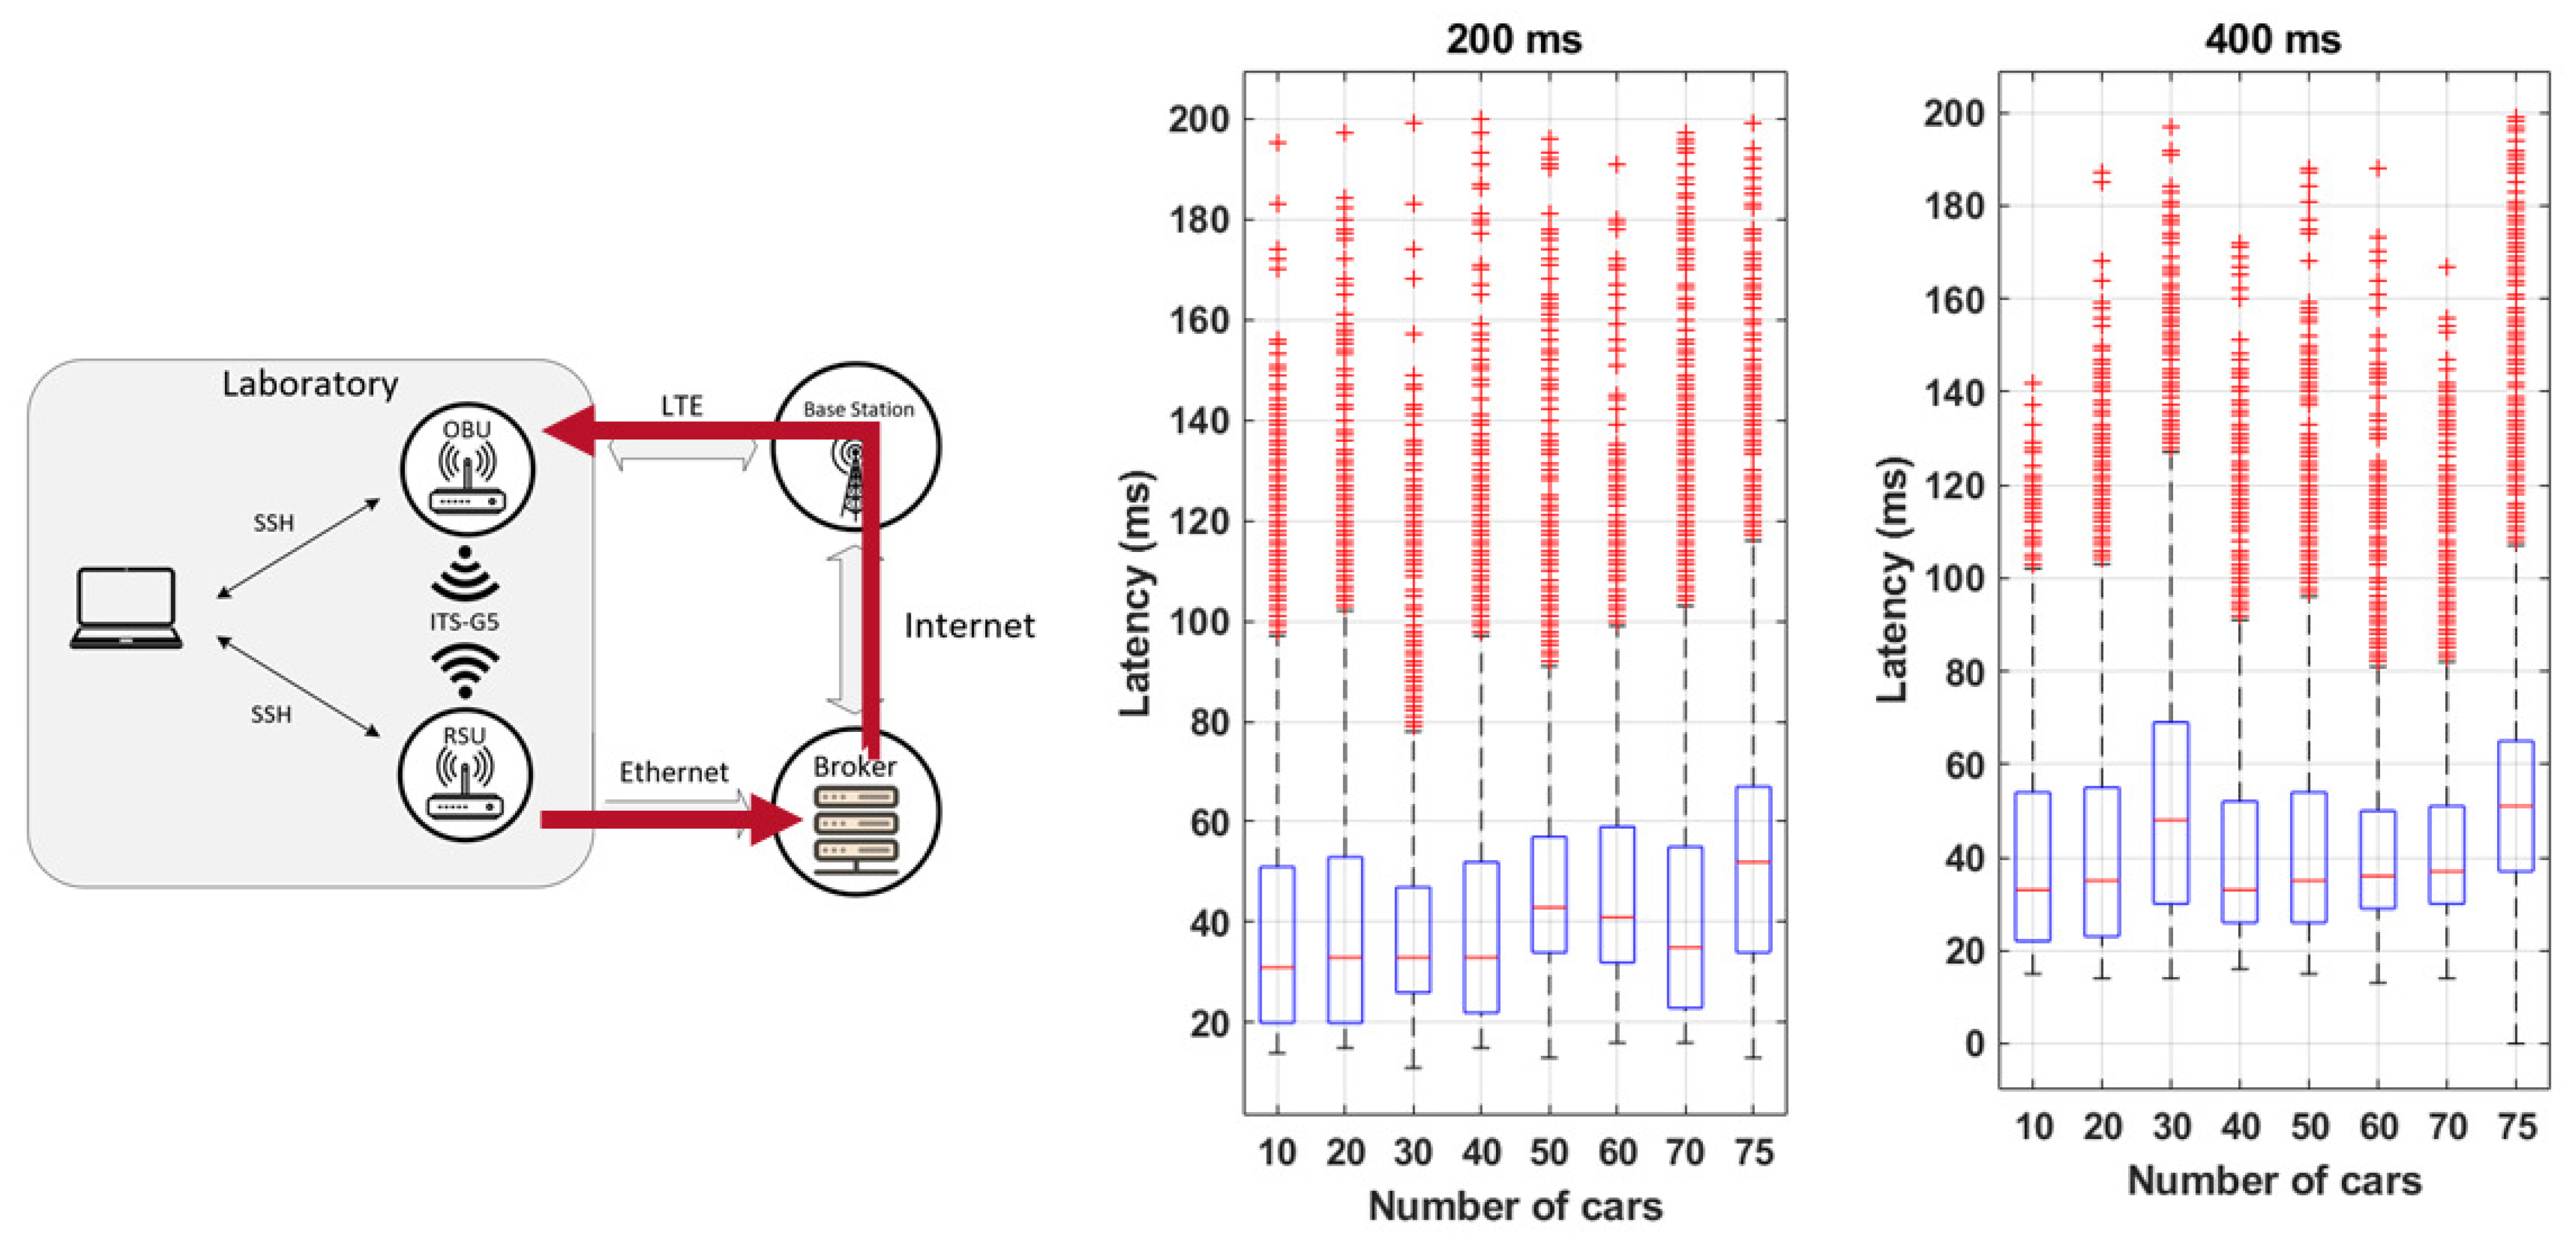
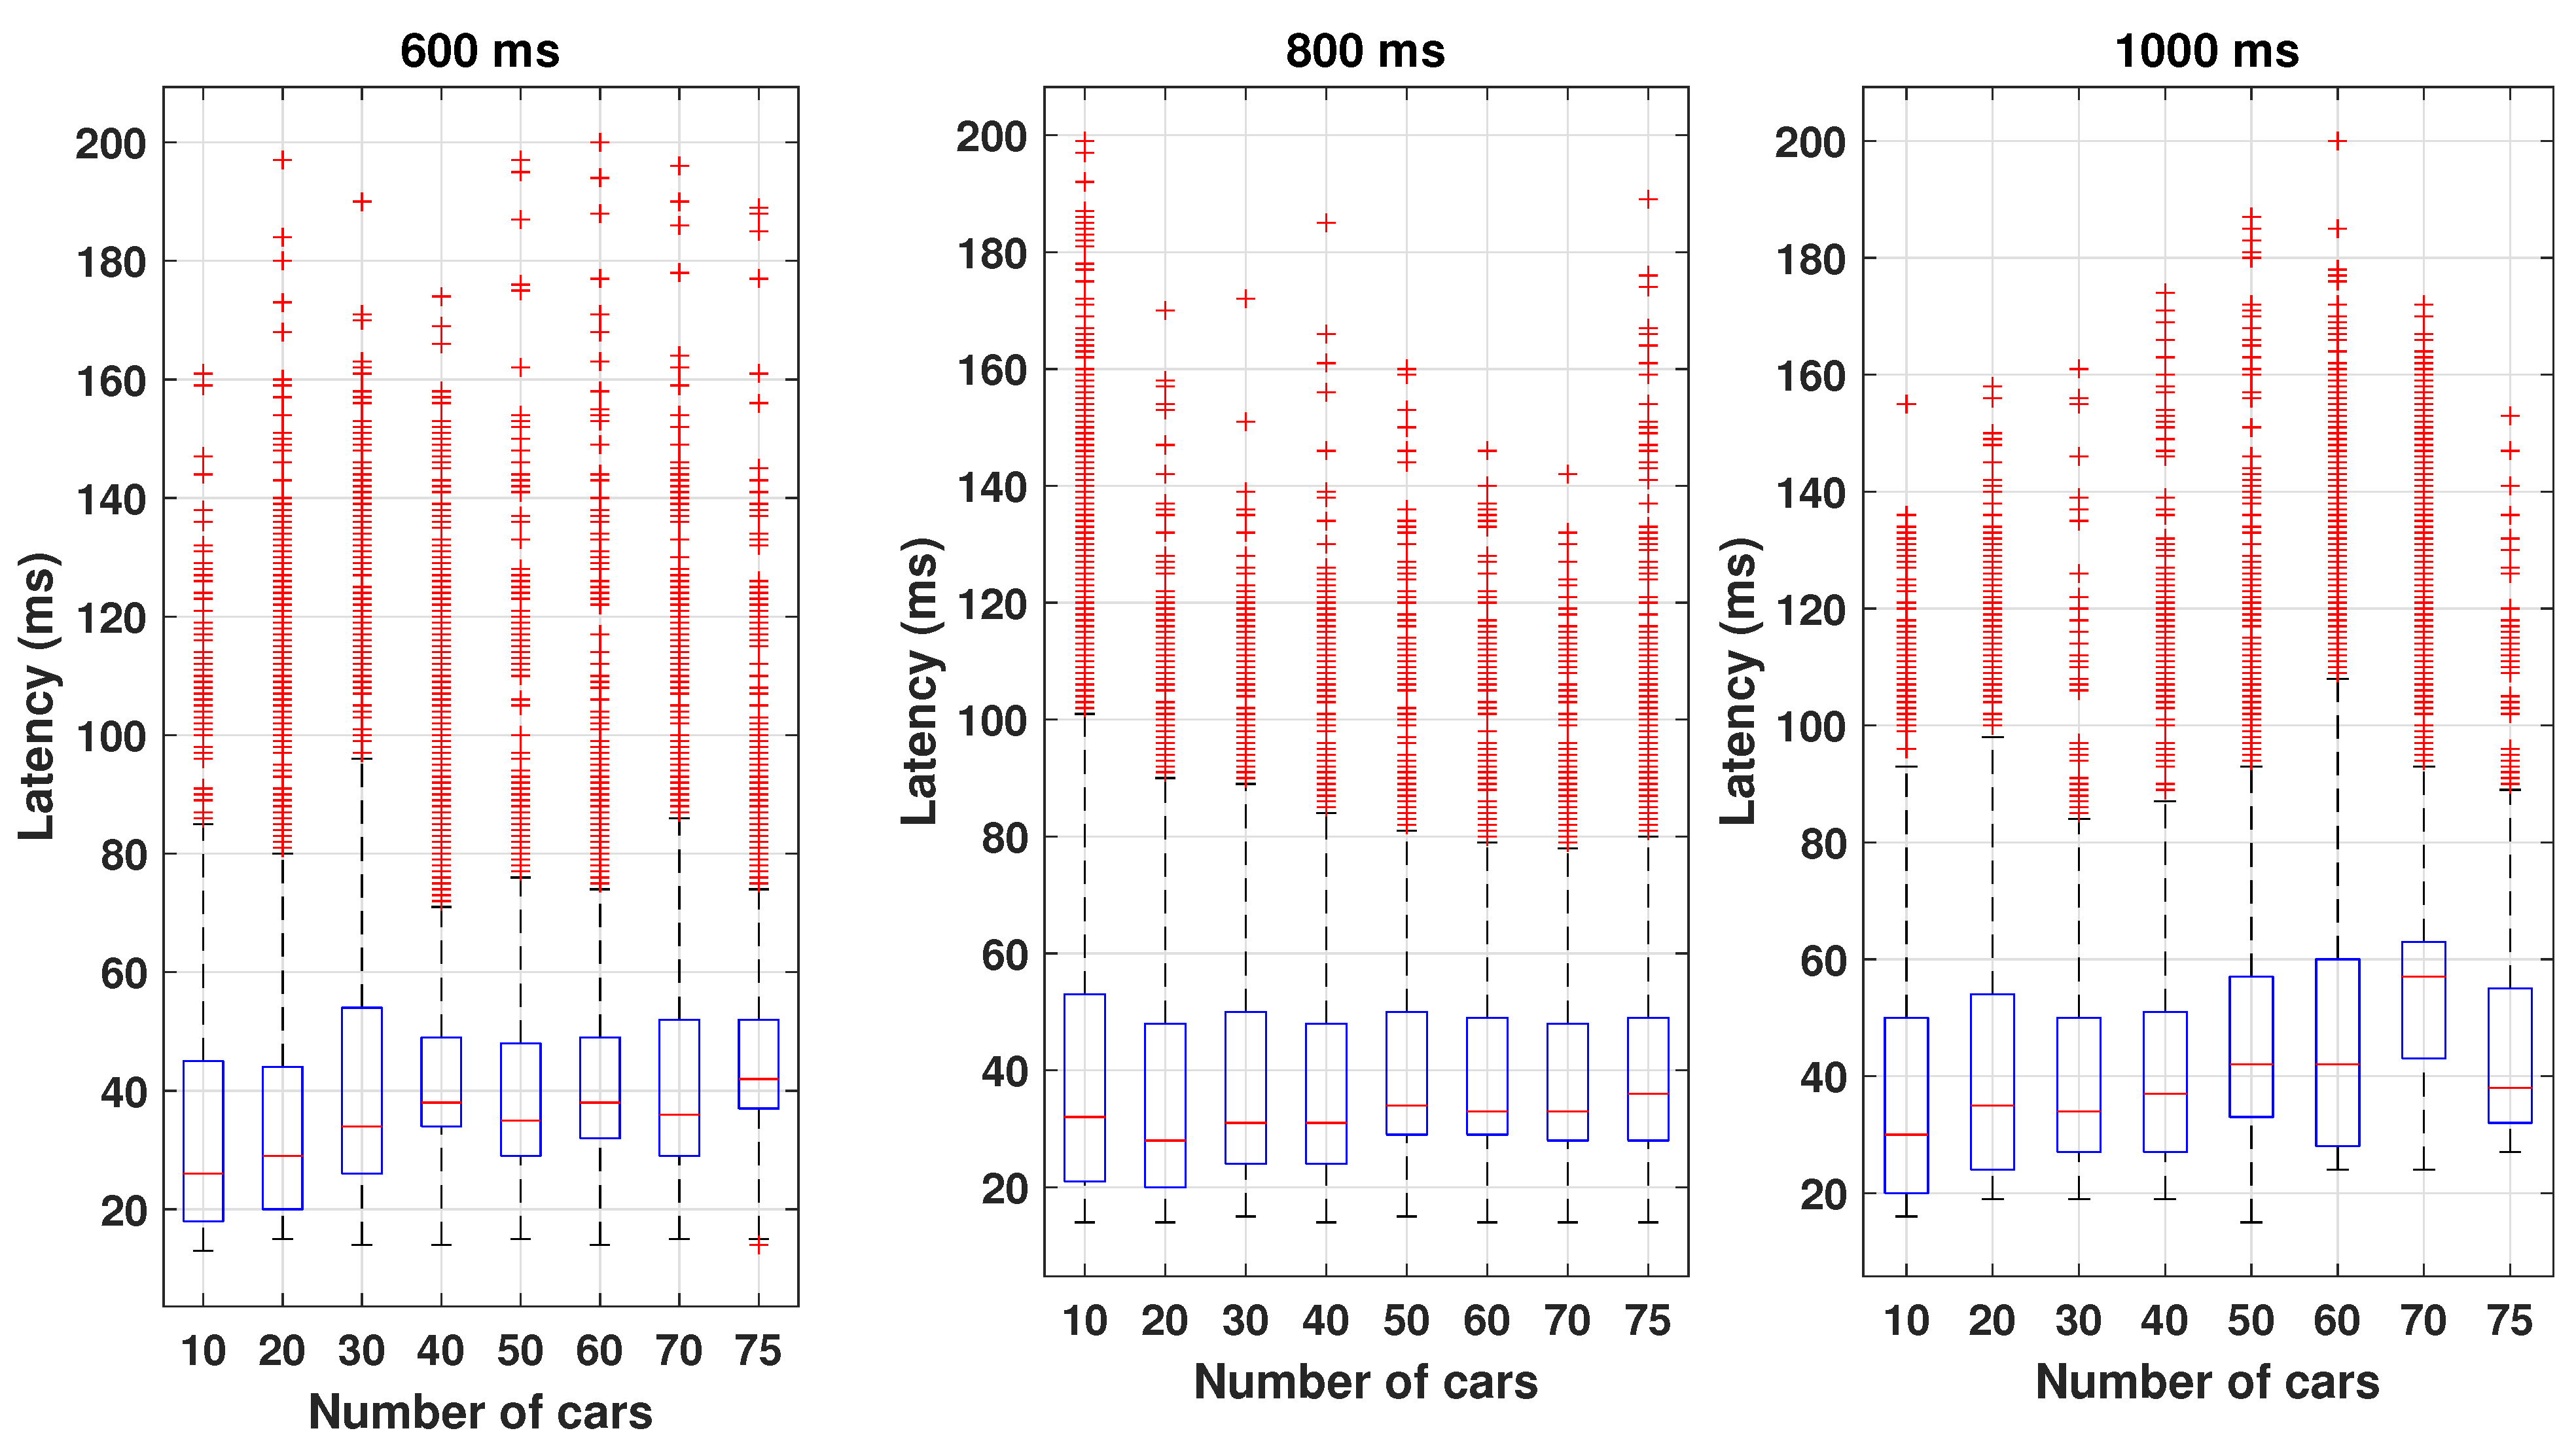
The overall system conceptualization is presented in
Figure 2. There are RSUs and OBUs in the C-ITS environment that communicate directly over ITS-G5 technology. Some of the RSUs in the system are equipped with road traffic sensors, such as cameras and radars, and these units are responsible for the generation and transmission of the Collective Perception Messages (CPMs) based on the raw data provided by the sensors. Inside the vehicles, a mobile app connected to the OBU via WiFi allows users to visualize the C-ITS messages received and transmitted by the station and to manually generate road alerts (Decentralized Environmental Notification Messages or DENMs).
To extend the communications range between RSUs, OBUs, and cloud C-ITS platforms, thus increasing the system’s availability and reliability, hybrid vehicular networks are employed by including cellular and/or cabled networks whenever possible. This way, C-ITS messages, in addition to being locally broadcast, can also be exchanged via a cloud MQTT broker, allowing the reception of these messages by OBUs that are outside the range of RSUs’ coverage. In addition, the cloud infrastructure can also host a C-ITS platform implemented via a Web Application that can monitor all messages exchanged in the vehicular environment through the MQTT broker and also send warning or information messages to the roadside infrastructure (via DENMs or Infrastructure to Vehicle Information Messages).
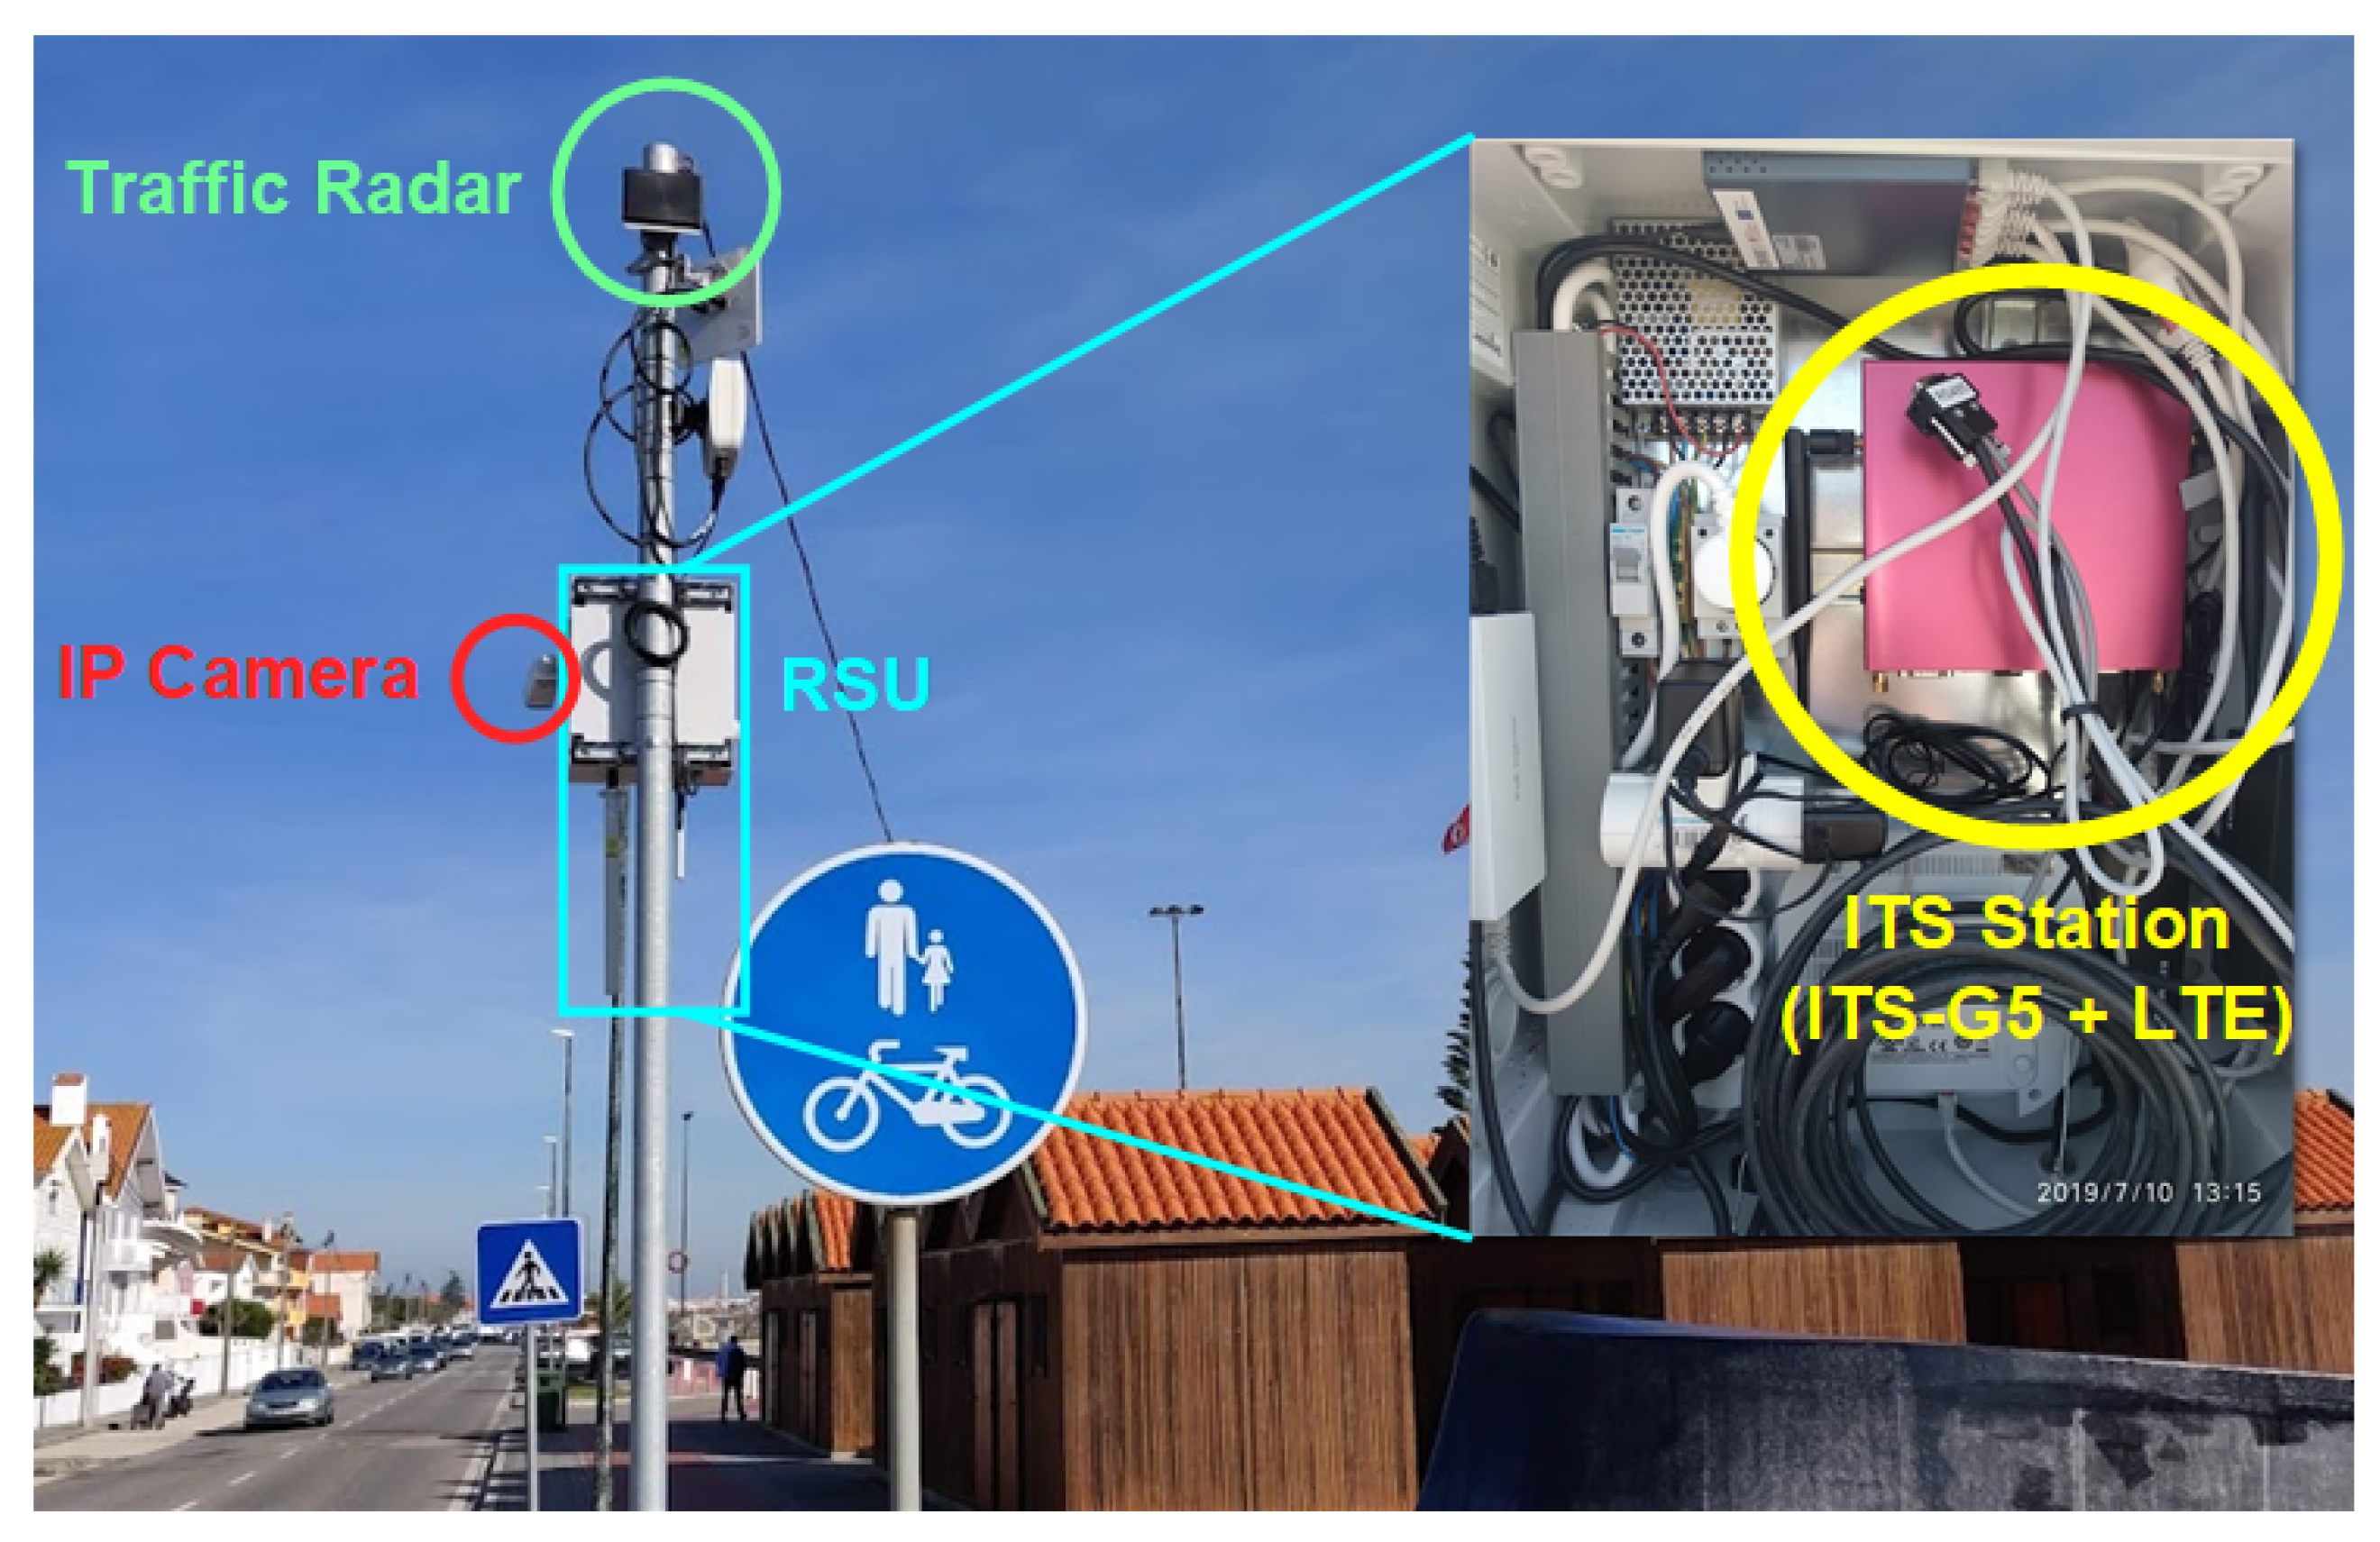
Depending on the installation location of the RSUs, these units can have different physical connection types (fiber optics or radio link) to connect to the broker. In addition, all RSUs have a cellular connection (4G, 5G) that adds some redundancy in case of connection failure. The IP camera does not contribute with any information to the CPM generation, but it is an important element to visually assure the synchronisation and veracity of the data produced by the radar and that is later reflected in the published messages.
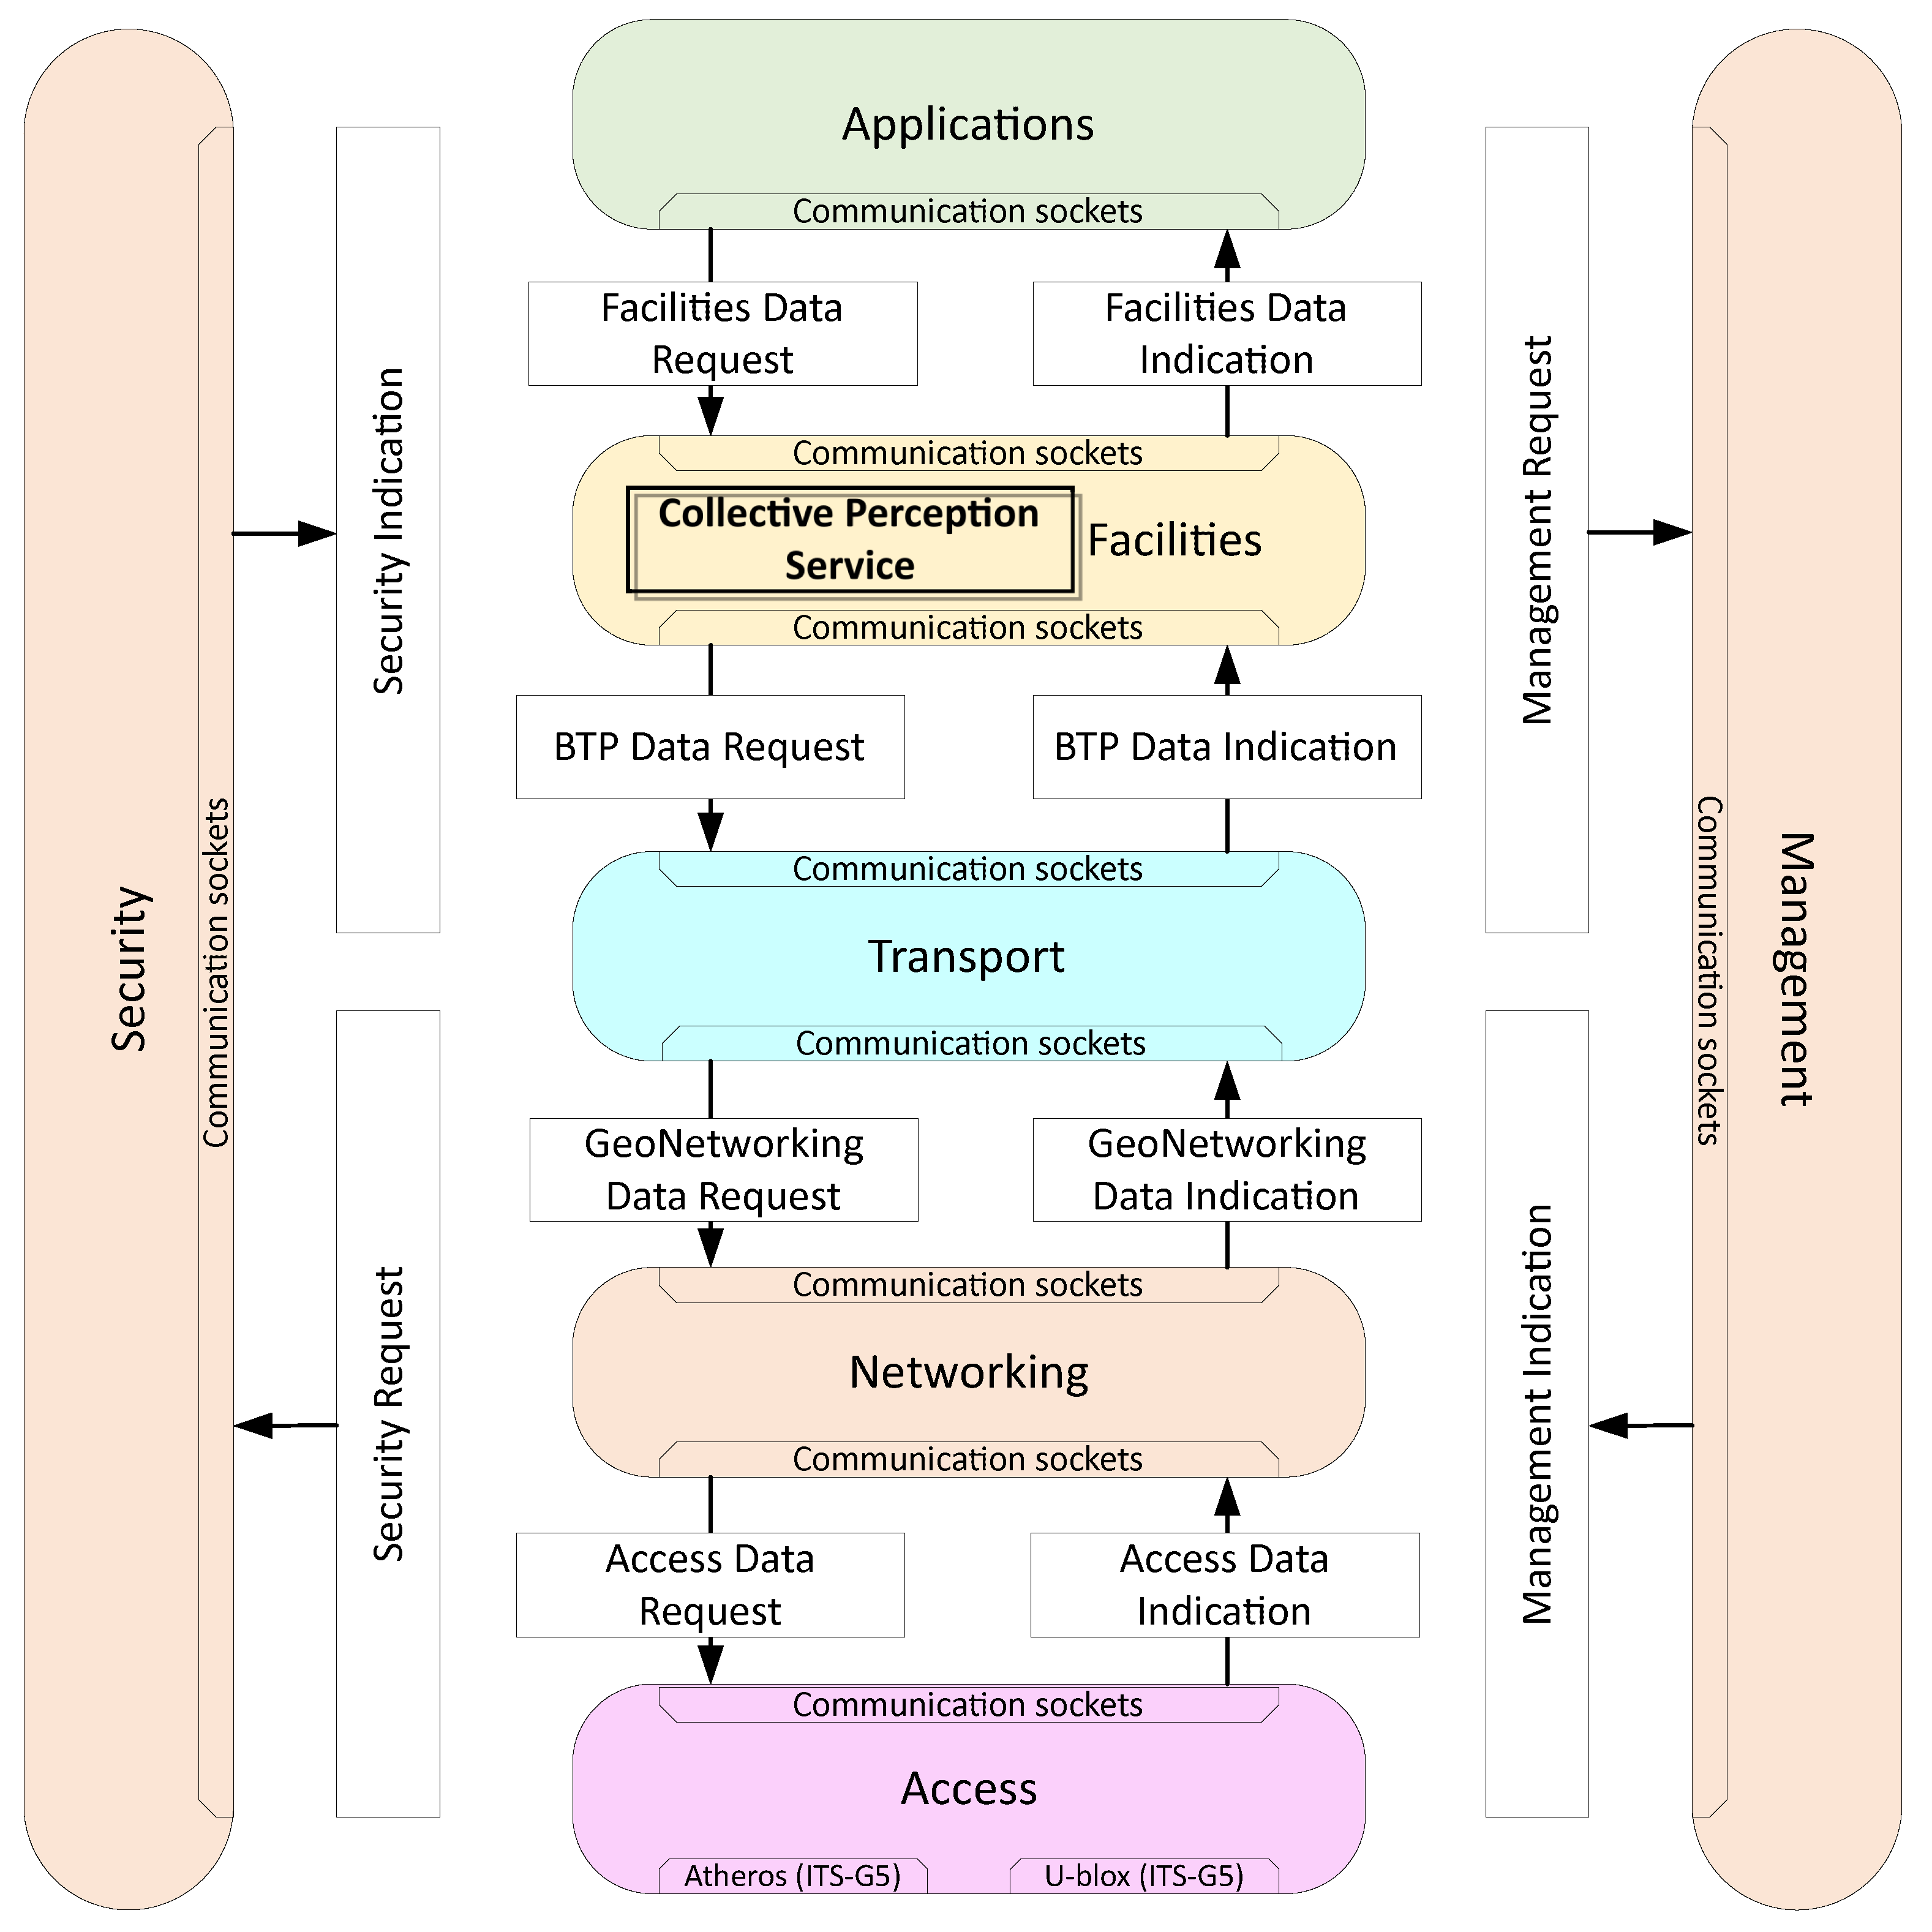
This work focuses on the main ITS-Ss in the vehicular communications environment: the RSU and the OBU. Although the RSU and OBU follow similar functional approaches, both ITS-Ss can be distinguished by some services and applications. The architecture used to implement the CPS is interoperable and stems from the work developed for the C-ROADS project [
17]. It is built by following the ETSI ITS-G5 protocol stack for vehicular communications, where layer organization, interfaces, and services are built upon the rules and requirements set by the ETSI standards (
Figure 3). The different layers are associated with different running services that communicate between them using specific Service Data Units (SDUs) that carry out encoded data to be delivered, treated, or managed by adjacent layers, making it easier to implement protocols, sub-services, applications, or access technologies. This level of modularity is achievable by the implementation of the Abstract Syntax Notation One (ASN.1) coding rules to build these SDUs.
All sub-services are related to protocols, authentication procedures, encapsulation and decapsulation packets, or even ITS basic services (present at the facilities layer such as the cooperative awareness basic service):
Access service manages the access technologies of the ITS-S and is responsible for decapping and encapping the lower layers’ protocol headers such as the MAC and the LLC of the packets.
Networking service mainly holds the GeoNetworking protocol header encapsulation and decapsulation.
Transport service implements the Basic Transport Protocol (BTP) that provides the port numbers to address the upper layer services and is responsible for processing the BTP header.
Facilities service holds various sub-services: the Collectve Perception Service (CAS), the Decentralized Environmental Notification (DEN) basic service, the Infrastructure to vehicle Information (IVI) basic service, and the CPS. All these sub-services provide support for the corresponding messages that are consumed by the ITS applications.
Security service aims to provide packet authenticity and trust management. It processes and verifies the secured header of the GeoNetworking packets and triggers local identity changes across layers for privacy purposes.
Management service provides time and GPS coordinates for the requesting services. It also manages the transmitting power in the access service to minimize harmful interference between ITS-Ss.
Applications service is responsible for the interconnection with the C-ITS cloud platform by means of an MQTT broker for ITS message forwarding and system monitoring. It is also responsible for the message exchange and communications link with the mobile phone application in the case of the OBU devices.
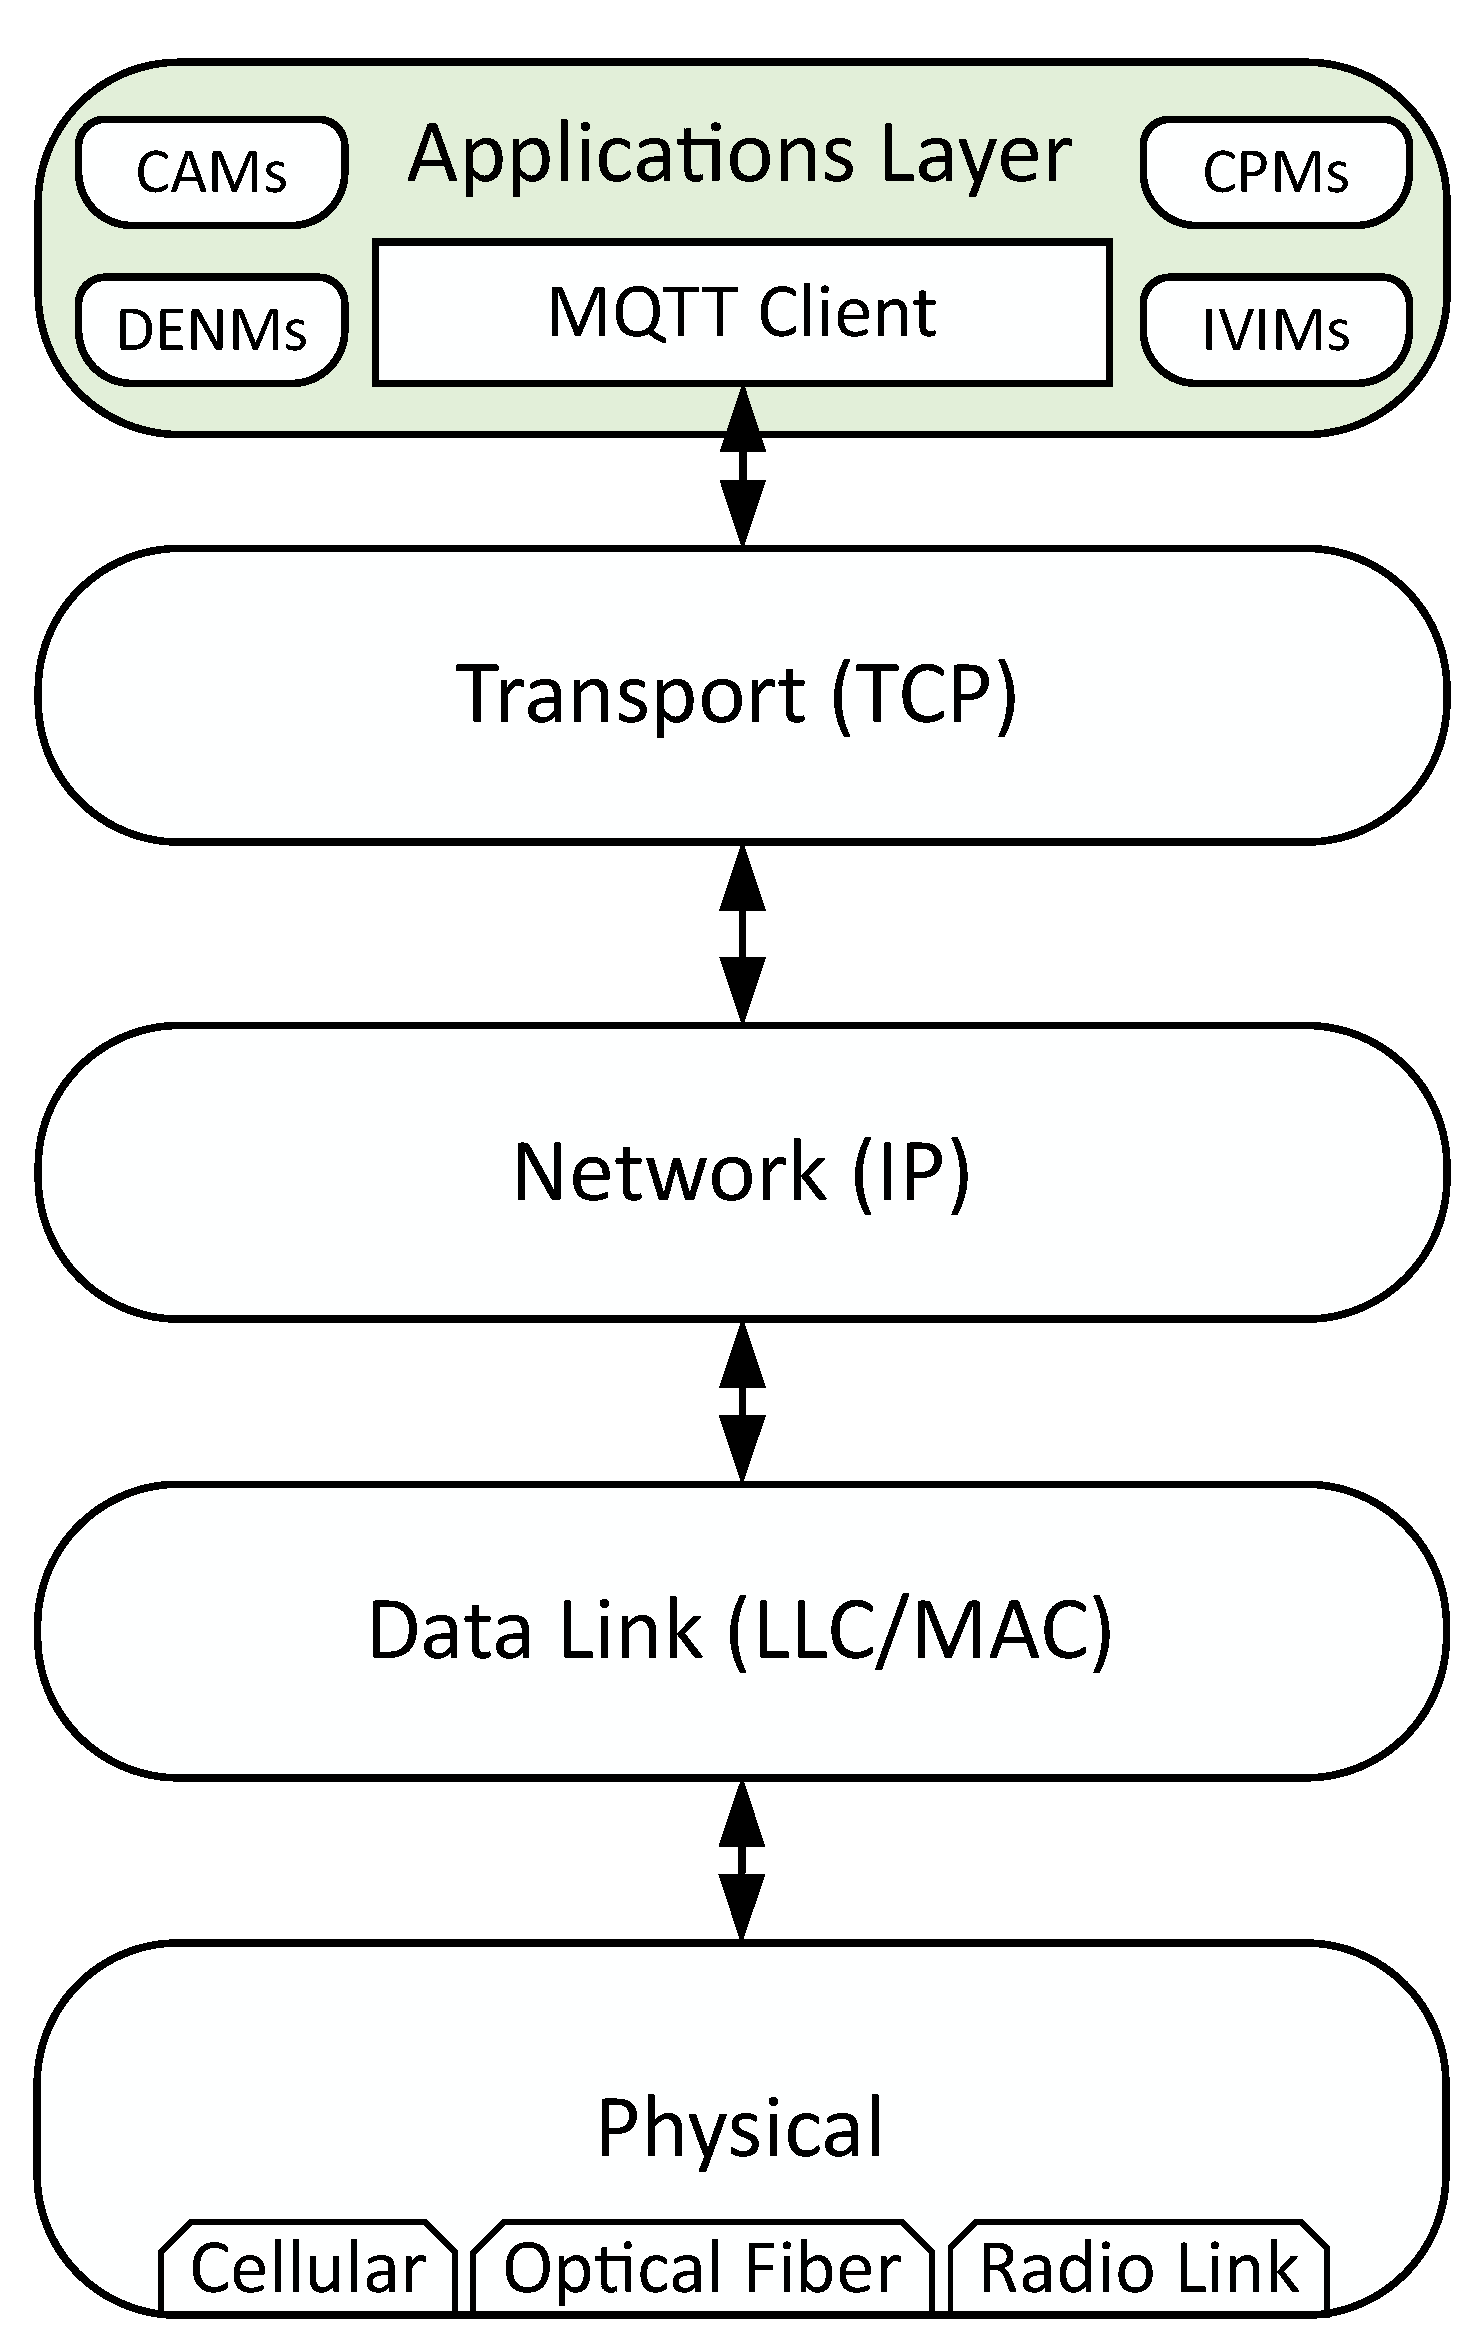
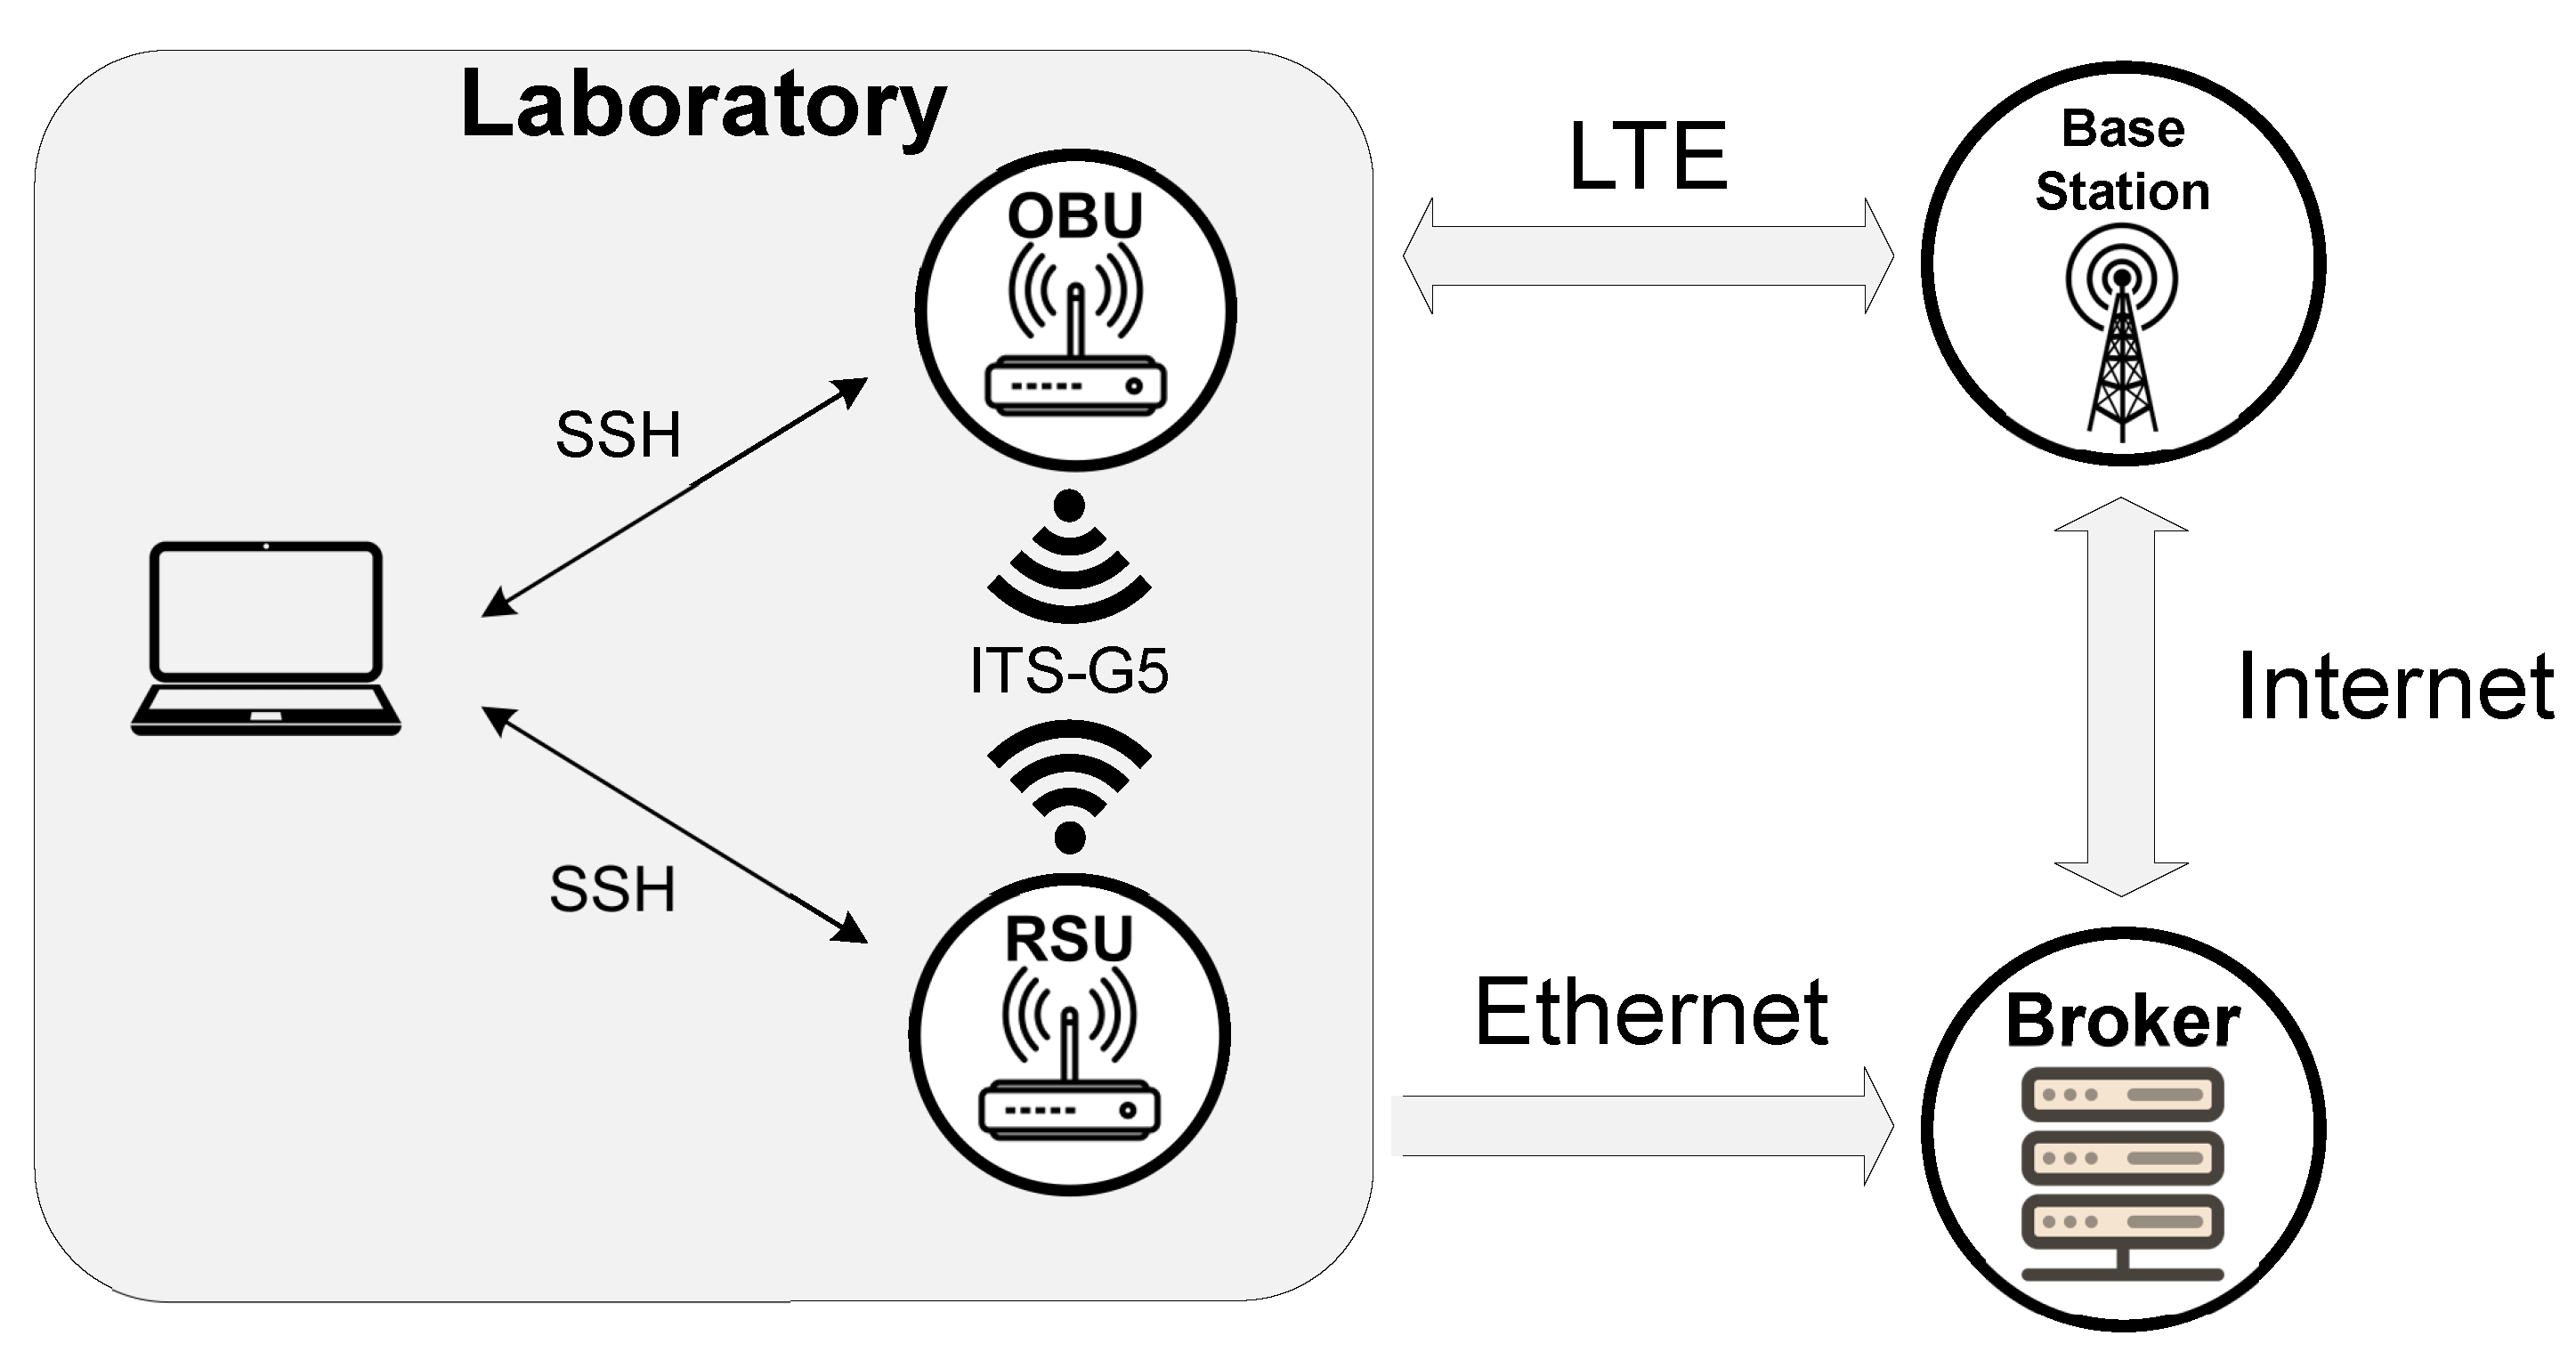
The communication with the cloud platform in our solution employs the protocol stack presented in
Figure 4. In this case, the exchange of data is accomplished over cellular networks (LTE/5G), optical fiber, or radio links, which is more appropriate to follow the common Internet protocol stack based on standard TCP/IP connections to transmit and receive the MQTT packets that embody the C-ITS messages at the applications layer, i.e., CAMs, DENMs, CPMs.
Figure 4 depicts the protocol stack involved in the transmission and reception of these messages by the RSU and OBU platforms through the cloud MQTT broker.
MQTT is a lightweight publish/subscribe protocol that is intended to provide an alternative to the client/server approach. Instead of communicating directly, the publisher and subscriber establish a connection between a “middle-man” called the MQTT broker that filters the incoming messages and distributes them to the correct subscribers. This is achieved by clients subscribing to specific topics of their interest that they can publish and/or subscribe without the need for topic configuration. In the case of the ITS framework, these topics could be related to a geographic location or a specific ITS-S ID. The protocol also supports different Quality of Service (QoS) levels that define how reliable the connection between the broker and the clients must be, with the downside of higher latency and bandwidth values.
The cloud platform holds the MQTT broker that serves as a communication bridge between, for example, an RSU and the central office. The RSU publishes the ITS messages it transmits, as well as the ones that it receives through ITS-G5 from other ITS-Ss. The RSU also transmits periodical heartbeat messages, which include summarized information about the current operating status, such as CPU and memory usage, IP address, and the number of active ITS events under the coverage area. From the central office, it is also possible to manually trigger event messages such as Decentralized Environmental Notification Messages (DENMs) and Infrastructure to Vehicle Information Messages (IVIMs) that can be disseminated by certain RSUs based on a geographic-based topic system implemented in the MQTT broker.
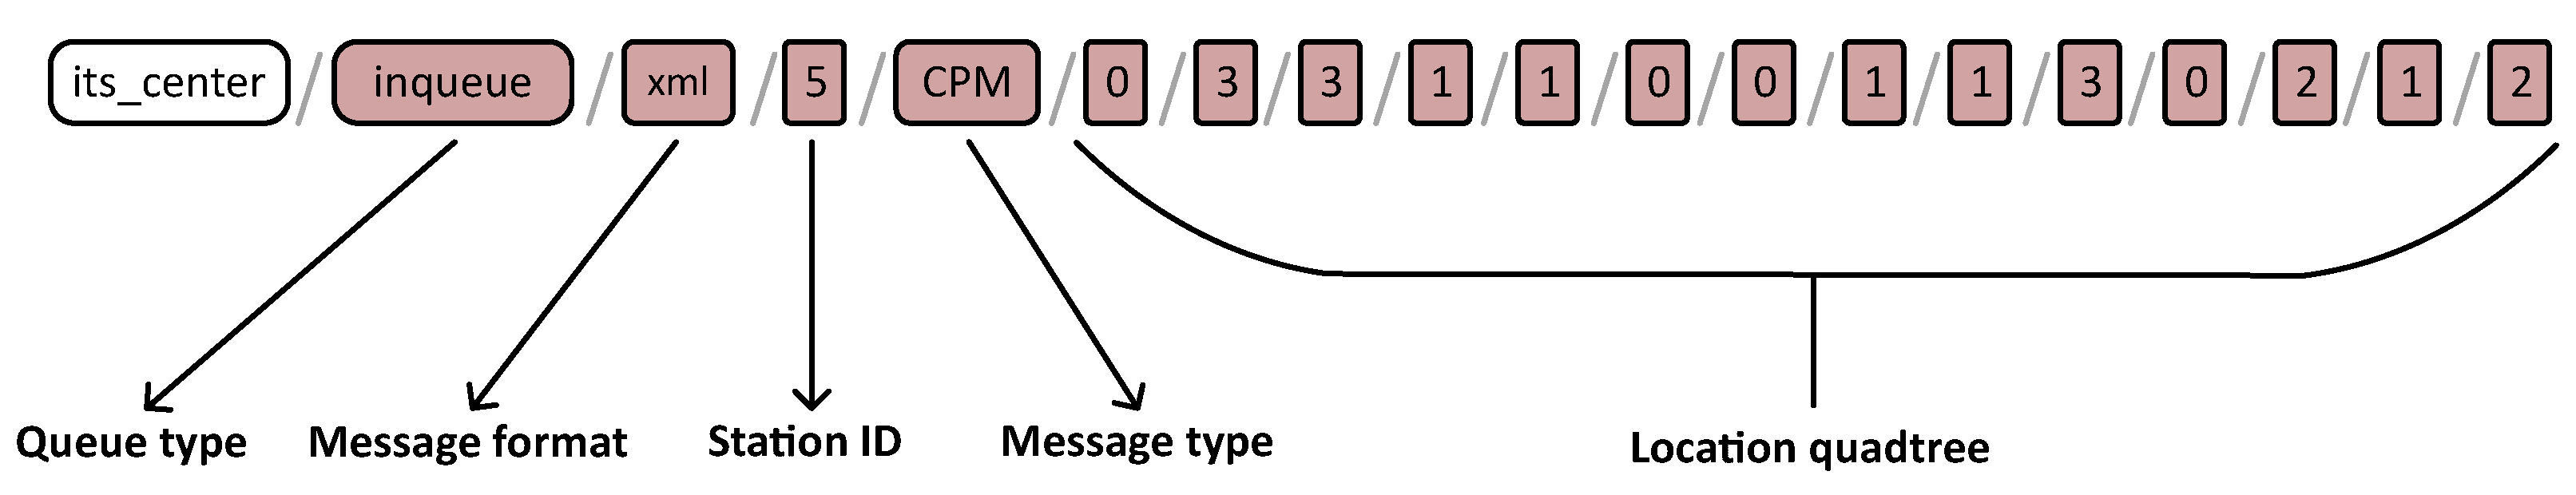
Figure 5 represents an example of a possible hierarchical structure of these topics:
Queue type indicates the message destination agent. It can acquire two values: inqueue for messages published by RSUs or outqueue for messages published by the central office.
Message format indicates the message encoding type that could be binary, JSON, or XML.
Station ID indicates the ITS-S identification number.
Message type indicates the ITS messages types.
Location quadtree indicates the geographical location of an RSU following a quadtree map system representation.
The quadtree map system representation follows a tree data structure (tiling scheme) in which the children and parent nodes represent regions of the world map. The map is recursively subdivided into four quadrants, allowing different precision/zoom levels depending on the number of times the map has been divided. This approach is also suitable for topic creation on the MQTT broker since the quadrants could be enumerated and a certain region could be specified by a sequence of numbers. Looking at the MQTT topic from
Figure 5, it is possible to see that the location quadtree field of the RSU has a zoom level of 14, although if the central office wished to disseminate a message within a 20 km radius from this station (for example), the zoom level could be reduced to 13, as long as the RSU is subscribed to the outqueue topic of the central office.
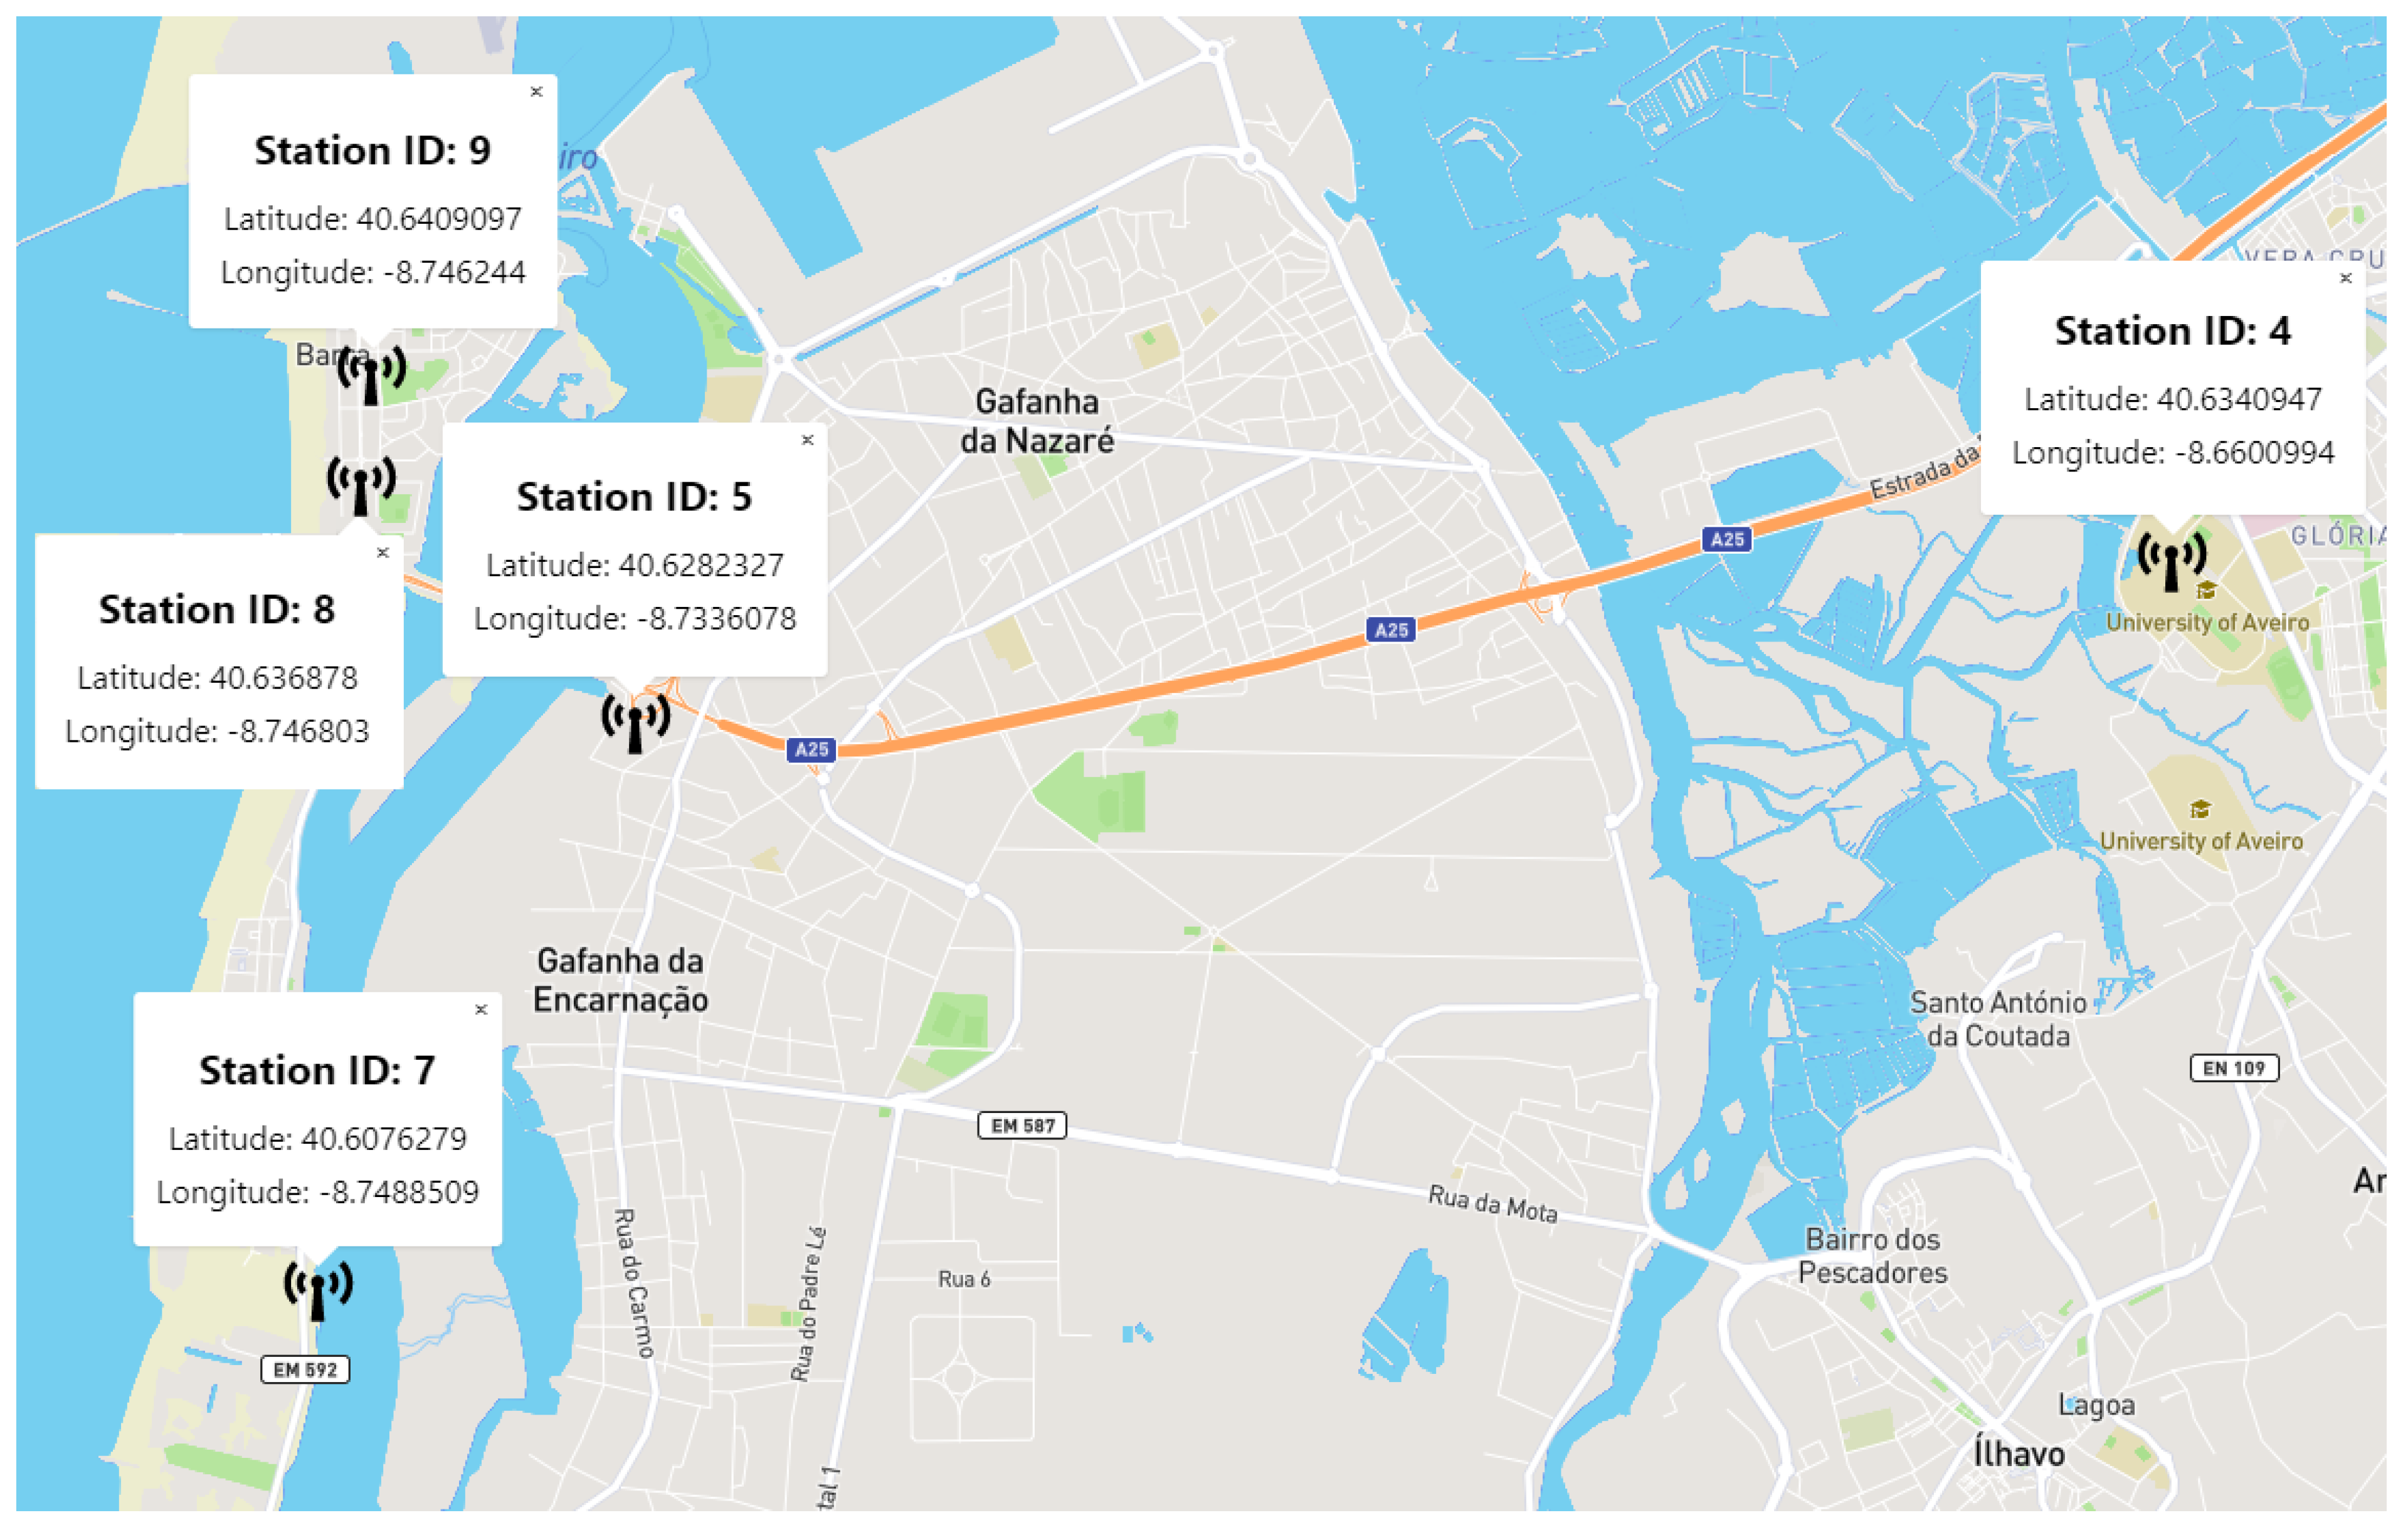
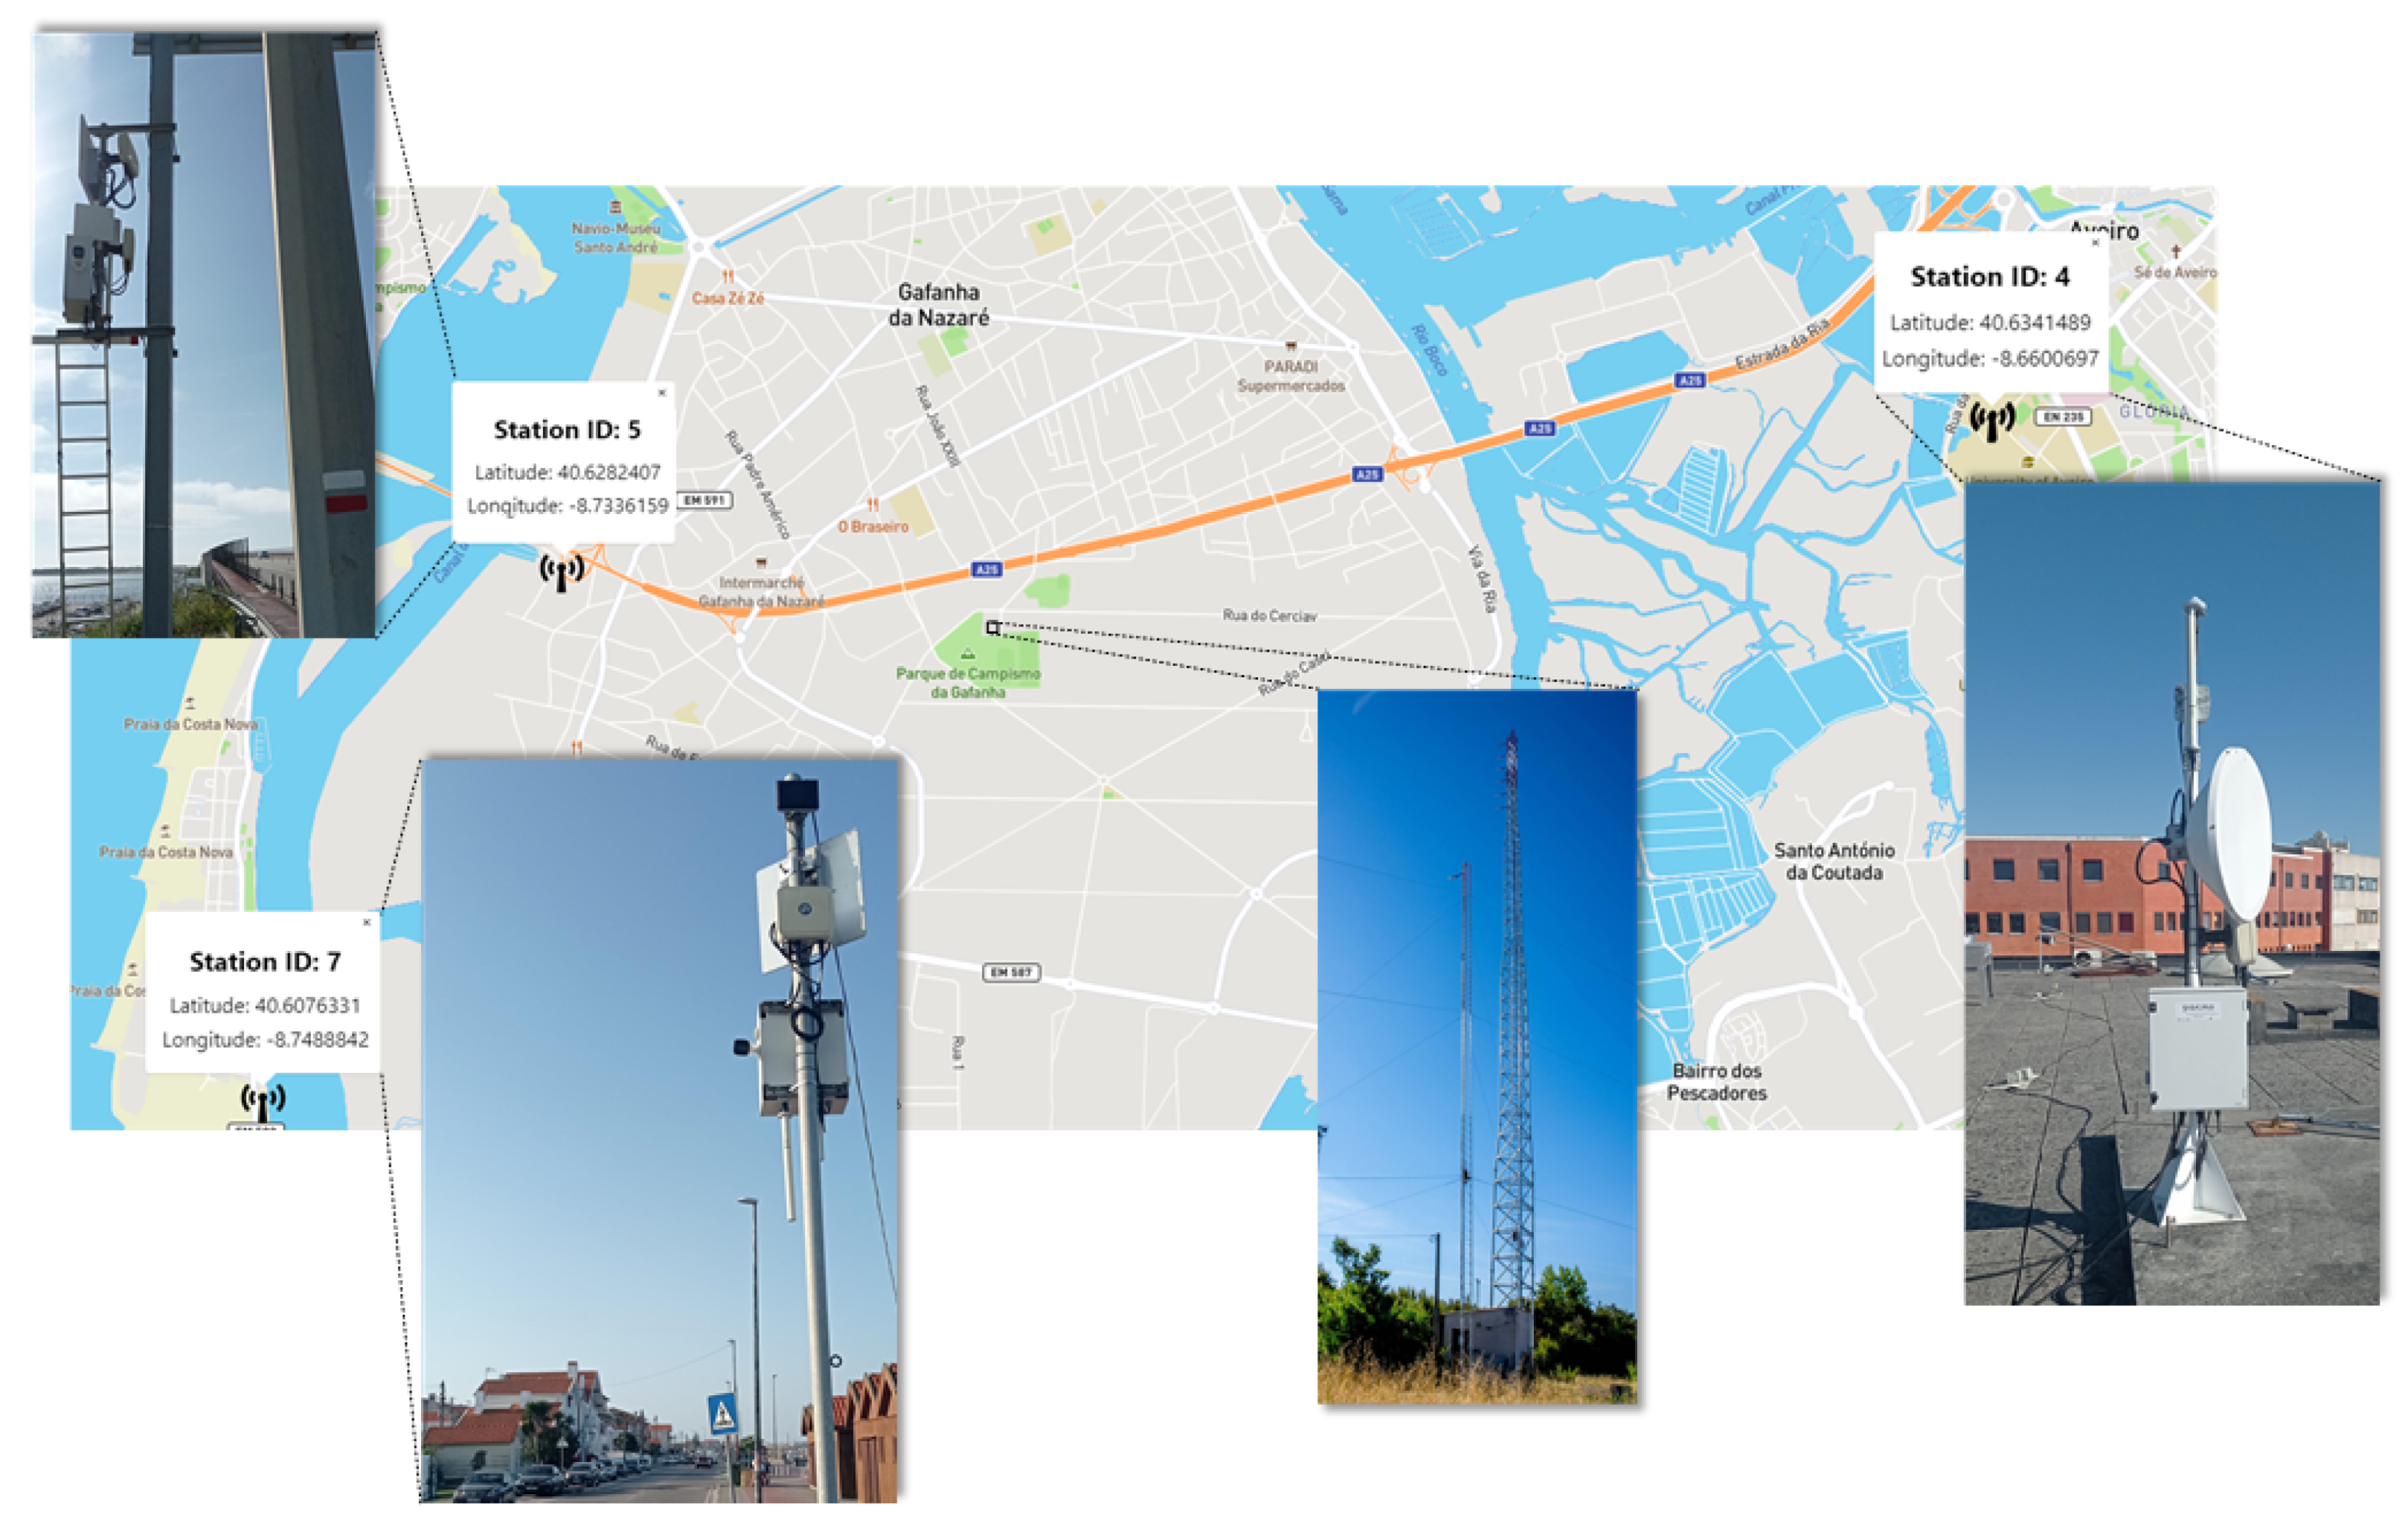
From the central office, the messages produced by the RSUs as well as their current status can be visualized in a Web-based dashboard. The dashboard interprets the messages from the cloud MQTT broker and allows for the traffic management operator to graphically visualize their dissemination location. It also offers a way of generating road traffic events in a user-friendly manner, which will be disseminated in to the area of interest through the outqueue topic of the MQTT broker. In addition, the dashboard (
Figure 6), by making use of the hearbeat messages, allows the visualisation of the geographical location in the map of the system RSUs that are distributed along the Portuguese highway A25 and the coastal beaches of the Aveiro region in Portugal.
From the OBU perspective, the same architecture is used (
Figure 3), with a slightly different approach for ITS message generation. A mobile application, developed by IT and A-to-Be [
18], is connected via a wireless access point to the OBU, which runs a local self-hosted MQTT broker. The mobile application serves as a Human Machine Interface (HMI), allowing the generation and visualisation of events. These are received in the OBU from the cloud MQTT broker using ITS-G5 or cellular communications and redirected to the local broker to be visualized in the mobile application.
3.2. Implementation
As discussed, this work focuses on implementing the two types of ITS-Ss that will benefit from the CPS. The IT2S Platform provides the modularity and portability necessary to support the ETSI ITS-G5 protocol stack and all its requirements. This platform (
Figure 7) is built upon apu3 boards that offer 2 mPCIE and 1 mSATA slots for expansion modules. The IT2S platform encompasses several modules attached to the system board, namely the SSD, WiFi (Compex WLE200NX), and LTE (Huawei ME909s-120) module with the respective USIM card. A pair of antennas for each communication module is also included. In order to have control over the system kernel and hardware, an Arch Linux distribution image is installed in the platform providing support and access to several tools and patches, allowing IEEE 802.11p communications with wireless cards (e.g., Compex WLE200NX) that, by default, do not support IEEE 802.11p channel and power requirements. The Atheros AR9280 chip (used by the WiFi module) is supported by the kernel driver ath9k, which allows further configurations to operate within the 5.9 GHz frequency band, with 10 MHz channels and Outside the Context of a BSS (OCB) mode required by the ITS-G5 technology.
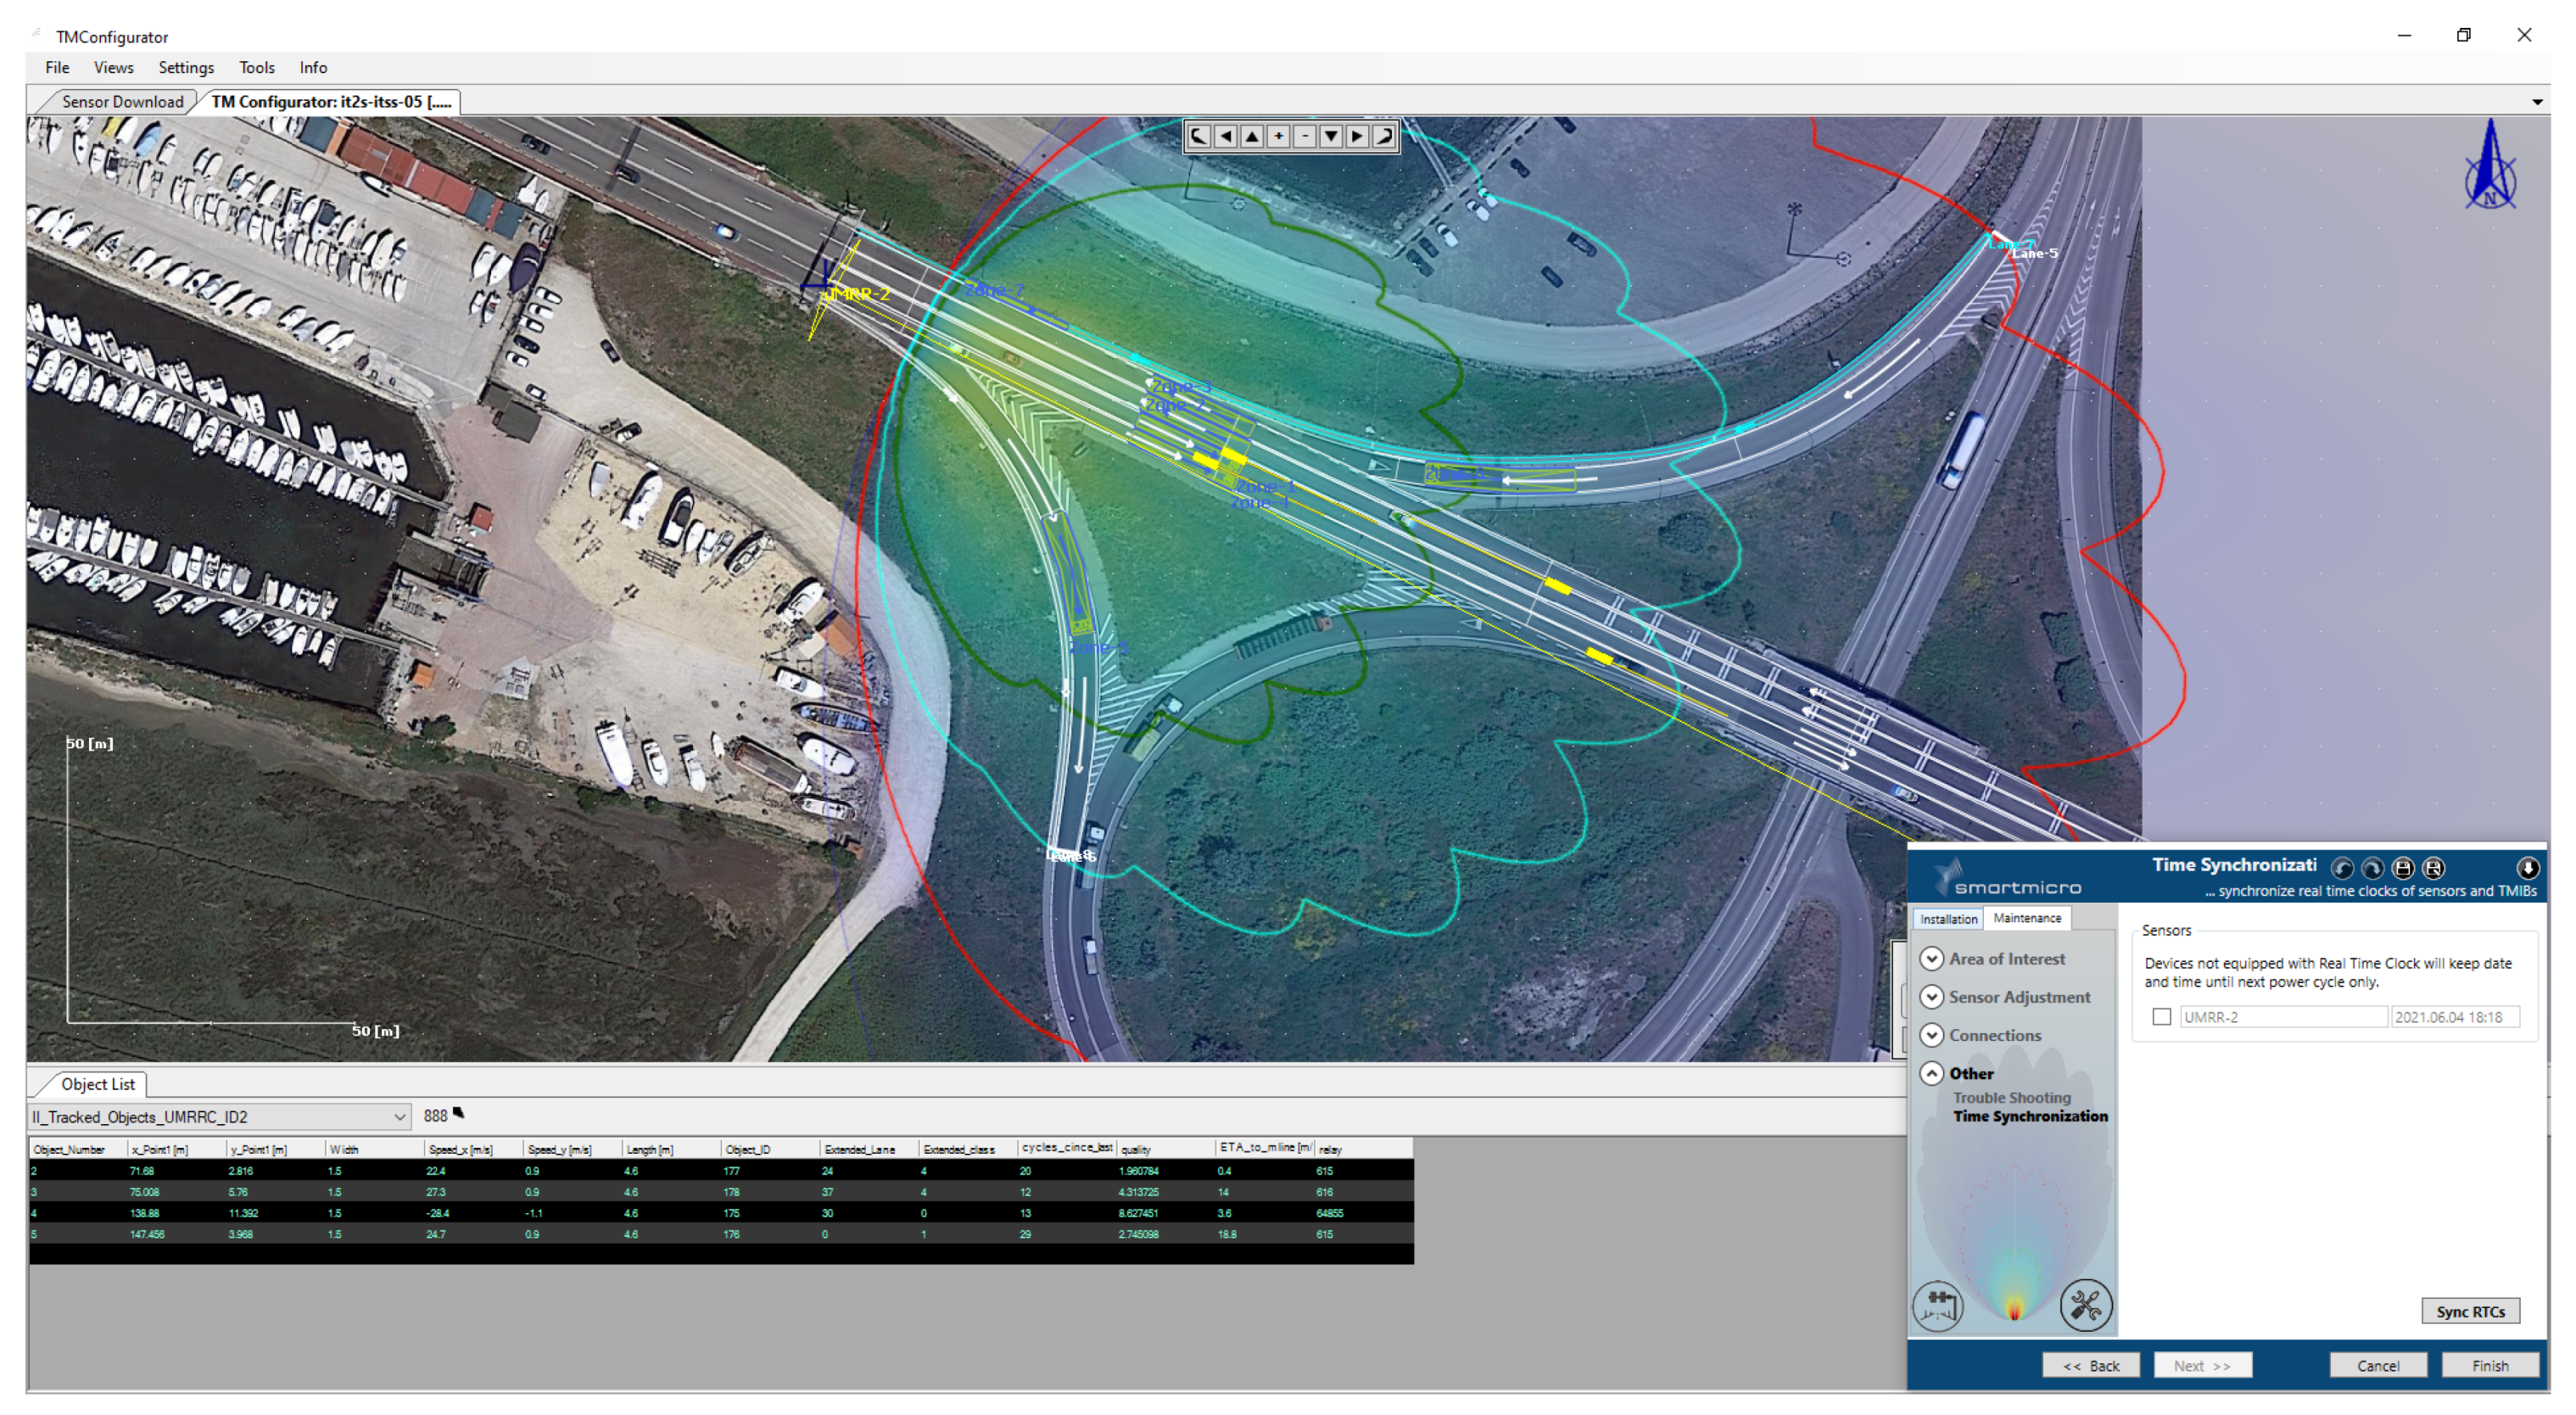
The IT2S platform also attaches a traffic classification radar that retrieves the range, angle and information about the radial speed of moving targets. The Smartmicro UMRR-0C Type 42 radar can track up to 126 targets and is connected to the RSU by an Ethernet cable. The radar can be configured via a Windows-based software named Traffic Management Configurator (TMC) that also allows the monitoring and logging of all the Smartmicro’s UMRR sensors.
Figure 8 shows a screenshot of this software with the localization of one of the RSUs that is installed in the A25 highway (Station ID:5 in
Figure 6).
For the radar to start transmitting data, it is mandatory that a Transmission Control Protocol (TCP) session is established with the Traffic Management Configurator. To achieve this, the information exchanged between the radar and the IT2S platform Ethernet interface connected to the radar must arrive to a Windows machine running the TMC in a central office. Alternatively, it is also possible to run the traffic detection software in standalone mode only between the RSU and the radar. For this purpose,
Figure 9 illustrates two possible configurations: on the left side, the RSU reads and forwards the data to the remote machine where the TMC software is running, and on the right side, the RSU reads the radar data and composes the CPM messages without the need to have the TMC software running in any machine. The latter configuration is important when the number of RSUs scales.
For the first case, in order for the RSU to be able to forward packets, the Linux iptables utility is used. By creating a set of rules exclusive to the packets coming from the radar, it is possible to forward and masquerade them to the Windows machine, “fooling” the radar into thinking that it is communicating directly with the TMC software. This connection to the remote machine can be established through a direct radio link connection or via VPN over commercial fiber optics. In the second case, the CPS running in the RSU is in charge of creating a TCP interface that communicates with the radar as well as a raw interface that reads all data coming from the radar. This way, the Traffic Management Configurator is only used when it is necessary to configure, update, or directly visualize the radar status, avoiding the need to keep a Windows-based PC running TMC constantly.
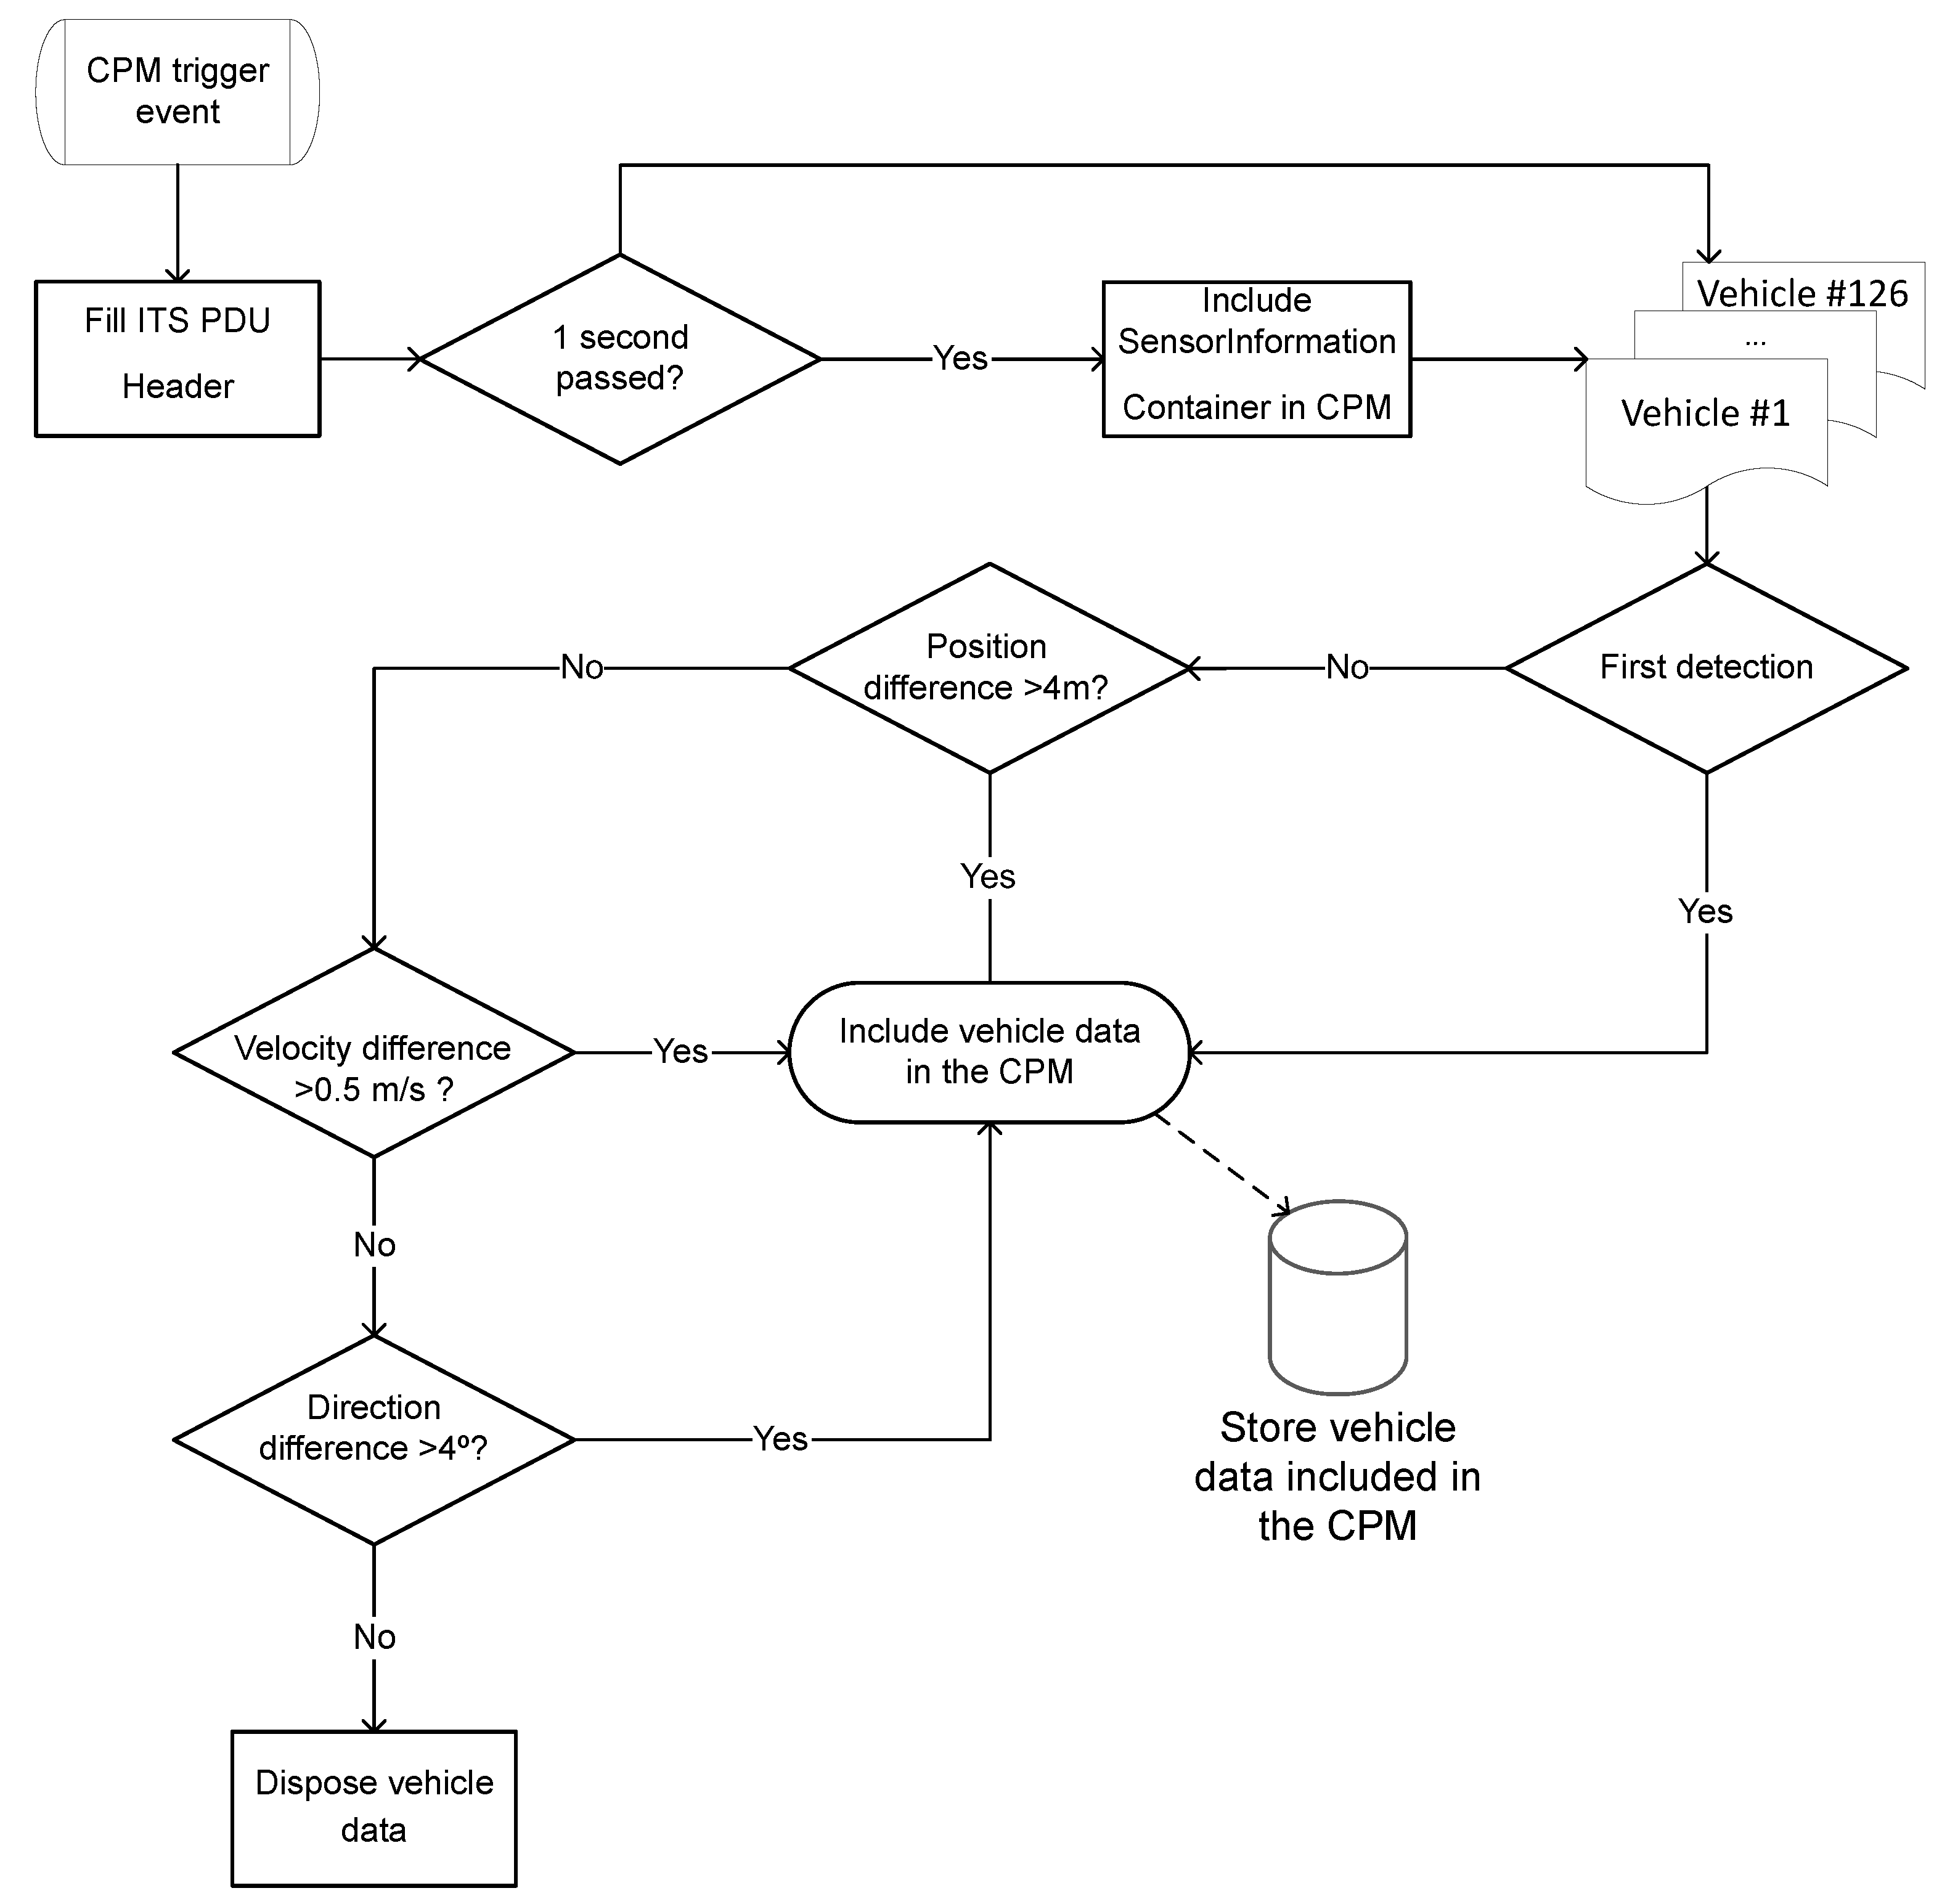
In addition to the maximum and minimum values for CPM generation frequency, the standard [
3] also defines some rules to prevent channel overload and avoid the redundancy of some objects. The principle is to include the most static objects less often and the most dynamic ones more often. Currently, the only criterion is either to include or not an object into a CPM, since the UMRR-0C does not provide all the information required to classify the objects or to calculate the free space confidence between the object and the ITS-S. Taking this into consideration, some frequency management rules were applied regarding the perceived object and sensor information inclusion in the CPM dissemination process (
Figure 10):
For the sensor inclusion information, the CPM shall include the Sensor Information Container whenever the time elapsed since the last similar CPM (including this information) is greater or equal to 1000 ms.
For the perceived object information, an object should be included in a CPM if:
- –
It has first been detected by the radar after the last CPM generation event;
- –
The absolute Euclidean distance between the current and last estimated position (of the reference point) of the object included in a CPM exceeds 4 m;
- –
The difference between the current and last estimated absolute speed (of the reference point) of the object included in a CPM exceeds 0.5 m per second;
- –
The difference between the orientation vector of the current and last estimated absolute velocity (of the reference point) of the object included in a CPM exceeds 4 degrees;
- –
The time elapsed since the last time the object was included in a CPM exceeds 1000 ms.
When operating as an OBU, a local broker is created in the IT2S platform, enabling it to communicate with the mobile application via WiFi. This is achievable by creating a wireless access point based on the hostapd Linux utility. Moreover, for the OBU to receive data from a specific area of interest beyond ITS-G5 range, the OBU subscribes to the topic where it is located based on its GNSS coordinates, as well as to all the adjacent topics calculated according to the previously described quadtree tiling scheme. Subsequently, all received messages are published to the local MQTT broker, being available for visualization in the mobile App. With this feature, it is also possible to disseminate CAMs and DENMs (these last ones generated in the mobile application by the vehicle users) via ITS-G5 and through the cloud MQTT broker, providing the road operator with important information.
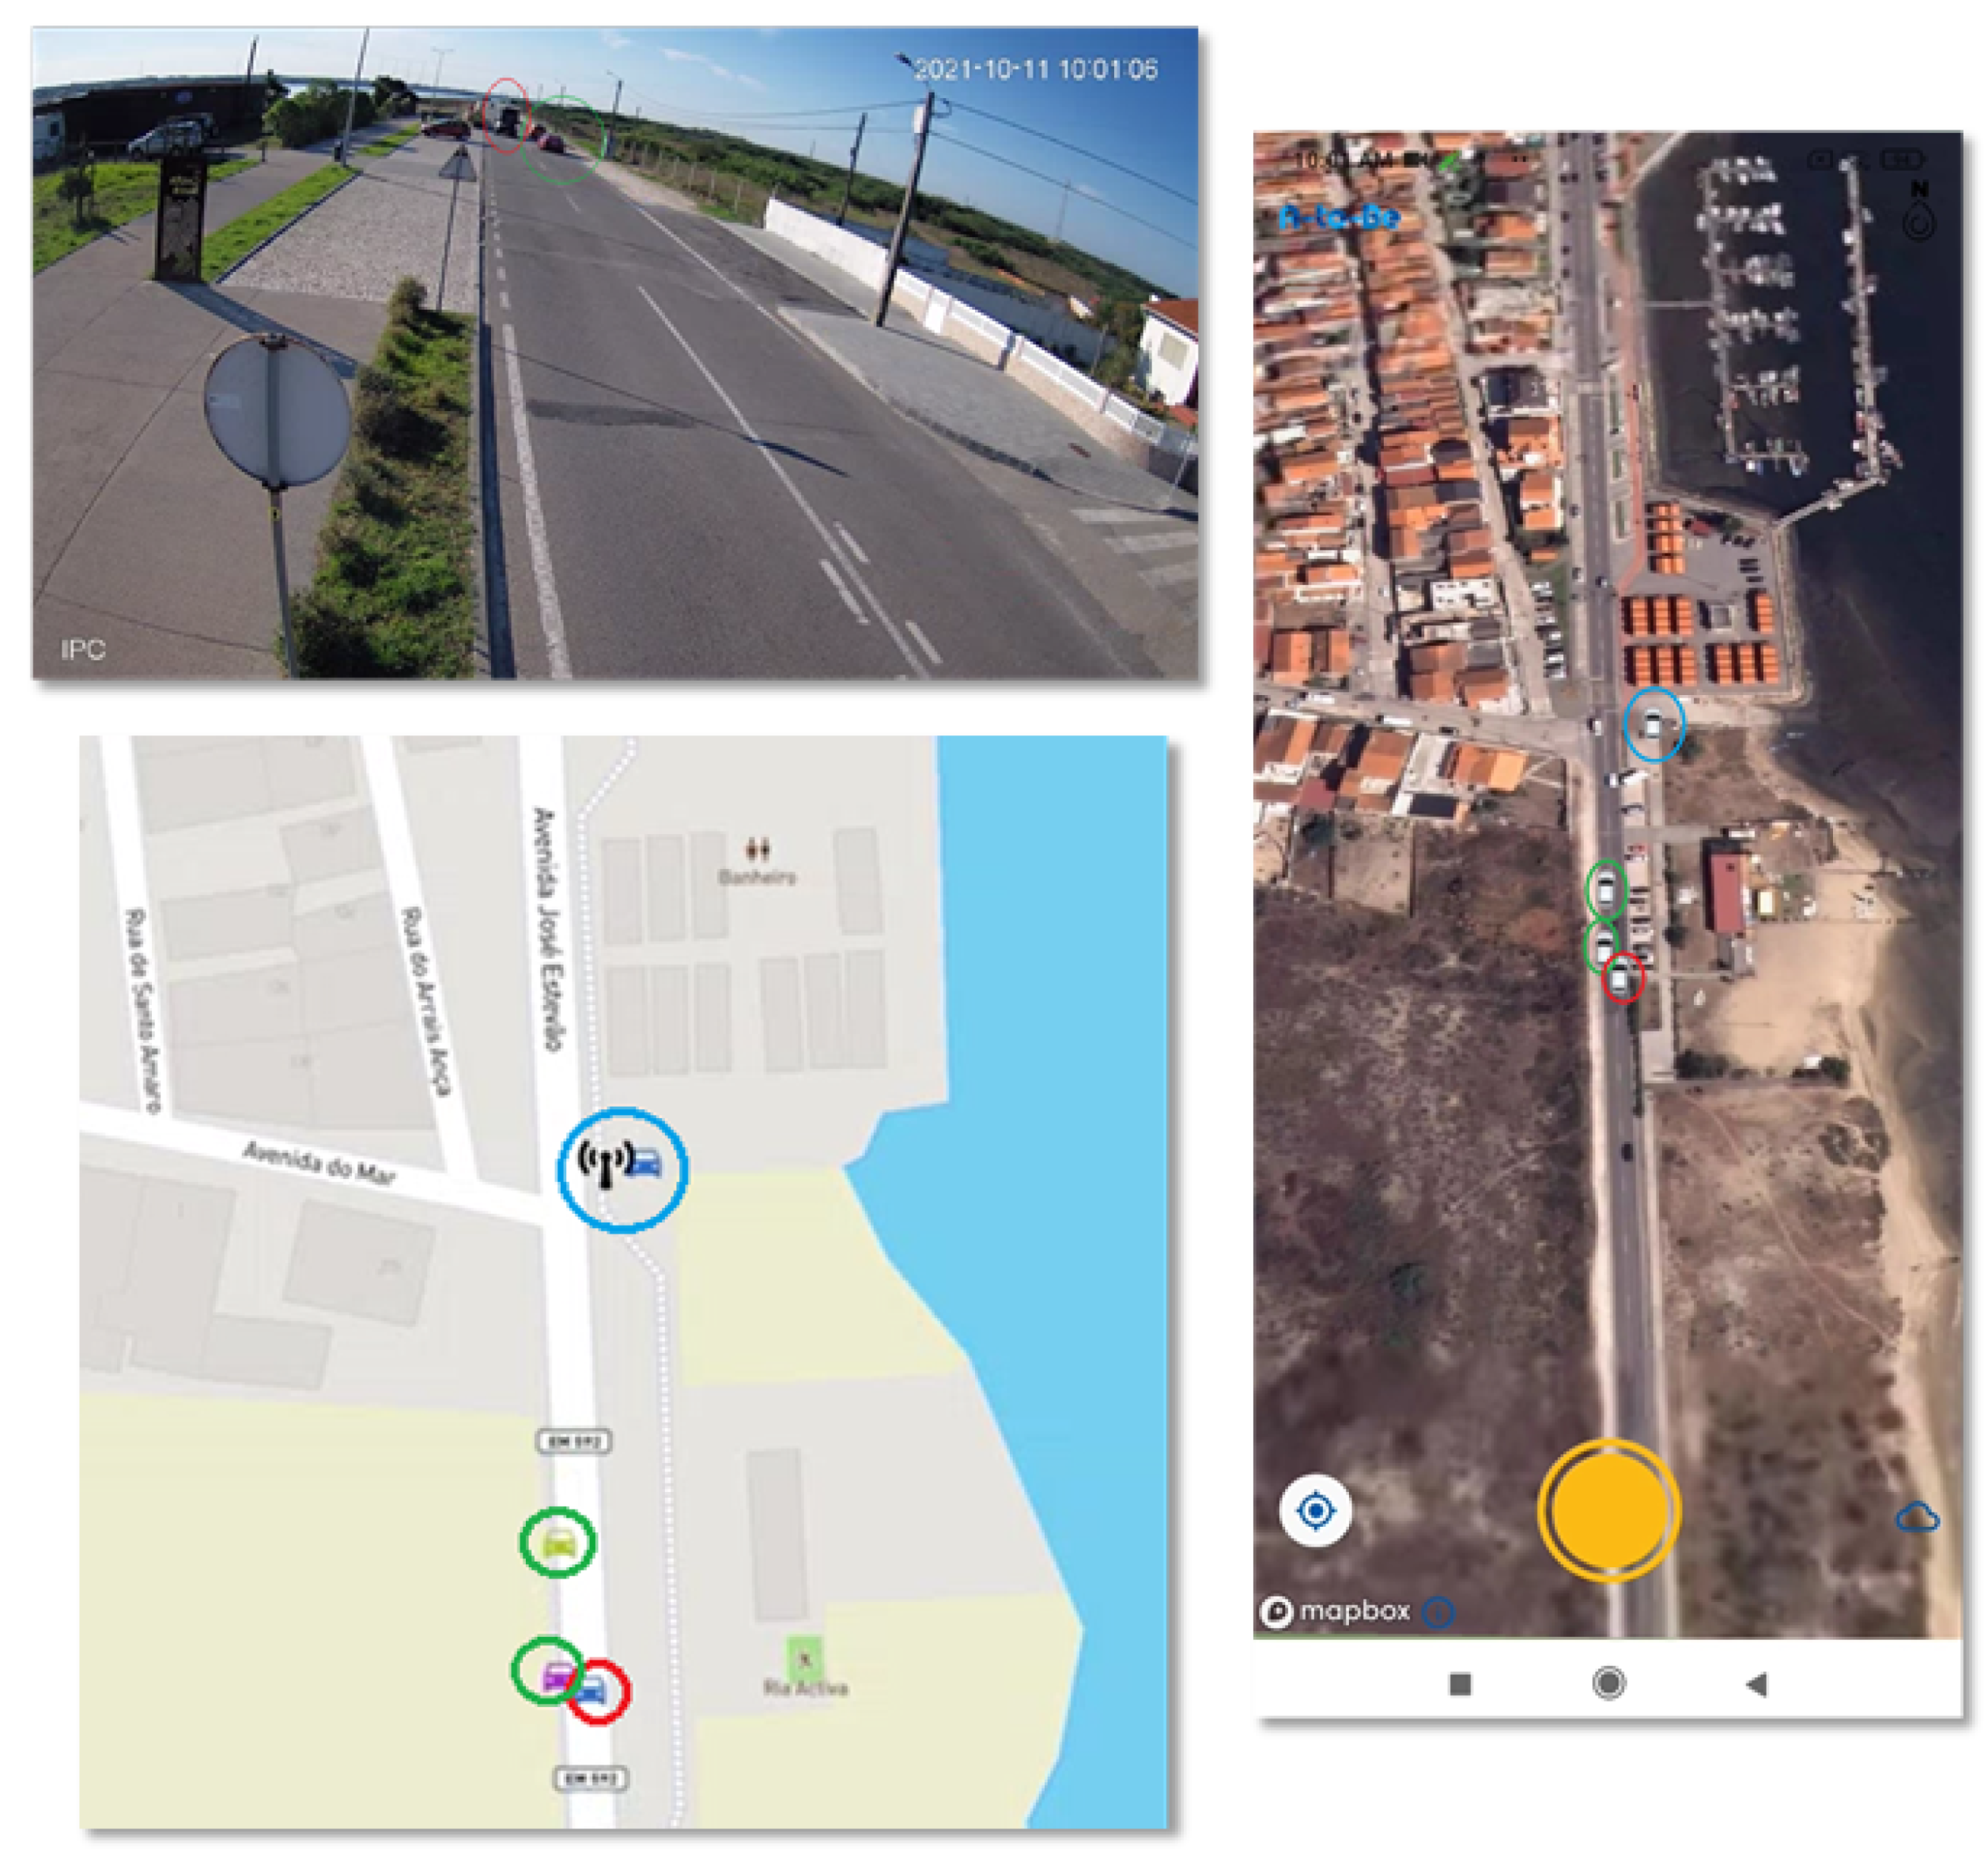
At the left side of
Figure 11, it is possible to see in the camera footage that the cars in the green circle are crossing the van in the red circle. The CPMs generated by the RSU in the blue circle are transmitted to the cloud MQTT broker and can be visualized in the Web application (at the bottom). Similarly, an OBU located inside the communications range of that RSU, such as the vehicle inside the blue circle, will directly receive these messages via ITS-G5. Even if the OBU is outside the range but in the same or adjacent tile of the RSU, it will subscribe to the topic where the CPMs are being published. After that, the OBU redirects the messages to its own local MQTT broker, and through the mobile application, the user can see the surrounding information (a screenshot of the mobile app can be visualized on the right, where the cars illustrated by the CPMs have the same orientation, although having different traffic flow directions due to the lack of heading information in the generated CPMs).
3.3. Platform Installation
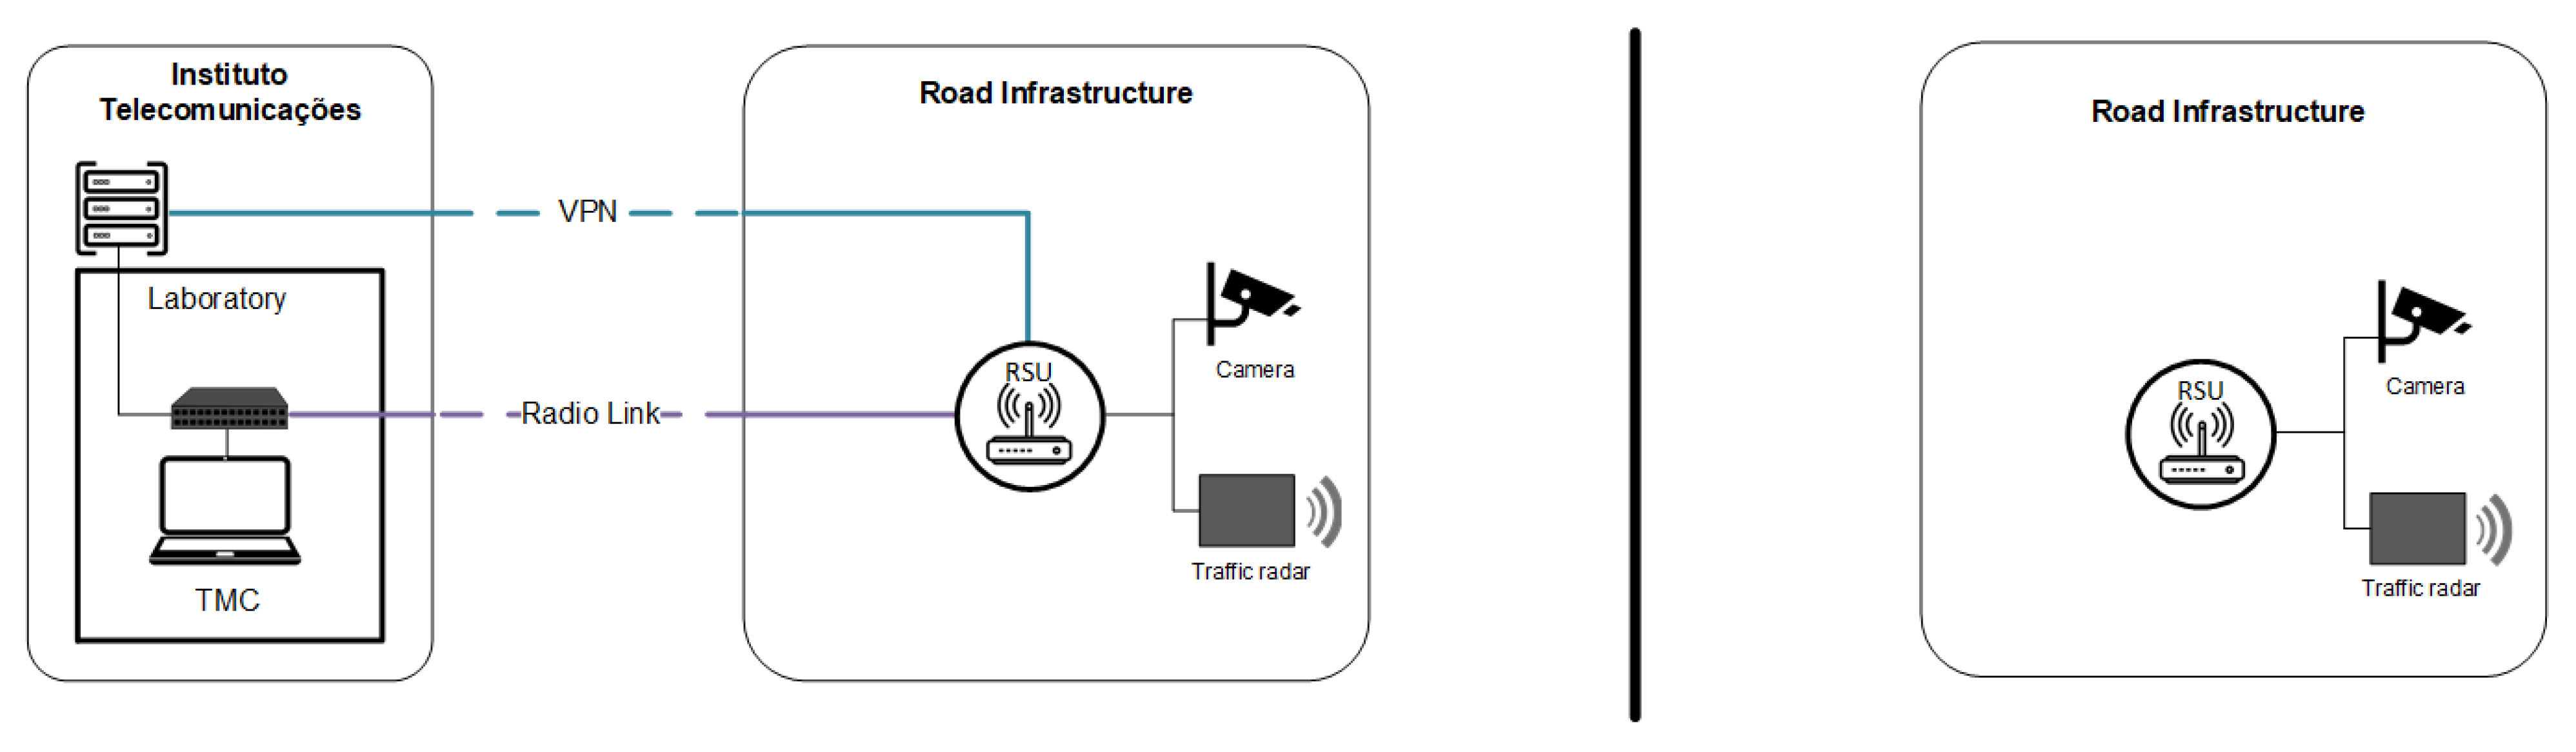
In terms of installation, all RSUs are sealed in exterior waterproof electrical boxes that protect the equipment from weather conditions. In addition to the RSU, the electrical boxes hold an Ethernet switch and a power outlet fed by the electrical grid. The switch provides the connection between the RSU, radar, IP camera, and public WiFi access point that provides the Internet connection.
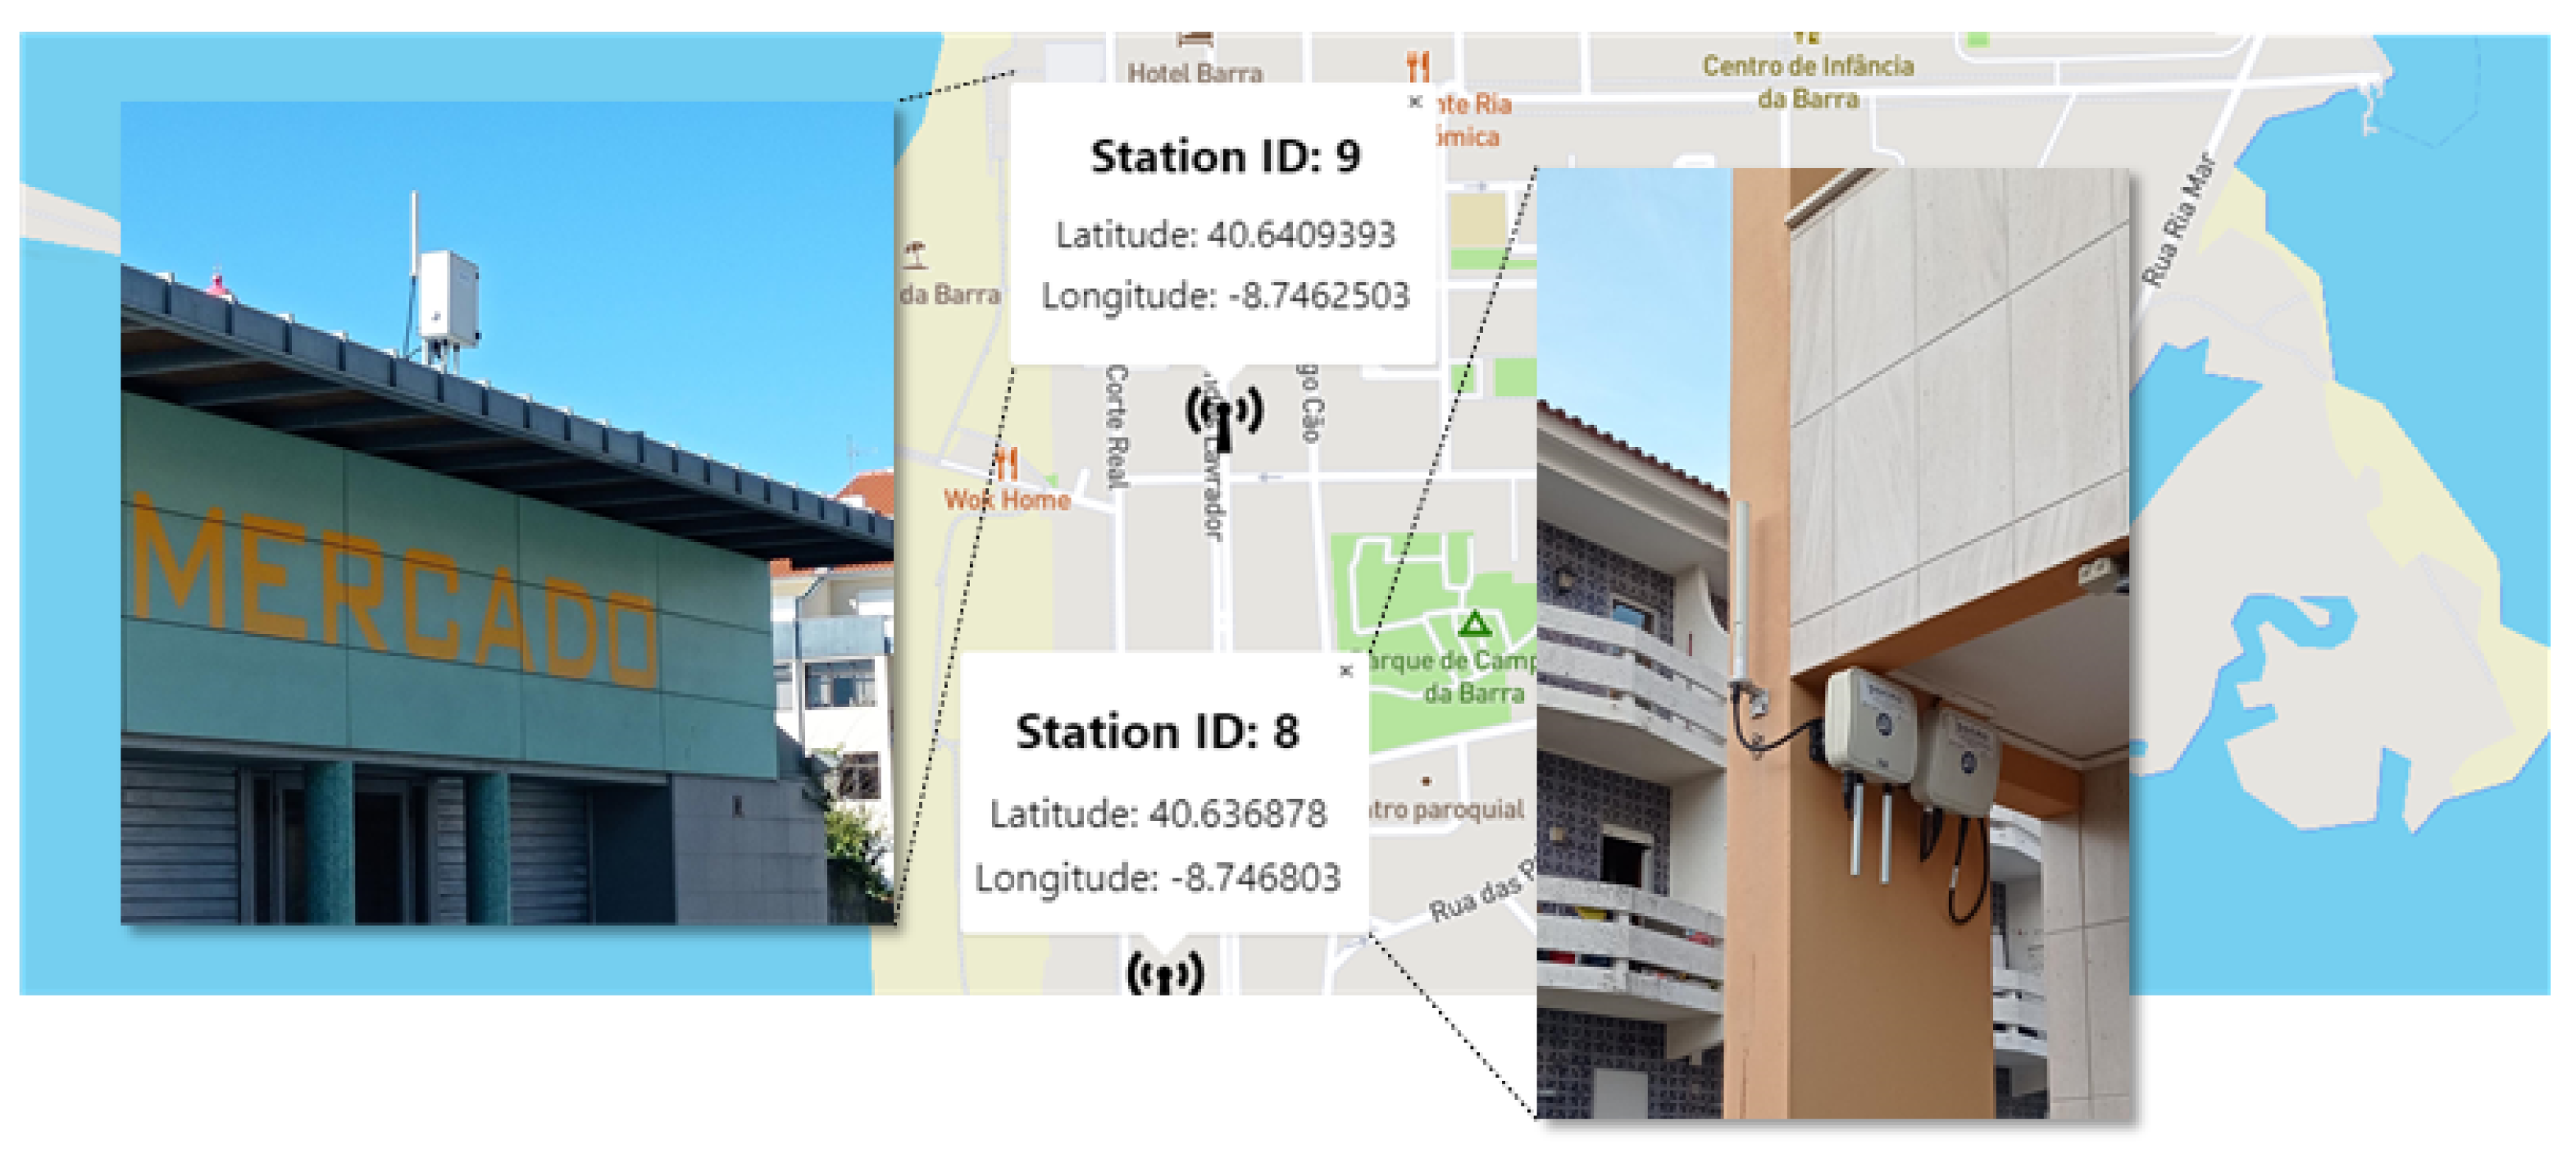
For three of these stations (
Figure 12), the main Internet access is made through a radio link with direct communication to a central office, giving not only internet access to the public access point but also direct access to the network formed by these stations for configuration purposes (e.g., via SSH). For the others stations (
Figure 13), the main Internet access is made through commercial operator optical fiber, on top of which a VPN connection to the central office’s network is implemented for configuration and remote access purposes. In addition to the radio link and optical fiber interfaces, the RSUs also have at their disposal an LTE connection that adds some redundancy in case of connection failure.
5. Conclusions and Future Work
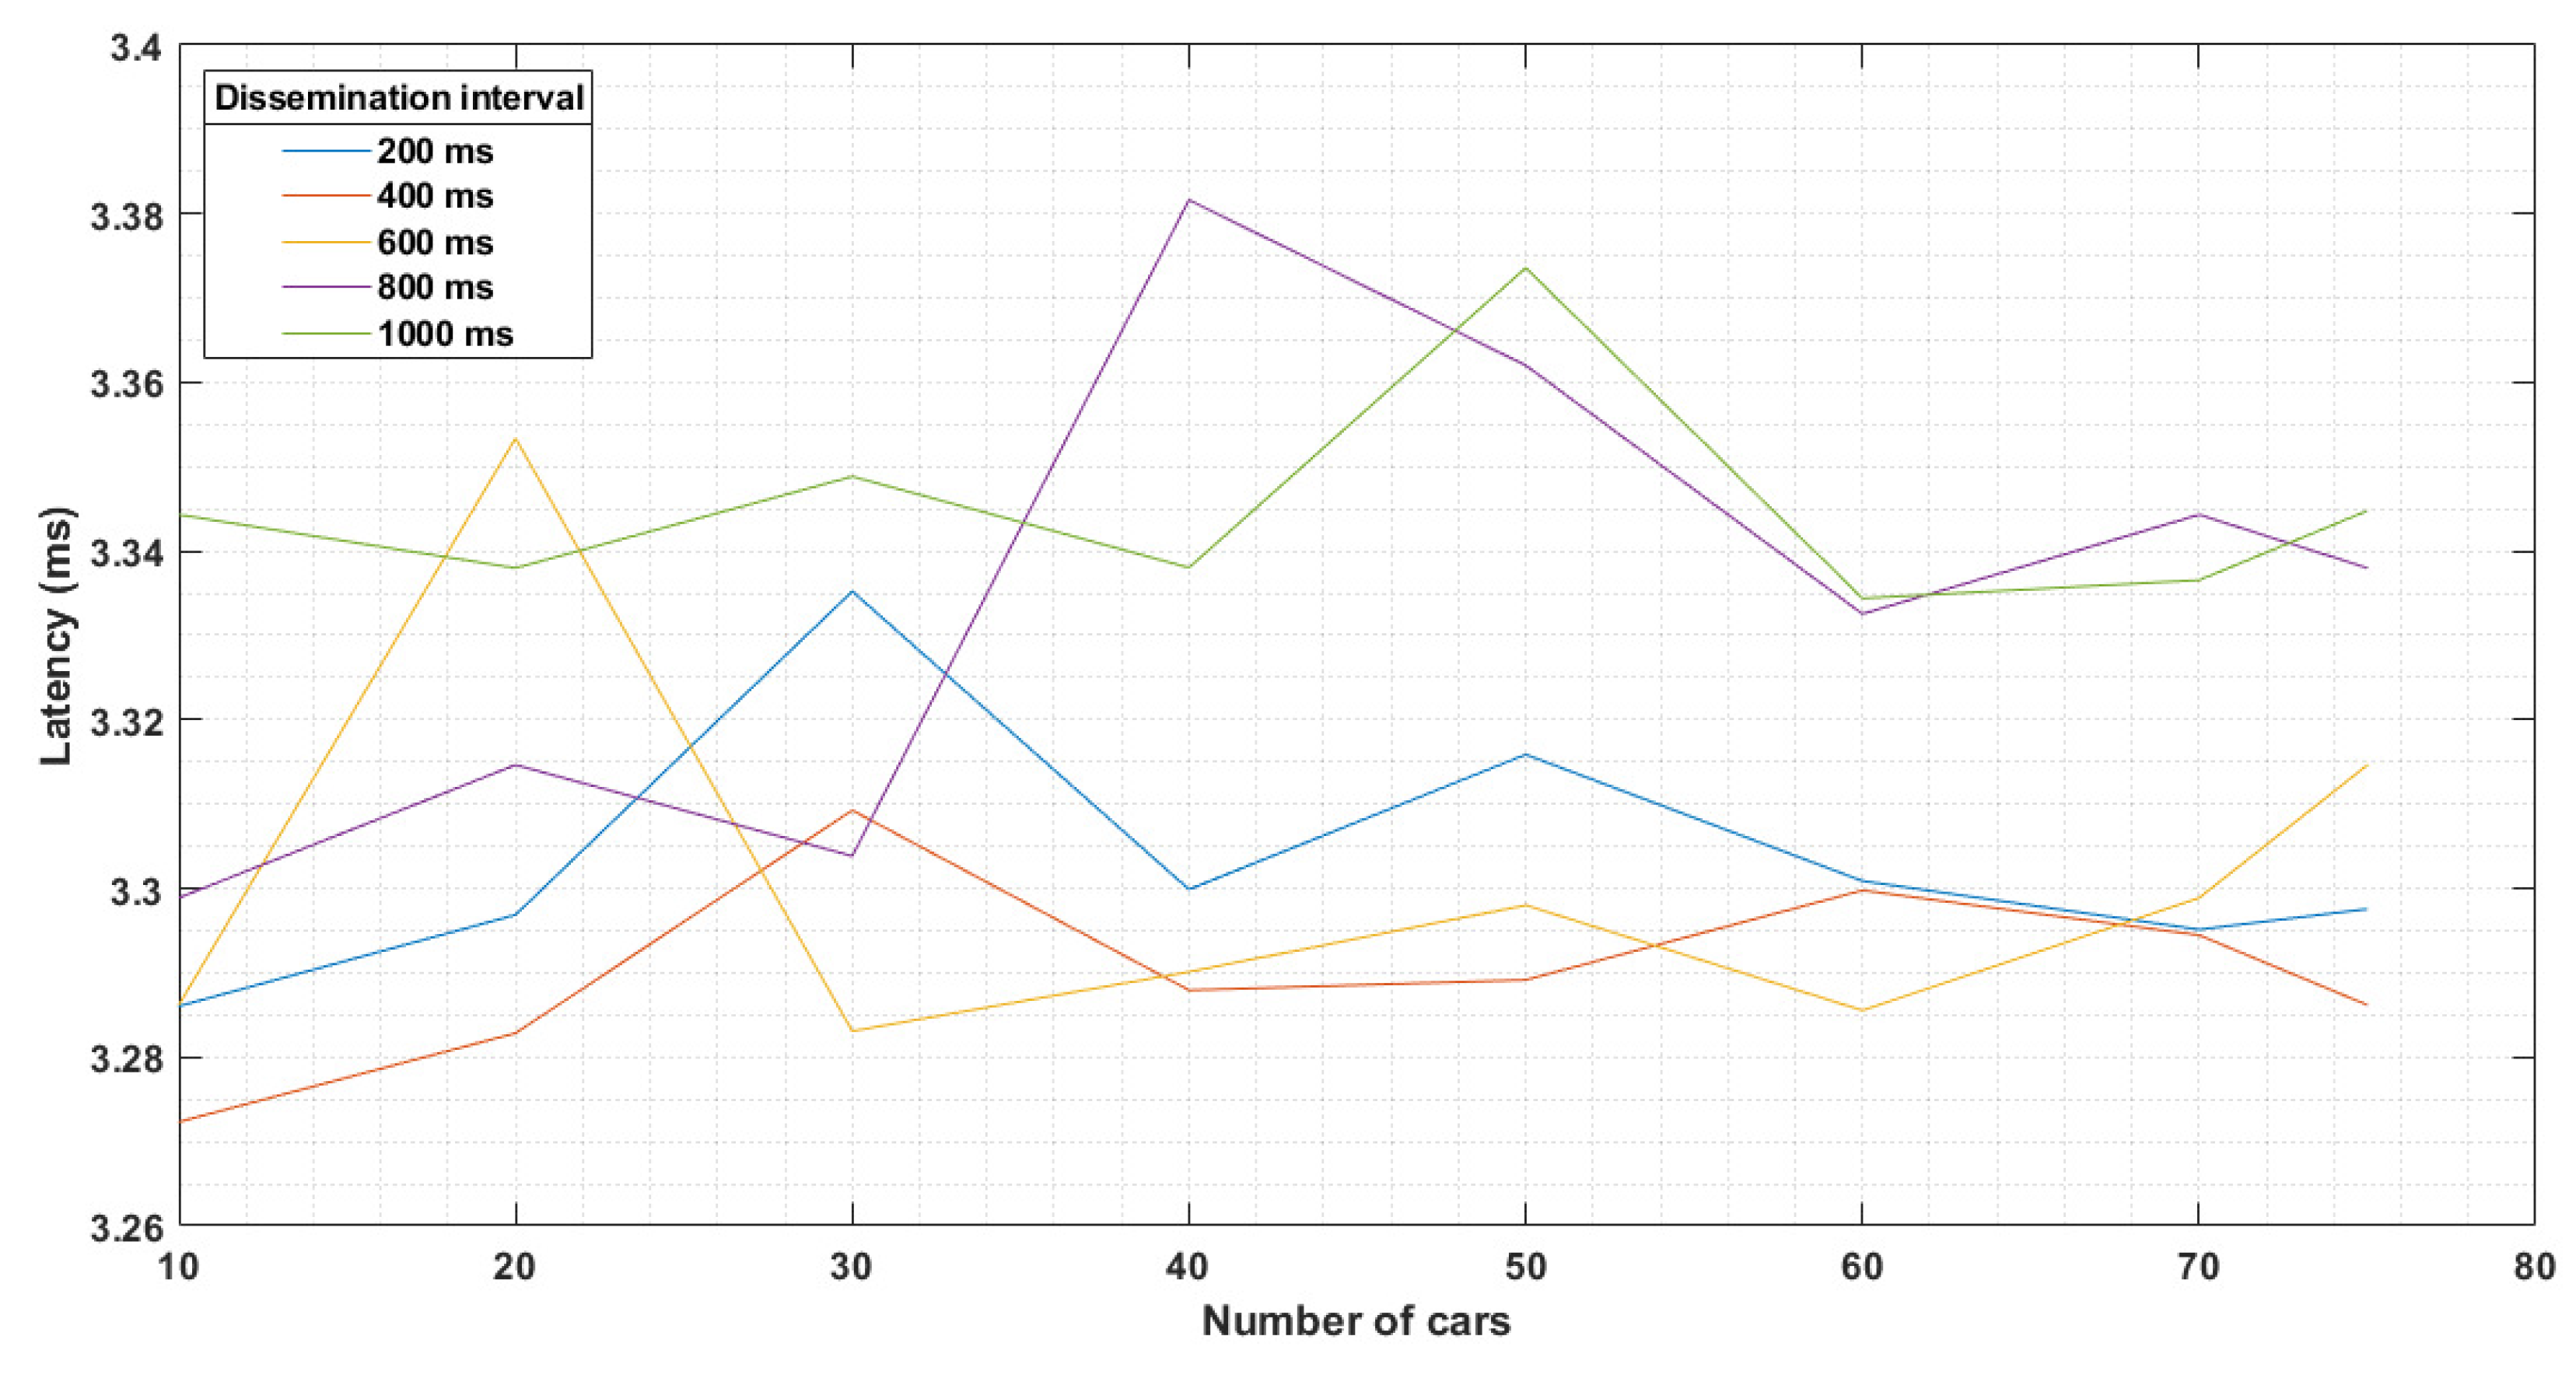
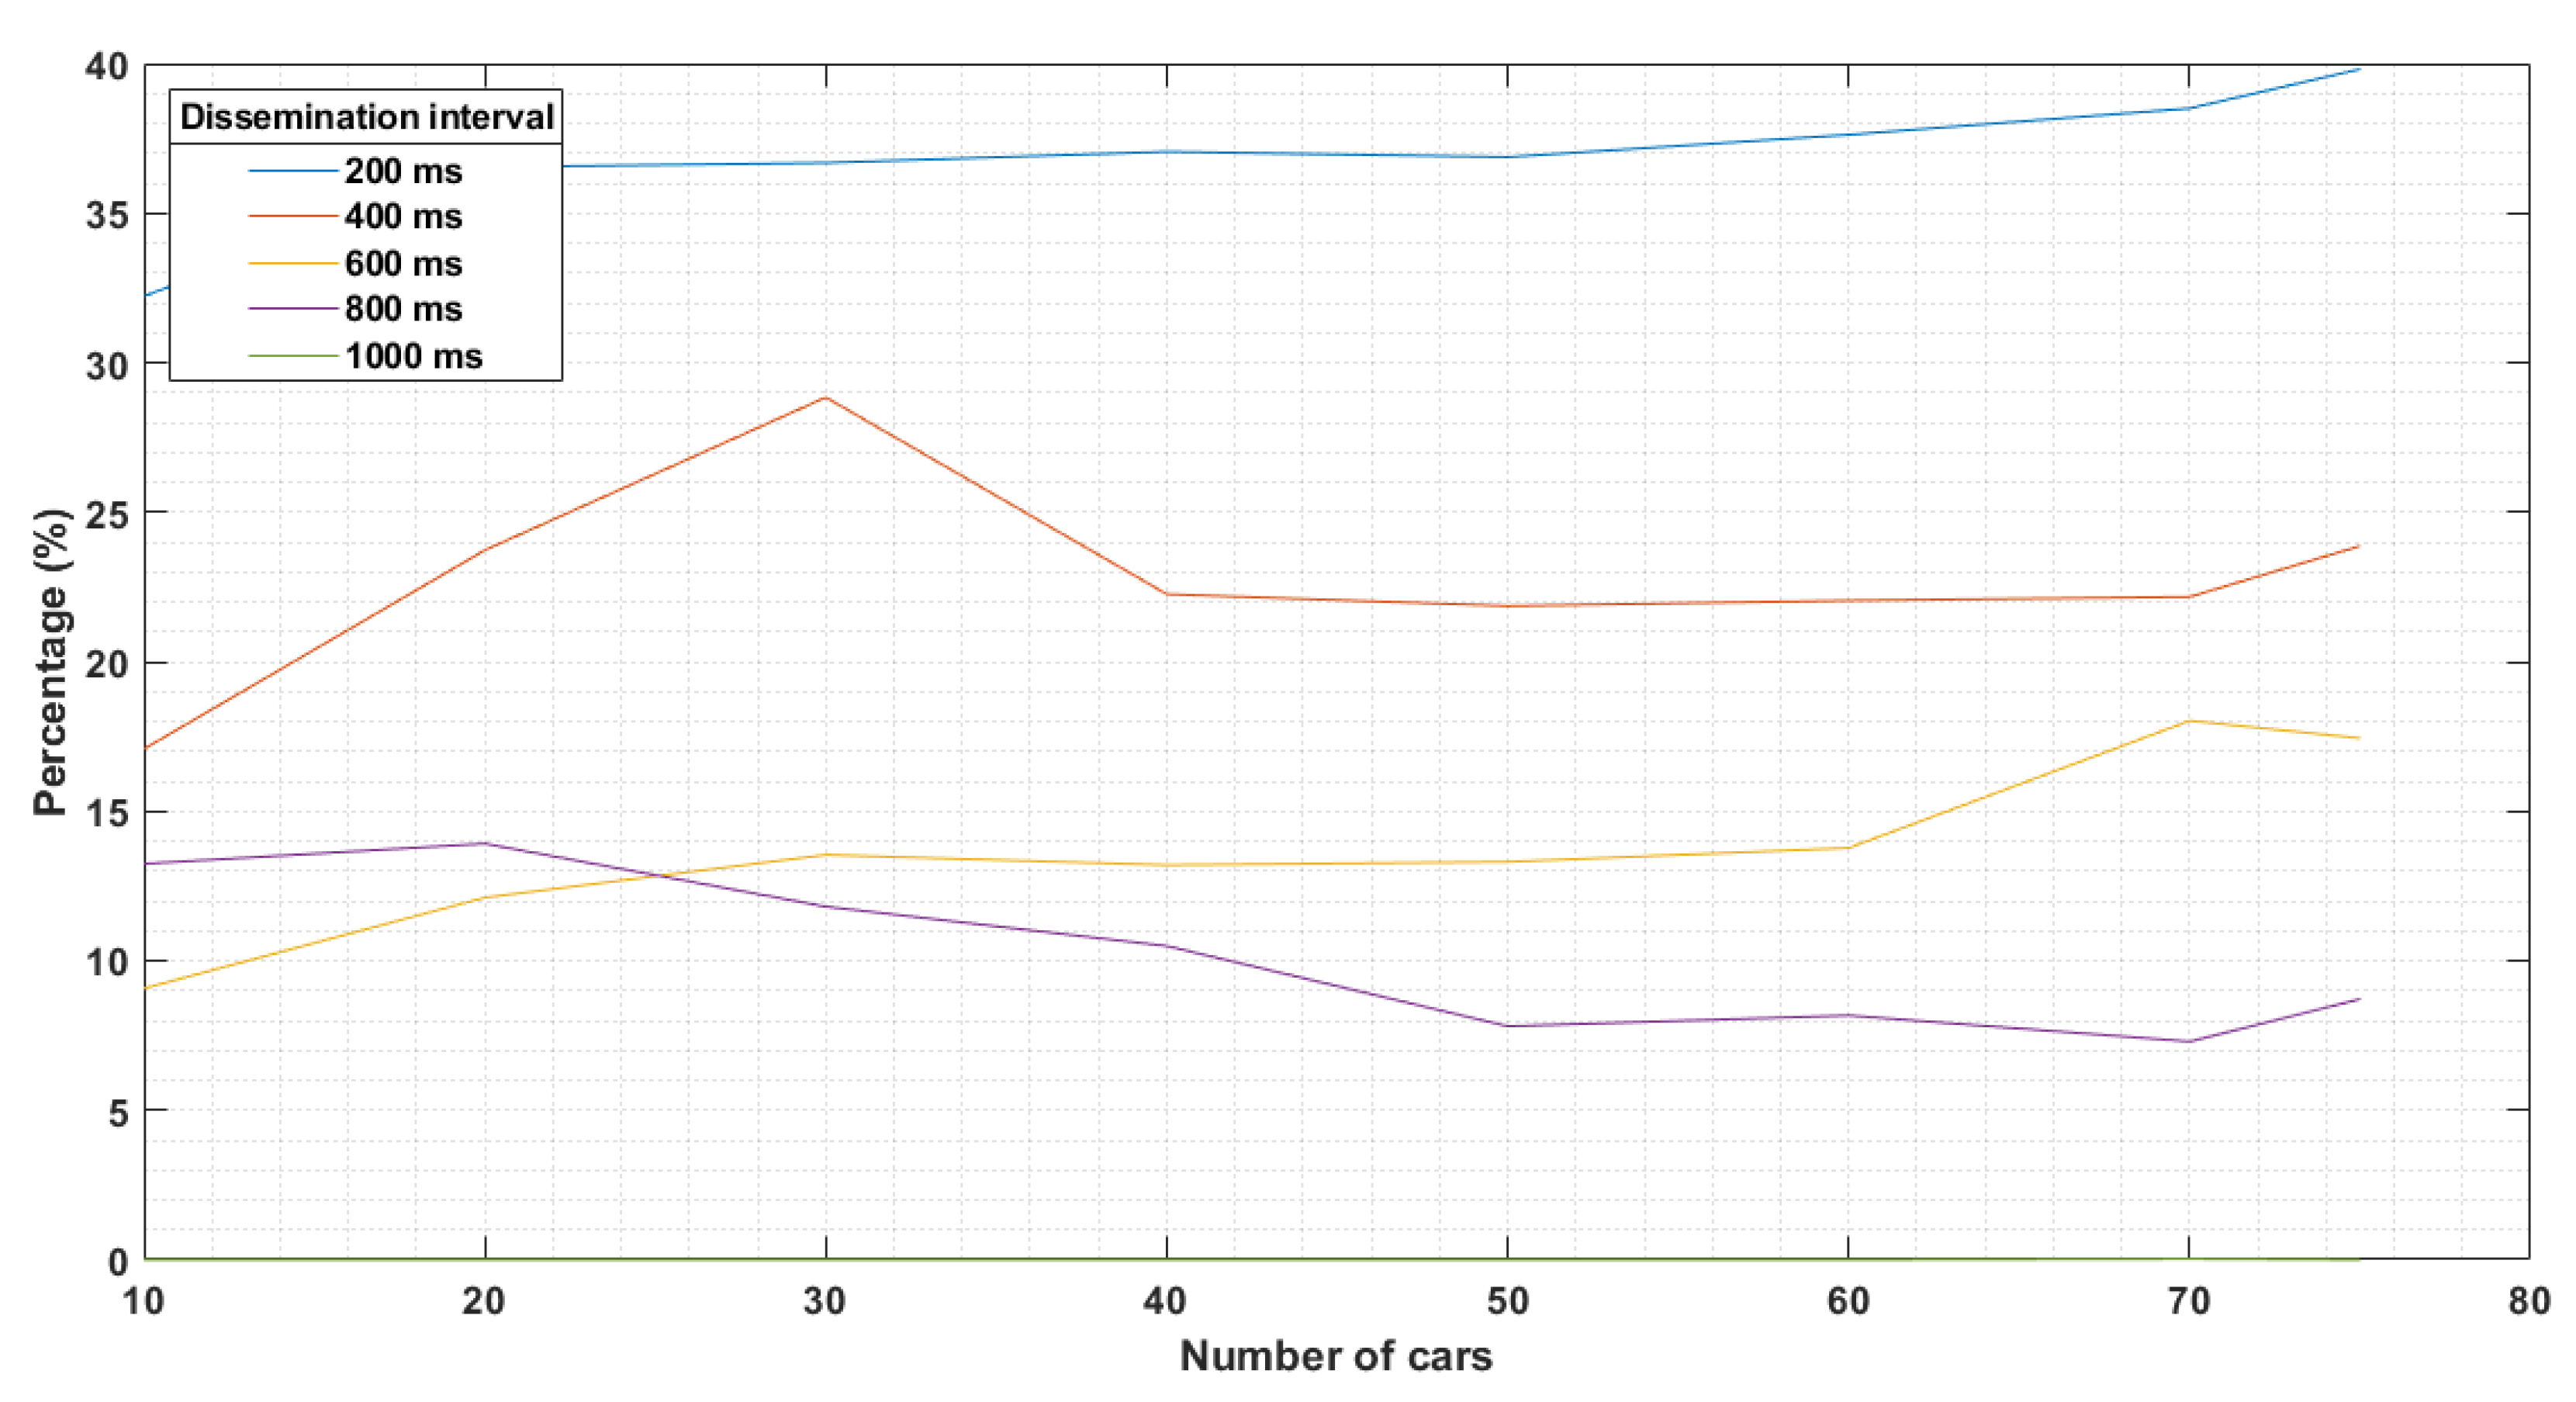
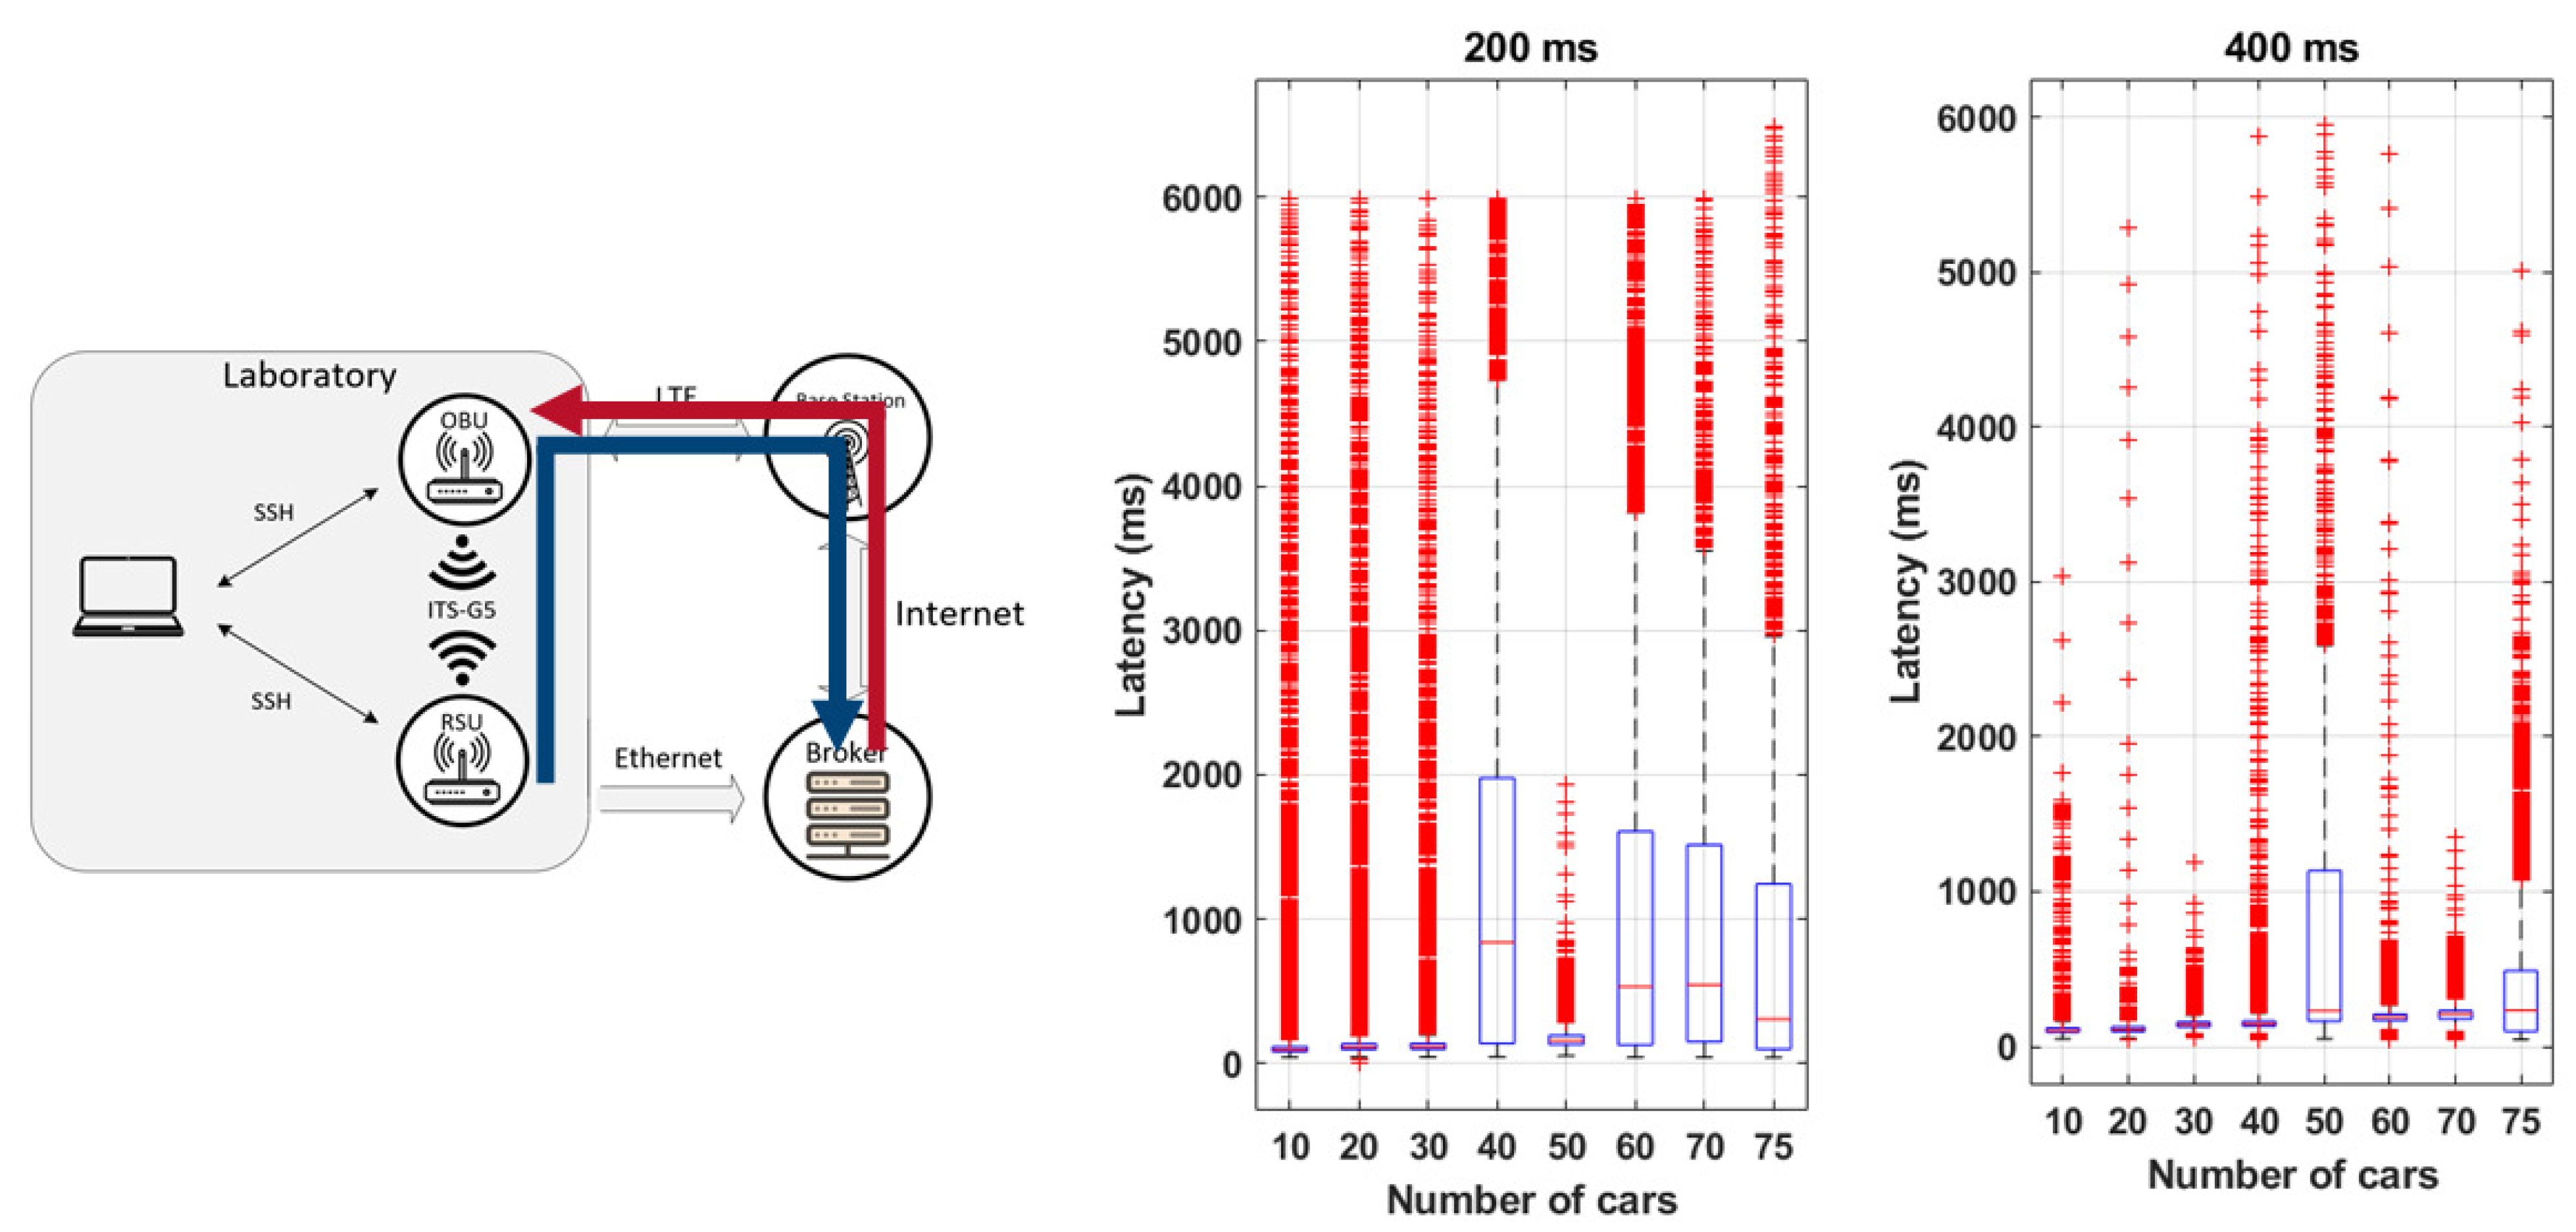
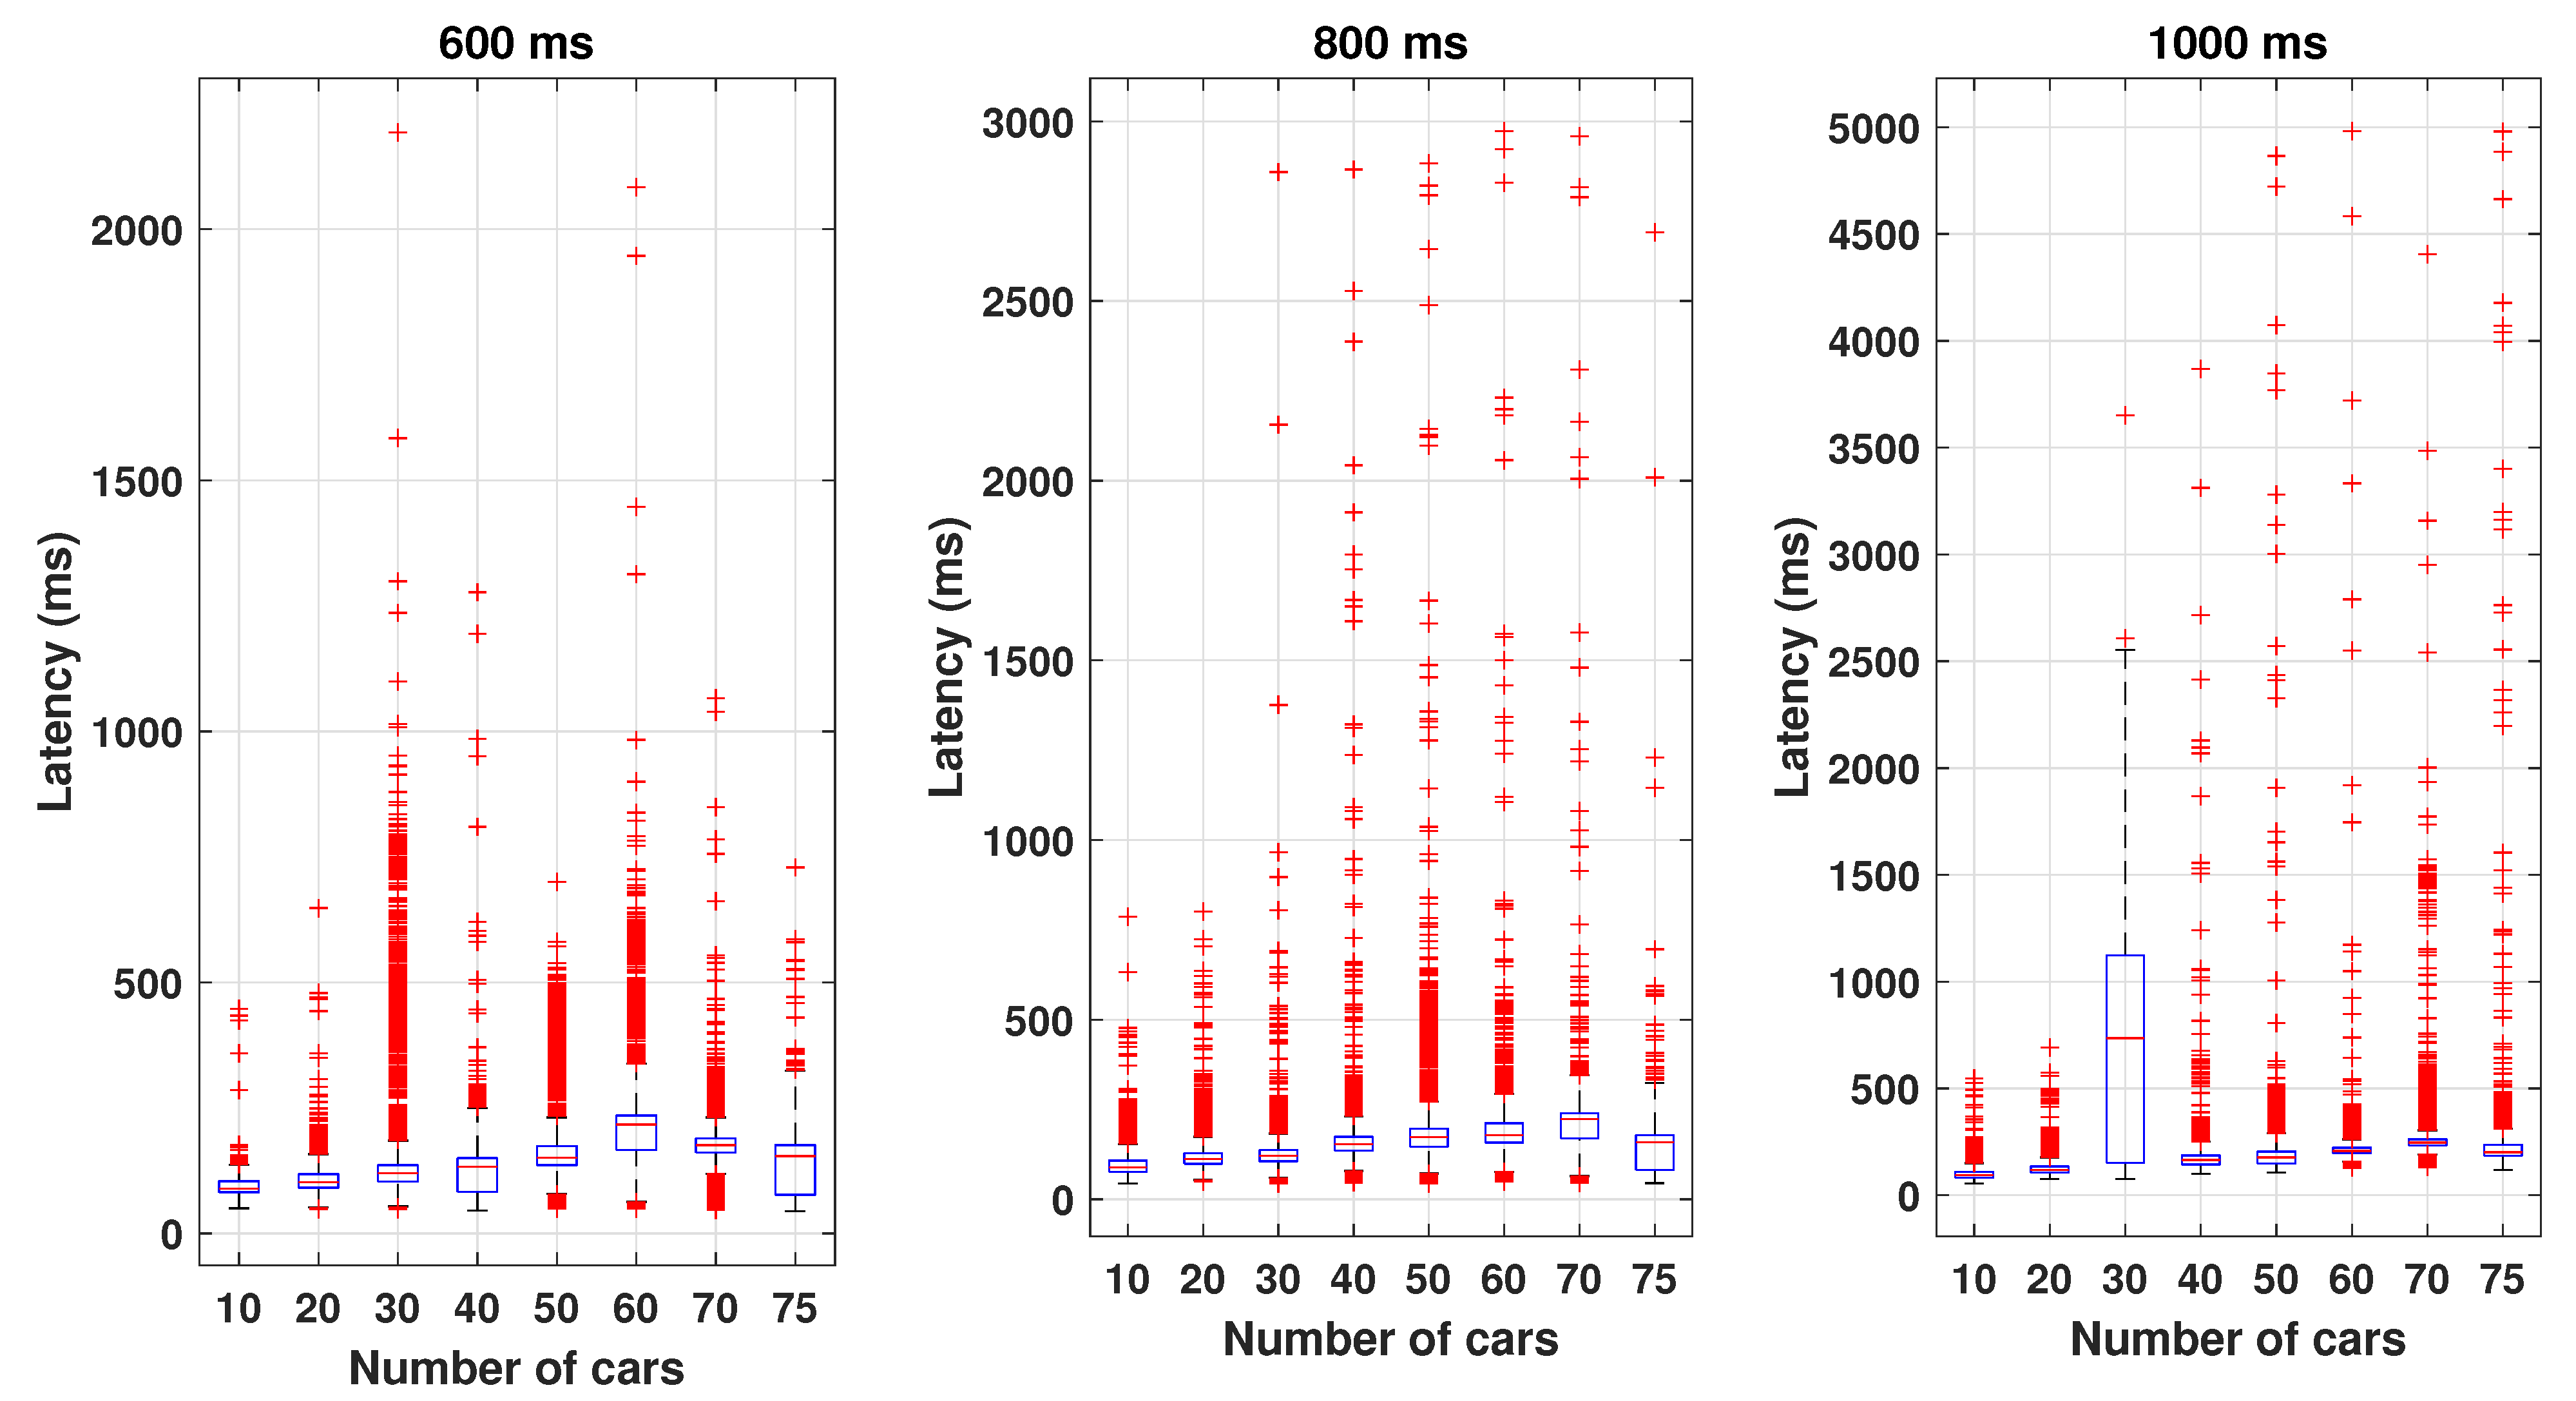
The connected road infrastructure can provide to the C-ITS environment valuable information due to their advantageous position and resource availability. Although CAM dissemination provides important information for connected vehicle localization, the gradual penetration rate of ITS services requires exchanged information to include all road participants (including other users such as cyclists and pedestrians, as well as legacy, non-connected, vehicles) to assure the best reliability possible in road safety applications. The work developed in this paper focused on implementing the collective perception service standardized by ETSI in a real road infrastructure and outputting the information to the user. Using the available resources and the deployed infrastructure, it was possible to retrieve data captured by a traffic classification radar and successfully disseminate CPMs in the local area using short-range ITS-G5 communications and to a cloud MQTT broker by making use of radio links, optical fiber, and LTE connections. This will help connected vehicles to extend their local perception beyond their sensory horizon by making use of cooperative information. Moreover, as shown through the results from the tests performed, the use of dynamic generation rules improves the overall channel efficiency by controlling the amount of data disseminated in more congested environments without compromising the overall system performance. With relatively low time delays, the service fulfills road safety applications requirements by respecting the maximum time delay imposed by ETSI for the Basic Set of Applications.
Regarding the future work, some aspects could be improved regarding the collective perception performance, radio efficiency, and costs. Support for other sensors such as LiDAR or cameras can improve the overall usability of the CPS on the RSU. It is also possible to migrate the collective perception service to the OBU for CPMs dissemination. This aspect could lead to the implementation of another feature: the use of sensor fusion algorithms to reduce uncertainties in the objects’ parameters included in the CPMs and help to fill all optional information, thus creating a more complete and robust message. This could include object classification, confidence, and free space calculations that, in turn, will unlock the possibility of including more frequency management rules to improve channel efficiency. Another step forward for the CPS is to include an object dropped in a current CPM (due to maximum SDU size achieved or dropped by the DCC) in the next generated CPM (CPM segmentation). This mechanism is in compliance with the ETSI standard and therefore brings value to the work performed. A more exhaustive evaluation of the CP service could also be performed, including, for instance, the maximum CPM generation frequency value of 10 Hz and a wider range of vehicle densities and dynamics (speed, lane changes, etc.), providing more insights about the behavior of system under limit situations. The integration of the MCS can also be seen as a future implementation work since it highly relies on the CPM content for the maneuvering and coordination of autonomous vehicles. As for improving the delay from the MQTT broker path, pushing this cloud service close to the edge of the network (MEC) and using other features of recent 5G technology, such as network slicing, could be seen as an important step even to support safety-critical applications. An additional assessment would be to compare the obtained results using ETSI ITS-G5 with the LTE-V2X communications technology (mode 3 or 4), although a similar performance in terms of latency is expected given the short-range nature of both technologies.
Regarding communications costs, another possible improvement is the implementation of a detection mechanism that, when inside the range of an RSU, the OBU message exchange would rely exclusively on ITS-G5 technology, excluding the costs of data transfer using the OBU’s LTE connection and avoiding the reception of duplicated messages.


 ,
, 


