Article

Large-Scale Distributed System and Design Methodology for Real-Time Cluster Services and Environments

1
Department of Software, Sangmyung University, Cheonan-si 31066, Dongnam-gu, Republic of Korea
2
School of Artificial Intelligence Convergence, Hallym University, Chuncheon-si 24252, Gangwon-do, Republic of Korea
*
Author to whom correspondence should be addressed.
Electronics 2022, 11(23), 4037; https://doi.org/10.3390/electronics11234037
Submission received: 30 October 2022 / Revised: 26 November 2022 / Accepted: 30 November 2022 / Published: 5 December 2022
(This article belongs to the Special Issue Intelligent Manufacturing Systems and Applications in Industry 4.0)

Abstract

:
The demand for a large-scale distributed system, such as a smart grid, which includes real-time interconnection, is rapidly increasing. To provide a seamless connected environment, real-time communication and optimal resource allocation of cluster microgrid platforms (CMPs) are essential. In this paper, we propose two techniques for real-time interconnection and optimal resource allocation for a large-scale distributed system. In particular, to configure a CMP, we analyze the data transfer rate and utilization rate from the intelligent electronic device (IED), collecting the power production data to the individual controller. The details provided in this paper are used to design a sample value, i.e., raw data transfer, on the basis of the IEC 61850 protocol for mapping. The choice of sampled values is to attain the critical time requirement, data transmission of current transformers, voltage transformers, and protective relaying of less than 1 s without complicating the real-time implementation. Furthermore, in this paper, a way to determine the optimal number of physical resources (i.e., CPU, memory, and network) for a given system is discussed. CPU ranged from 0.9 to 0.98 while each cluster increased from 10 to 1000. With the same condition, memory utilized almost 100% utilization from 0.98 to 1. Lastly, the network utilization rate was 0.96 and peaked at 1 at most. Based on the results, we confirm that a large-scale distributed system can provide a seamless monitoring service to distribute messages for each IED, and this can provide a configuration for CMP without exceeding 100% utilization.

1. Introduction

Recent demand for renewable energy such as solar power, wind power, waves, and geothermal power is coming to a paradigm shift in the face of global warming and energy efficiency. Therefore, large-scale distributed systems such as smart grid/microgrid systems are used for this apex [1,2]. Meanwhile, larger-scale energy-distributed systems (e.g., Smart grids) for bi-directional communication for integrating, analyzing, and servicing the data produced by the independent microgrids have been studied by IEC 61850 through external connection networks [1]. Furthermore, a microgrid is an independent network of power generators with high-speed communication with each other to efficiently supply electrical power and/or heat in the immediate vicinity and integrates multiple energy sources such as solar, wind, diesel, and photovoltaic systems. Because the microgrid system needs to measure and control power in real-time, an efficient large-scale data communication configuration of a distributed power supply is required [3,4,5,6,7,8,9,10]. Therefore, in the cluster of the microgrid environment [11,12], real-time processing of the cluster system is an important issue from the viewpoint of theoretical support and data through the large-scale data communication of the distributed power supply, especially in the case of a Smart city.
To discuss the advantage of a distributed system, independence between clusters, which are independent resources, is guaranteed. Meanwhile, the most important point is to increase the utilization rate as much as possible because it can become a bigger weakness if resources between independent clusters are not used efficiently. Moreover, in a small system, it is not necessary to be efficient, but in a large-scale system such as electricity, securing the efficiency of resources in real-time has the greatest research value. In this paper, we propose the Cluster Microgrid Platform (here in after, CMP) as a large-scale distributed energy system design methodology and standard protocol implementation for the real-time service of a Korean electricity company, and a cluster service configuration for an integrated distributed model of independent microgrids. The provision of sufficient resources for a large-scale distributed energy system (in this case, several thousand host servers and several hundred thousand virtual machines) necessitates consideration of the characteristics of CMPs. In a cluster service, a Virtual Machine (here in after, VM) embodies a comprehensive logical device as a form of metadata. In addition, the VMs for distributed energy are manually pre-assigned to each server during offline processing by an administrator.
In this paper, at the same time, we present work that analyzes the utilization of CMP (i.e., CPU, memory, and network) for distributed energy users by performing a utilization analysis considering the application workload and the server capacity and subsequently propose a utilization prediction model based on a polynomial regression model. Because the performance of a CMP decreases as the number of Virtual clusters of Microgrid (here in after, VMG) increases, we predict the utilization of each physical server of the CMP with an increasing number of VMGs by using a polynomial regression model. It should be noted that the server capacities are determined by three resources of the CMP, such as the CPU, memory, and network.
We can ensure the provision of sufficient cluster services to the large-scale distributed energy system by increasing the capacity of the cluster system by extending the number of servers or improving the server architectures. However, this approach may be costly; thus, it is essential to efficiently configure the CMP in the given large-scale distributed energy environment. Therefore, we propose a greedy approach to find the optimal configurations of CMP (i.e., the number of servers and cores, the CPU speed, the memory size, and the network bandwidth) with a utilization analysis for the given large-scale distributed environment. To the best of our knowledge, this is the first report on the exploitation of utilization analysis, taking into account the server capacity degradation with increased VMGs, of a CMP for large-scale distributed energy. Based on the results, we confirm that the proposed approach can provide a configuration for a CMP for large-scale distributed energy without exceeding 100% utilization.
The following are the key contributions of this paper:
  • We proposed a real-time communication system for a large-scale distributed energy system that contains raw data called sample values, which are more specifically available in terms of system design.
  • Experimental tests have been set up with a Physical VM Server (here in after, PVS) configuration and validated through the CMP.
  • Simultaneously, the theoretical and practical correlations and impact of large-scale cluster microgrid services were made in terms of software and platform perspectives.
  • We established a large-scale microgrid service test environment and simulation for the Smart city domain.
The remainder of the paper is organized as follows: Section 2 describes the background, as well as the large-scale distributed system and its service, for massively distributed energy management. Section 3 presents the system architecture and communication model for sampled values. Section 4 describes the simulation results, Section 5 discusses the optimal value with results, and Section 6 concludes the paper.

2. Distributed System and Its Service

Large-scale distributed services, smart grid, and microgrids have been studied for bi-directional communication, real-time control, and monitoring technology to optimize energy efficiency by exchanging information between electric power suppliers and consumers by combining information communication technology with existing power grids [1,2,3,4,5,6,7,8,9,10,11,12]. Smart grids are conceptualized as a combination of electrical networks and communication infrastructure. With the implementation of bi-directional communication and power flow, the smart grid can provide electricity. More efficient and reliable than the existing grid, the smart grid consists of a power network with intelligent entities that can autonomously operate, communicate and interact to supply electricity efficiently to customers. The heterogeneity of the smart grid architecture fosters the use of advanced technologies to overcome various technical challenges at various levels. All smart grid infrastructures must support real-time bidirectional communication between utilities and consumers, and software systems from both producers and consumers must be able to control and manage power usage [3,4,5,6,7,8,9,10]. In order to manage hundreds of smart meters in a secure, reliable, and scalable manner, utilities must extend this communications network management system to a distributed data center. In this regard, cluster service is expected to play a key role in the following motivation for future smart grid design. These computing resources can be quickly provisioned and deployed cost-effectively to service providers [1,2,3,4,5]. With this large-scale energy infrastructure, customers can access their applications from anywhere, anytime, through devices connected to the network.
A standard that can be applied to establish the automated system of the substation has been enacted by IEC TC57, which arranged necessary matters for the interoperability between the substation automation system and Intelligent Electronic Devices (IEDs) [1]. IEC61850 standard supports strong object modeling, which is easy to distribute and process the function according to the level of Station/Bay/Process. In particular, the International Electro-technical Commission’s IEC 61850 is a standard designed for substation automation. IEC 61850 defines abstract data models that can be modeled on a number of protocols [13]. These protocols can be mapped over TCP/IP networks and/or substation LANs using high-speed switched Ethernet. The high-speed requirement for the standard is to achieve a response time of fewer than 4 milliseconds of protective relaying. In addition, Open Automatic Demand and Response (i.e., OpenADR) can communicate collective power information through external networks [14,15]. The intelligent electronic device (i.e., IED) is the basic unit for producing data, and thus, the configuration of the IED and the efficient application of the protocol are important factors in the construction of the individual microgrid system [16,17,18].
Furthermore, based on a distributed system, real-time processing of big data analysis and mobile service is possible [19,20,21,22,23]. Many researchers have investigated different aspects of microgrids, including their penetration into electric power systems, integration issues of distributed energy resources, the role of power electronics, and the stability and reliability of microgrids [1,2]. Although all of these investigations and their associated models are very useful in understanding the performance and operation of the large-scale distributed energy system, little or no effort has been spent on efficient system configuration with consideration of physical resources. Therefore, real-time communication and resource allocation for large-scale cluster microgrid services by applying to the platform and environment that service in the real unit and cluster method from the production of raw data using standard protocol method is required.
In addition, microgrid research has been carried out with a small-scale grid system, which is self-sufficient in small areas [1,2]. Unlike conventional power systems in one-way systems, which transfer electricity generated from a power plant to consumers, a microgrid is equipped with a local power supply and storage system centered on independent distributed power sources so that individuals can produce, store, or consume power. In other words, it is a next-generation power system in which a small independent power grid is formed by combining renewable energy sources, such as solar and wind power, and an energy storage system (i.e., ESS) [1,2]. The community microgrid, which is constructed in this way, can be expanded nationwide, and if it is linked to the power grid in the future, it can eventually build a nationwide smart grid. In this process, the combined growth of each unit industry-constituting microgrid, such as ESS, wind power, solar power, energy management systems, and ICT, will follow.
In general, the stated scope of IEC 61850 was communications within the substation; discussions are underway to look at defining IEC 61850 for the substation to master communication protocol. With the introduction of IEC 61850 standardization, the Abstract Communication Service Interface (ACSI) models enable all IEDs to behave in an identical manner from the network perspective. The standardized high-speed communications between IEDs allow the utility engineer to eliminate many expensive stand-alone devices and use the sophisticated functionality and the available data to their full extent [16,17,18].
Furthermore, virtualization technologies can provide cost reduction, resource optimization, and server management [2]. CMP could be implemented in a variety of microgrid strategies. Rajeev and Ashok [2] proposed a framework for integrating communication applications for microgrid management in the form of different modules, such as infrastructure, power management, and services. Infrastructure and power management modules are used for job scheduling and microgrid power management, respectively. Other operators publish service descriptions using service modules. By implementing internal/external computing devices can be integrated with internal computing devices. In this way, virtual energy sources can be integrated with existing energy storage devices, and energy exchange mechanisms can be achieved between microgrids to meet consumer energy needs. Large-scale distributed energy systems, smart grids, and infrastructure must be deployed globally. CMP, a scalable software platform, is needed to quickly integrate and analyze information that is streamed simultaneously from multiple smart meters to balance the real-time demand and supply curves. Therefore, a real-time monitoring system based on CMP for MGs and IEDs is needed for such demand analysis.
Although all of these investigations and their associated models are very useful in understanding the performance and operation of the system, little or no effort has been spent on efficient system configuration with consideration of physical resources. Although these simulation tools can analyze the performance of CMP toward resource allocation (i.e., VMG allocation) [24,25,26,27], they do not consider the characteristics of an energy platform that considers system availability based on physical resource analysis, an important factor in large-scale distributed energy cluster service environments as shown in Figure 1. The provision of sufficient resources for cluster services to large-scale distributed energy (i.e., several thousand host servers and several hundred thousand virtual machines) necessitates consideration of the characteristics of CMP, such as Smart city.

3. System Design

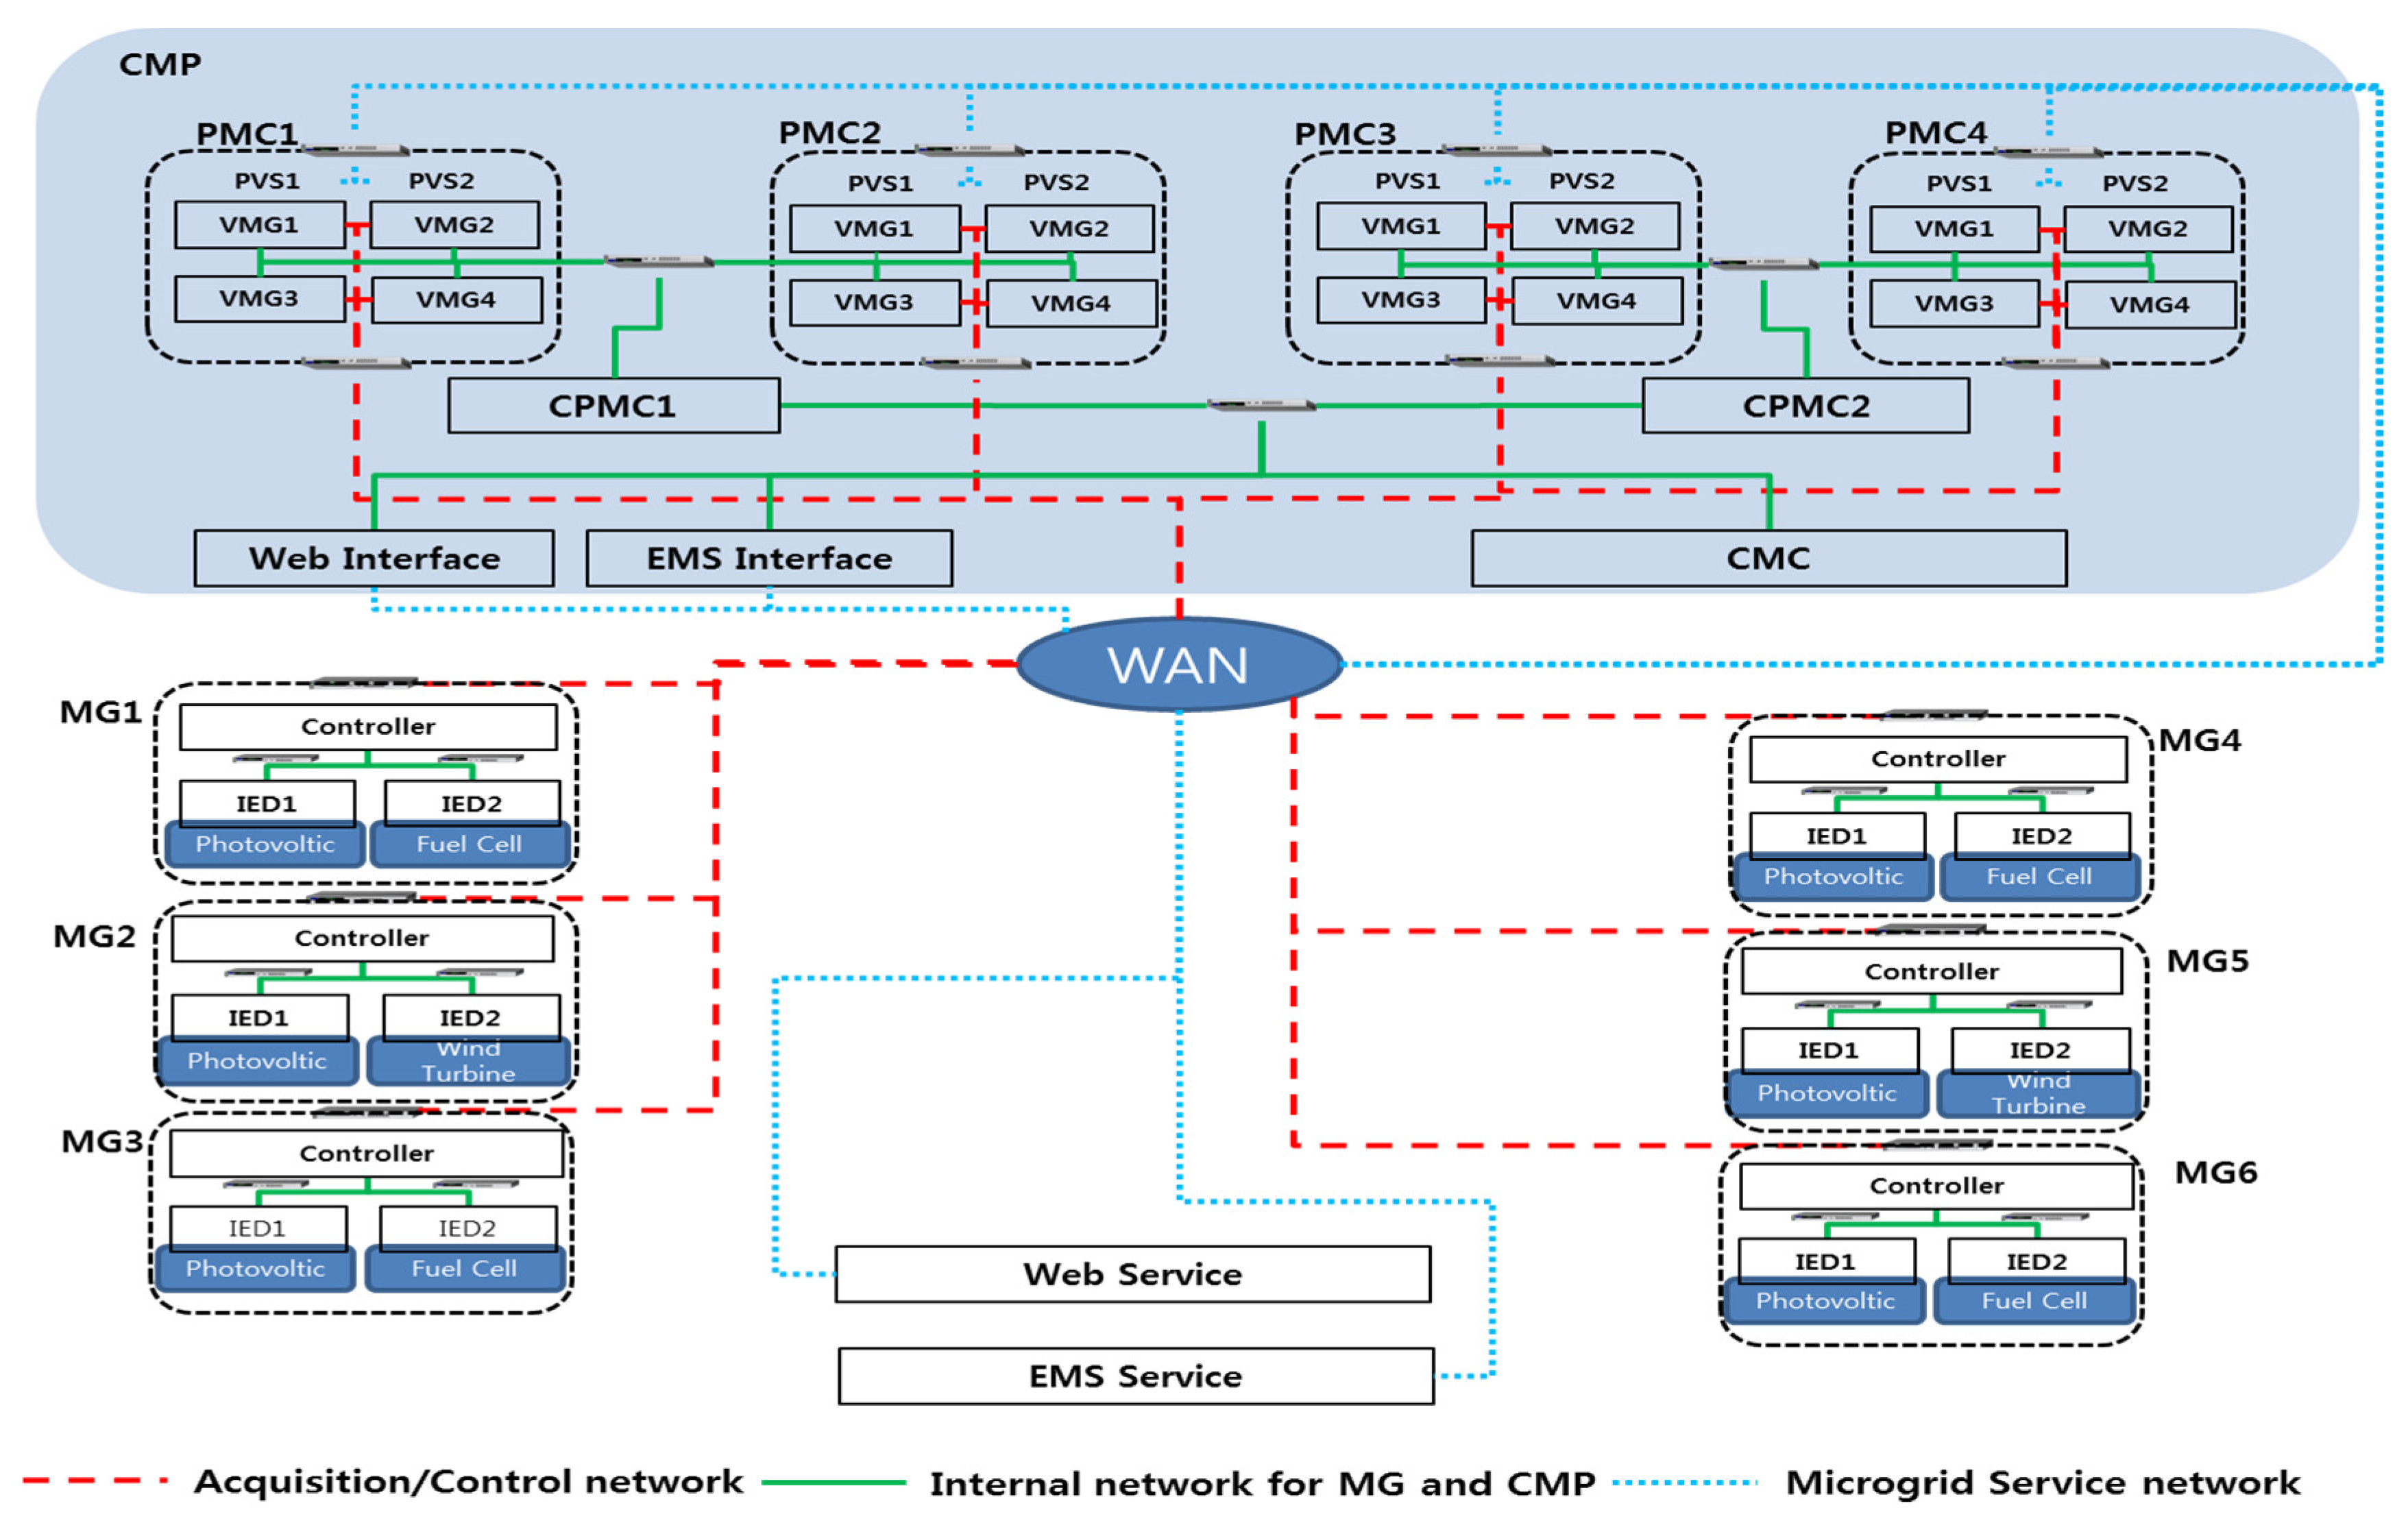
3.1. Overall System Design

In general, microgrids (MGs) require communications and large-scale distributed systems that can effectively integrate advanced intelligent equipment. Powerful tools are required for documenting and specifying complex advanced automation and consumer communication systems. The algorithmic and mathematical underpinnings and look-ahead capability of an intelligent MG are needed to result in a self-healing grid. Initially, the goal is to design a small-scale MG by utilizing five distributed energy sources, e.g., photovoltaic solar energy, wind turbine, diesel generator, fuel cell, and thermal power generation at a local level. Since then, we will gradually increase the target and connect several grids to connect to more large-scale. Eventually, in the end, you will monitor the distributed energy at a large scale, such as in a Smart city. It uses IEDs and controllers, which have interconnection connectivity along with the internal network for real-time communication in the MG. Therefore, it is necessary to analyze the raw data generated by the IED (in this case, the relationship between the sample value and the internal network).
The IEDs, which specifically produce and collect data, are used to monitor and control each distributed energy source. In this case, the IEDs are intelligent transformers, switches, circuit breakers, protection devices, meters, etc. Thousands of analog and digital data points can be available in a single IED. Controllers are used to establish control loops, acquire data, and perform some actuation processes in the IEDs. Additionally, controllers establish communication with multiple controllers. Web and EMS interfaces are for the operators to monitor and control the status of the system. Cluster MGs require a high degree of coordination and knowledge of each macro-grid attribute and the capability of energy exchange among various domains in real-time. Web-based agents can provide coordination through the Internet. Power generation, supply, storage, and conversion units are managed centrally by the EMS controller. EMS ensures all-time power availability by coordinating multiple generation sources and dispatching power according to demand and fuel availability.
CMP belongs to the Software-as-a-Service (SaaS) category of computing services. The most significant advantage of virtualization is that it enables the efficient use of resources such as CPU and memory. Moreover, it allows idle resources to be minimized and management costs (i.e., the application of patches and upgrades) to be reduced by offering centralized administration. In addition, the security level can be enhanced, and the energy consumption of servers can be reduced. Figure 2 shows a real-time cluster service architecture that can monitor and control a distributed microgrid system. The proposed microgrid system is connected by the interconnected network to an IED. In particular, the IED performs the role of periodically collecting the amount of electricity generated and has the characteristic that it can be controlled by the manager. At this time, a real-time data acquisition/control function is required. In this study, a standard protocol using sample value is applied. The large-scale cluster energy service environment utilizes a centrally managed computing environment for large users. In particular, the collection and control of large-scale MG data are through the external network between the controller of one microgrid system and one VM of the system environment. In other words, it is possible to acquire/control MG data through the web and EMS interface. In addition, the proposed design of large-scale MGs is designed through a hierarchical structure: Cluster Microgrid Center (i.e., CMC), Cluster PMC Management Center (i.e., CPMC), PVS Management Center (i.e., PMC), Physical VMG Server (i.e., PVS), and VM for MG (i.e., VMG), and shares data between centers using the internal network.
As shown in Figure 2, the proposed connection networks, such as the control network, internal network, and microgrid service network, are shown. It can be seen that the CMP, including the Web/EMS interface, has each blue microgrid service network and is tied to the green internal network at the same time. In this state, it can be seen that the CMPs associated with each other form several microgrid services (i.e., MG1, MG2… MG6 in this case) in the WAN protocol again.
Furthermore, we use an OpenADR for authorization purposes: an XML-based data format [15] for communication between a controller of MG and VMG. Thus, an underlying service capability must be added, most of which do not handle some of the powerful services like datasets. This implies that existing technologies must be modified for real-time implementation of the IEC protocol and communication. The communication between a controller of MG and VMG exploits EiReport data with OpenADR-based XML data format. EiRegisterParty is required for the registration process to verify the MC’s information and occurs when the MG information is changed. EiReport consists of data for periodic monitoring of MG and IED power production and includes information of (i.e., MC_id, MC_resgion, MC_date, IED_id, IED_type) of MG and IED. EiEvent is a one-time event request, which is composed of data for MG status information. Finally, EiOpt can handle short-term changes using the opt-in and opt-out information on the availability of MG and IED.
Figure 3a shows an illustration of each network required for the IED, Controller, and VMG. Each IED periodically sends sample value data to the controller through the internal network, and MGs send/receive cluster MG data to each VMG through the external network (i.e., WAN). Additionally, the user monitoring and control service remotely communicates with the web protocols. In reference to the standardized protocol defined by IEC 61850 and the inevitable need for it, one of the most special mapping technologies and logical implementations is to implement an infrastructure. The details provided in this paper are used to design a sample value (raw data) based on IEC 61850 for mapping, considering six logical nodes (i.e., LNs). The choice of sampled values is to attain the critical time requirement of data transmission for current transformers (CTs), voltage transformers (VTs), and protective relaying of less than 1 s without complicating the real-time implementation, processing power, and data transmission requirement. Also, Figure 3b shows a sample value data. The abstract models need to be operated over a real set of protocols, into bits and bytes, that are practical to implement. IEC 61850 can be mapped to any protocol. When trying to map objects and services to a protocol that only provides read/write/report services for simple variables that are accessed by register numbers or index numbers, this mapping can get very complex and cumbersome [13]. Time constraint is one of the critical issues for the transmission of sampled values. The proposed design model provides transmission of sampled values in an organized and time-controlled way so that the combined jitter of sampling and transmission is reduced to the degree that an unambiguous allocation of the samples, times, and sequence is provided. The proposed model applies to the exchange of values received from multiple IEDs after A/D conversion. In this case, IED is a cluster-type power device composed of LN (Logical Node) that shows the information of the power device, such as DGEN (Generator LN), MMXU (Alternating Current LN), and YPTR (Transformer LN). In particular, XCBR (Circuit Breaker LN) for IED modeling needs to look at how efficient communication and resource utilization are in different Windows or Linux through simulation. At this time, as mentioned above, the IED is derived based on IEC61850-6. However, since each of these devices is used as an independent resource, a cluster service in units of 1 s through a large-capacity distributed communication model. This IED device is the main product of a substation model that utilizes actual data transformation through simulation in electricity supply companies in Korea. In addition, when IED devices are connected to each other, a power device (Logical Device) is configured, and connection information between these LNs is expressed as a connectivity node and a terminal. A transmission–reception buffer structure is defined for the transmission of the sampled values.
Figure 3 shows that cluster microgrid data configuration from OpenADR which includes EiRegisterParty, EiReport, EiEvent, EiOpt, and Payload. The communication procedure is based on a publisher/subscriber mechanism. First, the publisher shall use the time stamp mechanism to attach a time-stamp for data synchronization. After that, the publisher will send the time-stamped data to transmit the buffer. The sampled value control block in the publisher is used to control the overall communication procedure. The sampled values from the transmit buffer are sent via high-speed Ethernet to the subscriber. The subscriber will receive the sampled values in a receive buffer. After that, sampled value data are sent to the time stamp check mechanism to confirm the time synchronization of the received data.

3.2. Platform Design

Figure 4 shows a diagrammatic representation of SaaS [28,29,30,31,32,33], which is the proposed system based on the cluster MGs platform. At the same time, we are demonstrating the fundamental architecture of our proposed architecture. Here, SaaS consists of the CMC (i.e., Cluster Microgrid Center), CPMC, PMC, PVS, and VMG and shares data between centers using the internal network for CMP. The CMC manages user access for users wanting to use the remote services and connects several CPMCs. The CPMC manages the states of the CPMC and connects the PMC and several PVS. The PVS has the VMGs for running user applications. It should be noted that, in the CMP, a VMG is provided per a controller of MG. The VMG s for users are manually pre-assigned to each server during offline processing by an administrator and managed in the standby mode instead of in the shutdown mode when users terminate cluster microgrids services. In addition, the networks are managed by network separation to ensure stable services [19]. For example, the proposed platform divides the network into an acquisition/control network, cluster management network, and microgrid service network. The massive data acquisition/control is transmitted through the acquisition/control network by using cluster microgrid data. The VMG states are managed through the management network [19,34]. Finally, the web and EMS services are used through the microgrid service network. Our work involved the design of the capacity plan, which focuses on the resources of cluster servers (i.e., PVS) based on CMP.
To determine optimal PVS resources, we first analyzed the utilization of cluster microgrids platform services by defining the workload, the capacity of PVS resources, and the utilization as W, C, and U, respectively, using Equation (1), and this means that the applications (i.e., monitoring and controlling) are running on the PVS for 1 (one) s.
U = W C
In this work, we focus on the CPU, memory, and network utilizations in PVS utilization and represent these utilizations as UCPU, UMEM, and UNET, respectively. Additionally, the workloads and capacities are represented as WCPU, WMEM, WNET, CCPU, CMEM, and CNET, respectively, by using Equation (2). Note that U represents the utilization of a number of applications running on the PVS for 1 s, and thus the capacity planning should be designed to ensure that U is less than 1 (i.e., U ≤ 1) to provide sufficient resources to large-scale users.
U = [ U C P U ,   U M E M , U N E T ] = [ W C P U C C P U ,   W M E M C M E M , W N E T C N E T ]
where, W and C affect U. W depends on the software specifications (i.e., the application workload of the CPU, network bandwidth, and the number of users), and thus we denote the software specifications (i.e., the workload of the CPU and the applications, and the number of applications and users) as APPCPU, APPNET, NAPP, and NUSER, respectively. Both W and C depend on the VMG specifications (i.e.,, the CPU speed, the number of cores, the memory size, the network bandwidth of a VMG, and the number of VMGs) and are represented as VMCPU, VMMEM, VMNET, NVMG, and NMG, respectively, where the number of MGs is equal to the number of VMGs because cluster microgrids services are being used. Finally, C depends on the CMP specifications (i.e.,, the CPU speed, the number of cores, the memory size, the network bandwidth of the servers, and the number of servers); thus, the CMP specifications are represented as PVSCLOCK, PVSCORES, PVSMEM, PVSNET, and NPVS. Figure 5 shows the mapping of the impacts among W, C, and U of the software specifications, VMGs, and CMP.
Prediction of the CPU utilization required us to first analyze the CPU utilization, UCPU, with WCPU, CCPU, and software specifications, VMGs, and the platform, as shown in Figure 5. APPCPU, which executes applications on the PVS and NUSER, affects WCPU. For example, if APPCPU and NMG were to increase, UCPU would also increase. It should be noted that some applications require network resources (e.g., a web browser, video streaming) with the network address translation (NAT) technique [1,2,3,4]. In this case, as the NAT software should be executed for each VMG, these applications require more CPU resources. Therefore, APPNET affects not only WNET, but also WCPU. It should be noted that the CPU impact by APPNET can be neglected by using direct network assignment techniques, for example, Input-Output Virtualization (IOV)) [34], because IOV does not require the CPU workload.
In this mapping of impacts, we can obtain WCPU by using Equation (3) as follows. NAPP denotes the number of applications per user. Note that I( A P P C P U i j ) is an indicator function that has either 0 or 1 as its value. For example, if an application is executed, I( A P P C P U i j ) is 1, otherwise 0. In addition, the CPU impact of APPNET can be neglected by using direct network assignment techniques.
W C P U = i = 1 N M G j = 1 N A P P A P P C P U i j · I ( A P P C P U i j ) + A P P N E T · N V M G  
The utilization prediction model for CPU with direct network assignment techniques was constructed by deriving Equation (4) from Equation (3) by using the probability density function (PDF), where f i , j ( ) , and P i , j [ ] are the probability that user i is active and an application j and a CPU. Maxi,j and Mini,j denote the maximum and minimum amounts of instructions for an application j and a user i in the CPU. These probability density functions depend on a given cluster microgrids environment, and we can use another probability density function according to the cluster microgrids services.
W C P U = i = 1 N V M G { j = 1 N A P P ( M i n i , j M a x i , j b = 0 1 ( a i , j · b i ,   j ) × P i , j [ b i , j ] × f i , j ( a i , j ) d a i j   ) }
In this study, we assume that the density function is uniformly distributed between Mini,j and Maxi,j, and thus (WCPU) is derived as in Equation (5).
W C P U ¯ = i = 1 N V M G j = 1 N A P P { P i   j ( M a x i   j + M i n i   j ) 2 }
The random variable x is covered more than the cumulative distribution function in real situations or problems. For the probability density function f(x) and the interval [a, b], since the random variable X is the slide P(a ≤ X ≤ b) to be included in the interval, it is assumed that the two conditions are satisfied and f(x) 0 for all real values of x, and integral of f(x) dx = 1. Therefore, since these two conditions are satisfied, assuming that the probability distribution has a uniform distribution model within the interval between Mini,j and Mini,j, the answer is 0 (zero). In fact, the workloads are increased as NVMG increases relative to the host servers. In other words, the performance of the VMG is degraded as NVMG increases. To easily explain the equations, we assume that the CPU capacity decreases as NVMG increases.
CPU capacity of a PVS can be represented by the product of PVSCORES and PVSCLOCK. This ratio of server capacity degradation can be obtained by using a pre-experimental test, and it can be predicted by using regression model d(NVMG). We use the polynomial regression model shown in Equation (6). Note that, as d(NVMG) depends on the VMG and CMP specifications, we should obtain the polynomial coefficients by using a pre-experimental test in a given cluster platform environment (i.e., the type of hypervisor being used) at least once. In this work, we determine the ratio of server capacity degradation by using a benchmark program (i.e., OpenSSL-bench [35]), and design the d(NVMG). For example, we set the cluster platform and then measured the CPU performance by increasing NVMG. Finally, we obtain the polynomial coefficients and design the d(NVMG).
d ( N V M G ) = a k n k + a k 1 n k 1 + + a n + a 0
The total CPU capacity of PVS CCPU is represented in Equation (7). Note that because the VMG can be manually assigned to each PVS in cluster microgrid services based on CMP, Equation (7) does not consider load-balancing problems.
C C P U = i = 1 N P S V { d ( N V M G N P S V ) × P S V C O R E × P S V C L O C K } i
There are dynamic and static modes for memory assignment in cluster microgrids platform. The dynamic mode provides for the memory resources to be shared with every VMG, and thus the memory resources can be efficiently used. In contrast, the static mode can provide higher speed and stability than dynamic mode. Thus, we determine the CMP mode as static mode. In this study, we focus on static mode for memory assignment.
Figure 5 shows the correlation of impacts for UMEM. WMEM depends on VMGMEM (i.e., the memory size of a VMG) and NVMG. Moreover, CMEM depends on VMGMEM (i.e., the memory capacity and overhead of the PSV for one VMG execution), SERVERMEM (i.e., the memory size of a server), NVMG, and NSERVER.
In the static mode for memory assignment, WMEM depends on NVMG and VMGMEM, and APPMEM does not affect WMEM in this mode. Therefore, WMEM can be represented as Equation (8).
W M E M = i = i N V M G ( V M M E M ) i
Because the servers require memory for VMG executions, the total memory capacity CMEM depends on VMGMEM. Therefore, CMEM is represented as Equation (9). Note that VMMEM can be obtained by conducting a pre-experimental test in the given PVS environment at least once.
C M E M = P V S M E M · N P V S V M M E M · N V M G
In these correlations of impacts, we can obtain WNET by using Equation (10) as follows.
W N E T = i = 1 N V M G j = 1 N A P P A P P N E T i j · I ( A P P N E T i j ) + V M N E T · N V M G
The utilization prediction model for network separation is constructed by deriving Equation (11) from Equation (10) by using the probability density functions, which we denote as f i , j ( ) and P i , j [ ] , respectively. These probability density functions depend on a given cluster microgrid environment, and we can use another probability density function depending on the cluster microgrid services.
W N E T = i = 1 N V M G { j = 1 N A P P ( M i n i , j M a x i , j b = 0 1 ( a i , j · b i ,   j ) × P i , j [ b i , j ] × f i , j ( a i , j ) d a i j   ) }
In this study, we assume that f i , j ( ) is uniformly distributed between Mini,j and Maxi,j, and thus W N E T ¯ is derived as Equation (12) as follows.
W N E T ¯ = i = 1 N V M G j = 1 N A P P ( P i   j ( M a x i   j + M i n i   j ) 2 )
It should be noted that VMNET is negligible according to the network separation for a cluster microgrids platform network [13]. Therefore, VMNET can be represented as Equation (13).
C N E T = P V S N E T × N P V S
In this section, we describe the configuration of cluster microgrids platform for the large-scale distributed energy system. In fact, to provide cluster microgrid services for these users, we can increase the capacity of PVS by either extending the number of servers or improving the PVS architecture platforms. Efficient configuration of cluster microgrids platform requires us to find a way to determine the optimal PVS configuration (i.e., CMP specifications) in a given large-scale cluster microgrids service environment (i.e., software and VMG specifications) with high utilization (i.e., U ≤ 1). Here, we propose a greedy approach to find the optimal CMP specifications for high utilization in the given software and VMG specifications.
In CMP, each PVS device has limited performance. Therefore, we should specify the possible maximum capacity values for each device and denote them as CLOCKMAX, COREMAX, MEMMAX, and NETMAX. In addition, we obtain the ratio of PVS capacity degradation and the memory overhead required for executing one VMG on a server by using a pre-experimental test (i.e., d(NVMG) and VMMEM). WCPU, WMEM, and WNET are calculated by using Equations (4), (7) and (10), and then the CMP specifications are set up as the minimum value (i.e., =1). Finally, we find the optimal configuration parameters by increasing PVSCORE, PVSCLOCK, PVSMEM, PVSNET, and NPVS such that U ≤ 1 (i.e., UCPU ≤ 1, UMEM ≤ 1, and UNET ≤ 1). Algorithm 1 shows the method that allows the optimal CMP configuration (i.e., CMP specifications) to be found.
Algorithm 1 Finding optimal cluster platform configuration and parameters
1: Limited PVS devices specifications parameters initialize
2:CLOCKMAX ← INIT; COREMAX ← INIT;
3:MEMMAX ← INIT; NETMAX ← INIT;
4:
5:Pre-experimental test parameters initialize
6:d(NVMG) ← INIT;
7:VMMEM ← INIT;
8:
9:W initialize with Software and VMG specifications
10:WCPU ← INIT;//Equation (5)
11:WMEM ← INIT;//Equation (8)
12:WNET ← INIT;//Equation (10)
13:
14:C initialize with VMG specification and limited CMP specifications
15:PVSCORE ← 1; PVSCLOCK ← 1; PVSMEM ← 1; PVSNET ← 1; NPVS ← 1;
16:CCPU ← INIT;//Equation (7)
17:CMEM ← INIT;//Equation (9)
18:CNET ← INIT;//Equation (11)
19:
20: LOOP(UCPU >1)
21: LOOP (COREMAX ≥ PVSCORE)
22:CORE++
23: LOOP (CLOCKMAX ≥ PVSCLOCK)
24:PVSCLOCK ++
25:CCPUd(NVMG/NPVS) × PVSCORE × PVSCLOCK× NPVS
26:UCPU W C P U C C P U  
27:NPVS ++
28:
29: LOOP (UMEM > 1)
30: LOOP (MEMMAX ≥ PVSMEM)
31:PVSMEM ++
32:CMEMPVSMEM × NPVS × NMG
33:UMEM W M E M C M E M
34:NSERVER ++
35:
36: LOOP (UNET > 1)
37: LOOP (NETMAX ≥ PVSNET)
38:PVSNET++
39:CNETPVSNET × NPVS
40:UNET W N E T C N E T
41:NPVS ++
42:
43: FINDPVSCORE, PVSCLOCK, PVSMEM, PVSNET, and NPVS

4. Results

4.1. Test Environments
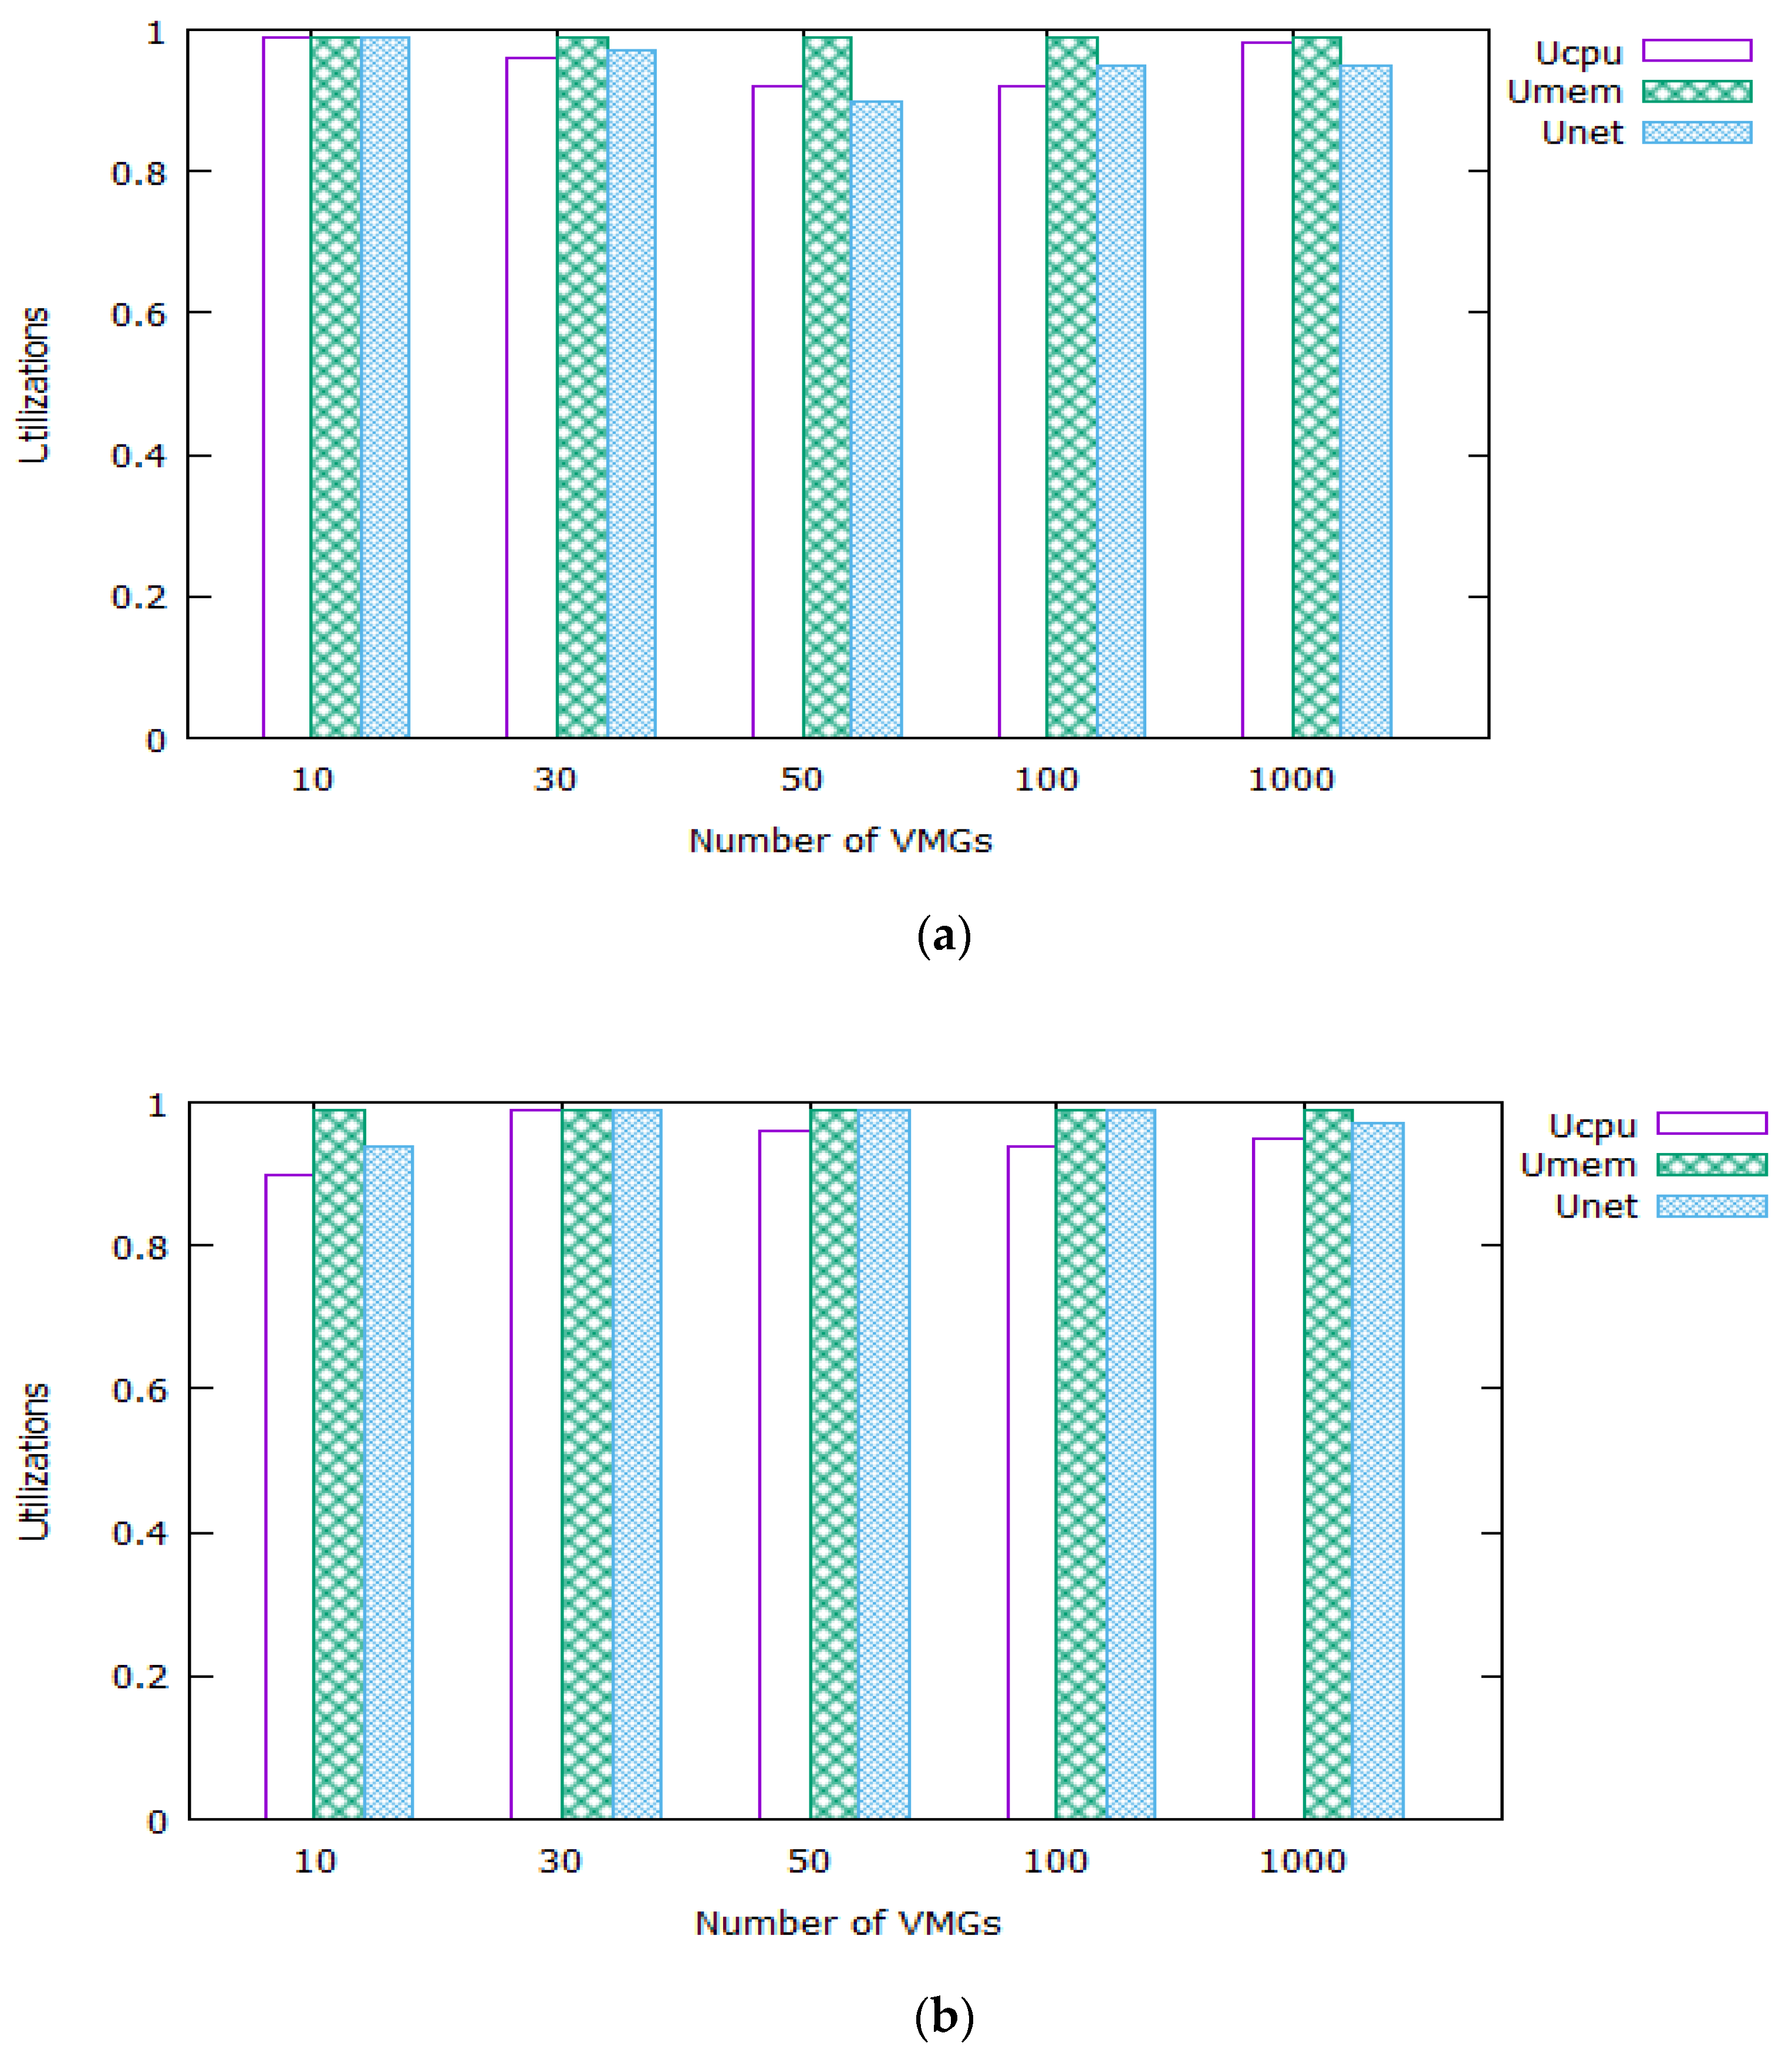
We configured an experimental environment that would enable us to use the utilization analysis to evaluate the utilization prediction model for the cluster microgrids platform, as shown in Figure 6. We first measured the utilization of cluster microgrids platform systems with the various events (i.e., applications and the number of IEDs and MGs).
We used two servers for the cluster microgrids platform, which are summarized in Table 1. The CPU clock, memory size, and network bandwidth were 2.7 GHz, 396 GB, and 1 GB, respectively, in both servers. Furthermore, we configured the hypervisor as Linux [22,23]. In PVS 1, the number of cores was 24, and a Windows VMG was used. For example, the operating system is Windows 7, the CPU setup is 2.7 GHz, 1 core, and RAM is 2 GB. PVS 2 consisted of 20 cores, and a Linux VMG was used. In this case, OS is Linux, the CPU setup is 2.7 GHz, 1 core, and RAM is 500 MB.
We used four application programs. For example, a word processor, web service, video streaming service, and download service), which are summarized in Table 1, to execute on the PVSs.
Furthermore, the effectiveness of the integrated information model for microgrids was tested using the tool of the electric power company developed in Korea to test the effectiveness of the distributed system. It was verified that there was no error using the service tool. At this time, the distributed information model verification tool developed by the electric power company is named jCleanCIM, and it is a method of verifying validity in conjunction with Enterprise Architect, an official modeling tool of IEC TC57 [35].

4.2. Validation

We investigate the proposed design system that can collect data from several IEDs within one MG using sample values (i.e., raw data). In addition, we can verify the implementation of large-scale distributed processing by calculating the efficiency and productivity by experimenting with MG (same as VMG). For example, controller data such as MG1, MG2, and MG3 may be transmitted through the external network of each bus linked to the cluster management network (as shown in Figure 4), and the number of IED and MG generated can be checked in real-time. The sample value and cluster MG data are transmitted from the IED to the controller and from the controller to VMG, and it can be an important point to monitor for load utilization. Figure 7 shows an example of cluster microgrid monitoring with a web service.
Table 2 shows the test environments with increasing data size of each resources. The data size of the sample value and latency depends on the number of IEDs. Table 3 shows the data size and latency of the sample value as the number of IEDs increases. When the IED was 1, the data size was 100 bytes, and the data latency through the internal network was 0.1 s. When the number of IEDs is 20, 40, 100, or 200, the data sizes were 2 KB, 4 KB, 10 KB, and 20 KB, and the latency of each was 0.1 s, 0.1 s, 0.2 s, and 0.2 s, respectively. Therefore, it can transmit sample values in real-time within 1 s.
Table 4 shows Latency cluster microgrid protocols through an acquisition/control network. The data size and latency of a cluster microgrid increase as the number of MGs increases. Additionally, because the data of one MG includes sample data transmitted from the internal IED, it increases according to the number of IEDs. In this study, we assumed that the number of IEDs was 200 for the worst case. In this case, the data size for one cluster microgrid was 60 MB (i.e., 60 × 5 × 200 KB), and the latency was 7 s.
Moreover, when the number of MGs was increased to 5, 10, and 20, the data sizes of the cluster microgrid were 300 MB, 600 MB, and 1200 MB, and the latencies were 37 s, 91 s, and 171 s, respectively. It should be noted that MG sends cluster microgrid data every 5 min. Therefore, we confirmed that the cluster microgrid can be transmitted in real-time because the measured latency does not exceed 5 min. Until now, it is possible to experiment in seconds, but we still use data as a protocol every 5 min.

5. Discussion

First, to find the ratio of server capacity degradation as the number of VMGs increases, we measured the performance of a benchmark program (i.e., OpenSSL benchmark [35]) on two PVSs. In this case, the need to expand the scope of the microgrid comes out and can be a University campus or hospital. For example, considering the capital, tens of thousands of University campuses and hospitals are essential. Through this paper, we looked at how important resource allocation is among the second or minute-unit constraints for each resource in a large-capacity distributed system. This study can be said to have taken a fundamental approach to whether resource management, such as electricity production, is a large-capacity distributed system rather than an intermediate step. If the second-unit cluster service of each resource is not properly checked, it is difficult to realize it as a standard microgrid. We actually proposed a large-scale approach to distributing energy, and we included latency in our experiments to address the underlying problem. In the end, scalability and real-time are very important factors for real-time communication in microgrid clusters to finally go to the smart city.
Therefore, Figure 8 shows the normalized CPU and Memory capacity of each PVS with increased VMs. We normalized the capacity of a server based on one VMG execution on a PVS. As seen in Figure 8, we found PVS 2 to degrade the utilization of CPU and memory more than PVS 2. The reason was that the Windows VMG required extensive CPU and memory resources owing to its GUI environment.
These results enabled us to obtain the ratio of performance degradation (i.e., d(NVMG)) for an increasing NVMG, as shown in Table 3. It should be noted that we conducted the d(NVMG) as a cubic regression model. In addition, VMMEM was constant.
We evaluated the utilization prediction model accuracy by comparing the estimated and measured utilization (i.e., UCPU, UMEM, and UNET).
Figure 9a,b compare the measured and estimated utilization of PVS 1 and PVS 2, respectively. To estimate the utilization, we also assumed that the applications are executed on each VMG. The results show that, although the variation in the measured utilization was larger than that of the estimation due to other factors, such as background software for operating systems, we confirmed that the estimations are sufficient to configure the optimal CMP specifications with this utilization prediction model for the given the software and VMG specifications.
We used capacity analysis to evaluate the simulation results by using the software and VMG specifications to configure the CMP specifications. We used four applications (i.e., Sample Value protocols, Web service, EMS service, Cluster microgrid protocols, and VMG managements) and two different VMGs (i.e., Windows and Linux). In addition, we specified the maximum possible value for each device, for which CLOCKMAX, COREMAX, MEMMAX, and NETMAX are 2.7 GHz, 24, 396 GB, and 128 MB (i.e., 1 Gbps), respectively. Table 5 shows that server capacity degradation parameter of CPU and memory, respectively. Table 6 shows the optimal CMP specifications (i.e., PVSCORES, PVSCLOCK, PVSMEM, PVSNET, and NPSV) for Windows VMG and Linux VMG for an increasing number of users by using the utilization prediction model. Note that the Windows VMG requires more platform resources than the Linux VMG, and thus NSERVER for the Linux VMG was less than that for the Windows VMG.
Through this, model dependencies, system design rules, potential errors, and illegal/redundant UML notation were verified. Figure 10 is an open-source tool that supports the validation of modeling results directly from the power company of distributed power generation. Figure 10a is the case of Cross package links: 254 inheritance (no error), and Figure 10b Package to Package Dependency: 23 inheritance (no error). Figure 10c shows the Class’s attribute types: 198 (no error), and Figure 10d Class to class associations: 398 (no error).
Finally, we used the optimal CMP specifications and utilization prediction model for the given software and VMG specifications for the simulation. Figure 10 shows each of the average utilizations (i.e., UCPU, UMEM, and UNET) with the optimal CMP specifications. One PVS can provide sufficient resources to users (i.e., fewer than 100 VMGs), and several servers can also average sufficient resources to large-scale users (i.e., more than 1000 VMGs). The CPU ranged from 0.9 to 0.98, while each VMG increased from 10 to 1000, as described. On the other hand, under the same conditions, the memory indicated almost 100% utilization from 0.98 to 1. Lastly, the network utilization rate was at least 0.96 and peaked at 1. Figure 11a shows the result of testing on the Windows system, and Figure 11b shows the result of testing the microgrid with different platforms on Linux. In this case, the proposed approach can provide sufficient resources to large-scale users with the optimal configuration of CMP at less than 100% utilization. It should be noted that we can either add or change specifications; thus, alternative optimal CMP configurations can be achieved. Therefore, the proposed approach can help many vendors provide sufficient resources to large-scale users with the optimal configuration of the CMP.

6. Conclusions

To provide a seamless monitoring environment, the real-time services and optimal resource allocation technology of large-scale environments are important. In this study, we proposed two techniques for real-time monitoring and optimal resource allocation for a large-scale energy system.
In particular, to configure a CMP for real-time service, we analyzed a data transmission rate and utilization from the IED of the terminal, collecting the power production data to the individual microgrid controller (MG). The details provided in this paper were used to design a sample-value-based smart grid protocol based on IEC 61850 for mapping, considering six logical nodes (LNs) with the possibility of further extension. The choice of sampled values was to attain the critical time requirement of data transmission for the current transformers (CT), voltage transformers (VT), and protective relaying of less than 1 s without complicating the real-time implementation and processing power. Furthermore, in this study, a way to determine the optimal number of physical resources (i.e., CPU, memory, and network) for a given cluster of testing environments was proposed.
In this paper, we constructed a test set of experiment and verified the proposed method through simulation. When the number of virtual microgrids was increased to 5, 10, and 20, the data sizes of the cluster microgrid were 300 MB, 600 MB, and 1200 MB, and the latencies were 37 s, 91 s, and 171 s, respectively. It should be noted that microgrids send CMP data every 5 min. Therefore, we confirmed that the CMP can be transmitted in real-time because the measured latency does not exceed 5 min. Based on the experimental results, the VMG was tested on the Windows and Linux systems of the distributed information model for CPU, memory, and network, which are physical resources, respectively. The lowest CPU showed 96% utilization, and the highest memory utilization was 100%. Therefore, we confirmed that CMP with real-time communication protocols and optimal configuration can provide a seamless monitoring service without exceeding 100% utilization.

Author Contributions

T.J. developed the overall idea and concept, and S.L. was in charge of data curation and visualization. The overall project was explored and formal analysis was conducted. All authors have read and agreed to the published version of the manuscript.

Funding

This work was supported by a research grant from Hallym University in 2022(HRF-202203-004).

Conflicts of Interest

The authors declare no conflict of interest.

References

  1. Rajeev, T.; Ashok, S. A cloud computing approach for power management of micro-grids. In Proceedings of the International Conference on Innovative Smart Grid Technologies, Kollam, India, 1–3 December 2011; pp. 49–52. [Google Scholar]
  2. Cintuglu, M.; Mohammed, O. Multiagent-based decentralized operation of microgrids considering data interoperability. In Proceedings of the 2015 IEEE International Conference on Smart Grid Communications (SmartGridComm), Miami, FL, USA, 2–5 November 2015; pp. 404–409. [Google Scholar]
  3. Cintuglu, M.; Mohammed, O.; Akkaya, K.; Uluagac, A. A survey on smart grid cyber-physical system testbeds. IEEE Commun. Surv. Tutor. 2017, 19, 446–464. [Google Scholar] [CrossRef]
  4. Yang, C.; Chen, W.; Huang, K.; Liu, J.; Hsu, W.; Wsu, C. Implementation of smart power management and service system on cloud computing. In Proceedings of the 2012 9th International Conference on Ubiquitous Intelligence and Computing and 9th International Conference on Autonomic and Trusted Computing, Fukuoka, Japan, 4–7 September 2012; pp. 924–929. [Google Scholar]
  5. Markovic, D.S.; Zivkovic, D.; Branovic, I.; Popovic, R.; Cvetkovic, D. Smart power grid and cloud computing. Renew. Sustain. Energy Rev. 2013, 24, 566–577. [Google Scholar] [CrossRef]
  6. Yigit, M.; Gungor, V.C.; Baktir, S. Cloud computing for smart grid applications. Comput. Netw. 2014, 70, 312–329. [Google Scholar] [CrossRef]
  7. Bera, S.; Misra, S.; Rodrigues, J. Cloud computing applications for smart grid: A survey. IEEE Trans. Parallel Distrib. Syst. 2015, 26, 1477–1494. [Google Scholar] [CrossRef]
  8. Jian, M.-S.; Chen, Y.-L.; Tong, R.-W.; Lin, Y.-H.; Cheng, C. Various green energy sources in smart grid power network based on cloud. In Proceedings of the 2017 19th International Conference on Advanced Communication Technology (ICACT), PyeongChang, Republic of Korea, 19–22 February 2017; pp. 660–663. [Google Scholar]
  9. Brusco, G.; Burgio, A.; Menniti, D.; Pinnarelli, A.; Sorrentino, N.; Scarcello, L. An energy box in a cloud-based architecture for autonomous demand response of prosumers and prosumages. Electronics 2017, 16, 98. [Google Scholar] [CrossRef] [Green Version]
  10. Simmhan, Y.; Aman, S.; Kumbhare, A.; Liu, R.; Stevens, S.; Zhou, Q.; Prasanna, V. Cloud-based software platform for big data analytics in smart grids. IEEE Comput. Sci. Eng. 2013, 38–47, 1–10. [Google Scholar] [CrossRef]
  11. Boroojeni, K.; Amini, M.H.; Nejadpak, A.; Dragicevic, T.; Iyengar, S.S.; Blaabjerg, F. A Novel Cloud-Based Platform for Implementation of Oblivious Power Routing for Clusters of Microgrids. IEEE Access 2016, 5, 607–619. [Google Scholar] [CrossRef]
  12. Yaghmaee, M.H.; Leon-Garcia, A.; Moghaddassian, M. On the Performance of Distributed and Cloud-Based Demand Response in Smart Grid. IEEE Trans. Smart Grid 2018, 9, 5403–5417. [Google Scholar] [CrossRef]
  13. Clavel, F.; Savary, E.; Angays, P.; Vieux-Melchior, A. Integration of a new standard: A network simulator of IEC 61850 architectures for electrical substations. IEEE Ind. Appl. Manag. 2014, 21, 41–48. [Google Scholar] [CrossRef]
  14. Yang, L.; Crossley, P.A.; Wen, A.; Chatfield, R.; Wright, J. Design and performance testing of a multivendor IEC61850–9-2 process bus based protection scheme. IEEE Trans. Smart Grid 2014, 5, 1159–1164. [Google Scholar] [CrossRef]
  15. Open ADR Appliance. Available online: https://www.openadr.org/specification (accessed on 1 February 2021).
  16. Arefifar, S.; Mohamed, Y.; El-Fouly, T. Optimized multiple microgrid-based clustering of active distribution systems considering communication and control requirements. IEEE Trans. Ind. Electronics 2015, 62, 711–723. [Google Scholar] [CrossRef]
  17. Guerrero, J.M.; Loh, P.C.; Chandorkar, M.; Lee, T.-L. Advanced control architectures for intelligent microgrids—Part I: Decentralized and hierarchical control. IEEE Trans. Ind. Electron. 2013, 60, 1254–1262. [Google Scholar] [CrossRef] [Green Version]
  18. Bevrani, H.; Shokoohi, S. An intelligent droop control for simultaneous voltage and frequency regulation in islanded microgrids. IEEE Trans. Smart Grid 2013, 4, 1505–1513. [Google Scholar] [CrossRef]
  19. Xu, X.; He, G.; Zhang, S.; Chen, Y.; Xu, S. On functionality separation for green mobile networks: Concept study over LTE. IEEE Commun. Mag. 2013, 51, 82–90. [Google Scholar] [CrossRef]
  20. Mitra, T. Heterogeneous multi-core architectures. Inf. Media Technol. 2015, 10, 383–394. [Google Scholar] [CrossRef] [Green Version]
  21. Taylor, C.N.; Dey, S.; Panigrahi, D. Energy/latency/image quality tradeoffs in enabling mobile multimedia communication. In Software Radio; Springer: London, UK, 2001; pp. 55–66. [Google Scholar]
  22. Chung, Y.; Lee, S.; Jeon, T.; Park, D. Fast video encryption using the H. 264 error propagation property for smart mobile devices. Sensors 2015, 15, 7953–7968. [Google Scholar] [CrossRef] [Green Version]
  23. Lee, S.; Jeong, T. Forecasting Purpose Data Analysis and Methodology Comparison of Neural Model Perspective. Symmetry 2017, 9, 108. [Google Scholar] [CrossRef]
  24. Calyam, P.; Rajagopalan, S.; Seetharam, S.; Selvadhurai, A.; Salah, K.; Ramnath, R. Design and Verification of Virtual Desktop Cloud Resource Allocations. Comput. Netw. 2014, 68, 110–122. [Google Scholar] [CrossRef]
  25. Calheiros, R.; Ranjan, R.; Beloglazov, A.; Rose, C.; Buyya, R. CloudSim: A toolkit for modeling and simulation of cloud computing environments and evaluation of resource provisioning algorithms. Softw. Pract. Exp. 2010, 41, 24–50. [Google Scholar] [CrossRef]
  26. Garg, S.K.; Buyya, R. NetworkCloudSim: Modelling parallel applications in cloud simulations. In Proceedings of the 2011 Fourth IEEE International Conference on Utility and Cloud Computing, Melbourne, VIC, Australia, 5–8 December 2011; pp. 105–113. [Google Scholar]
  27. Kliazovich, D.; Bouvry, P.; Audzevich, Y.; Khan, S. GreenCloud: A packet-level simulator of energy-aware cloud computing data centers. In Proceedings of the IEEE GLOBECOM; IEEE: New York, NY, USA, 2010; pp. 1–5. [Google Scholar]
  28. Jrad, F.; Tao, J.; Streit, A. Simulation-based evaluation of an intercloud service broker. Proceedings of 3rd International Conference of Cloud Computing, GRIDs Virtualization, Nice, France, 22–27 July 2012; pp. 140–145. [Google Scholar]
  29. Castane, G.; Nunez, A.; Carretero, J. CanCloud: A Brief Architecture Overview. In Proceedings of the 2012 IEEE 10th International Symposium on Parallel and Distributed Processing with Applications, Leganes, Spain, 10–13 July 2012; pp. 853–854. [Google Scholar]
  30. Casanova, H.; Legrand, A.; Quinson, M. SimGrid: A Generic Framework for Large-Scale Distributed Experiments. In Proceedings of the 10th IEEE International Conference on Computer Modeling and Simulation, Cambridge, UK, 1–3 April 2008. [Google Scholar]
  31. Buyya, R.; Murshed, M. GridSim: A toolkit for the modeling and simulation of distributed resource management and scheduling for grid computing. Concurr. Comput. Pract. Exp. 2002, 14, 1175–1220. [Google Scholar] [CrossRef]
  32. Garg, S.K.; Toosi, A.N.; Gopalaiyengar, S.K.; Buyya, R. SLA-based virtual machine management for heterogeneous workloads in a cloud datacenter. J. Netw. Comput. Appl. 2014, 45, 108–120. [Google Scholar] [CrossRef]
  33. Graziano, C. A Performance Analysis of Xen and KVM Hypervisors for Hosting the Xen Worlds Project. Master’s Thesis, in Graduate Theses and Dissertations, Paper 12215. Iowa State University, Ames, IA, USA, 2011. [Google Scholar]
  34. OpenSSL. Available online: https://www.openssl.org/ (accessed on 1 February 2020).
  35. IEC 62357: TC57. Architecture, Reference Architecture for Power System Information Exchange, Second Edition Draft Revision 6. International Electrotechnical Commission: Geneva, Switzerland, 2011.
Figure 1. Configuration of a large-scale distributed system, along with VMG, and Web/EMS service.
Electronics 11 04037 g001
Figure 2. Proposed design system architecture of real-time cluster services.
Electronics 11 04037 g002
Figure 3. Large-scale distributed system configuration; (a) Data transmission requirement; (b) Sample value data configuration; (c) Cluster microgrid data configuration.
Electronics 11 04037 g003
Figure 4. Proposed real-time architecture design.
Electronics 11 04037 g004
Figure 5. Mapping of impacts among W, C, and U.
Electronics 11 04037 g005
Figure 6. Measurements of the utilization of real-time cluster microgrid platform.
Electronics 11 04037 g006
Figure 7. Cluster microgrid monitoring with web service: (a) IED surveillance system; (b) MG monitoring systems.
Electronics 11 04037 g007
Figure 8. Performance of CPU and memory with an increasing number of VMGs: (a) Performance of PVS 1 with an increasing number of Windows VMGs; (b) Performance of PVS 2 with an increasing number of Linux VMGs.
Electronics 11 04037 g008
Figure 9. Comparison of measured and estimated utilization: (a) Utilization of PVS 1 (left: measured, right: estimated); (b) Utilization of PVS 2 (left: measured, right: estimated).
Electronics 11 04037 g009
Figure 10. Simulation results of distributed microgrid information distributed model (a) Cross package links: 254 inheritance (no error) (b) Package to Package Dependency: 23 inheritance (no error) (c) Class’s attribute types: 198 (no error) (d) Class to class associations: 398 (no error).
Electronics 11 04037 g010
Figure 11. Average utilization (UCPU, UMEM, and UNET) with optimal CMP configuration: (a) Simulation results on Windows distributed platform; (b) Simulation results on Linux distributed platform.
Electronics 11 04037 g011
Table 1. PVSs for cluster platform.
PVS1PVS2
CMP
specifications
CPU: 2.7 GHz, 24 cores
RAM: 396 GB
Network: 1 GB
Hypervisor: Linux (KVM)
CPU: 2.7 GHz, 20 cores
RAM: 396 GB
Network: 1 GB
Hypervisor: Linux (KVM)
VMG
specifications
OS: Windows 7
CPU: 2.7 GHz, 1 core
RAM: 2 GB
OS: Linux
CPU: 2.7 GHz, 1 core
RAM: 500 MB
Table 2. Test environments.
CPU
(Amount of
Instructions × 106)
Memory
(MB)
Network
(KB)
Sample value protocols10~7030~2000.1~20
Cluster microgrid protocols10~7074~1503~6000
Web and EMS services20~304~2510~300
VMG managements20~3074~16050
Table 3. Latency sample value through a Large-scale distributed system.
# of IDE2040100200
Data size of sample values2 KB4 KB10 KB20 KB
Latency0.1 s0.1 s0.2 s0.2 s
Table 4. Latency cluster microgrid through Large-scale distributed system.
# of MG151020
Data size of
cluster microgrid
60 MB300 MB600 MB1200 MB
Latency7 s37 s91 s171 s
Table 5. Server capacity degradation parameters of CPU and MEM.
d(NVMG)VMGMEM
(GB)
a3a2a1a0
PVS 1−7.0 × 10−71.2 × 10−5−7.3 × 10−30.9200
PVS 2−2.0 ×10−74.5 × 10−6−3.9 × 10−31.020
Table 6. Optimal CMP Specifications with KVM Hypervisor.
# of VMGsCMP Specifications
(PVSCORES, PVSCLOCK, PVSMEM, PVSNET,
AND NPVS)
Windows System VMGLinux System VMG
102, 2.7 GHz, 23 GB, 13 MB, 12, 2.7 GHz, 5 GB, 13 MB, 1
305, 2.7 GHz, 67 GB, 41 MB, 14, 2.7 GHz, 15 GB, 41 MB, 1
508, 2.7 GHz, 110 GB, 61 MB, 17, 2.7 GHz, 255 GB, 61 MB, 1
10018, 2.7 GHz, 221 GB, 115 MB, 115, 2.7 GHz 51 GB, 115 MB, 1
100024, 2.7 GHz, 246 GB, 125 MB, 1024, 2.7 GHz, 72 GB, 125 MB, 9
Publisher’s Note: MDPI stays neutral with regard to jurisdictional claims in published maps and institutional affiliations.

