1. Introduction
As the infrastructure at the lowest level of society, logistics not only connects production and consumption, but also supports the pillar industries and advantageous industries of the city. Recently, the rapid popularity of online shopping has significantly promoted the development of the logistics service industry. Logistics services, which are indispensable parts of online shopping, are directly related to customer satisfaction and influence purchase intentions [
1,
2]. To focus on improving their own service level and attracting more consumers, many e-commerce enterprises usually outsource their logistics services to third-party enterprises because they are not core competitive. However, consumers tend to regard the entire process of online shopping as a whole, and their attitude towards the quality of logistics services directly affects their attitudes towards the service and commodity quality, thereby affecting the sales of commodities [
3]. Consumers’ attitudes towards logistics service quality have become an important factor affecting the development of e-commerce.
In the current field of logistics services, competition among logistics service enterprises has been very fierce, and the price standard of logistics services gradually tends to be consistent. Choosing an express company with high service quality is a primary concern for consumers [
4,
5]. To provide a reliable reference for consumers, most e-commerce platforms focus on users’ feedback on the quality of delivery services. Most studies allow users to score the quality of logistics services by constructing relevant evaluation index systems. The quality level of the relevant logistics service can be evaluated, and reasonable logistics services are recommended for consumers by analyzing users’ scores based on the index evaluation model [
6,
7,
8,
9]. However, the quality of logistics services involves many aspects, and different users may have different experiences. The scoring-mechanism-based evaluation system can only score and evaluate the quality of a logistics service. However, it is difficult to describe the advantages and disadvantages of users in terms of specific aspects.
Sentiment analysis, also known as opinion mining and propensity analysis, is an important branch of natural language processing. The main task of sentiment analysis is to help people obtain, sort out, and analyze relevant comment information using computer resources, as well as analyze, process, induce, and reason about subjective text information with emotional color [
10]. Methods based on sentiment analysis have been applied to social networks [
11], e-commerce [
12], online public opinion analysis [
13], and many other areas. In the field of logistics services, e-commerce platforms have accumulated various user evaluation information on the quality of logistics services. Most reviews describe various aspects of logistics services in text format, which can correctly reflect the quality of the logistics service. Manual processing of such large-scale information is difficult; thus, an automated machine analysis method must be adopted. With the help of sentiment analysis technology, sentiment characteristics of reviews on logistics service quality can be extracted to help the platform analyze users’ attitudes towards logistics services in different aspects and describe logistics service quality. This method is greatly significant in helping users choose high-quality logistics services and improving the service levels of enterprises.
This study proposes a sentiment-analysis-based logistics service quality evaluation model. An evaluation index system for logistics service quality based on the characteristics of logistics service review information is proposed. The mapping relationship between the sentiment characteristics of reviews and the index system is established to implement the multi-faceted sentiment classification of reviews and then implement the evaluation of various indices by extracting the sentiment characteristics of logistics service quality reviews. In addition, we developed detailed methods to solve the problem of sentiment intensity analysis and index weight calculation. The main contributions of this study are as follows:
- (1)
This study proposes a sentiment-analysis-based logistics service quality evaluation model. The model uses sentiment analysis as the core method for evaluating quality of service. The mapping relations between sentiment features and the evaluation index system are established by extracting sentiment features from user reviews. The proposed model solves the problem of sentiment classification in various aspects of the reviews and the problem of sentiment analysis with different indices.
- (2)
An improved logistics service quality evaluation index system is proposed. In the improved evaluation system, some indicators from the original evaluation system, such as service reliability, service responsiveness, and service empathy, are reserved. Meanwhile, the tangibility of the service is replaced by the standardization of the logistics service, and the assurance of the logistics service is replaced by the credibility of the logistics service. This improvement is more in line with the characteristics of user demand for logistics service quality, and the evaluation index can comprehensively cover the quality of logistics services.
- (3)
This study proposes an algorithm for sentiment feature extraction from user reviews. The sentiment feature extraction algorithm for reviews is directly related to the accuracy of sentiment analysis. We collected publicly available datasets, and experimental studies show that both the recall and accuracy of the proposed algorithm are considerably high.
The remainder of this paper is organized as follows:
Section 2 presents the related work on smart cities, service quality evaluation related to express, and logistics. In
Section 3, we describe our logistics service quality evaluation model based on sentiment analysis.
Section 4 presents the simulation results and analysis of the accuracy of the proposed model.
Section 5 concludes the research and discusses the possible future work.
2. Related Works
Smart logistics is the nerve ending of smart cities; it can realize the reuse of idle resources and the comprehensive allocation of resources across functions and industrial chains in the ecology of cities, communities, and industrial clusters. Logistics, highways, and wharves are the infrastructure of the country [
14,
15]. Existing methods to evaluate logistics service quality or smart logistics focus on mathematical statistics, analytic hierarchy processes, and review text analysis.
2.1. Mathematical Statistics-Based Methods
Mathematical statistics-based methods are used to evaluate service quality. It generally adopts a questionnaire survey using mathematical statistical methods to perform statistics and analysis of the sample data. Therefore, factors that affect the quality of logistics services can be determined. Parmata et al. [
16] developed a scale based on Parasuraman’s SERVQUAL scale for the measurement of distributor-perceived service quality at the distributor–manufacturer interface of the pharmaceutical supply chain. They designed a questionnaire based on SERVQUAL, a widely used service quality measurement scale. A personal survey was conducted among selected distributors across three major cities in the Indian pharmaceutical market. The study used an exploratory factor analysis approach to identify the critical factors of service quality, followed by confirmatory factor analysis. Stević et al. [
17] presented an original integrated model for measuring RL service quality of reverse logistics. A modified SERVQUAL model was used to measure the service quality of logistics using an original questionnaire with a total of 21 statements arranged in five standard dimensions. Luyen et al. [
18] combined fuzzy theory and the multi-criteria decision-making model for the evaluation and selection of potential third-party logistics providers. They developed a comprehensive approach to assess the quality of the logistics service industry. The combined method of the SERVQUAL and FAHP–TOPSIS models provides reasonable results and allows decision makers to visualize the impact of different criteria on the outcome. Wang et al. [
19] used the Pythagorean fuzzy set as an efficient mathematical tool to capture indeterminacy. They explored various interactive Hamacher power aggregation operators for Pythagorean fuzzy numbers and presented Pythagorean fuzzy interactive Hamacher power aggregation operators.
The SERVQUAL model has been widely used in the service industry to understand the service needs and perceptions of target customers and to provide enterprises with a set of methods to manage and measure service quality. The latest research shows that the SERVQUAL models have high accuracy in service quality evaluation that involves users’ feedback. For example, the model is used to evaluate the service quality of the reverse logistics channels [
20], medical services [
21], and many other domains [
22]. Thus, we establish the logistics service quality evaluation index system based on the improved SERVQUAL model.
2.2. Analytic Hierarchy-Based Methods
The analytic hierarchy process (AHP) completes the quantitative analysis of the qualitative index by constructing a set of multilevel evaluation index systems. In logistics service quality evaluation, there is a deep analysis of the factors affecting the quality of logistics services and their internal relations. AHP uses less quantitative information on logistics services to make the quality evaluation process more mathematical. This method can provide a simple approach for complex decision-making problems with multi-objective, multi-criteria, or no structural characteristics.
Lou et al. [
23] constructed an index-based evaluation system for the service quality of the express delivery industry through market investigation and data analysis. This system applies AHP to survey expert options and obtain index weights using the fuzzy comprehensive evaluation method. Fu et al. [
24] analyzed the key influencing factors of the service quality of crowdsourcing logistics and constructed a crowdsourcing logistics service quality evaluation index system with four first-level indices and fifteen s-level indices based on the AHP and entropy weight method. Bakır et al. [
25] evaluated e-service quality in the airline industry from the consumers’ perspective. They presented an integrated fuzzy analytical hierarchy process (F-AHP), and the fuzzy measurement alternatives and ranking according to compromise solution (F-MARCOS) approach was proposed to handle the uncertain and imprecise nature of e-service evaluation. Alkharabsheh et al. [
26] applied a more sophisticated measure of group agreement than the rank correlation. They used FAHP to determine the aggregated weights and then computed the Kendall correlation values to reveal stakeholder opinions.
2.3. Sentiment-Analysis-Based Methods
Sentiment analysis, also known as opinion mining, is an important research field in text mining. Its main task is to determine the sentiment tendencies that people express on entities, such as products, services, issues, events, topics, and their attributes [
27]. The sentiment-analysis-based logistics service quality evaluation method usually builds a sentiment dictionary in the field of express reviews by analyzing relevant reviews of logistics services on the Internet. Based on the specified rules, positive and negative sentiment words are matched to judge the sentiment polarity of the review and analyze the sentiment tendency of consumers. With machine-learning methods, sentiment analysis can be transformed into text classification tasks.
The application of the sentiment analysis method in smart city governance has been widely explored. The smart city research community has already recognized that sentiment analysis can contribute to a better understanding of the public’s needs and concerns [
28]. Content analysis illustrates the applicability of sentiment analysis for citizens’ engagement to solve social problems like traffic congestion, crime prediction, disaster management, etc. [
29]. Research in multiple fields of the smart city has shown the feasibility and effectiveness of sentiment analysis technology. Li et al. [
30] proposed a sentiment model for the task of sentiment analysis on Twitter and a methodological framework to map citizen sentiment from Twitter in helping governments to monitor their citizens’ moods. Al Nuaimi et al. [
31] proposed a social media data analysis approach to explore smart city data collected from various social media sources. Abbasi-Moud [
32] investigated the automatic extraction of users’ preferences in smart tourism and proposed a method to extract users’ preferences through semantic clustering of the comments and sentiment analysis. Researchers have studied the limitations of sentiment analysis for Arabic. Alotaibi [
33] provided a resource on sentiment analysis in the Arabic and Saudi dialects. Alam et al. [
34] initially proposed a domain-specific distributed word representation method for aconsiderably small corpus compiled from textual resources on social media for smart city applications. Also, descriptive statistics and sentiment analysis methods were used to identify car-sharing problems based on customer reviews in Poland [
35]. Yue [
36] used LDA and CNN-BiLSTM-based topic mining and sentiment analysis models for user comments to study the current state of public perception of smart city concepts. Also, there are some studies that combine location information with sentiment analysis to explore the variability of people’s attitudes towards health- and tourism-related services [
37,
38].
Bahamdain et al. [
39] conducted sentiment analysis to assess customer satisfaction with logistics services in the private and public sectors. They used lexicon-based tweets collected and classified as positive, negative, or neutral. A support vector machine model was used for the classification. Chen et al. [
40] presented a model for the evaluation of logistics service quality based on sentiment analysis of comment text. They constructed a triple graph neural network (TGNN) to perform sentiment analysis of the service texts. Kim et al. [
41] presented a model based on text sentiment analysis which aimed to substitute the survey-based data-gathering process of Kano models with sentiment analysis. They used morpheme analysis to extract quality elements from a set of opinion texts, and the polarity text items were transformed into equivalent Kano survey questions. Tika et al. [
42] conducted sentiment analysis on an online taxi transportation service. They used social media to communicate with customers. This study obtained reviews from Instagram, which is used to track public opinion of online Gojek transportation services. Reviews from the page are processed by text preprocessing and then classified using the naive Bayes classifier method to obtain the public value for online transportation services.
3. Methodology
3.1. Definitions and Symbols
This section defines and explains the related issues involved in the model to describe the logistics service quality evaluation system, review sentiment feature extraction, and express quality evaluation in detail.
Definition 1: Logistics service quality evaluation index. This refers to all kinds of data that have the meaning of logistics services and can reflect the characteristics of logistics services.
Definition 2: Sentiment characteristics of reviews. They refer to the descriptions of the logistics service, such as price, attitude, and speed, included in user reviews.
Definition 3: Index sentiment intensity. This refers to the sentiment tendency degree of the text evaluation content in each index of the evaluation index system. The sentiment intensity index describes the sentiment level of each index component.
Definition 4: Index weight. This refers to the weight of each index that affects quality evaluation with different levels of sentiment. The index weight describes the ratio between the number of features occupied by an index at a certain sentiment level and the number of features occupied by all sentiment levels.
Table 1 lists the notations used in this study to describe the QoS models and algorithms.
3.2. Sentiment-Analysis-Based Logistics Service Quality Evaluation Model
The sentiment-analysis-based logistics service quality evaluation model uses sentiment analysis as the core method to evaluate service quality. It builds mapping relations between sentiment features and evaluation indices by extracting sentiment features from user’s reviews and improving the evaluation index system.
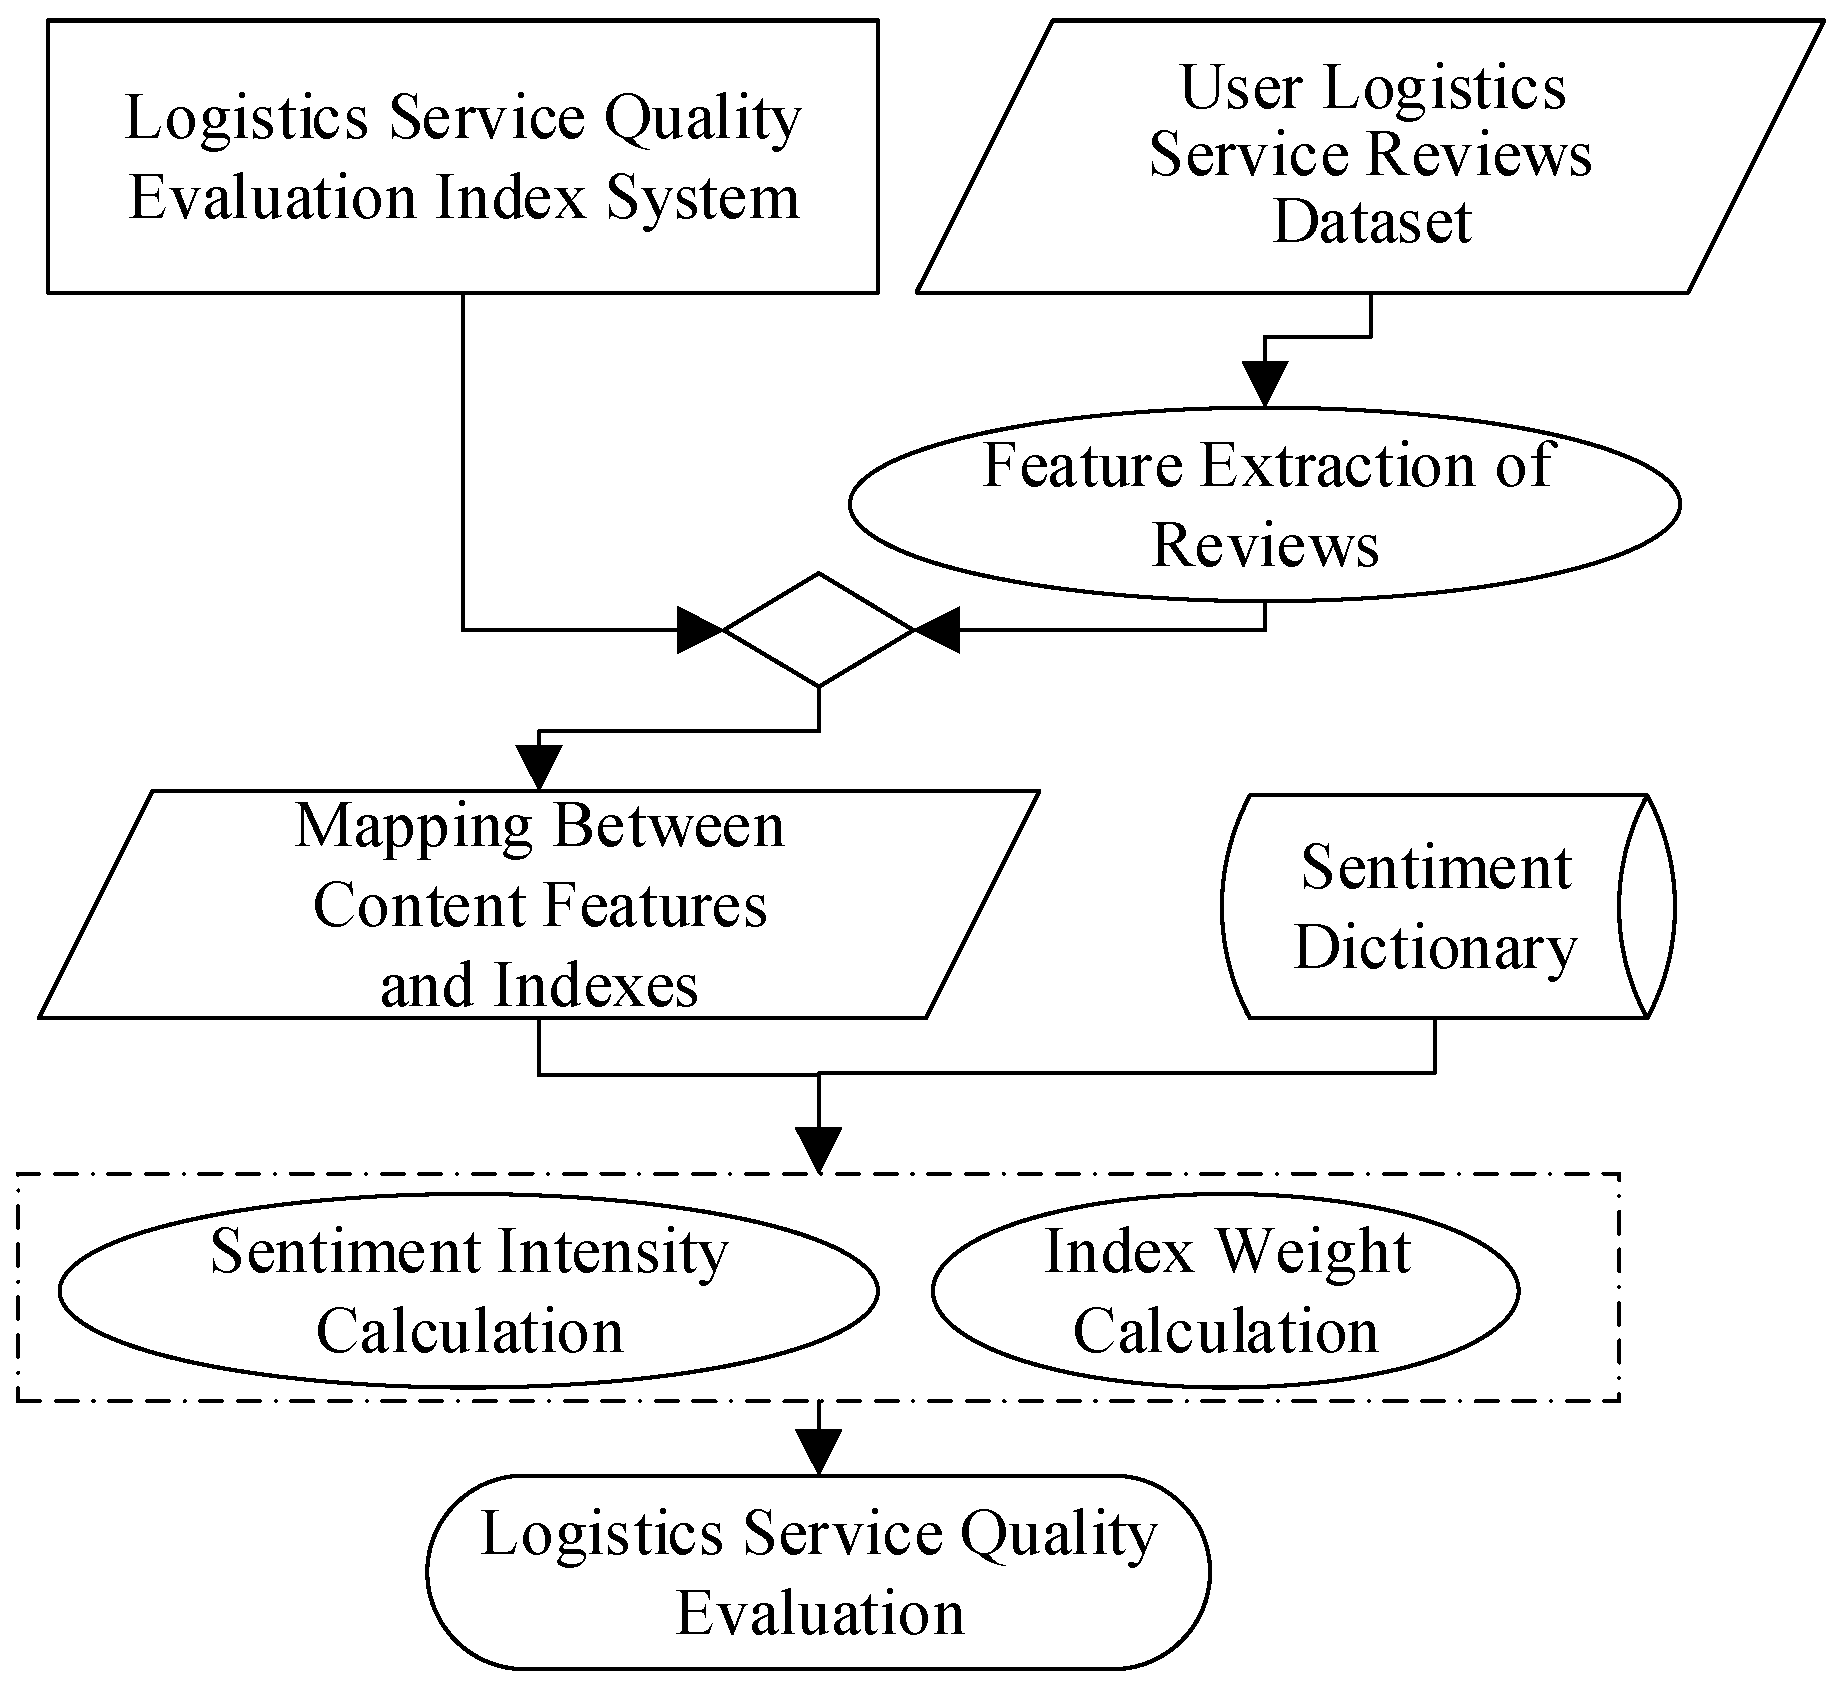
Figure 1 illustrates the framework of the proposed model.
The logistics service quality evaluation process can be divided into four steps as follows:
First, the evaluation index system of logistics service quality is reconstructed. Based on the existing SERVQUAL model, the characteristics of logistics services are analyzed, and the core issues that users care about are identified. The service quality index system can be improved by replacing the tangibility of the service with the standardization of the service and the assurance of the service with the credibility of the service. After retaining the reliability, responsiveness, and empathy of the original model, a logistics service quality index system is constructed. Simultaneously, the effectiveness of the new logistics service quality index system is evaluated.
Second, we extract the sentiment characteristics of the user reviews. The user review set is preprocessed to remove incomplete review text and then processed based on the stop word table. The nouns in the preprocessed text are used as candidate feature words to generate the candidate feature set, and the weight of the candidate feature words is determined according to the frequency of the candidate feature words in the review. If the candidate feature words satisfy the requirements, they are classified into a feature word set.
Third, we construct mapping relations between the sentiment characteristics and the evaluation index system. The sentiment feature segmentation and evaluation index feature segmentation of user reviews are represented by multi-dimensional vectors. According to the multi-dimensional vectors, the similarity between the feature segmentation of a review text and the index feature words can be calculated using the cosine method. If the calculated similarity value is greater than a preset threshold, the word belongs to the scope of the index feature.
Fourth, we calculate the sentiment intensity and index weight. We construct a sentiment intensity table based on the degree-level word list in the HowNet sentiment dictionary.
3.3. Logistics Service Quality Evaluation Index System Design
3.3.1. Characteristics of Logistics Service
Logistics delivers items to the recipient or a place designated by the sender within the promised timeframe. Timeliness, accuracy, security, and convenience are the four key characteristics [
43,
44,
45]. Logistics service quality is the difference between consumers’ perceived and expected service levels. The characteristics of logistics service quality can be summarized as subjectivity, interactivity, and processes.
Subjectivity: There are differences in service quality perceived by consumers in different environments. This uncertainty indicates that the quality of service depends on consumers’ subjective feelings to a certain extent.
Interactivity: Logistics services provide consumers with interactive processes in both production and consumption stages. Consumers can propose improvements to service providers during the process of enjoying services, and service providers can provide new services to consumers in a timely manner through these suggestions.
Process: Process quality is an important part of service quality, and the experience in the service process may affect the overall perception of consumers.
3.3.2. Logistics Service Quality Evaluation Index System
The SERVQUAL model clearly shows the connotation of service quality with five divisions: tangibility, reliability, responsiveness, assurance, and empathy. According to the characteristics of logistics services, we establish a logistics service quality evaluation index system based on SERVQUAL. In the proposed logistics service quality evaluation index system, tangibility and assurance are replaced by the standardization and credibility of the logistics service, respectively. Simultaneously, service reliability, service responsiveness, and service empathy are preserved by appropriately adjusting specific secondary indicators. Customers can perceive the degree of reliability of the enterprise’s service commitment from both the enterprise and employees in logistics-service-related scenarios.
Table 2 presents the profile of the proposed logistics service quality evaluation index system.
3.3.3. Effectiveness Examination of the Proposed Logistics Service Quality Evaluation Index System
We examined the reliability of the constructed logistics service quality evaluation index system using a questionnaire. The questionnaire was divided into three parts. The first part introduced the main content and use of the questionnaire, the second part described the personal information of the respondents, and the third section provided the evaluation indicators of logistics service quality. Questionnaires were sent through e-mail to people with an online shopping experience in the urban areas of Ningbo, China. The questionnaire survey lasted for approximately three months, with a total of 600 questionnaires distributed. Finally, 284 questionnaires were recovered, 262 of which were valid, with an effective rate of 92.3%.
In this study, SPSS22.0 was used to analyze the reliability of the collected questionnaires, and Cronbach’s measurement method [
46] was used for reliability measurements.
Table 3 listed the Cronbach’s reliability coefficients of the proposed index system.
Based on
Table 4, the Cronbach’s reliability coefficients of the five evaluation indices are all greater than 0.7, indicating that the data have a certain reference significance, and the dimension of this index design is reasonable. Furthermore, the overall correlation coefficient between the indicators was used to complete the final selection, and 18 indicators were determined.
Table 4 presents the overall correlations between the indicators. The overall correlation coefficient for each indicator was greater than 0.4, indicating that the selected indicators were reasonable.
The established logistics service quality evaluation index system is feasible based on Cronbach’s reliability coefficient of the index system and the correlation coefficient between the indicators.
3.4. Analysis of Sentiment Characteristics of Logistics Service Reviews
3.4.1. Sentiment Feature Extraction of Reviews
In the process of sentiment feature extraction of logistics service reviews, we started with a user review preprocess to screen out incomplete reviews. The preprocessed text is further processed with stop words that frequently appear in the commentary text and have no meaning for sentiment analysis, such as articles, prepositions, adverbs, and conjunctions. In this study, product features are treated as stop terms generated from a common stop word list and a manually annotated set.
The feature words studied in this study refer to the feature words price, attitude, and speed in user reviews. The noun in the preprocessed text is used as the candidate feature word, and the number of times and total number of feature words of each candidate in the users’ reviews are recorded to generate the candidate feature word set. The weight of a feature word can be calculated as
where
is a feature word,
is the frequency of
appearing in the users’ review,
is the total number of times all candidate feature words appear in the user review, and
is the weight of the feature word
.
We designed the logistics service review sentiment feature extraction algorithm with the following two steps: (1) nouns and noun phrases were selected from user reviews to construct a candidate feature word set, and (2) the candidate feature word set was traversed with
value to determine whether to add the candidate feature word to the feature word set. The process of
value check was implemented as
where
is a candidate feature word and
is the preset constant value.
For the candidate feature word as
and the feature extraction threshold as
, the candidate feature can be determined based on Equation (2). When
,
equals 1, and the candidate features can be used as logistics service features. Otherwise, it was not a feature word. All the features with
values greater than
in the candidate feature set were selected to construct the logistics service feature set. The sentiment feature extraction algorithm for logistics service review content is shown in Algorithm 1.
| Algorithm 1. Logistics service review feature word extraction. |
Input: User reviews .
Output: Logistics service .
Step1 extract a review from and preprocess it.
Step2 save the preprocessed clause in Array . Each review can produce m clauses at most.
Step3 select a from and set it as ,
Step4 for with the following processes:
- (1)
If is a noun or noun phrase, the label is as and it is saved into the candidate feature word set . - (2)
If , continue to extract from and repeat Step4 using .
Step5 determine whether there are any unprocessed reviews . If yes, repeat Steps 1 to 4.
Step6 traverse value of each candidate feature word .
Step7 remove duplicates in .
Step8 traverse with the following processes:
- (1)
If is true, the label is as and put into - (2)
Check whether
is not empty. If not, return to Step 8.
Step9 output and end the algorithm. |
3.4.2. Mapping between Emotional Characteristics of Reviews and Evaluation Indices
The mapping relationship between them must be established to determine the review content that can reflect a specific index. The specific idea is to determine whether the weight value of the relationship between the sentiment segmentation of a review and index feature word is sufficiently large. If the weight is greater than a preset threshold, the article segmentation belongs to the scope of the index. Based on existing research results, we used the cosine similarity method to calculate the relations between text sentiment feature segmentation words and evaluation index feature words. The specific approach is shown as
where
and
in the formula are the multi-dimensional vectors of text sentiment feature segmentation and evaluation index feature segmentation, respectively,
and
represent the i-th component of
and
, respectively, and n is the number of dimensions of the multi-dimensional vector. In this study, the similarity threshold β was set to 0.9. Word segmentation can be included in the indicator review text set when cosine similarity is greater than or equal to 0.9. The index system includes 18 evaluation indices, and all the sentiment features of the review text can be divided into the corresponding evaluation index set after word segmentation and classification. The evaluation index set was used for sentiment analysis of the corresponding index. The sentiment tendency of the evaluation index content described in user reviews is the user’s sentiment towards the index.
3.4.3. Index Sentiment Intensity and Single Index Score Calculation
The index sentiment intensity is calculated according to the specific content of the evaluation index and the emotional tendency of the comment text under a certain evaluation index. In the index sentiment intensity calculation process, sentiment words, negative words, and adverbs of degree are combined to build a sentiment intensity table based on the degree level word list in the HowNet sentiment dictionary [
47]. In this study, sentiment intensity was divided into six levels corresponding to different intensity values, as shown in
Table 5.
In
Table 5, “D” stands for negative word, “P” stands for positive sentiment word, “N” stands for negative sentiment word, “S” stands for advanced degree adverb, “M” stands for intermediate degree adverb, and “E” stands for primary degree adverb.
According to the sentiment intensity value, the degree of satisfaction of the user for a certain aspect of the service can be obtained. In this study, we established the mapping relationship between the emotional intensity value and the user’s score in a hundred-mark system. Specifically, sentiment intensity levels 1, 2, 3, 4, 5, and 6 correspond to scores (90–100], (80–90], (70–0], (60–70], (50–60], and [0–50], respectively. If the intermediate value of each interval is taken as the scoring value, the scoring function is given by Equation (4).
where L is the sentiment intensity level (
).
If a user’s review is related to
evaluation indices, the relationship between the review and the indices can be serialized according to Equation (5).
where i (
) is the number of second-level evaluation indices,
is the number of sentiment intensity levels,
is the number of feature words with
sentiment intensity level on the i-th index, and
is the sequence of the number of feature words with different sentiment levels.
A single index score contains a comprehensive score for the feature word at different sentiment levels, which is expressed as
where
is the influence weight of different sentiment intensity levels on the i-th index and can be calculated using Equation (7).
Therefore, the score of the i-th index can be expressed as
3.4.4. Index Weight and Total Logistics Service Quality Evaluation
The impact of different indices on total logistics service quality varies, and we need to set a set of weights to reflect the importance of different indicators. In this study, the standard deviation method [
48] was used to determine the influence weight of the index. The specific calculation steps for the index weight are given in Equations (9)–(11).
- (1)
Calculate the average value of index for all sentiment intensity levels.
- (2)
Calculate the mean square deviation of the index.
- (3)
Calculate the weight of the index.
In these formulas, ) is the number of sentiment intensity levels, ) is the number of evaluation indices, is the mean square error, and is the weight of index i.
Considering all indices in the evaluation system, the score of the logistics service quality can be evaluated according to Equation (12).
where
is the logistics service enterprise or a certain logistics service that needs to be evaluated.
3.5. Evaluation Method
Recall and precision were selected to compare the number of extracted feature words with the actual number of feature words to evaluate the accuracy of the proposed logistics service review feature word extraction algorithm.
Table 6 lists the contingency tables used in this study.
The calculation formulas for recall and precision are shown in Equations (13) and (14), respectively.
The mean squared error (MSE) method was used to evaluate the accuracy of the proposed logistics service quality evaluation index system. This method measures the mean value of the square of the difference between the evaluated and actual values. The MSE of the proposed logistics service quality evaluation index system can be calculated using Equation (15).
where
is the score manually obtained, which is treated as the actual value, and
is the collection of reviews for a logistics service.
4. Experimental Analysis of the Evaluation Model
The effectiveness of the proposed logistics service quality evaluation index system depends on the accuracy of the logistics service feature extraction algorithm. First, the accuracy of the proposed logistics service feature extraction algorithm is qualitatively evaluated using a publicly available dataset, and then a comparison and validation analysis of the proposed logistics service quality evaluation index system is performed.
4.1. Dataset Collection
Logistics enterprises’ services have different quality effects on different products. The most direct reflection is that when transporting certain products, the service quality is good; however, the service quality is poor when transporting other products. Therefore, it is reasonable to evaluate the service quality of different types of logistics enterprise products. We used Amazon user review data [
49] as the dataset for the evaluation of the proposed model. The selected review ranged from January 2017 to October 2018 and covered five product categories: shoes, food and drinks, books, sports, and electronics and accessories. The selected reviews contained 50,000 records, with each category having the same number of comments. All comments pertained to the logistics services of a certain product. We randomly selected 10,000 reviews that covered all product categories as the baseline dataset, and the remainder served as the test dataset. The baseline dataset was manually annotated and scored, and the test dataset was generally used to test the feasibility and effectiveness of the proposed algorithm.
4.2. Experimental Result Analysis
4.2.1. Recall of Feature Extraction Algorithm
The proposed logistics service reviews the feature word extraction algorithm implemented in MATLAB and executed with the test dataset to check its feasibility and effectiveness. The experimental results of the algorithm using the baseline dataset are shown in
Figure 2. Based on the figure, the recall rate of the algorithm was small, and the gap with the actual result was large. With an increase in the number of baseline reviews, the recall rate of the algorithm increases significantly and tends stabilize, indicating that the algorithm-extracted feature words are close to the manually labeled ones. The recall rate becomes stable at a high level when the number of baseline reviews increases to a certain value. In addition, we found that the recall values of different product categories are slightly different with 10,000 reviews, but they are generally approximately 80%, indicating that the error rate of the algorithm is relatively low.
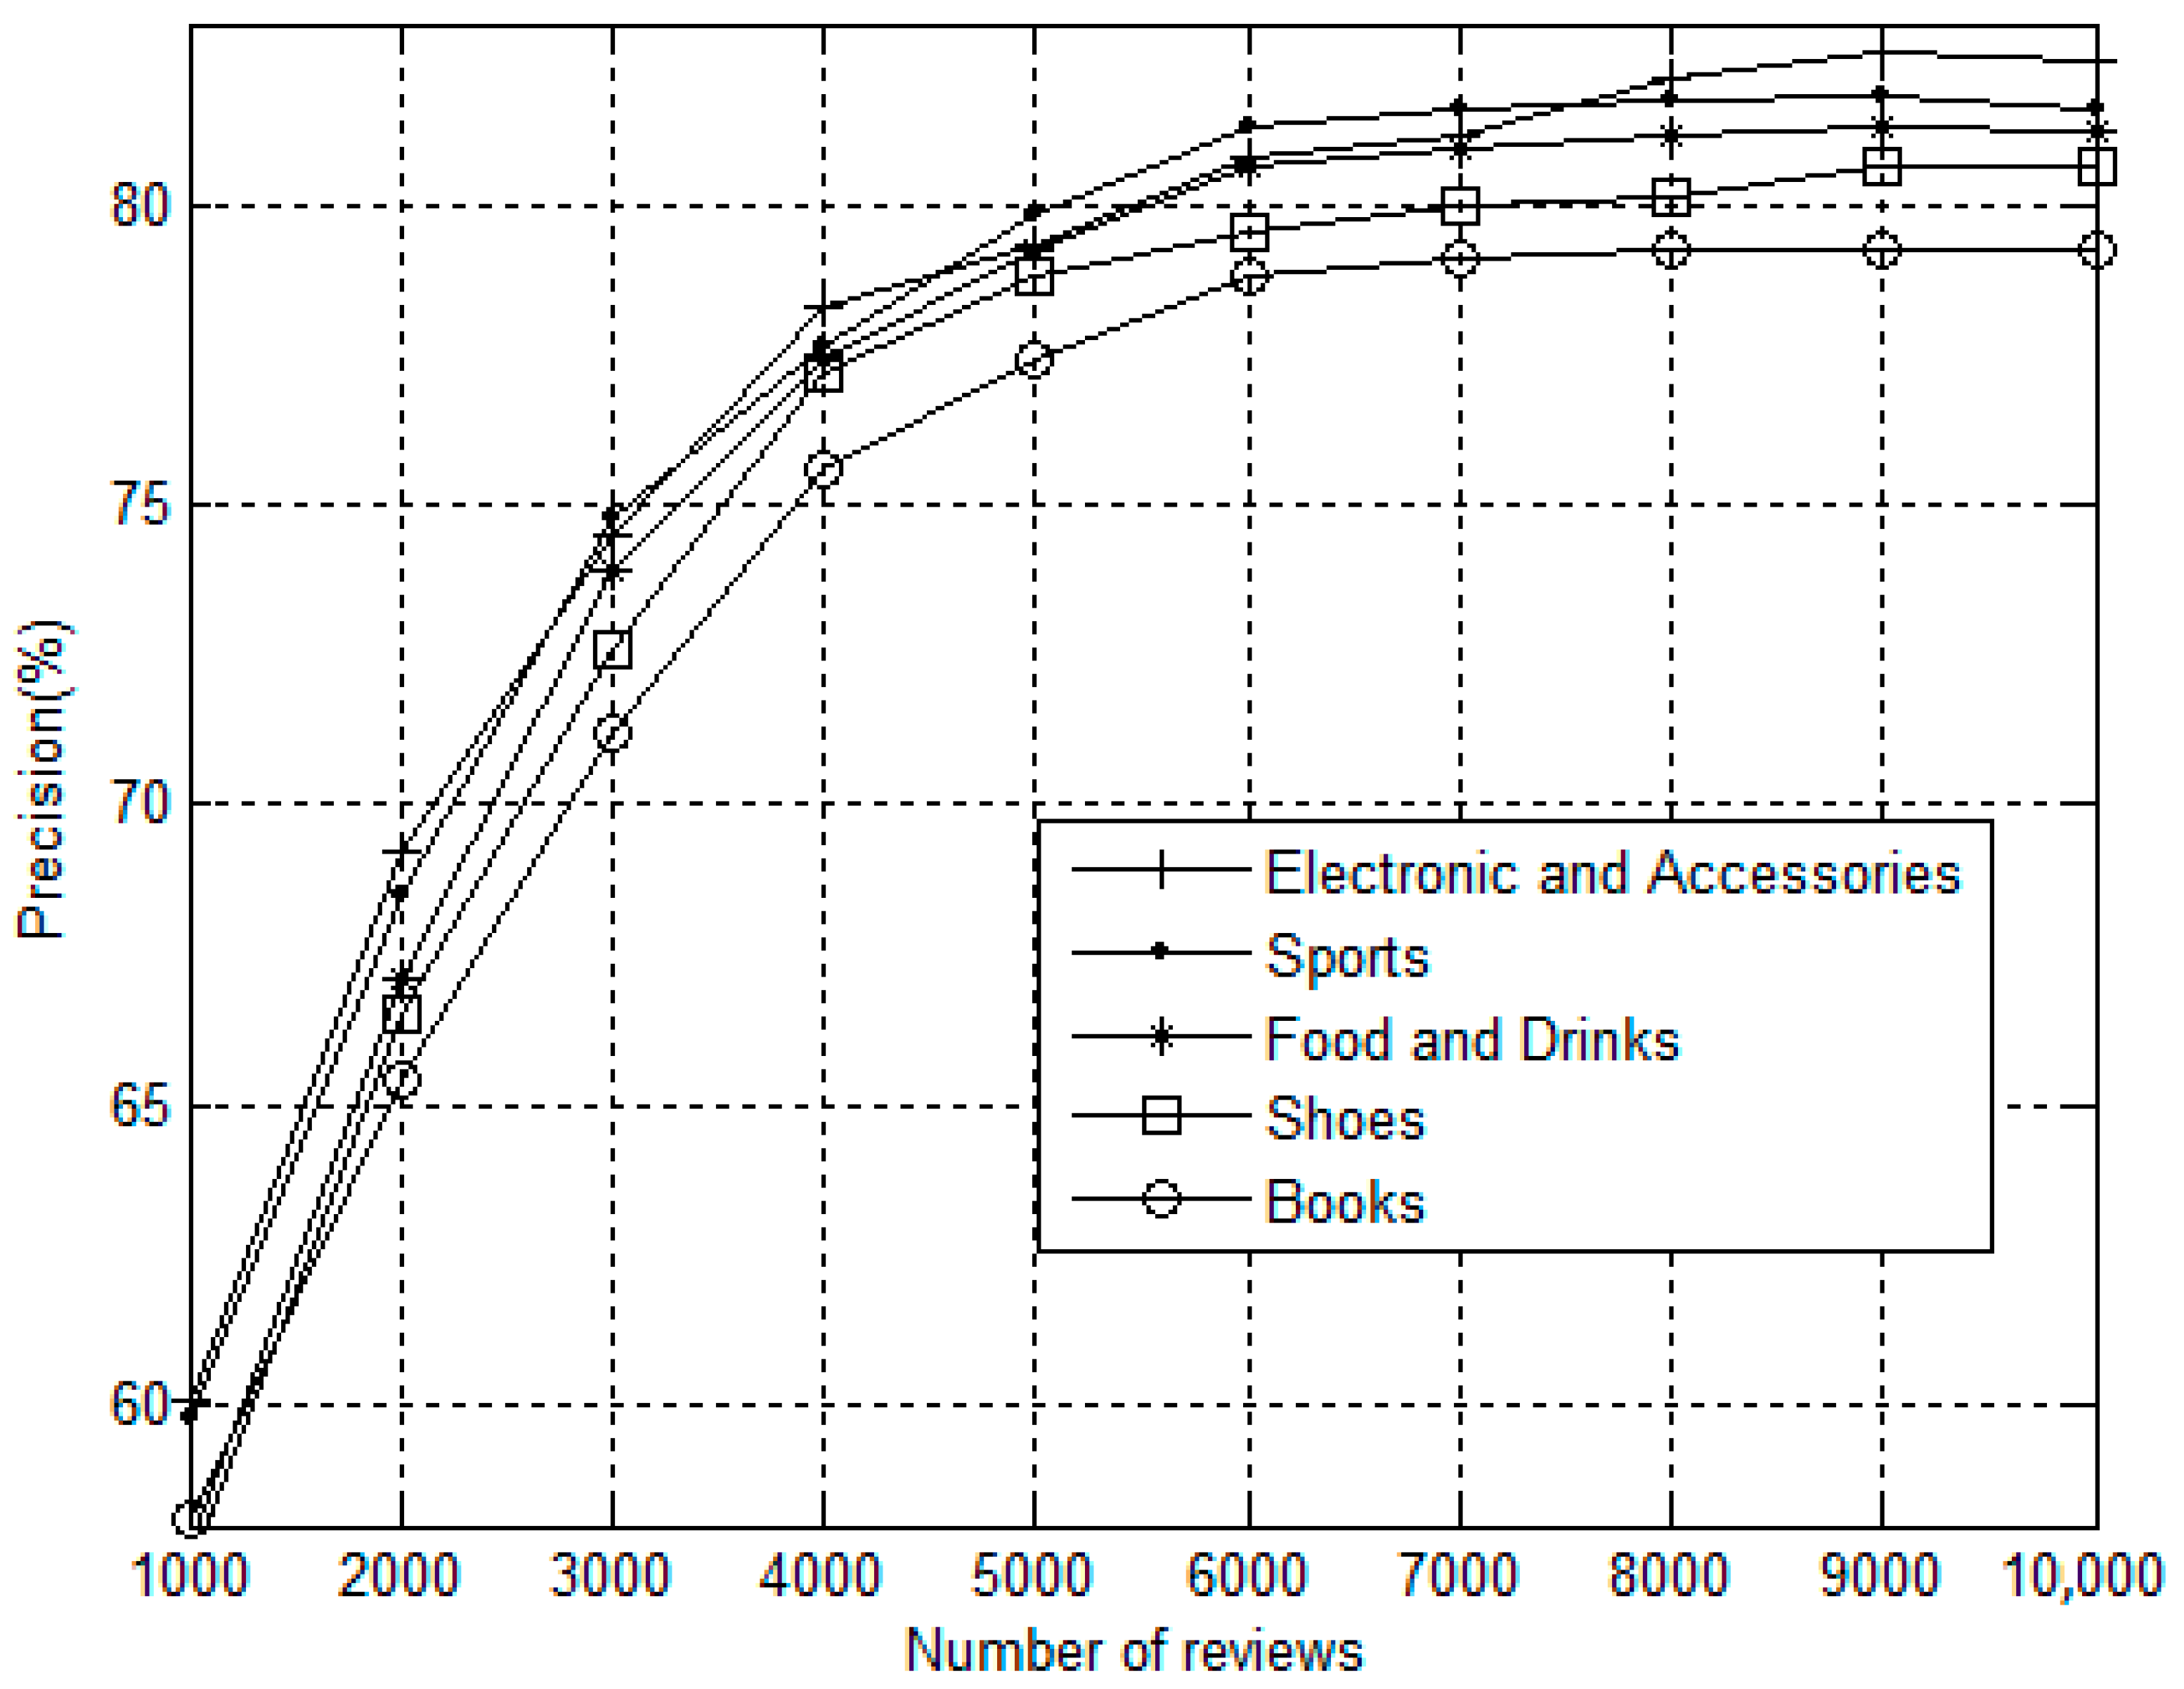
4.2.2. Precision of Feature Extraction Algorithm
Similarly, the precision evaluation of the proposed logistics service review feature word extraction algorithm is implied with baseline reviews that cover five product categories. The precision of the algorithm based on Equation (14) is shown in
Figure 3.
As shown in
Figure 3, the precision of the algorithm increases as the baseline review number increases. Precisions of all product categories almost reached their highest stable values when the baseline review number increased to 10,000. This shows that the logistics service review feature word extraction algorithm can extract most sentiment features with high accuracy.
4.2.3. MSE of the Proposed Logistics Service Quality Evaluation Index System
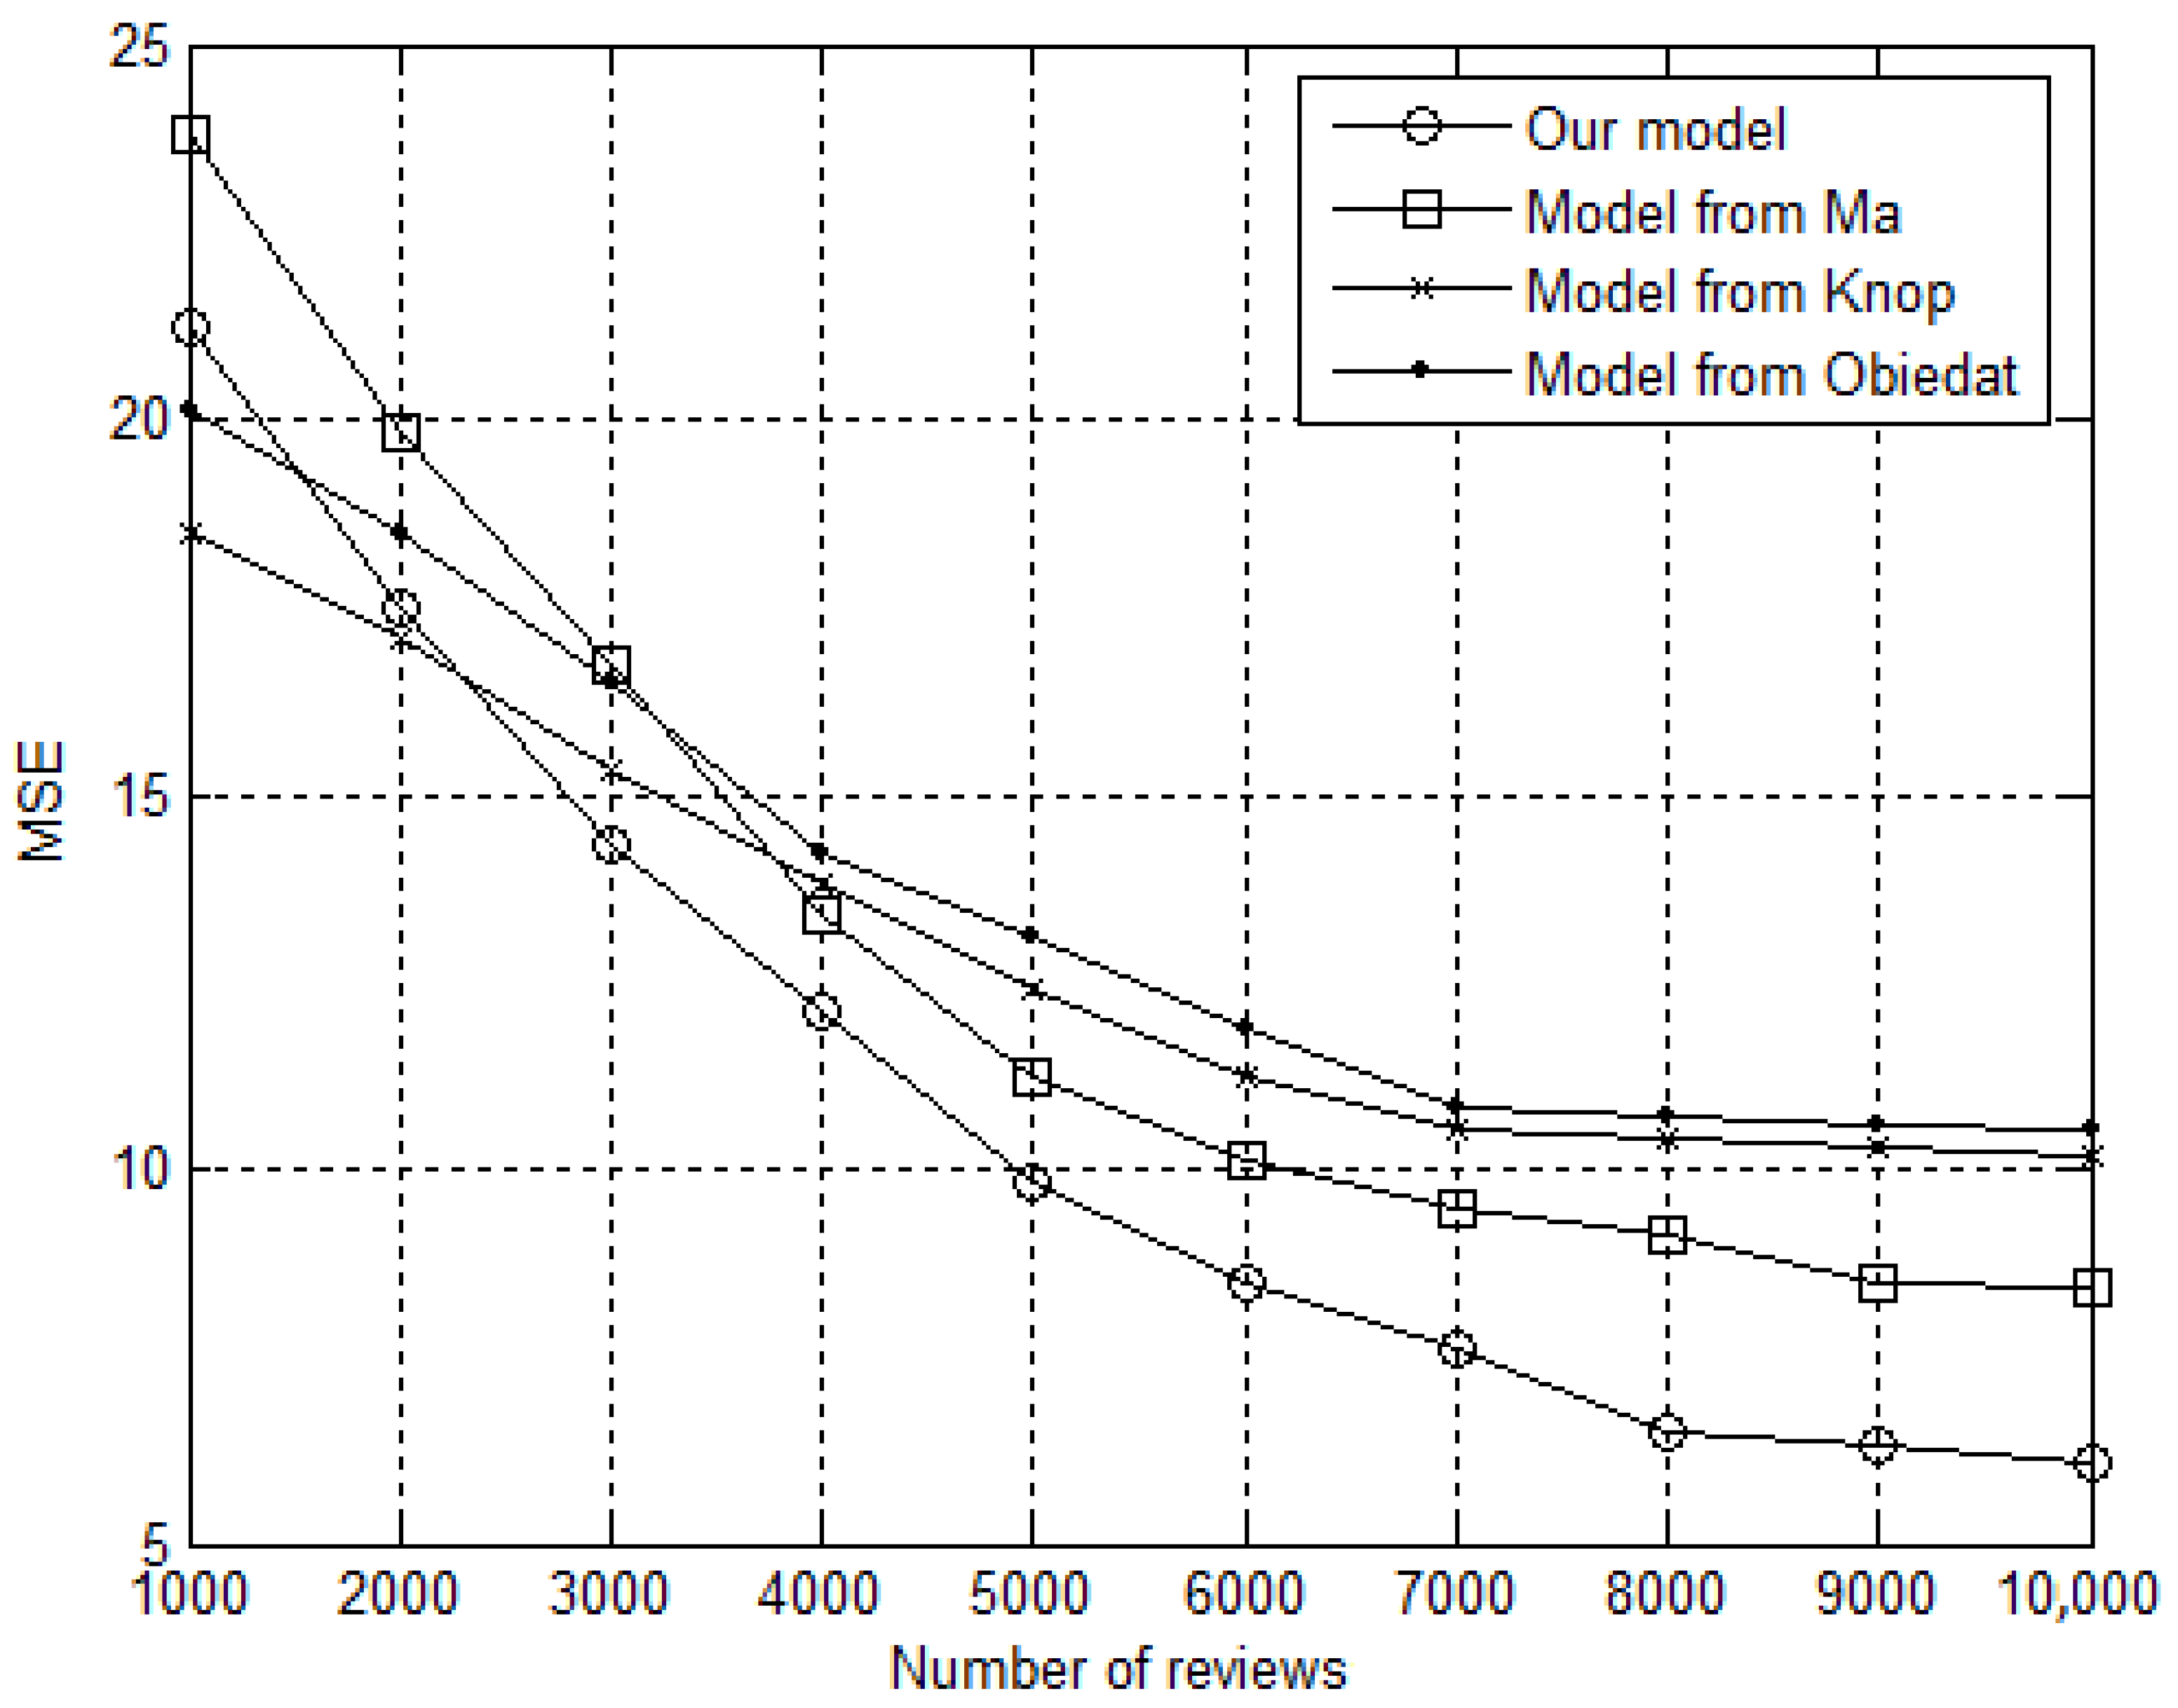
The logistics service quality evaluation index system proposed in this study was compared and analyzed with three benchmark models from Knop [
50], Ma [
9], and Obiedat [
51]. Knop’s model combines unweighted SERVQUAL and weighted SERVQUAL, which jointly uses the SERVQUAL index system and AHP, and Obiedat’s model integrates sentiment analysis technology and the support vector machine (SVM) algorithm. The experiment is conducted using the baseline dataset, and the MSE values of the four methods are shown in
Figure 4.
As shown in
Figure 4, the MSE values of the four models significantly decrease with an increase in the baseline review number. However, the MSE reduction trend of the proposed logistics service quality evaluation index system was more pronounced than those of the other three models. Specifically, the MSE of Ma’s model is the highest, with 1000 reviews, but rapidly drops as the baseline view number increases. With 10,000 reviews, the MSE of Ma’s model is the second lowest among the four models. The MSE of Knop’s model is the smallest at first, but it booms to the second largest value when the baseline view number increased to 10,000. Similarly, the MSE of Obiedat’s model is the second smallest, with 1000 reviews, but it becomes the largest when the baseline view number increased to 10,000.
In
Figure 4, when the number of comments is below 2000, the MSE value of Knop’s model is significantly higher than that of the model proposed in our paper. However, with the number of comments greater than 2000, the MSE value of Knop’s model improves slowly, while the MSE value of the proposed model improves rapidly. The main reason is that the number of indicators of Knop’s model is 22, and the proposed model has 18 indicators. The indicators of Knop’s model are more detailed in evaluating service quality. In the case of a low number of comments, its accuracy is higher. Sentiment analysis relies heavily on the number of comments, and the accuracy with a small number of comments is lower. When the number of comment samples reaches a certain level, it is difficult to distinguish users’ evaluation of service quality with more detailed indicators. Instead, many indicators can be clustered into the same category, which can better reflect the experience of most users. Therefore, the model proposed in this paper shows its superiority.
5. Conclusions and Future Work
With the continuous development of smart cities, smart logistics as a service and support has garnered considerable attention. The construction of urban smart logistics systems includes two important aspects: the operation network of logistics centers to meet the needs of urban production and life and the distribution system at the end of the distribution body. Worldwide, scientists have worked extensively to evaluate the level of logistics development in smart cities. However, assessing it directly based on the user’s perspective is difficult. Based on user reviews of e-commerce systems, this study proposed a semantic analysis approach to extract user satisfaction words towards logistics services to achieve the objective of logistics service evaluation. First, a logistics service that reviews feature word extraction was proposed for mining the sentiment features of user reviews based on the existing sentiment dictionary. Subsequently, the mapping relations between sentiment features and logistics-service-evaluation-related indices can be established. Finally, a logistics service quality evaluation index system was established based on the SERVQUAL model.
We validated the proposed logistics service review feature word extraction algorithm using a publicly available user review dataset. The recall and precision check results indicated that both the applicability and effectiveness of the algorithm were considerably high. A comparative analysis shows that the proposed logistics service quality evaluation index system has a lower MSE than the other three benchmark models. All these results show that the user-review-sentiment-analysis-based logistics service quality evaluation approach has high application potential.
However, there are still some methodological or technological constraints that might be addressed in future academic exercise. First, we made an effort with users’ review data from the e-commerce platform to extract the sentiment characteristics of logistics service quality. In the e-commerce environment, users’ feeling on logistics services can be easily affected by many factors, such as commodity quality, payment, customer service, etc. This may lead to deviation of users’ comments to logistics services. Second, it is difficult for existing sentiment analysis technology to identify intentionally malicious evaluations. There are studies that show that some organizations or individuals can use improper means to make a large number of malicious comments to discourage their competitors. However, the existing sentiment analysis technique applied in this paper cannot identify this issue. Finally, bias could exist in semantic analysis without location information. Logistics services are closely related to location, but the dataset used in the experiment does not contain location information. Therefore, the semantic analysis possibly biases the interpretation.
Due to data availability reasons, we only collected publicly available user reviews from a well-known e-commerce platform to conduct the study. In the future, we will focus on gathering smart logistics review datasets to conduct a comparative study of benchmark models, especially the logistics service evaluation methods based on SERVQUAL.
Author Contributions
Conceptualization, methodology, formal analysis, and original draft preparation, S.Z.; writing—review and editing, H.Z.; data collection and processing, funding acquisition, C.W.; algorithm simulation, D.Z. All authors have read and agreed to the published version of the manuscript.
Funding
This work was supported in part by the Humanities and Social Sciences research project of the Ministry of Education of China under grant 20YJAZH130, the research project of Department of Education of Zhejiang under grant Y202147441, the Public Technology research project of Zhejiang under grant LGF20F020004, and the Scientific Research Startup Fund of Ningbo University of Technology in 2022.
Data Availability Statement
Conflicts of Interest
The authors declare no conflict of interest.
References
- Shee, H.K.; Miah, S.J.; De Vass, T. Impact of smart logistics on smart city sustainable performance: An empirical investigation. Int. J. Logist. Manag. 2021, 32, 821–845. [Google Scholar] [CrossRef]
- Korczak, J.; Kijewska, K. Smart logistics in the development of smart cities. Transp. Res. Procedia 2019, 39, 201–211. [Google Scholar] [CrossRef]
- Nurdani, Y.; Sandhyaduhita, P.I. Impact of express delivery service quality towards repurchase intention by b2c and c2c: A case of indonesia. In Proceedings of the 2016 International Conference on Advanced Computer Science and Information Systems (ICACSIS), Malang, Indonesia, 15–16 October 2016; pp. 221–227. [Google Scholar]
- Buyukozkan, G.; Mukul, E. Evaluation of smart city logistics solutions with fuzzy mcdm methods. Pamukkale Univ. J. Eng. Sci.-Pamukkale Univ. Muhendis. Bilim. Derg. 2019, 25, 1033–1040. [Google Scholar] [CrossRef] [Green Version]
- Sabina, K. Smart logistics as a basis for the development of the smart city. Transp. Res. Procedia 2019, 39, 143–149. [Google Scholar]
- Fang, J.; Li, X.; Li, X. Research on the impact of online shopping logistics service quality on customer satisfaction based on management statistics. In Proceedings of the 2020 International Conference on E-Commerce and Internet Technology (ECIT), Zhangjiajie, China, 24–26 April 2020; pp. 36–40. [Google Scholar]
- Yu, B.; Wu, S. A branch model simulation for express logistics service system evaluation under online shopping. In Proceedings of the 2017 4th International Conference on Systems and Informatics (ICSAI), Hangzhou, Zhejiang, China, 11–13 November 2017; pp. 773–778. [Google Scholar]
- Pan, S.L.; Zhou, W.; Piramuthu, S.; Giannikas, V.; Chen, C. Smart city for sustainable urban freight logistics. Int. J. Prod. Res. 2021, 59, 2079–2089. [Google Scholar] [CrossRef]
- Ma, P.; Yao, N.; Yang, X. Service quality evaluation of terminal express delivery based on an integrated servqual-ahp-topsis approach. Math. Probl. Eng. 2021, 2021, 8883370. [Google Scholar] [CrossRef]
- Schouten, K.; Frasincar, F. Survey on aspect-level sentiment analysis. IEEE Trans. Knowl. Data Eng. 2016, 28, 813–830. [Google Scholar] [CrossRef]
- Ahmed, K.; Tazi, A.H.H.N.E. Sentiment analysis over social networks: An overview. In Proceedings of the 2015 IEEE International Conference on Systems, Man, and Cybernetics, Hong Kong, China, 9–12 October 2015; pp. 2174–2179. [Google Scholar]
- Alzahrani, M.E.; Theyazn, H.H.A.; Alsubari, S.N.; Maha, M.A.; Fahad, A. Developing an intelligent system with deep learning algorithms for sentiment analysis of e-commerce product reviews. Comput. Intell. Neurosci. 2022, 2022, 3840071. [Google Scholar] [CrossRef]
- Kim, T.Y.; Kim, H.J. Opinion mining-based term extraction sentiment classification modeling. Mob. Inf. Syst. 2022, 5593147. [Google Scholar] [CrossRef]
- Erkollar, A.; Oberer, B. Flextrans 4.0—Smart logistics for smart cities. Sigma J. Eng. Nat. Sci. 2017, 8, 269–277. [Google Scholar]
- Shee, H.; Miah, S.; Taboada, I.; De Vass, T. Smart city—Smart Logistics Amalgamation. In Proceedings of the IEEE European Technology and Engineering Management Summit (E-TEMS), Dortmund, Germany, 5–7 March 2020. [Google Scholar]
- Parmata, U.M.D.; Rao, B.S.; Rajashekhar, B. Measuring service quality in pharmaceutical supply chain distributor’s perspective. Int. J. Pharm. Healthc. Mark. 2016, 10, 259–283. [Google Scholar] [CrossRef]
- Stević, Ž.; Tanackov, I.; Puška, A.; Jovanov, G.; Vasiljević, J.; Lojaničić, D. Development of modified servqual–mcdm model for quality determination in reverse logistics. Sustainability 2021, 13, 5734. [Google Scholar] [CrossRef]
- Luyen, L.A.; Thanh, N.V. Logistics service provider evaluation and selection: Hybrid servqual–fahp–topsis model. Processes 2022, 10, 1024. [Google Scholar] [CrossRef]
- Lei, W.; Garg, H.; Li, N. Pythagorean fuzzy interactive hamacher power aggregation operators for assessment of logistics service quality with entropy weight. Soft. Comput. 2021, 25, 973–993. [Google Scholar]
- Stevic, Z.; Nunic, D.; Badi, I.; Karabasevic, D. Evaluation of dimensions of servqual model for determining quality of processes in reverse logistics using a delphi—Fuzzy piprecia model. Rom. J. Econ. Forecast. 2022, 25, 139–159. [Google Scholar]
- Jonkisz, A.; Karniej, P.; Krasowska, D. The servqual method as an assessment tool of the quality of medical services in selected asian countries. Int. J. Environ. Res. Public Health 2022, 19, 7831. [Google Scholar] [CrossRef]
- Park, S.J.; Yi, Y.; Lee, Y.R. Assessment of six alternative models of service quality. Total Qual. Manag. Bus. Excell. 2022, 1–3. [Google Scholar] [CrossRef]
- Qing, L.; Zhang, S.; Song, W. Combination of evaluation methods for assessing the quality of service for express delivery industry. In Proceedings of the WISE-International Conference on Web Information Systems Engineering, Miami, FL, USA, 1–3 November 2015; pp. 414–425. [Google Scholar]
- Mian, F.; Wang, D.D. Evaluation of crowdsourcing logistics service quality based on entropy weight method and analytic hierarchy process. In E3S Web of Conferences, Proceedings of the 5th International Workshop on Advances in Energy Science and Environment Engineering (AESEE 2021), Ternate, Indonesia, 9–11 April 2021; EDP Sciences: Les Ulis, France, 2021; p. 257. [Google Scholar]
- Mahmut, B.; Atalik, O. Application of fuzzy ahp and fuzzy marcos approach for the evaluation of e-service quality in the airline industry. Decis. Mak. Appl. Manag. Eng. 2021, 4, 127–152. [Google Scholar]
- Ahmad, A.; Duleba, S. Public transportation service quality evaluation during the COVID-19 pandemic in amman city using integrated approach fuzzy ahp-kendall model. Vehicles 2021, 3, 330–340. [Google Scholar]
- Gumzej, R. Intelligent Logistics Systems for Smart Cities and Communities; Springer: Berlin/Heidelberg, Germany, 2021. [Google Scholar]
- Ahmed, K.B.; Radenski, A.; Bouhorma, M. Sentiment analysis for smart cities: State of the art and opportunities. In Proceedings of the International Conference on Internet Computing (ICOMP), Las Vegas, NV, USA, 25–28 July 2016. [Google Scholar]
- Verma, S. Sentiment analysis of public services for smart society: Literature review and future research directions. Gov. Inf. Q. 2022, 39, 101708. [Google Scholar] [CrossRef]
- Li, M.; Ch’Ng, E.; Chong, A.; See, S. The New Eye of Smart City: Novel Citizen Sentiment Analysis in Twitter. In Proceedings of the 2016 International Conference on Audio, Language and Image Processing (ICALIP), Shanghai, China, 11–12 July 2016. [Google Scholar]
- Nuaimi, A.A.; Shamsi, A.A.; Shamsi, A.A.; Badidi, E. Social media analytics for sentiment analysis and event detection in smart cities. In Proceedings of the 4th International Conference on Natural Language Computing (NATL 2018), Dubai, United Arab Emirates, 28–29 April 2018. [Google Scholar]
- Abbasi-Moud, Z.; Vahdat-Nejad, H.; Mansoor, W. Detecting tourist’s preferences by sentiment analysis in smart cities. In Proceedings of the 2019 IEEE Global Conference on Internet of Things (GCIoT), Dubai, United Arab Emirates, 4–7 December 2019. [Google Scholar]
- Alotaibi, S.; Mehmood, R.; Katib, I. Sentiment analysis of arabic tweets in smart cities: A review of saudi dialect. In Proceedings of the 4th International Conference on Fog and Mobile Edge Computing (FMEC), Rome, Italy, 10–13 June 2019; pp. 330–335. [Google Scholar]
- Alam, M.; Abid, F.; Cong, G.; Yunrong, L.V.J.C.C. Social media sentiment analysis through parallel dilated convolutional neural network for smart city applications. Comput. Commun. 2020, 154, 129–137. [Google Scholar] [CrossRef]
- Ilona, P. Towards a smart city—The study of car-sharing services in poland. Energies 2022, 15, 8459. [Google Scholar]
- Yue, A.B.; Mao, C.; Chen, L.Y.; Liu, Z.B.; Zhang, C.J.; Li, Z.Q.; Li, Z.A. Detecting changes in perceptions towards smart city on chinese social media: A text mining and sentiment analysis. Buildings 2022, 12, 1182. [Google Scholar] [CrossRef]
- Gore, R.J.; Diallo, S.; Padilla, J. You are what you tweet: Connecting the geographic variation in america’s obesity rate to twitter content. PLoS ONE 2015, 10, e0133505. [Google Scholar] [CrossRef] [Green Version]
- Padilla, J.J.; Kavak, H.; Lynch, C.J.; Gore, R.J.; Diallo, S.Y. Temporal and spatiotemporal investigation of tourist attraction visit sentiment on twitter. PLoS ONE 2018, 13, e0198857. [Google Scholar] [CrossRef] [Green Version]
- Bahamdain, A.; Zahyah, H.A.; Muna, M.; Alhammad, A.A. Analysis of logistics service quality and customer satisfaction during covid-19 pandemic in saudi arabia. Int. J. Adv. Comput. Sci. Appl. 2022, 13, 174–180. [Google Scholar] [CrossRef]
- Chen, W.; Xu, Z.; Haijun, Z.; Zhe, L. Evaluation of logistics service quality: Sentiment analysis of comment text based on multi-level graph neural network. Trait. Signal 2021, 38, 1853–1860. [Google Scholar] [CrossRef]
- Sam, K.; Kim, C.S. Analysis of it service quality elements using text sentiment analysis. J. Soc. Korea Ind. Syst. Eng. 2020, 43, 33–40. [Google Scholar]
- Adilah, M.T.; Supendar, H.; Ningsih, R.; Muryani, S.; Solecha, K. Sentiment analysis of online transportation service using the naïve bayes methods. J. Phys. Conf. Ser. 2020, 1641, 012093. [Google Scholar] [CrossRef]
- Han, Y.; Xie, G. Determinants of customer perceived online shopping logistics service quality value: An empirical study from china. Int. J. Logist. Res. Appl. 2018, 22, 614–637. [Google Scholar] [CrossRef]
- Le, D.N.; Nguyen, H.T.; Truong, P.H. Port logistics service quality and customer satisfaction: Empirical evidence from vietnam. Asian J. Shipp. Logist. 2020, 36, 89–103. [Google Scholar] [CrossRef]
- Murfield, M.; Boone, C.A.; Rutner, P.; Thomas, R. Investigating logistics service quality in omni-channel retailing. Int. J. Phys. Distrib. Logist. Manag. 2017, 47, 263–296. [Google Scholar] [CrossRef]
- Henrica, C.W.d.; Lidwine, B.M.; David, G.M.; Caroline, B.T. Spearman–brown prophecy formula and Cronbach’s alpha: Different faces of reliability and opportunities for new applications. J. Clin. Epidemiol. 2017, 85, 45–49. [Google Scholar]
- Zhu, Y.L.; Min, J.; Zhou, Y. Semantic orientation computing based on hownet. J. Chin. Inf. Process. 2006, 20, 14–20. [Google Scholar]
- Carobbi, C.F.M.; Cati, M.; Panconi, C. Note on the expected value and standard deviation of the mismatch correction. IEEE Trans. Electromagn. Compat. 2011, 53, 1098–1099. [Google Scholar] [CrossRef]
- Ni, J.; Li, J.; McAuley, J. Justifying recommendations using distantly-labeled reviews and fine-grained aspects. In Proceedings of the Conference on Empirical Methods in Natural Language Processing and the 9th International Joint Conference on Natural Language Processing (EMNLP-IJCNLP), Hong Kong, China; 2019; pp. 188–197. [Google Scholar]
- Knop, K. Evaluation of quality of services provided by transport & logistics operator from pharmaceutical industry for improvement purposes. Transp. Res. Procedia 2019, 40, 1080–1087. [Google Scholar]
- Obiedat, R. Sentiment analysis of customers’ reviews using a hybrid evolutionary svm-based approach in an imbalanced data distribution. IEEE Access 2022, 10, 22260–22273. [Google Scholar] [CrossRef]
| Publisher’s Note: MDPI stays neutral with regard to jurisdictional claims in published maps and institutional affiliations. |
© 2022 by the authors. Licensee MDPI, Basel, Switzerland. This article is an open access article distributed under the terms and conditions of the Creative Commons Attribution (CC BY) license (https://creativecommons.org/licenses/by/4.0/).


