

Thermal Biometric Features for Drunk Person Identification Using Multi-Frame Imagery

Electronics Laboratory, Physics Department, University of Patras, 26500 Patras, Greece
Electronics 2022, 11(23), 3924; https://doi.org/10.3390/electronics11233924
Submission received: 15 October 2022
/
Revised: 19 November 2022
/
Accepted: 24 November 2022
/
Published: 27 November 2022
(This article belongs to the Special Issue Pattern Recognition and Sensor Fusion Solutions in Intelligent Sensor Systems)
Abstract
:In this work, multi-frame thermal imagery of the face of a person is employed for drunk identification. Regions with almost constant temperature on the face of sober and drunk persons are thoroughly examined for their capability to discriminate intoxication. Novel image processing approaches as well as feature extraction techniques are developed to support the drunk identification procedure. These techniques constitute novel ideas in the theory of image analysis and algorithm development. Nonlinear anisotropic diffusion is employed for a light smoothing on the images before feature extraction. Feature vector extraction is based on morphological operations performed on the isothermal regions on the face. The classifier chosen to verify the drunk person discrimination capabilities of the procedure is a Support Vector Machine (SVM). Obviously, the isothermal regions on the face change their shape and size with alcohol consumption. Consequently, intoxication identification can be carried out based only on the thermal signatures of the drunk person, while the signature of the corresponding sober person is not needed. A sample of 41 participants who drank in a controlled alcohol consumption procedure was employed for creating the database, which contains 4100 thermal images. The proposed method for intoxication identification achieves a success rate of over 86% and constitutes a fast non-invasive test that can replace existing breathalyzer check up.
1. Introduction
Facial imagery processing constitutes one of the prominent approaches for person identification as far as it concerns security and forensics. Other procedures involve fingerprints, voice characteristics and handwriting [1,2,3,4,5,6]. Face recognition procedures as well as their performance are seriously affected by illumination conditions when visible light is used [6]. Thermal infrared [7,8] can be used to capture information from faces. This procedure is actually a passive approach, i.e., the thermal detector records only the energy radiated from the face according to its temperature, which mainly depends on the physiological condition of the person [9]. The human face radiates as a perfect black body only in thermal infrared (wavelength 10 μm). This is according to Wien’s law, the region of the electromagnetic spectrum in which a body with the temperature of the environment (300 K) radiates its maximum energy.
Thermal infrared images are the most appropriate to investigate alcohol consumption since a drunk person has different thermal characteristics on his face than someone who is sober. For a drunk person, the arteries and the vessels on their face increase in activity and therefore the temperature on the face changes according to vessel network distribution. Isothermal regions have not been used so far for intoxication identification. In automotive anti-drunk driving systems referred in the literature, electrical signals from the heart and brain or information from breathing are mainly used [10].
Isotherms have already been used as a biometric feature in medical procedures [11,12]. They have also been used for recognition of human faces [13] in other pattern recognition tasks except intoxication problems [14,15]. The work in [12] provides an overview of medical infrared thermography in sports medicine and focuses on procedures for identifying traumatic knee injuries. In this same work are thoroughly explained the clinical applicability and limitations of medical infrared thermography. The most important advantage of medical infrared thermography is that it is a non-invasive, non-radiating, low cost detection tool. A detailed description of the applications of infrared thermography in medical diagnosis is given [11].
Drunk person identification procedures using infrared imagery can be found in the literature in [16,17,18,19,20]. These methods are based on thermal features that change with alcohol consumption. In [16], the features used for drunk identification are simple pixels obtained on specific points on the thermal image of the face of sober and drunk persons. In the same work, the concept of the “drunk feature space” is introduced and explained proving that the clusters of drunk persons are moving toward the same direction into this space. Moreover, it was found that the regions of the forehead and the nose change temperature when a person consumes alcohol, with the forehead becoming cooler and the nose hotter. In [17], blood vessel behavior is analyzed during alcohol consumption and those vessels on the face that exhibit higher activity are isolated and used as identification features. In [18], neural networks are used as a black box to recognize intoxicated persons. It is important to note that neural structures operating only on the forehead present very high drunk identification success. An approach for intoxication detection based on neighboring statistics was presented in [19]. This approach presents very good intoxication discriminations success. In [20] the activities of facial blood veins and variations on the eye socket of drunk persons are studied using special mathematical tools. In almost all methods presented in [16,17,18,19,20], one can identify intoxication without making use of the thermal image of the person when sober for comparison. This makes these approaches of high value for real time intoxication identification. On the other hand, a very resent method [21] that deals with intoxication identification presents almost the same kinds of characteristics as those appearing in [16,17,18,19,20]. In [21], the database used consists only of 20 persons, i.e., much smaller than that used in this work.
In the present work, sober–drunk classification is carried out using the thermal map of the face. Actually, multiple frames are obtained in each acquisition from each person. This 50-frame multi-view approach, gives the capability to resample each persons’ face 50 times and create a reasonably large cluster of feature vectors. Elaboration on the behaviour of the cluster in the feature space gives improved capabilities in intoxication detection. The morphological feature vector called pattern spectrum (pecstrum) is employed as a shape descriptor and the SVMs as classifiers. The present identification method differs substantially from the procedures presented in [16,17,18,19,20] since new drunk identification features are extracted from the person’s face. However, the conclusions in the present work as far as the capacity of the thermal images to identify intoxication are strongly supporting the significance of the contained information. Two different ways are employed in this work in order to isolate the face isothermal regions and to derive continues feature vectors for intoxication identification. According to the first way, the histogram of the face is separated (both for the sober and the drunk person) into equal segments. In the second way, the isothermal region in which the forehead lies is found and all the rest locations of the face that lie also in the same temperature range are recorded. It is necessary to smooth the boundaries of the thermal infrared images before extracting isothermal regions. This was carried out by the means of anisotropic diffusion. The isothermal regions are morphologically processed in order to derive the feature vector called pattern spectrum [22]. This shape descriptor is transferred to the SVMs. Sober–drunk discrimination performance was evaluated to be over 80% percent, which is considered satisfactory.
The novelty of the proposed method is related to the fact that the procedure is a non-invasive test, which can be applied remotely. This test can give a fast assess on the person’s condition and if necessary a breathalyzer or a blood test can follow. Furthermore, the identification of the drunk person does not require any comparison with an existing signature of a corresponding sober person. This work can be considered as an application with significant contribution in theory and algorithms development. Theoretically, new feature vectors for drunk identification are proposed making special use of morphological operators to convert isotherms into vectors. Furthermore, the developed algorithms are related to feature extraction as well as to histogram modification to outline isothermal regions.
Basic concepts regarding the signal processing procedures employed in this work are briefly provided for the reader to have a consistent view of the theoretical background. Firstly, a three-fold goal is achieved by means of anisotropic diffusion [23,24], namely details preservation is succeeded, while noise removal and homogenization of regions are simultaneously performed. Morphological operations [22,25,26] are employed for the formation of the feature vector called pattern spectrum. Finally, the SVMs are used for recognition of intoxicated persons. Support Vector Machines (SVMs) have been used extensively in the past for face detection in images, isolated handwritten digit recognition, object recognition, speaker identification and text categorization [27,28,29,30,31,32].
Forty-one subjects were involved in the experimental procedure. These persons, initially sober, consumed a specific amount of alcohol in a systematic way. This number of participants is considered large, taking into consideration that the persons were involved in a totally controlled alcohol consumption procedure. For each subject, 50 frames were obtained when they were sober and 50 frames after consuming alcohol. Thus, a total of 4100 feature vectors were employed in each identification procedure carried out. This database is actually the only one available worldwide. It is the only one acquired with consistency in experimentation and having images for the same person, sober and drunk with a specific amount of alcohol consumed in a specific allotted time period. It is worth mentioning that in the experiments only an intoxicated situation is tested assuming that no other scenario happens, i.e., the people employed were calm and in normal physical and psychological condition, healthy, without fever or any other psychological stress or having gone through any kind of body exercise before the experiment.
The work layout is as follows. In Section 2, a description is provided regarding the data used and the experimental procedure followed. The different isothermal regions are explained in Section 3. Furthermore, a brief discussion for anisotropic diffusion is addressed in Section 4, the morphological feature vectors are explained in Section 5, while the basic concepts of SVM classification are given in Section 6. In Section 7, the experimental results and discussion are provided. Finally, the conclusions are drawn in Section 8.
2. Infrared Data Used
The thermal infrared images required to assess the proposed drunk identification method were obtained by our research team during a systematic and well organized experimental procedure. Accordingly, both the thermal images of the sober person along with the thermal images of the corresponding drunk person, in specific time instances after alcohol consumption, are employed so that comparisons can be carried out. The persons who participated in the experiment were conscious about the requirements of the procedure. Consequently, only researchers from our university were asked to participate in the experiment since only these persons can be aware of the specific needs of the experimental procedure and simultaneously to be well aware of a possible risk they were undertaking.
The Thermal Vision Micron/A10 infrared camera was employed for image acquisition. The resolution of the camera is 160 × 128 pixels and is sensitive in the thermal infrared region of the electromagnetic spectrum, i.e., from 7.5 to 13.0 μm. At the middle of this region of wavelengths, i.e., at 10 μm, a perfect black body with a mean temperature of approximately 300 degrees Kelvin, radiates its maximum according to Wien’s law [11]. The human body as being in the same temperature with the environment, i.e., 300 degrees Kelvin, radiates in this exact region of wavelengths.
The experimental procedure focuses only on thermal changes on the face of the persons that have been caused by alcohol consumption. This means that only healthy persons participated in the experiment. During the experimental procedure, they remained calm, physically and psychologically in normal condition. No illness or fever, no psychological stress, other pathological reason or any kind of body exercises were recorded for any one of the participants. Consequently, intoxication detection is studied extensively under specific experimental conditions since the final goal is to prove that the face thermal signature changes with alcohol consumption.
The thermal infrared images were recorded in a well organized database available on the Internet for possible use by the scientific community. After four years of its availability over two hundred researchers worldwide have uploaded the database. No other similar database is available on the internet worldwide containing well organized information with many participants and created in a systematic way. All participants in the experiment accepted their personal data to be available on the Internet. The database contains information regarding the age, the weight and the sex of the participant.
Forty-one subjects were involved in the experimental procedure (http://old.physics.upatras.gr/sober/—Free Database) (accessed on 1 September 2012). Most of them were males (31) and the rest females. All participants had agreed by signing a special agreement form that their personal data can be used by the scientific community. All participants were over 18 years of age. Their specific data (name, age, sex, weight etc.) have been recorded in the database. Every participant consumed the same amount of alcohol. Specifically, half a kilo of wine had each participant to consume in one hour’s time. This corresponds to a total of 62.4 mL of pure alcohol. Sequences of 50 frames each, with a sampling period of 100 msec, were acquired from all persons. Before alcohol consumption, the first sequence of frames was obtained. Immediately after that the person has to start to consume the wine in the 60 min allotted. The second acquisition of 50 frames was obtained 30 min after finishing alcohol consumption. A total of 2050 frames were acquired for the 41 sober persons and the same number of frames from the same persons when they were drunk. The mean value of the 50-frame multi-view acquisition for a specific drunk person is demonstrated in Figure 1.
In order to secure smooth experimental procedure that would lead to reliable data acquisition, the participants were asked to be present in the room of the experiment half an hour earlier and to keep calm during the experimental procedure, which lasted over three hours. Simultaneously, the temperature of the room where measurements took place was kept between 23 and 25 degrees Celsius (almost 300 Kelvin). No physical light was used in the room of the experiment. A dim light from a neighboring room was used to be able to carry out the experiments. This light was not affecting the infrared camera. The distance of each face from the camera was kept almost 30 cm for all persons so that the acquired images could be compared.
According to the standards found in the literature [33,34] if a person has consumed four glasses of wine or a total of 62.4 mL of alcohol, he is characterized as being “drunk” or “intoxicated”. We considered this quantity of alcohol as being the maximum that our participants could drink and be involved in the experiment. According to the literature, only three glasses of wine are adequate for a person to go beyond the limit for secure driving, which is 0.5 g/(L of blood). We were not able to conduct blood tests during the experiment. However, persons are affected differently when drinking the same quantity of alcohol. This was verified by contacting measurements with a breathalyzer. For this reason, the police helped us to carry out measurements with a breathalyzer with some of the participant groups.
Based on our results and the breathalyzer measurements, it can be concluded with confidence that with the quantity of 62.4 mL of alcohol the breath alcohol content ranges from 0.25 to 0.9 mg/L. The content of 0.22 mg of alcohol per liter of exhaled air is equivalent to 0.5 g of alcohol per liter of blood [34]. This value is at the limit of drunkenness. It was found that the maximum concentration of alcohol in the exhaled air was recorded thirty minutes after the consumption of the last glass of wine, decreasing gradually after this moment. Furthermore, males are affected less than females, while lighter persons are more affected than those who were heavy. Specifically, for the males participating in the experiment, the breathalyzer measurements ranged from 0.22 to 0.37 mg/L of exhaled air, with the lowest indication corresponding to the heaviest persons. Higher values for these measurements were obtained for the females ranging from 0.49 to 0.89 mg/L.
3. Isothermal Regions
Isothermal regions are extracted in this section on the thermal images of the face of the sober and drunk persons. Four different ways were tried for isothermal region determination based on the histogram of the gray levels of the images. Specifically:
- The histogram range (0–255) is divided into equal in width segments;
- The histogram range is divided into equal populated segments;
- A specific region of the histogram is isolated (white) from the rest image (black);
- Arbitrary determination of each isotherm based on the minima of the histogram.
In Figure 2, one example for each case is illustrated. Assessing the capability of these four different ways for extracting isotherms, it was found that only the two of them are suitable for deriving reliable features for intoxication identification. Specifically, the first and the fourth type of isotherms, i.e., when the histogram range is equal divided and when an arbitrary region of the histogram is isolated. Before implementing one of the two methods, anisotropic diffusion can be applied when necessary to obtain smoother isothermal regions. After that morphological features will be extracted and used in the SVMs for drunk identification.
3.1. First Approach—Equidistant Histogram Regions
According to the first approach, equal segments are drawn on the histogram of the face of the sober as well as of the drunk person. In Figure 3a–d are illustrated the results obtained from dividing the histogram into 2, 4, 8 and 20 equal regions. Eight regions is actually the most appropriate number for separating the face in simple regions and not overpopulate it and simultaneously to gather the perceptually most useful information for a human.
From Figure 3c it is evident that the majority of the face pixels belong to the two histogram regions with the highest values (pixel values in 191–222 and in 223–255). For morphological feature extraction the shapes of the two regions will be used separately. Moreover, the shape of the region which results as the union of the previously mentioned two regions will be also used for morphological feature extraction. These regions are schematically depicted in red in Figure 4a,b. It is evident that the regions became larger as the person consumes alcohol.
This approach is not favorable for intoxication identification since the isothermal regions of the sober person must be available to be compared with the corresponding “drunk” image. However, this is not the case in real life problems where a drunk identification tests may be required for unknown persons. Accordingly, features must be found that will characterize uniquely the drunk persons.
3.2. Second Approach—Arbitrary Determination of a Specific Isotherm
With this approach features are derived for identifying a person as being drunk without the need of information from the sober person. To achieve this goal the isothermal region in which the whole forehead lies is monitored. Following tests on all images of the participated persons it was found that the region of the forehead for a sober person lies in the same isothermal range with other regions of the face. For the drunk person the region of the forehead is isolated and lies in its own isothermal region. Consequently, an isothermally isolated forehead corresponds to a drunk person. Figure 5 is coming to verify this fact, i.e., for the drunk person the forehand is isothermally isolated from the rest face. For the drunk person the red area in which the forehead lies decreases. This fact can be easily realized by an officer (e.g., policemen) when an automated system based on thermal infrared monitors the isotherms on the face of a person.
The features that will be used to make these changes of the isothermal regions measurable can be obtained by applying successive morphological operations called openings with an increasing in size structuring element (pecstrum or pattern spectrum). The obtained measurement, i.e., the way that the isothermal area decreases is called in shape analysis and mathematical morphology granulometries [28]. Anisotropic diffusion was applied on the isothermal regions before the morphological transformations and the feature extraction for slightly smoothing the boundaries of the isothermal regions.
4. Anisotropic Diffusion Preprocessing
Fine details and significant information, such as edges or pixel sized objects may be distorted by noise inherent in thermal images. A preprocessing technique which is capable in reducing noise without affecting the important information in the thermal images is anisotropic diffusion [23,24]. The basic concept of the anisotropic diffusion technique is the way that the pixel concentration distribution u is changing so that based on Fick’s law its gradient causes flux j:
where D is the diffusion tensor, which is in general a positive definite symmetric matrix, and is a function of the structure of the image. Diffusion can be considered as representing mass transport (gray values in images) without destroying mass or creating new mass. So,
where is the time partial derivative of the concentration distribution . After substituting Equations (1) into (2), it is obtained:
We can define the diffusion tensor to be a function of the gradient of :
so that diffusion is performed only parallel to the edges resulting in edge preservation. Perona and Malik provide in [23] a quadratic expression for :
where is a constant, depended on the particular application, which acts as an edge strength threshold.
The continuous anisotropic diffusion in (3) can be discretely implemented by using the four nearest neighbors and the Laplacian operator which was proposed by Perona and Malik [23]:
where in our experimental procedure we used , and , which corresponded to gradients to south, north, east and west directions. In this work, the parameter k was selected equal to 20 and the number of iterations equal to 7. After the extraction of the isothermal regions on the face of the each participant, two morphological processes were applied.
5. Morphological Feature Vectors
The morphological operation called opening (erosion followed by dilation) is very effective to extract information from binary images such as the isothermal regions are and simultaneously separate fine from bulky details. This is achieved by the proper selection of the structuring element (SE) [22], the size of which determines what kind of information will be rejected by the opening operation. Measuring the loss in the area of a binary object, when openings with successively increasing the SE are applied to it, is actually the way to evaluate the components of the morphological shape descriptor called pattern spectrum (pecstrum) [25,26]:
where is the result obtained after opening the initial image with SE and is the area of the object. Each gives the percentage of the total area of that is eliminated by the opening with the SE given that the opening with the SE has already been carried out. Consequently, all sum up to 1 with the last component of the pecstrum being the one for which the binary object disappears when the SE operates on it. Accordingly, the morphological shape description of a specific binary object called pattern spectrum is a k-dimensional vector which brings into the k-dimensional “pecstral” space the corresponding object. The reader can find detailed description of the properties of the pattern spectrum in [22,25,26].
Morphological impulses [22] were proposed as an alternative means to study the information content of the pattern spectrum. A morphological impulse is a convex binary object which remains unchanged when opened with the SE but is totally cancelled by the SE . This object is called an impulsive pattern or impulsive binary object. As a result, the dimensionality of the spectral space equals the number of the existing different morphological impulses. All the impulsive patterns have the same area each one equal to unity. These morphological impulses can be considered to constitute the unitary vectors of the k-dimensional pecstral space. The cumulative transformation (CT) [22] adapts the pecstral space to subjective requirements and is realized when the lower triangular matrix W with its nonzero elements equal to one, operates on the vector of the pecstrum
The matrix W represents an accumulation or integration procedure since each component of the new vector is the summation of the first components of the original pesctrum
6. Classification Using SVMs
Support Vector Machines (SVMs) [35,36,37] as being supervised learning models analyze data and reorganize patterns by employing machine learning algorithms. By employing training samples from two different populations an SVM assigns new appearing samples into one of the two categories since it is a non-probabilistic binary linear classifier. Actually, an SV machine achieves to map the clusters of the two categories so that a clear wide gap separates them. This gap prevents new incoming samples to be incorrectly classified. Furthermore, SVMs by employing the so called kernels achieve non-linear classification by mapping the samples into a higher dimensionality feature space.
For Linear Support Vector machines, the support vector algorithm searches for the separating hyper-plane with the largest margin between the data . This can be formulated so that all the training data fulfill the following constraints:
If we consider the points for which the equality in Equation (10) holds, then these points lie on the hyper-plane H1: with normal w and perpendicular distance from the origin . Similarly, the points for which the equality in Equation (11) holds lie on the hyper-plane H2: , with normal again w, and perpendicular distance from the origin . Hence and the margin is simply . We have to mention that H1 and H2 are parallel since they have common normal and that no training points fall between them. In this way the pair of hyper-planes which gives the maximum margin by minimizing can be determined. So the solution for a typical two dimensional case will have the form shown in Figure 6. Those training points for which the equality in Equation (10) or Equation (11) are valid and whose removal would change the solution found, are called support vectors; they are indicated in Figure 6 by the extra circles.
When the decision function is not a linear function of the data, the nonlinear Support Vector Machines [32,33,34] constitute a generalization of the above methods. First notice that the only way in which the data appear in the training problem, is on the form of dot products, . Here the training vectors are mapped into a higher dimensional Euclidean space by the function
Thus, the maximal margin is achieved by a linear separating hyper-plane determined by the SVM. Furthermore, , is called the kernel function. Among the kernels that have being proposed in the past are the linear, polynomial, Gaussian radial basis function and hyperbolic tangent. The effectiveness of SVM depends on the selection of the kernel and the kernel’s parameters.
7. Results and Discussion
The isothermal regions that were employed in the experimental procedure for assessing their contribution to the performance of the proposed method in drunk person identification are those with gray levels between 191–255, 223–255 and 191–222. Actually, two versions of these isothermal regions were used. Those obtained by simply extracting the pixels with the specific values and those obtained after applying a modest diffusion processes. The features employed from these isothermal regions were those obtained as pattern spectrum components as well as the impulsive pecstral components. Furthermore, various types of SVMs were tested for examining their performance in the specific identification problem, namely:
- Linear;
- Precomputed kernel;
- Polynomial kernel;
- Radial basis kernel;
- Sigmoidal kernel.
The combination of the above types of SVMs, with the two different morphological feature vectors, and the three types of isotherms with or without diffusion, gives 60 different cases for testing intoxication by means of isotherms. As it is explained in the following the most promising results were obtained using the impulsive spectrum without diffusion.
The first group of experimental results is given Table 1. The identification results are presented separately for the three isotherms using the pattern spectrum and various types of SVM kernels. The best performance appears for the isotherms (223–255) and (191–222) with diffusion. The most promising results in this case are obtained with linear and precomputed kernels with diffusion for 7 iterations and k = 20 for the isotherm 191–222, as well as for the isotherm 223–255. The success rate reaches 76% and it is considered acceptable given the high degree of boundary noise that is inherent in the procedure of isotherm extraction. Obviously, this noise is reduced with the diffusion procedure.
In Table 2 are given the drunk identification results using separately three different isotherms with feature vector as it results from the impulsive pattern spectrum for various types of SVM kernels. The best performance is obtained for the isotherm (191–222) with or without diffusion. The recognition percentage reaches almost 80%. We observe in this Table that the best results are obtained with linear and precomputed kernels without diffusion for the isotherm 191–222. Obviously, the other types of kernels as well as the isothermal regions are not appropriate for drunk discrimination. On the other hand, it is apparent when comparing with the previous case that diffusion gives no improvement on the identification results. This is expected from the fact that the impulsive pattern spectrum used as feature vector is robust in noise caused at the boundaries of the isothermal regions.
Finally, in Table 3 is presented the case of isotherms that occupy the area of the forehead and is simultaneously examined if other face regions are contained in these isotherms. The simple pecstrum without performing diffusion achieves the largest success, which reaches 86%. Pre-computed and linear kernel types were employed to obtain these results. Consequently, we obtain the interesting result that a drunk person is identified since the isothermal regions in which the forehead lies, contain actually no other region of the face. Accordingly, no comparison with the image of the sober person is needed for intoxication identification.
8. Conclusions
In this work the isothermal regions of the face of sober and the corresponding drunk persons are thoroughly studied in order to be used for detecting intoxication. Two different approaches are proposed for elaborating with the shapes of the isotherms. In the first, the isotherms are simply separated having the same width in the histogram. Using this approach and pattern spectrum features, the identification success reaches 76%. On the other hand, the second approach is based on determining the isothermal region in which the whole forehead of the person lies. It was found that while for the sober person the forehead is isothermal with other regions of the face, for the intoxicated person the forehead is isothermally isolated from the rest of the face. In this case, the drunk identification success reaches 86%.
The multi-frame view employed in our experiments gave the capability to elaborate on a large number of images and make reliable performance measurements for the proposed features.
Employing the above concepts into forensic procedures for intoxicated person discrimination, the second approach can be applied directly on the drunk person’s face and no need exists for using the infrared image of the sober person. If the forehead of the face is isolated from the rest of the face in a specific isotherm, then we have almost certainty that the person is drunk and the authorities have to proceed to invasive (breathalyzer or blood test) examination procedures. The proposed method is non-invasive and provides a fast means of intoxication detection.
Funding
This research received no external funding.
Institutional Review Board Statement
The proposed research: Thermal Biometric Features for “Drunk Person Identification using Multi-frame Imagery”, was approved by the Bioethics Committee of the University of Patras since the procedure followed complies with all national and international bioethics criteria (56/2013 Presidential Degree and the 2010/63 EU directive). This decision was validated by the Senate Assembly of the University. All persons participating in the experiments agreed, by filling out a specific form, for their personal data to be used by the international research committee.
Informed Consent Statement
Written informed consent has been obtained from the patient(s) to publish this paper.
Data Availability Statement
The used database is available at http://old.physics.upatras.gr/sober/ accessed on 14 October 2022. The algorithms will be available upon request.
Conflicts of Interest
The author declares no conflict of interest.
References
- Marsico, M.; Nappi, M.; Riccio, D.; Tortora, G. NABS: Novel Approaches for Biometric Systems. IEEE Trans. Syst. Man Cybern. Part C Appl. Rev. 2011, 41, 481–493. [Google Scholar] [CrossRef]
- Choi, J.Y.; De Neve, W.; Ro, Y.M.; Plataniotis, K.N. Automatic Face Annotation in Personal Photo Collections Using Context-Based Unsupervised Clustering and Face Information Fusion. IEEE Trans. Circuits Syst. Video Technol. 2010, 20, 1292–1309. [Google Scholar] [CrossRef]
- Benedikt, L.; Cosker, D.; Rosin, P.L.; Marshall, D. Assessing the Uniqueness and Permanence of Facial Actions for Use in Biometric Applications. IEEE Trans. Syst. Man Cybern. Part A Syst. Humans. 2010, 40, 449–460. [Google Scholar] [CrossRef]
- Sundararajan, K.; Woodart, D.L. Deep Learning for Biometrics: A Survey. ACM Comput. Surv. 2018, 51, 1–34. [Google Scholar] [CrossRef]
- Zhao, W.; Chellappa, R.; Phillips, P.J.; Rosenfeld, A. Face Recognition: A Literature Survey. ACM Comput. Surv. 2003, 35, 399–458. [Google Scholar] [CrossRef]
- Kaur, P.; Krishan, K.; Sharma, S.K.; Kanchan, T. Facial-recognition algorithms: A literature review. Med. Sci. Law 2020, 60, 131–139. [Google Scholar] [CrossRef] [PubMed]
- Benamara, N.K.; Zigh, E.; Stambouli, T.B.; Keche, M. Combined and Weighed Features for Robust Multispectral Face Recognition. In Proceedings of the IFIP International Conference on Computational Intelligence and Its Applications, Oran, Algeria, 8–10 May 2018; pp. 549–560. [Google Scholar]
- Zhou, S.; Xiao, S. 3D Face Recognition: A Survey. Hum. Cent. Comput. Inf. Sci. 2018, 8, 35. [Google Scholar] [CrossRef] [Green Version]
- Khan, M.M.; Ingleby, M.; Ward, R.D. Automated Facial Expression Classification and Affect Interpretation Using Infrared Measurement of Facial Skin Temperature Variations. ACM Trans. Auton. Adapt. Syst. 2006, 1, 91–113. [Google Scholar] [CrossRef]
- Zahirudin, A.R.; Ali, S.H.A. Anti-Drunk Driver Pedal Lock and Carbon Monoxide Alarm using Gas Sensor Detection. Evol. Electr. Electron. Eng. 2022, 3, 537–544. [Google Scholar]
- Etehadtavakol, M.; Ng, E.Y.K. An overview of medical infrared imaging in breast abnormalities detection. In Application of Infrared to Biomedical Sciences; Springer: Berlin/Heidelberg, Germany, 2017; pp. 45–57. [Google Scholar]
- Fernandez-Cuevas, I.; Lastras, J.A.; Galindo, V.E.; Carmona, P.G. Infrared thermography for the detection of injury in sports medicine. In Application of Infrared Thermography in Sports Science; Springer International Publishing: Cham, Switzerland, 2017; pp. 81–109. [Google Scholar]
- Socolinsky, D.A.; Selinger, A. A comparative Analysis of Face Recognition Performance with visible and thermal infrared imagery. In Proceedings of the 16th International Conference Pattern Recognition, Quebec City, QC, Canada, 11–15 August 2002; pp. 217–222. [Google Scholar]
- Kopaczka, M.; Nestler, J.; Merhof, D. Face Detection in Thermal Infrared Images: A Comparison of Algorithm and Machine Learning Based Approaches. Adv. Concepts Intell. Vis. Syst. 2017, 10617, 518–529. [Google Scholar]
- Farokhi, S.; Flusser, J.; Sheikh, U.U. Near infrared face recognition: A literature survey. Comput. Sci. Rev. 2016, 21, 1–17. [Google Scholar] [CrossRef]
- Koukiou, G.; Anastassopoulos, V. Drunk Person Identification using Thermal Infrared Images. Int. J. Electron. Secur. Digit. Forensics 2012, 4, 229–243. [Google Scholar] [CrossRef]
- Koukiou, G.; Anastassopoulos, V. Facial blood vessels activity in drunk persons using thermal infrared. In Proceedings of the 4th International Conference on Imaging for Crime Detection and Prevention, London, UK, 3–4 November 2011; pp. 1–4. [Google Scholar]
- Koukiou, G.; Anastassopoulos, V. Neural Networks for identifying drunk persons using thermal infrared imagery. Forensic Sci. Int. 2015, 252, 69–76. [Google Scholar] [CrossRef] [PubMed]
- Koukiou, G.; Anastassopoulos, V. Local Difference Patterns for Drunk Person Identification. Multimed. Tools Appl. 2018, 77, 9293–9305. [Google Scholar] [CrossRef]
- Bhuyan, M.K.; Dhawle, S.; Sasmal, P.; Κoukiou, G. Intoxicated Person Identification using Thermal Infrared Images and Gait. In Proceedings of the IEEE International Conference on Wireless Communications Signal Processing and Networking (WiSPNET 2018), Chennai, India, 22–24 March 2018; pp. 22–24. [Google Scholar]
- Kubicek, J.; Vilimek, D.; Krestanova, A.; Penhaker, M.; Kotalova, E.; Faure-Brac, B.; Noel, C.; Scurek, R.; Augustynek, M.; Cerny, M.; et al. Prediction Model of Alcohol Intoxication from Facial Temperature Dynamics Based on K-Means Clustering Driven by Evolutionary Computing. Symmetry 2019, 11, 995. [Google Scholar] [CrossRef] [Green Version]
- Anastassopoulos, V.; Venetsanopoulos, A.N. The classification properties of the pecstrum and its use for pattern identification. Circ. Syst. Sig. Proc. 1991, 10, 293–326. [Google Scholar] [CrossRef]
- Perona, P.; Malik, J. Scale-Space and Edge Detection Using Anisotropic Diffusion. IEEE Trans. Pattern Anal. Mach. Intell. 1990, 12, 629–639. [Google Scholar] [CrossRef] [Green Version]
- Weickert, J. Anisotropic Diffusion in Image Processing; Springer Vieweg Verlag: Stuttgart, Germany, 1998. [Google Scholar]
- Bronskill, J.F.; Venetsanopoulos, A.N. Multidimensional shape description and recognition using mathematical morphology. J. Intell. Robot. Syst. June 1988, 1, 117–143. [Google Scholar] [CrossRef]
- Bronskill, J.F.; Venetsanopoulos, A.N. The pecstrum. In Proceedings of the 3rd ASSP Workshop on Spectral Estimation and Modeling, Boston, MA, USA, 1–3 November 1986. [Google Scholar]
- Janicki, A.; Staroszczyk, T. Speaker Recognition from Coded speech using Support Vectors Machines. In Proceedings of the 14th International Conference on Text, Speech and Dialogue, Pilsen, Czech Republic, 1–5 September 2011; pp. 291–298. [Google Scholar]
- Joanchims, T. Text categorization with Support Vector Machines: Learning with many relevant features. Mach. Learn. 2005, 1398, 137–142. [Google Scholar]
- Oliveira, L.S.; Sabourin, R. Support Vector Machines for Handwritten Numerical String Recognition. In Proceedings of the Ninth International Workshop on Frontiers in Handwriting Recognition, Kokubunji, Japan, 26–29 October 2004. [Google Scholar]
- Osuna, E.; Freund, R.; Girosi, F. Training Support Vector Machines: An Application to Face Detection. In Proceedings of the IEEE Computer Society Conference on Computer Vision and Pattern Recognition, San Juan, PR, USA, 17–19 June 1997. [Google Scholar]
- Pontil, M.; Verri, A. Support Vector Machines for 3D object recognition. IEEE Trans. Pattern Anal. Mach. Intell. 1998, 20, 637–646. [Google Scholar] [CrossRef] [Green Version]
- Sadri, J.; Suen, C.Y.; Bui, T.D. Application of Support Vector Machines for Recognition of Handwritten Arabic/Persian Digits. In Proceedings of the Second Iranian Conference on Machine Vision and Image Processing, Tehran, Iran, 23 February 2003. [Google Scholar]
- Jones, A.W. The Relationship between Blood Alcohol Concentration (BAC) and Breath Alcohol Concentration (BrAC): A Review of the Evidence; Road Safety Web Publication No. 15; Department for Transport: London, UK, 2010. [Google Scholar]
- International Center of Alcohol Policies. ICAP Blue Book, Module 16: Blood Alcohol Concentration Limits; ICAP: Washington, DC, USA, 2014. [Google Scholar]
- Chang, C.C.; Lin, C.J. LIBSVM—A Library for Support Vector Machines. ACM Trans. Intell. Syst. Technol. 2011, 2, 1–27. [Google Scholar] [CrossRef]
- Hsu, C.W.; Chang, C.C.; Lin, C.J. A Practical Guide to Support Vector Classification. 2016. Available online: https://www.csie.ntu.edu.tw/~cjlin/papers/guide/guide.pdf (accessed on 14 October 2022).
- Meyer, D. Support Vector Machines. The Interface to Libsvm in Package e1071. 2015. Available online: https://rdrr.io/rforge/e1071/f/inst/doc/svmdoc.pdf (accessed on 14 October 2022).
Figure 1.
Mean value of the 50-frame multi-view acquisition of a specific intoxicated person.

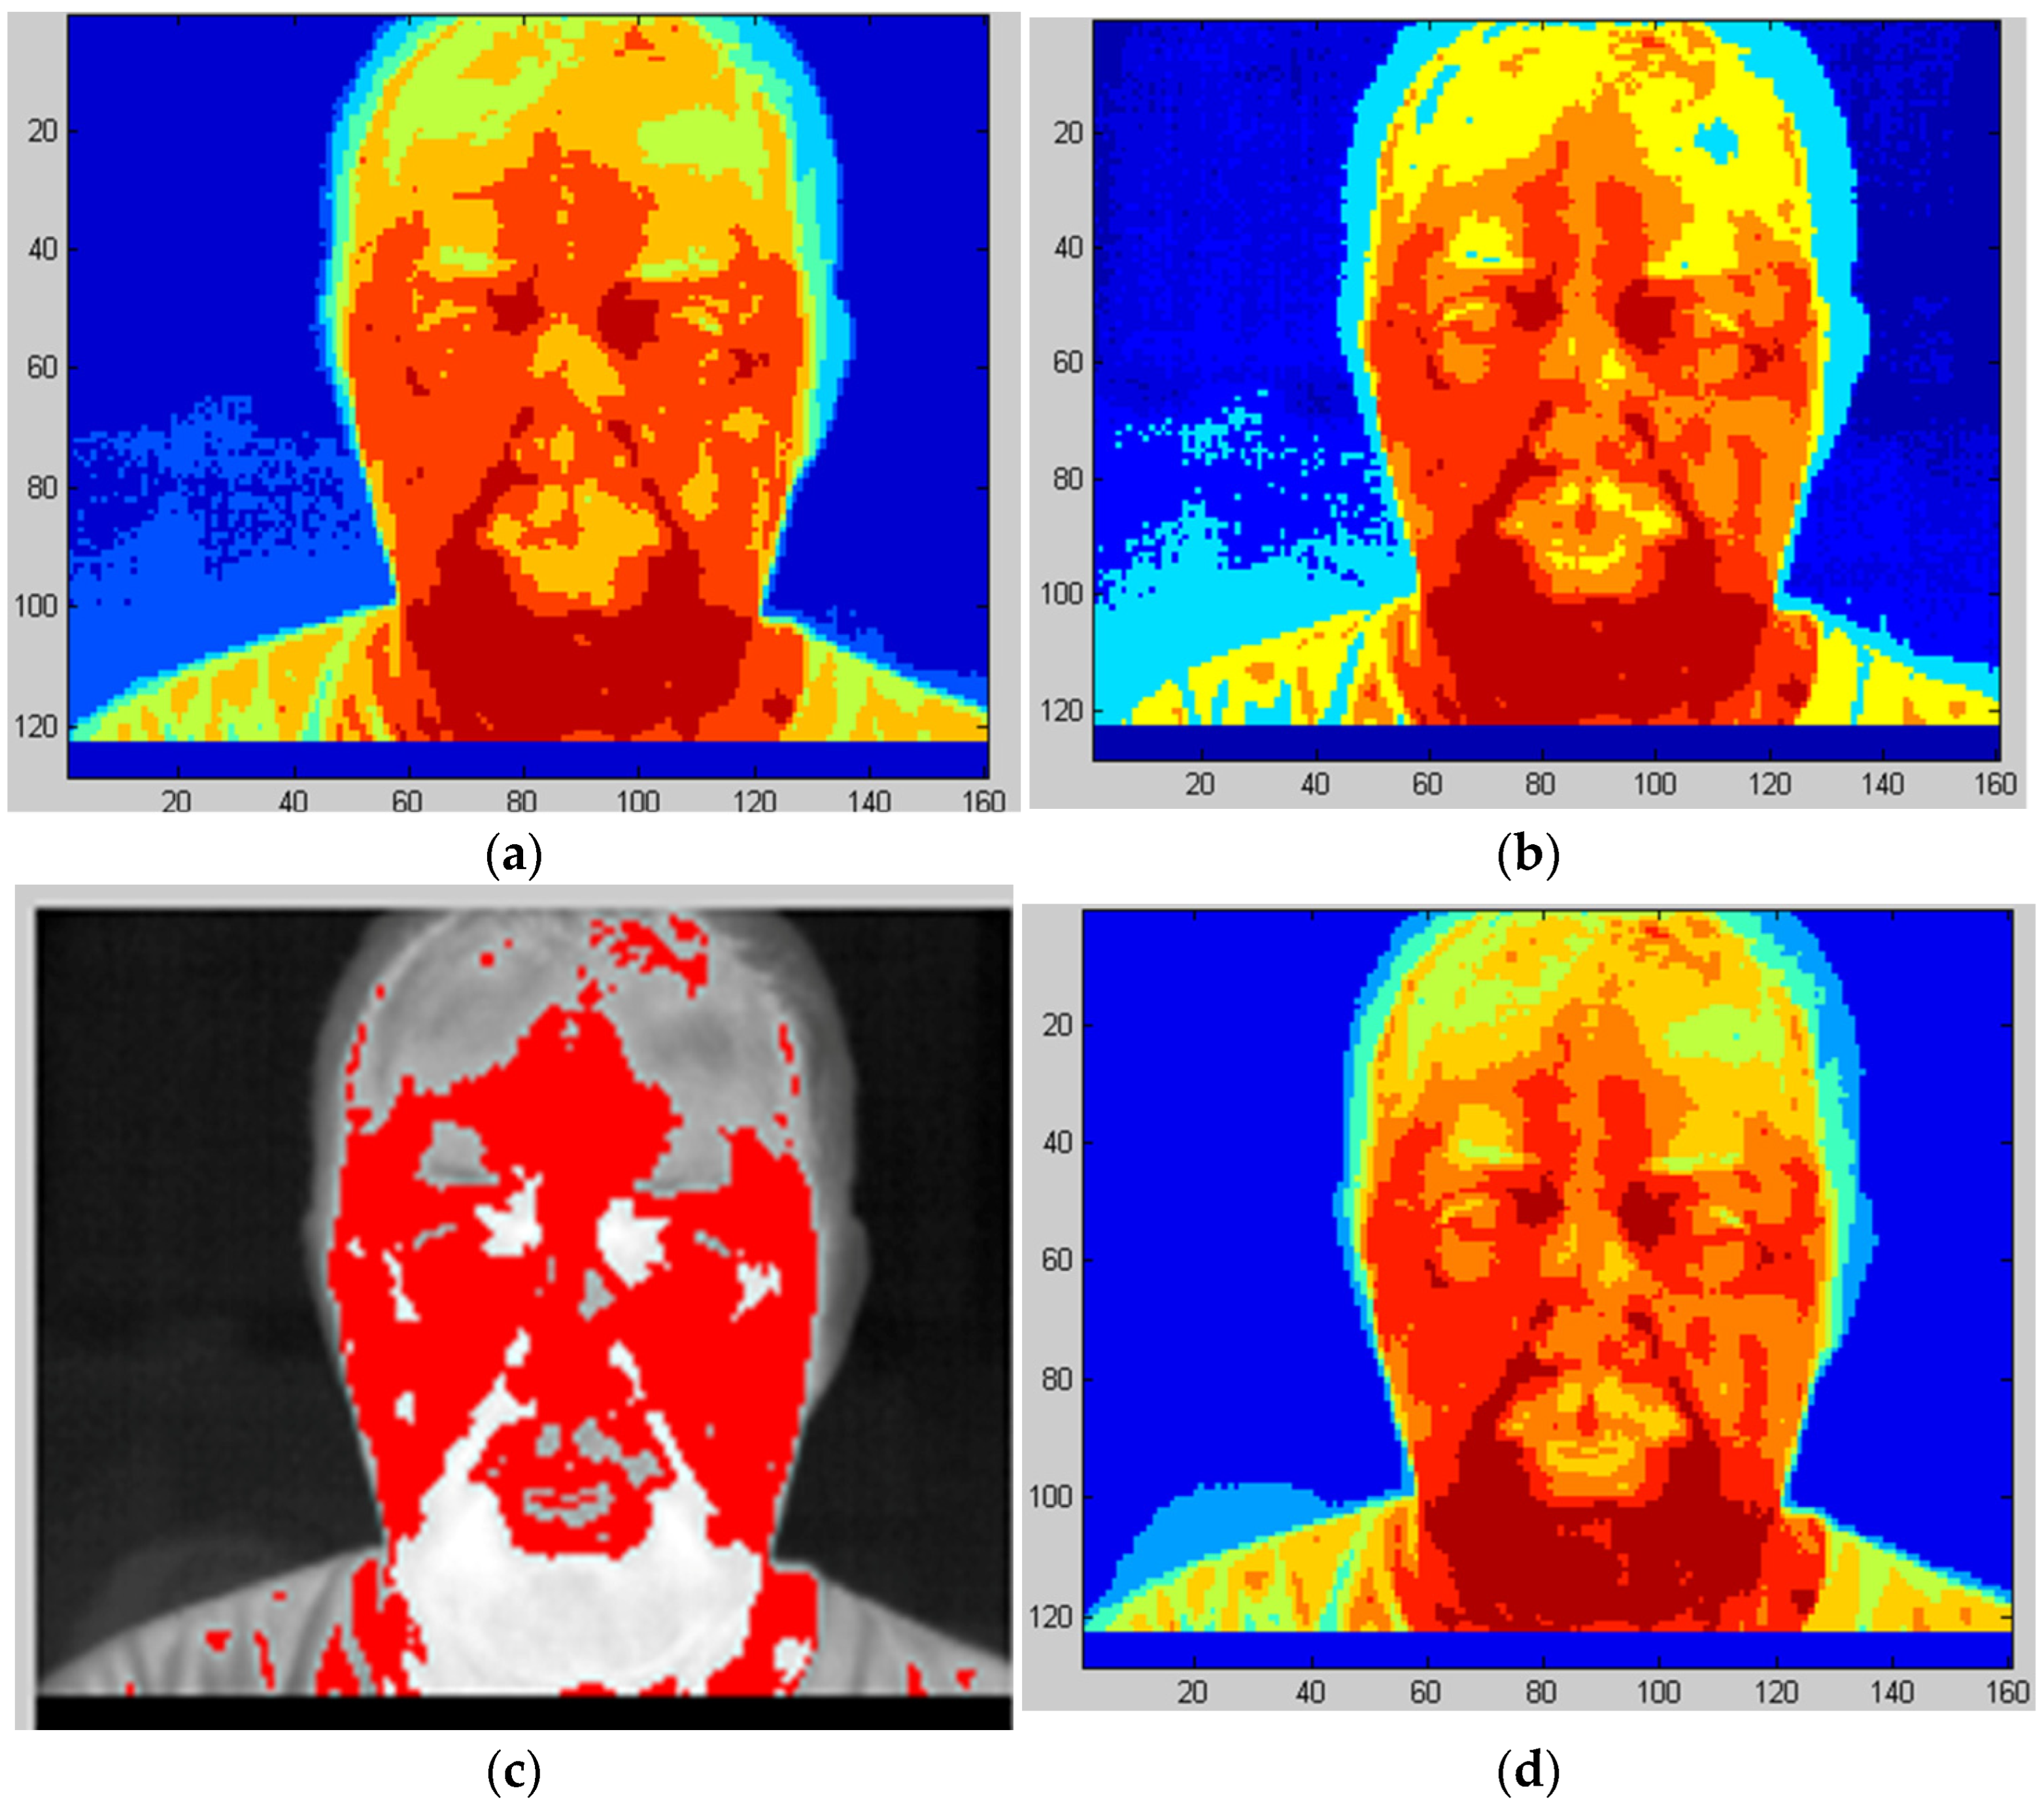
Figure 2.
Various types of isothermal regions on the face. (a) Eight equal in length segments of the histogram (0–255). (b) Eight segments of the histogram equal populated. (c) A single isothermal region isolated on the image. (d) Arbitrary determination of the isothermal regions based on the minima of the histogram.

Figure 3.
Isothermal regions obtained by dividing the histogram into (a) two regions, (b) four regions, (c) eight regions and (d) twenty regions.
Figure 3.
Isothermal regions obtained by dividing the histogram into (a) two regions, (b) four regions, (c) eight regions and (d) twenty regions.

Figure 4.
As the sober person (a) consumes alcohol the red regions depicting hotter locations increase (b). The red regions on the left column have pixel values from 191 to 222, in the middle from 223 to 255, while on the right from 191 to 255.
Figure 4.
As the sober person (a) consumes alcohol the red regions depicting hotter locations increase (b). The red regions on the left column have pixel values from 191 to 222, in the middle from 223 to 255, while on the right from 191 to 255.

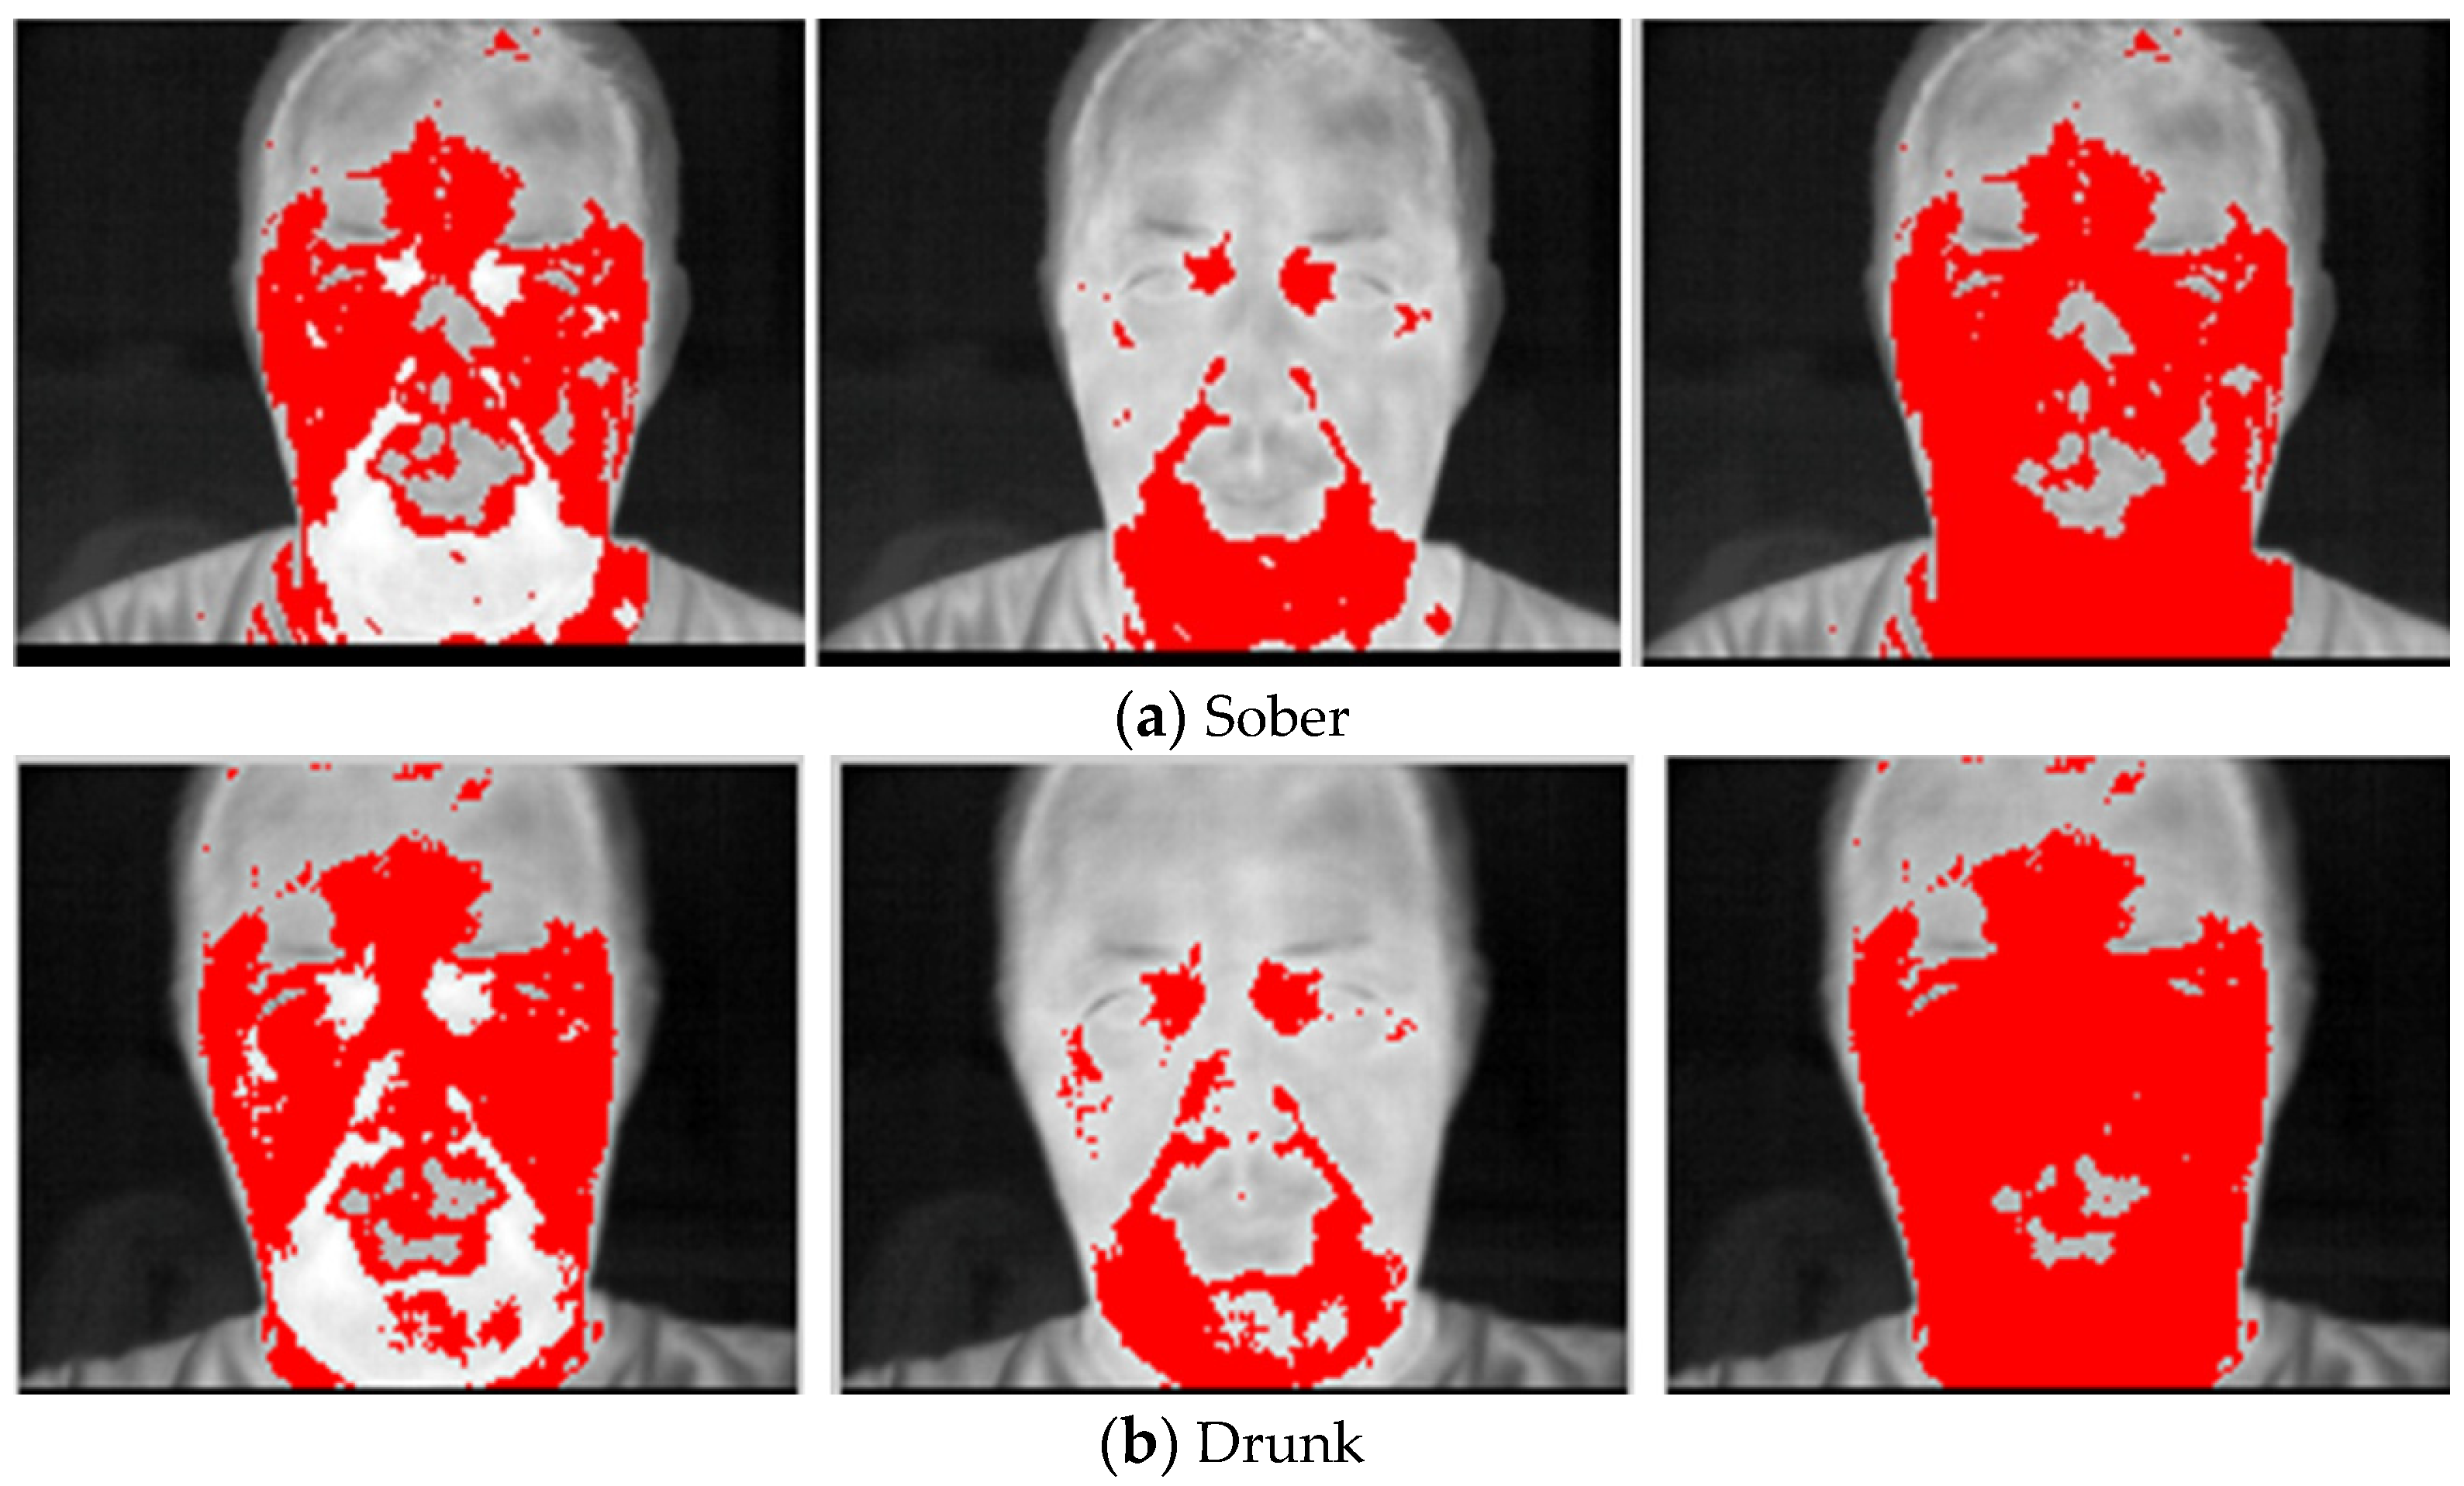
Figure 5.
(a) For the sober person the forehead lies in the same isothermal region together with other locations of the face. (b) The forehead lies in a different isothermal region than the rest of the face for the drunk person.
Figure 5.
(a) For the sober person the forehead lies in the same isothermal region together with other locations of the face. (b) The forehead lies in a different isothermal region than the rest of the face for the drunk person.

Figure 6.
Maximum-margin hyperplane and margins for an SVM trained with samples from two classes. Samples on the margin are called the support vectors. Clusters are highly enriched by means of the 50-frame multi-view procedure. A cluster of 50 points is formed when the person is sober and the another one when the person is drunk.


Table 1.
Drunk person identification results for the three isothermal regions and feature vector the pattern spectrum for various kernel types. The best performance is obtained for isotherms (223–255) and (191–222) with diffusion.
Table 1.
Drunk person identification results for the three isothermal regions and feature vector the pattern spectrum for various kernel types. The best performance is obtained for isotherms (223–255) and (191–222) with diffusion.
| Pattern Spectrum | Kernel Type | Equidistant (191–255) | Equidistant (223–255) | Equidistant (191–222) | |||
| Diffusion It = 7 k = 20 (%) | No Diffusion (%) | Diffusion It = 7 k = 20 (%) | No Diffusion (%) | Diffusion It = 7 k = 20 (%) | No Diffusion (%) | ||
| Linear | 67.74 | 68.75 | 75.86 | 66.67 | 76.92 | 64 | |
| Precomputed | 67.74 | 68.75 | 75.86 | 66.67 | 76.92 | 64 | |
| Polynomial | 61.29 | 50 | 62.07 | 57.58 | 57.69 | 64 | |
| Radial Basis | 44.96 | 47.18 | 49.03 | 49.15 | 47.04 | 45 | |
| Sigmoidal | 44.96 | 57.15 | 49.03 | 49.15 | 47.04 | 45 | |
Table 2.
Drunk person identification results for the three isothermal regions and feature vector the impulse pattern spectrum for various kernel types. The best performance is obtained for isotherms (191–222) both with or without diffusion.
Table 2.
Drunk person identification results for the three isothermal regions and feature vector the impulse pattern spectrum for various kernel types. The best performance is obtained for isotherms (191–222) both with or without diffusion.
| Impulsive Pattern Spectrum | Kernel Type | Equidistant (191–255) | Equidistant (223–255) | Equidistant (191–222) | |||
| Diffusion It = 7 k = 20 (%) | No Diffusion (%) | Diffusion It = 7 k = 20 (%) | No Diffusion (%) | Diffusion It = 7 k = 20 (%) | No Diffusion (%) | ||
| Linear | 66.12 | 67.05 | 71.04 | 54.10 | 75.12 | 79.01 | |
| Precomputed | 66.12 | 67.05 | 71.04 | 51 | 75.12 | 79.01 | |
| Polynomial | 57.03 | 71.05 | 55.13 | 51 | 52.07 | 72.11 | |
| Radial Basis | 51 | 57.08 | 55.13 | 51 | 45.33 | 47.17 | |
| Sigmoidal | 51 | 54.04 | 62.17 | 51 | 45.33 | 51 | |
Table 3.
Drunk person identification results using the isothermal of forehead region and feature vectors both the pattern spectrum and the impulse pattern spectrum for various kernel types. The best performance is obtained in case of pattern spectrum without diffusion.
Table 3.
Drunk person identification results using the isothermal of forehead region and feature vectors both the pattern spectrum and the impulse pattern spectrum for various kernel types. The best performance is obtained in case of pattern spectrum without diffusion.
| Pattern Spectrum | Kernel Types | Forehead | Impulsive Pattern Spectrum | Forehead | ||
| Diffusion It = 7 k = 20 (%) | No Diffusion (%) | Diffusion It = 7 k = 20 (%) | No Diffusion (%) | |||
| Linear | 64.71 | 86.07 | 72.73 | 62.5 | ||
| Precomputed | 64.71 | 86.07 | 72.73 | 62.5 | ||
| Polynomial | 73.11 | 71.43 | 54.55 | 62.5 | ||
| Radial Basis | 46.03 | 58.03 | 45.45 | 50 | ||
| Sigmoidal | 46.03 | 58.03 | 45.45 | 50 | ||
Publisher’s Note: MDPI stays neutral with regard to jurisdictional claims in published maps and institutional affiliations. |
© 2022 by the author. Licensee MDPI, Basel, Switzerland. This article is an open access article distributed under the terms and conditions of the Creative Commons Attribution (CC BY) license (https://creativecommons.org/licenses/by/4.0/).
Share and Cite
MDPI and ACS Style
Koukiou, G. Thermal Biometric Features for Drunk Person Identification Using Multi-Frame Imagery. Electronics 2022, 11, 3924. https://doi.org/10.3390/electronics11233924
AMA Style
Koukiou G. Thermal Biometric Features for Drunk Person Identification Using Multi-Frame Imagery. Electronics. 2022; 11(23):3924. https://doi.org/10.3390/electronics11233924
Chicago/Turabian StyleKoukiou, Georgia. 2022. "Thermal Biometric Features for Drunk Person Identification Using Multi-Frame Imagery" Electronics 11, no. 23: 3924. https://doi.org/10.3390/electronics11233924
Note that from the first issue of 2016, this journal uses article numbers instead of page numbers. See further details here.