Article

Chatter Detection in Variable Cutting Depth Side Milling Using VMD and Vibration Characteristics Analysis

1
School of Chemical and Mechanical Engineering, Liaodong University, Dandong 118001, China
2
School of Mechanical Engineering, Lancaster University, Lancaster 113001, UK
3
School of Mechanical Engineering, Liaoning Petrochemical University, Fushun 113001, China
*
Author to whom correspondence should be addressed.
Electronics 2022, 11(22), 3779; https://doi.org/10.3390/electronics11223779
Submission received: 18 October 2022 / Revised: 11 November 2022 / Accepted: 15 November 2022 / Published: 17 November 2022
(This article belongs to the Special Issue Smart Sensing, Monitoring, and Control in Industry 4.0)

Abstract

:
Chatter is a key factor affecting tool wear, workpiece surface quality and cutting efficiency. When milling thin-walled parts, it is difficult to extract the chatter frequency band due to the time-varying characteristics of the dynamic parameters of the machining system. Variational mode decomposition (VMD) shows good performance in signal processing, but the decomposition result of this algorithm is limited by the influence of initialization parameters. Therefore, this paper proposes a scheme to determine the number of VMD decomposition layers based on the number of Fourier transform frequency peaks. The feasibility of the scheme is verified by the simulation signal and experiment signal. The results show that taking the peak number of the spectrum as the decomposition level of VMD, the spectrum distribution of the decomposed intrinsic mode function (IMF) is clear, and the frequency band containing rich chatter information can be effectively extracted.

1. Introduction

When milling thin-walled parts, due to the low stiffness characteristics, chatter may exist in the whole processing process [1]. Chatter is a key factor affecting tool wear, cutting temperature and workpiece surface quality [2,3]. Based on the prediction correction scheme, Qin et al. [4]. developed an accurate and effective global discretization method for milling process stability analysis. However, due to the complex milling environment and time-varying characteristics of mechanical systems, chatter prediction is not universal. With the development of mechanical fault diagnosis in recent years, more and more mature technologies have been applied to actual processing [5,6]. This has provided new ideas for the development of chatter detection.
The key technology of online chatter detection is chatter feature extraction. At present, popular chatter detection schemes are mainly divided into the time domain, frequency domain and time–frequency domain. In the early state of chatter generation, the signal strength is weak, the amplitude is small, and it is easy to be overwhelmed by environmental noise. YE et al. [7] calculated the root mean square of the time-domain sampling sequence and used the ratio of the standard deviation and the mean of the root mean square sequence as the coefficient of variation to identify chatter. F. Rumusanu et al. [8] transformed the cutting force signal from the time domain to the frequency domain through the Fast Fourier Transform (FFT), then calculated the ratio of the maximum amplitude value to the average value of the cutting force signal in the given frequency domain, and used this value to assess processing system stability. Tang et al. [9] used the power spectral density (PSD) of the cutting force signal for chatter detection during cutting. Because of the complex machining environment and time-varying characteristics of the machining system for thin-walled parts, it is difficult for the time domain method and the frequency domain method to capture the change process and feature extraction of the signal in real-time. Liu et al. [10]. proposed an online chatter monitoring method using fast kurtogram (FK) and band power (FBP). Using FK, the band with the largest SK can be found. Therefore, FBP is used to monitor flutter according to energy change. The proposed method has obtained satisfactory detection results.
To solve the shortcomings of the above methods, the time–frequency domain method is proposed [11,12]. Wavelet transform (WT) [13], wavelet packet (WPT) [14] and other methods are widely used in the field of mechanical fault diagnosis and identification [13]. Hao et al. [15] proposed a novel chatter detection method based on multi-source signals fusion using wavelet packet decomposition (WPD) and power entropy. The application of wavelet decomposition is always limited by the choice of a good decomposition level of the wavelet function. Empirical mode decomposition (EMD) has been widely used in the field of fault diagnosis since it was proposed. To solve this problem, the ensemble empirical mode decomposition method (EEMD) was proposed. Ji et al. [16] proposed to decompose the acceleration signal into a series of intrinsic mode functions (IMF) through EEMD and select the IMF containing the characteristic information of the milling process as the analysis signal. The power spectrum entropy and fractal dimension obtained by the morphological covering method are introduced to detect chatter characteristics. Liu et al. [17] proposed a method combining empirical mode decomposition (EEMD) and nonlinear dimensionless index.
VMD theory is an adaptive decomposition algorithm [18]. Some characteristics of the algorithm itself, such as quasi-orthogonality, good noise robustness and energy conservation, make it widely used in the field of signal processing. Wang et al. [19] pointed out that VMD decomposition can more accurately extract chatter features, which is conducive to subsequent processing state identification. Liu et al. [20] used the VMD method to decompose the vibration signal and then used the Shannon power spectrum entropy to extract the features of the decomposed signal by VMD, which applied it to the identification of chatter. Zhang et al. [21] pointed out that VMD can accurately extract the characteristics of bearing fault signals. Li et al. [20] proposed an improved parameter adaptive VMD (PAVMD) method and used an improved particle swarm optimization algorithm. It showed that the proposed PAVMD method had better performance and stronger robustness than the traditional method, and it was suitable for single-fault and multi-fault situations at the same time. Wu et al. [22] proposed a method called center frequency statistical analysis (CFSA) to determine the K value. Then, the behavior of the CFSA method in the presence of variable component amplitude, component frequency, component number and noise amplitude was analyzed using analog signals. Additionally, the bearing vibration characteristic frequency was extracted. The VMD method has been widely used in feature extraction [23]. However, it is necessary to set the optimal penalty coefficient and the number of decomposition modes in advance. Optimizing VMD parameters is time-consuming, which seriously affects the performance of VMD applications in chatter detection. Based on this question, Kai Yang et al. [24] optimized the VMD penalty factor and the number of decomposed modes globally based on the simulated annealing algorithm (SA). Compared with EMD, it was found that the optimized VMD was robust and could accurately identify chatter. Liu et al. [25] proposed to automatically select the method of VMD’s parameters based on kurtosis. VMD is widely used as an emerging chatter detection method, but how to choose the best combination of decomposition layers and penalty factors still requires in-depth research. The above optimization algorithms all have the problem of high time cost and cannot meet the real-time requirements. The use of the VMD method for extracting chatter characteristics during milling is rarely reported in the literature. In addition, the premise of chatter feature extraction is to accurately determine the chatter frequency band. At the initial state of chatter, there is a problem that the chatter characteristics are not obvious. Hence, the research on the efficient and accurate extraction method of early chatter features has guiding significance for theory and practice.
At present, many scholars have applied the optimization algorithm to VMD parameter optimization and obtained satisfactory results. However, some optimization algorithms have many problems, such as too many iterations, too many initialization parameters, setting of iteration termination conditions, falling into local optimal solutions and high time cost. Due to the instantaneous characteristics of chatter, real-time chatter feature extraction is necessary. When chatter occurs, the peak value appears near the natural frequency of the machining system. Therefore, this paper considers the peak value of the FFT spectrum as the number of decomposition layers of VMD, which will greatly improve the efficiency of parameter optimization and can effectively extract the chatter frequency band.
The effectiveness of this scheme in identifying machining status is proved in this article. In this paper, the cutting force signal is acquired by a force sensor with variable cutting depth. Because the decomposition efficiency and accuracy of VMD are restricted by the number of decomposition layers, this paper adopts the scheme of the peak number of the FFT spectrum to determine the number of decomposition layers of VMD. The chatter feature extraction scheme combining VMD and FFT is verified by simulation signals and experimental signals. The experimental and simulation results show that this scheme can effectively extract chatter features and realize the purpose of machining status recognition.

2. Mathematical Model of VMD Method

With ref. [26], the IMF is defined as an AM-FM signal. Its expression is
r k ( t ) = A k ( t ) cos ( φ k ( t ) ) ,
where A k ( t ) is the instantaneous amplitude of r k ( t ) , ω k ( t ) is the instantaneous frequency of r k ( t ) and instantaneous frequency is ω k ( t ) = φ k ( t ) .
The purpose of VMD is to decompose the real input signal x ( t ) into a discrete number of sub-signals (modalities) r k ( t ) with sparse properties. Each mode is concentrated near the central frequency to the greatest extent and has a certain width. To estimate the bandwidth of each mode r k ( t ) , the following construction scheme is proposed:
Hilbert transform is introduced to transform the mode into an analytic signal with a unilateral spectrum:
( δ ( t ) + j π t ) r k ( t ) .
The exponential e j ω k t and the analytical signal are frequency mixed, and the modal frequency is demodulated to the baseband by demodulating the analytical signal to the corresponding estimated center frequency:
[ ( δ ( t ) + j π t ) r k ( t ) ] e j ω k t ,
where ω k represents the center frequency of an IMF, in which k = 1, 2, …, K, δ ( t ) represents the original signal and x ( t ) is a function after Hilbert transformation adding exponential term. For easy calculation, ω k ( t ) , r k ( t ) are abbreviated as ω k , r k .
The bandwidth of each IMF is estimated by the square L 2 norm if the original signal y ( t ) is decomposed into K IMF components. Then, the square of the time gradient is calculated, the bandwidth of the mode is estimated and the constraint model is obtained as follows:
min { r k } , { w k } { k t [ ( δ ( t ) + j π t ) r k ( t ) ] e j w k t 2 2 } s . t . k r k = y ( t ) ,
where { r k } = { r 1 , , r K } represents the K IMF components obtained by VMD decomposition and { ω k } = { ω 1 , ω K } represents the frequency center of each IMF component.
By introducing the penalty factor and Lagrangian multiplier, the constrained problem can be transformed into an unconstrained problem. When Gaussian noise exists, the reconstruction accuracy and the strictness of constraints can be guaranteed.
The expression of the Lagrange multiplier is as follows:
L ( { r k } , { w k } , λ ) = α k [ ( δ ( t ) + j π t ) r k ( t ) ] e j w k t 2 2 + y ( t ) k r k ( t ) 2 2 + [ λ ( t ) , y ( t ) k r k ( t ) ]
where α is defined as the quadratic penalty coefficient when the Lagrangian factor λ is introduced. Initialize { r k 1 } , { ω k 1 } , λ 1 , n = 0. By alternately updating r k n + 1 , ω k n + 1 , λ n + 1 seeks the saddle point of the extended Lagrangian formulation, then the frequency domain solution of the quadratic unconstrained optimization problem to be solved is obtained:
r ^ k n + 1 ( t ) = a r g min { ( ω ω k ) 2 | r ^ k ( t ) | 2 d ω .
Solve in the frequency domain to get the update method of the center frequency of each frequency band:
ω k n + 1 = 0 ω | r ^ ( ω ) | 2 d ω 0 | r ^ k ( ω ) | 2 d ω
where ω is the signal frequency, r ^ k n + 1 ( ω ) is equivalent to the Wiener filter of the current residual amount and ω k n + 1 is the center of the current IMF power spectrum.

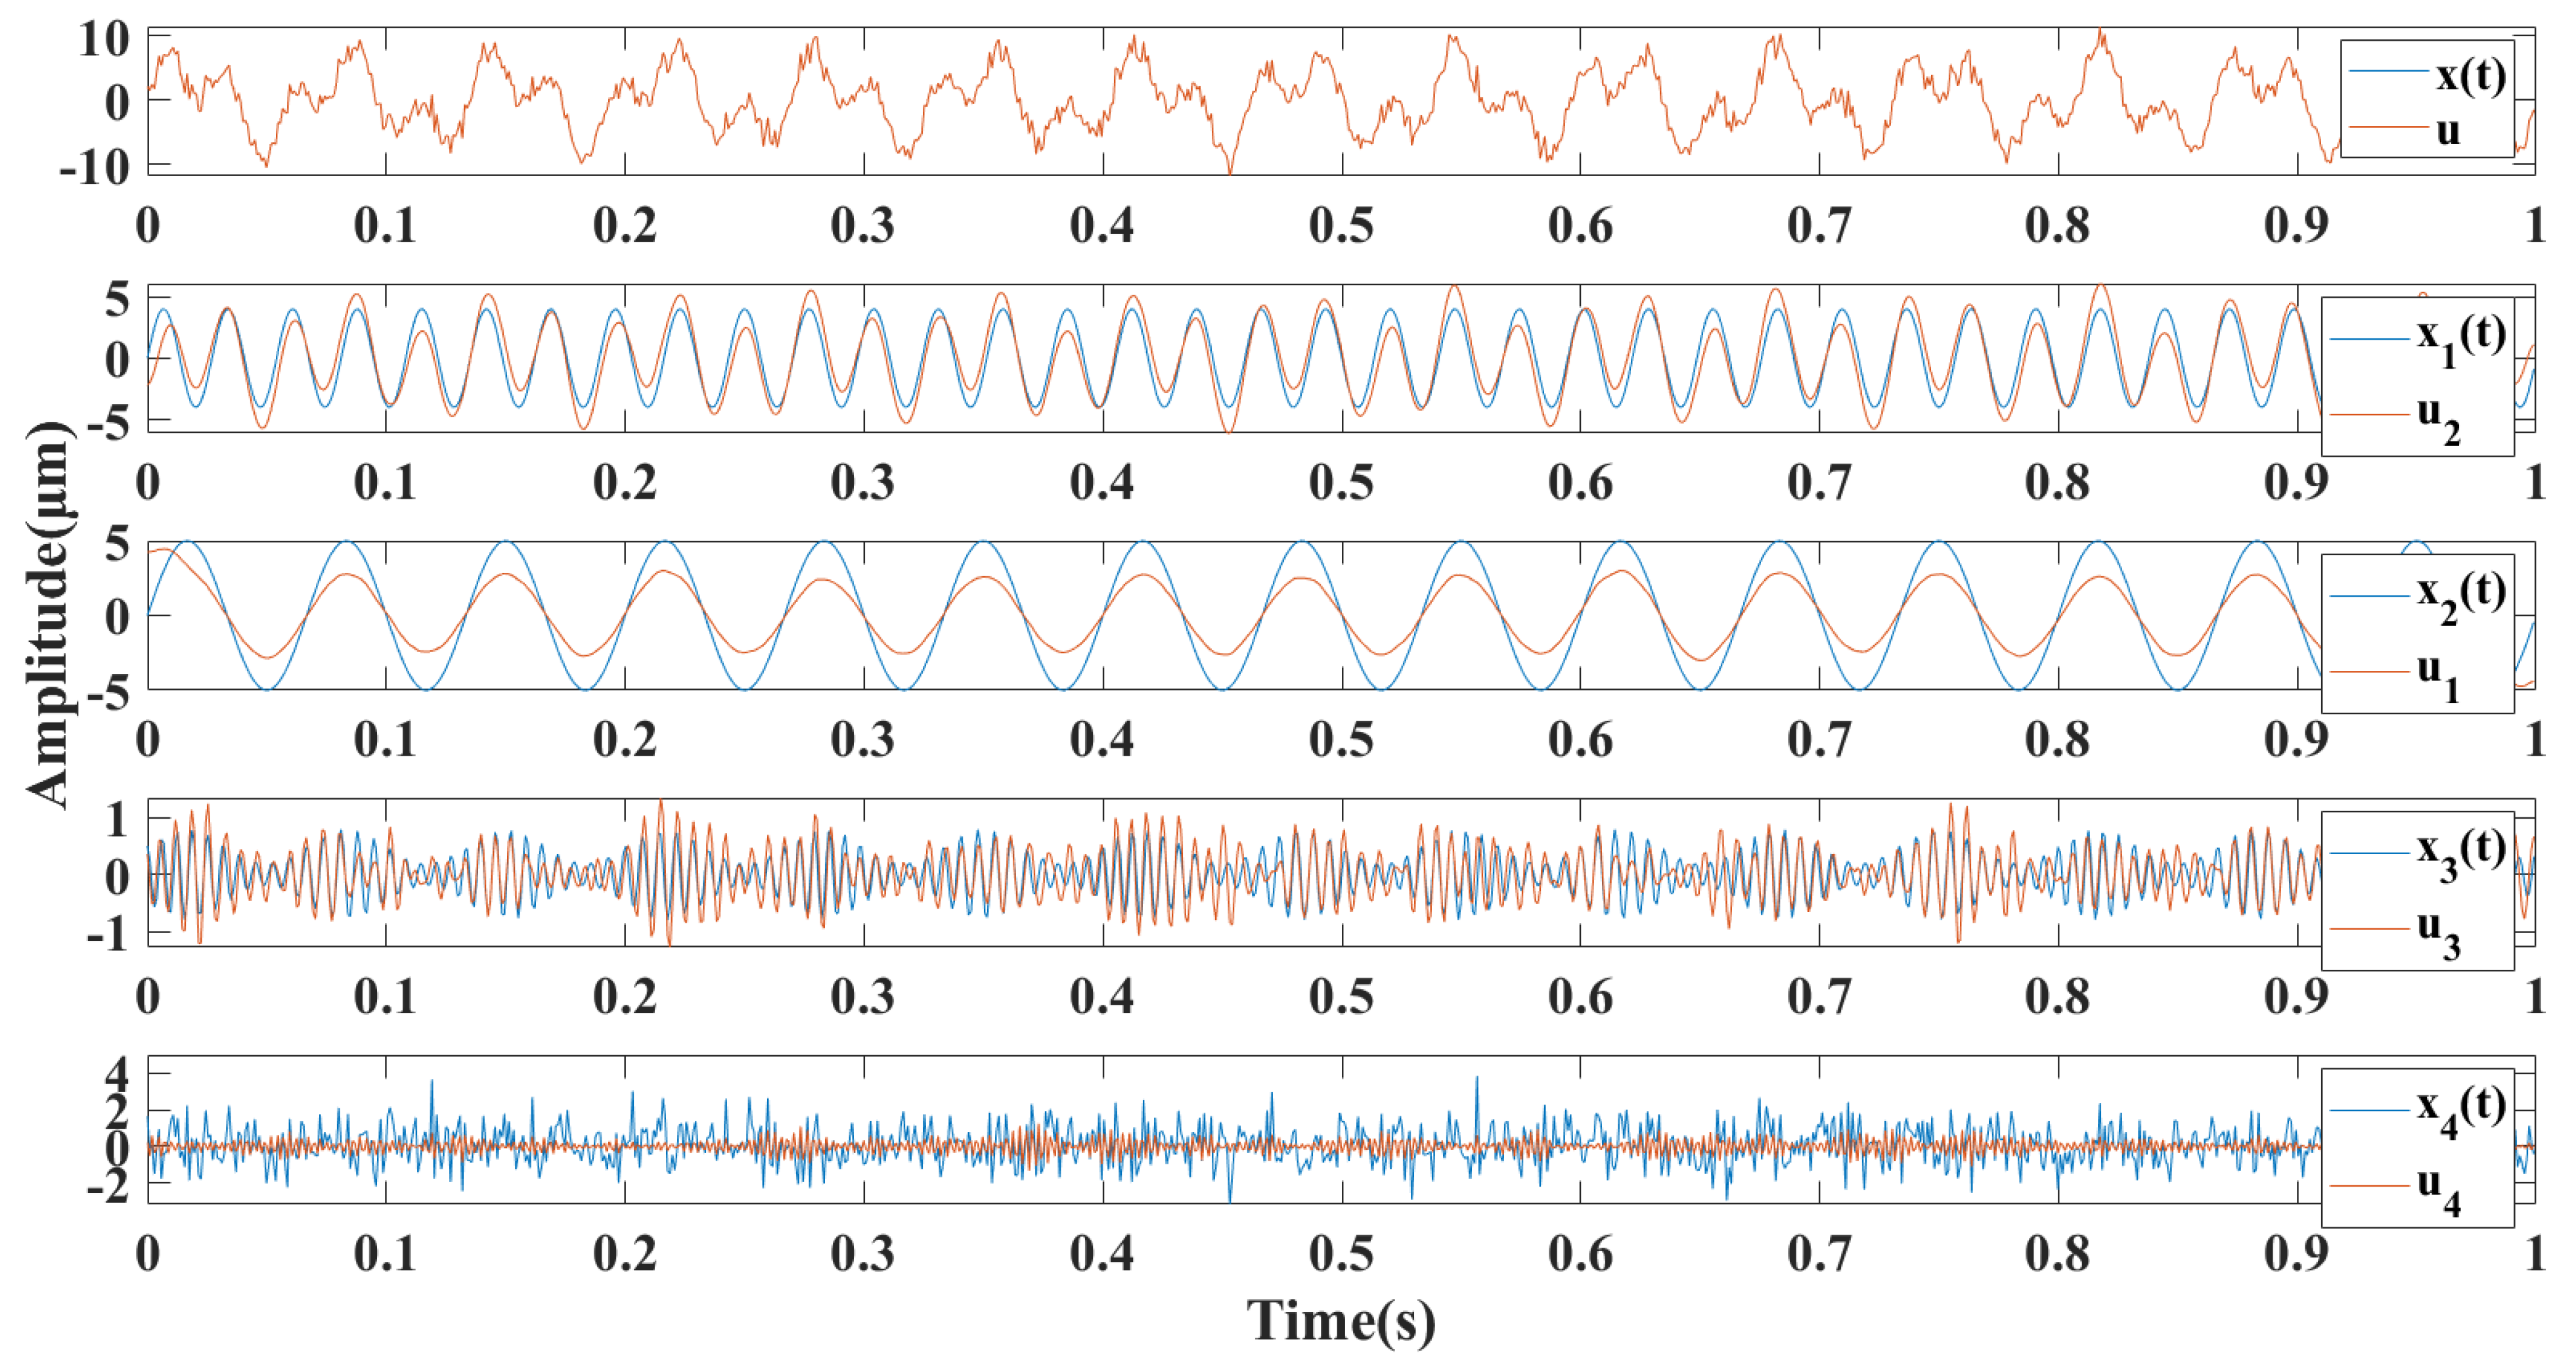
3. Simulation Signal Analysis

Using Equation (8) to simulate the milling vibration signal containing the chatter component:
x ( t ) = x 1 ( t ) + x 2 ( t ) + x 3 ( t ) + x 4 ( t ) ,
where x 1 ( t ) = 4 sin ( 160 π t ) , x 2 ( t ) = 5 cos ( 40 π t ) and x 3 ( t ) = 0.5 [ 1 + 0.6 sin ( 30 π t ) ] cos ( 300 π t + 1.5 sin ( 15 π t ) ) .
Using VMD to decompose x ( t ) , the four modal components are denoted as u 1 , u 2 , u 3 , u 4 . The comparison with the components of the original signal is shown in Figure 1. It can be seen that u , u 2 , u 1 , u 3 and the corresponding x ( t ) , x 1 ( t ) , x 2 ( t ) , x 3 ( t ) have little difference in amplitude and frequency. However, the difference between u 4 and x 4 ( t ) is large because x 4 ( t ) is white noise generated randomly. It can be seen from Figure 2 that the spectrum is mainly concentrated in four frequency bands, which provides a basis for the selection of the number of modes. The spectrum analysis is shown in Figure 2.
The frequency ω 1 = 80 Hz of x 1 ( t ) in the original signal, the frequency ω 2 = 20 Hz of x 2 ( t ) and the chatter frequency band represented by x 3 ( t ) appear clearly in the recombination signal, explaining that there is no omission of frequency information.
However, in the frequency spectrum of the reconstructed signal, it can be found that the high frequency of the noise part is reduced, which reflects the noise reduction characteristics of VMD decomposition.

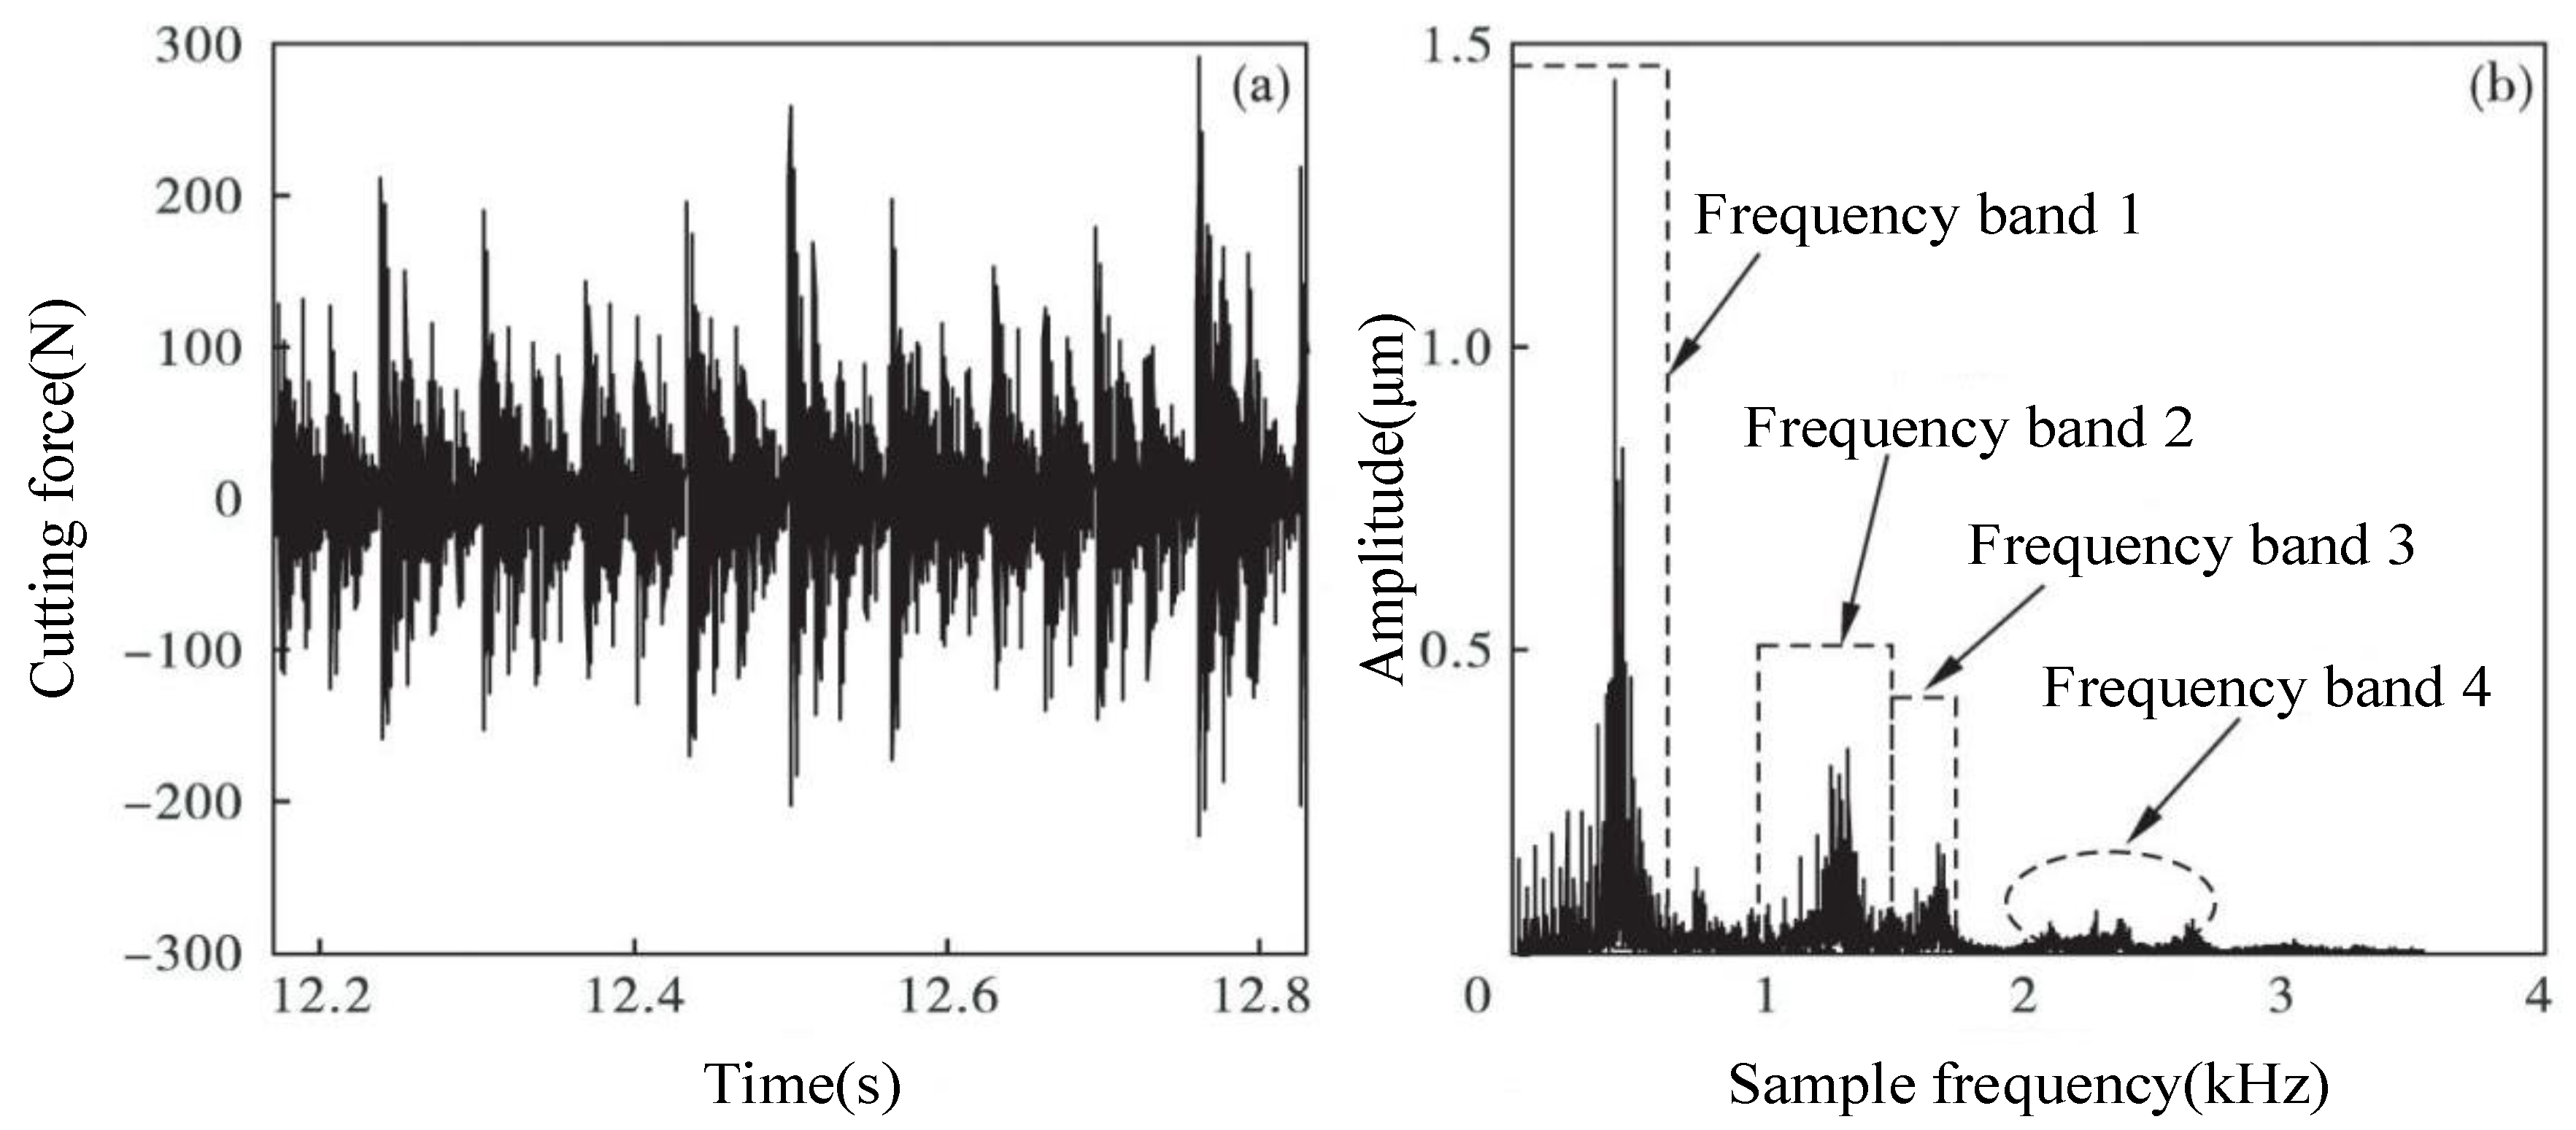
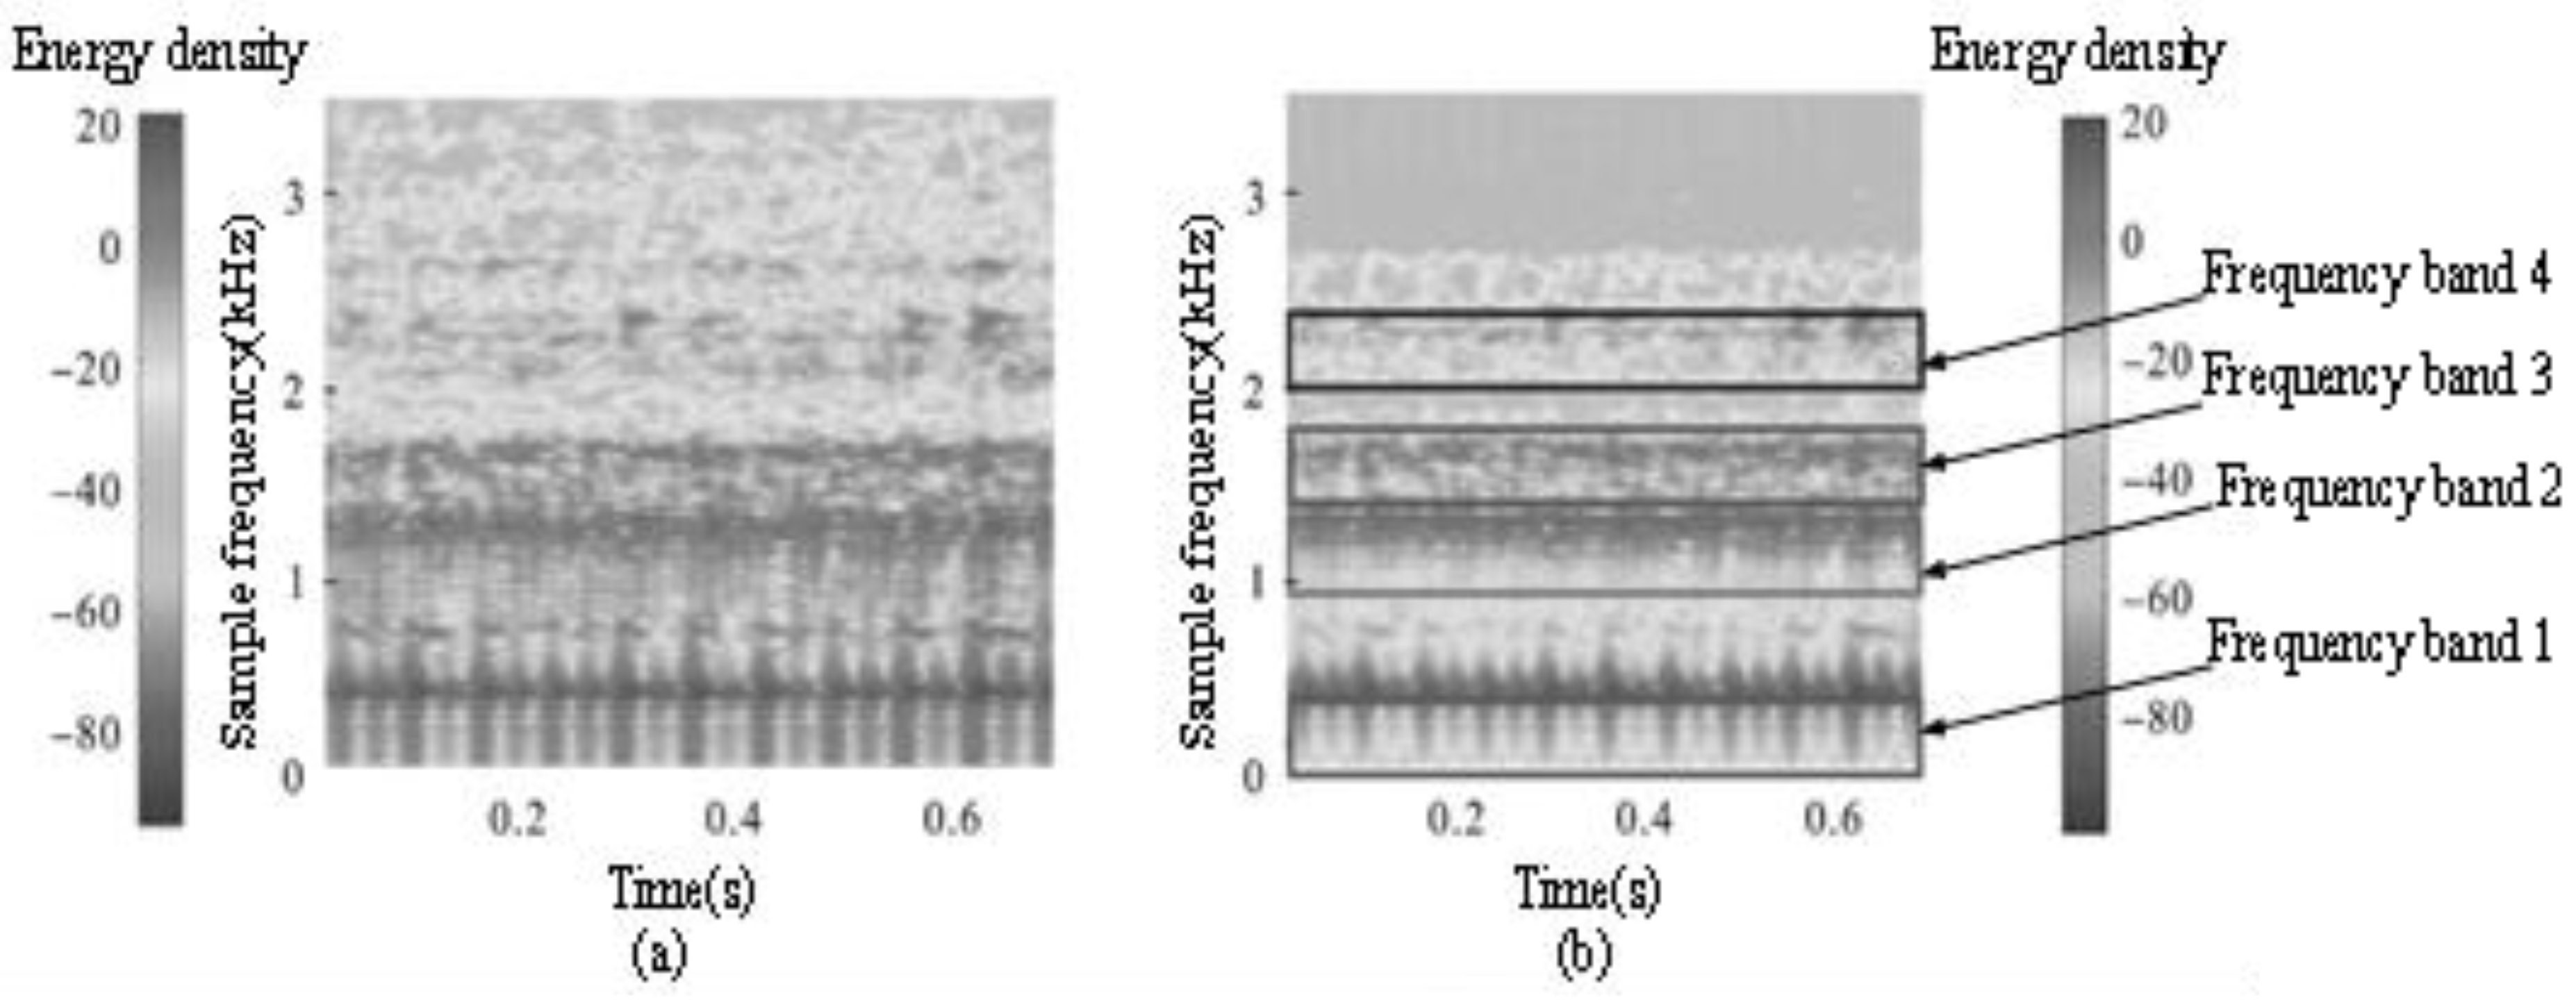
4. Experimental Signal Analysis

4.1. Construction of the Experimental Platform

The five-axis CNC machine tool DMU50 was used to realize the variable depth of cut milling, as shown in Figure 3. The geometric dimensions of tools and workpieces are shown in Table 1.
The processing parameters are as follows: radial depth of cut a e is 1 mm, axial depth of cut starts at 0 mm, feed speed is 360 mm/min and the rotational speed is 2000 r/min. Although the force signal is expensive and the installation position is accurate, some scholars point out that the cutting force is the main factor that causes the tool and workpiece vibration, and the force signal is more sensitive to the chatter characteristics. When chatter occurs, the cutting force will increase significantly, so a force sensor was selected in this paper. The dynamometer Kistler 9257B was used to obtain x, y and z three-direction force signals. In this processing operation, the dynamometer was fixed on the workbench with a pressure plate, and the workpiece was clamped in a vice, setting the dynamometer sampling frequency to f s = 7000 Hz .

4.2. Experimental Results and Discussion

The measured milling force and its frequency spectrum are shown in Figure 4. Machine main frequency SF = n/60, machine tool pass frequency TEP = nNL/60, where L represents the number of channels acquired (for example, the cutting force in the three directions of xyz is obtained and L is equal to 3).
According to the chatter theory, the chatter frequency is close to the natural frequency. Therefore, the chatter frequency is a non-integer multiple of the main frequency. As can be seen from Figure 4, four frequency bands can be found in the spectrogram. Among them, the frequency bands 1, 2 and 3 belong to the resonance frequency band of the main frequency, which shows that the cutting frequency of the cutter tooth plays a dominant role in the force spectrum. The frequency bands 1, 2 and 3 do not contain chatter frequencies, while the frequency band 4 is not equal to a multiple of the dominant frequency; this shows that the modal frequency of the system structure plays a dominant role in the force spectrum, and frequency band 4 contains the chatter frequency.
The measured force signal was processed by VMD due to the whole frequency band in Figure 4 being divided into four frequency bands. Thus, the number of modes K was set to 4, and the penalty factor α was 2000; each IMF was analyzed by FFT, as shown in Figure 5.
It can be seen from Figure 5 that u 1 , u 2 , u 3 correspond to frequency bands 1, 2 and 3, and u 4 corresponds to the chatter frequency band 4. To verify the decomposition effect of VMD, the time–frequency analysis of the signal processed by VMD was carried out, as shown in Figure 6.
The raw signal and the signal processed by VMD were subjected to the Hilbert transform (HHT), and their time–frequency characteristics were observed, as shown in Figure 6. The spectrum energy of the original signal was evenly distributed in the whole time–frequency domain, the boundaries of frequency bands 1, 2, 3 and 4 in the time–frequency diagram were fuzzy, the energy distribution was not concentrated and it was difficult to distinguish the frequency bands, which is not conducive to the extraction of subsequent flutter eigenvalues. In the time–frequency diagram processed by VMD, the spectrum energy contained in the four frequency bands is concentrated, and each band has clear boundaries and narrow bandwidth. Therefore, the flutter frequency band can be effectively extracted.
This paper proposes that the number of decomposition layers of VMD is determined based on the number of peaks in the spectrum, which is verified by simulation signals and experimental signals. The milling environment of thin-walled parts is complex. Problems such as the accuracy of the signals collected by sensors will lead to the collection of signals containing useless signals and singular points, which will change the distribution of the peak spectrum, which will undoubtedly affect the subsequent VMD decomposition accuracy and chatter feature extraction. Therefore, effective signal preprocessing algorithms must be developed in the field of fault diagnosis.
The traditional chatter feature extraction scheme relies on manual experience to set the state threshold, which requires operators to have rich professional knowledge and alert judgment. In this paper, the scheme of selecting the number of spectrum peaks requires the intervention of operators. First, the value to reach the peak is set, and then the number of peaks is selected. At the same time, the impact of the penalty factor on VMD decomposition is not considered, and the inaccurate setting of the penalty factor also leads to modal aliasing and other problems. Therefore, an efficient, high-precision global optimization algorithm for comprehensive parameters must be developed. With the introduction of concepts such as big data and the Internet of Things, it will be of great significance to mine the deep information of data [27].

5. Conclusions and Future

This paper proposes a scheme to determine the number of VMD decomposition layers based on the number of spectrum peaks and then effectively extract the chatter frequency band, which is verified by simulation signals and experimental signals. The specific conclusions are as follows:
(1)
The combination of VMD and FFT can effectively extract the flutter frequency band, which is simple and effective.
(2)
The peak number of the spectrum is used to determine the decomposition level of VMD, and the spectrum distribution of each order of IMFs is clear.
(3)
It can be seen from the Talbot transformation and spectrum analysis that the boundary of each frequency band of the signal after VMD decomposition is clear, and the bandwidth is narrowed. The energy of the mechanical system is mainly concentrated near the chatter frequency band, which will lay a foundation for processing state identification.
Based on the conclusions of this study and the shortcomings of this paper, future work will focus on the following:
(1)
Aiming at the useless information and singular points in the original signal, an effective signal preprocessing method will be developed so that it does not affect the subsequent signal processing.
(2)
To optimize the experimental scheme, the installation position of the sensor will be adapted so better schemes can be considered.
(3)
With the introduction of concepts such as big data and the Internet of Things, it will be of great significance to mine the deep information of data.

Author Contributions

Conceptualization, N.Z. and C.L.; methodology, Y.S.; software, N.Z.; validation, S.W. and Y.S.; formal analysis, N.Z. investigation, S.W.; resources, M.X.; data curation, C.L.; writing—original draft preparation, N.Z.; writing—review and editing, M.X.; visualization, Y.S.; supervision, N.Z.; project administration, N.Z.; funding acquisition, C.L. All authors have read and agreed to the published version of the manuscript.

Funding

This research was funded by Startup Research Fund of Liaoning Petrochemical University and grant number [2021XJJL-005].

Institutional Review Board Statement

Not applicable.

Informed Consent Statement

Not applicable.

Data Availability Statement

Not applicable.

Conflicts of Interest

The authors declare no conflict of interest.

References

  1. Liu, B.; Liu, C.; Zhou, Y.; Wang, D.; Dun, Y. An unsupervised chatter detection method based on AE and merging GMM and K-means. Mech. Syst. Signal Process. 2023, 186, 109861. [Google Scholar] [CrossRef]
  2. Dai, Y.; Li, H.; Xing, X.; Hao, B. Prediction of chatter stability for milling process using precise integration method. Precis. Eng. 2018, 52, 152–157. [Google Scholar] [CrossRef]
  3. Wu, Y.; You, Y.; Liu, A.; Deng, B.; Liu, W. An implicit exponentially fitted method for chatter stability prediction of milling processes. Int. J. Adv. Manuf. Technol. 2019, 106, 2189–2204. [Google Scholar] [CrossRef]
  4. Qin, C.; Tao, J.; Liu, C. A predictor-corrector-based holistic-discretization method for accurate and efficient milling stability analysis. Int. J. Adv. Manuf. Technol. 2018, 96, 2043–2054. [Google Scholar] [CrossRef]
  5. Qiao, Z.; Elhattab, A.; Shu, X.; He, C. A second-order stochastic resonance method enhanced by fractional-order derivative for mechanical fault detection. Nonlinear Dyn. 2021, 106, 707–723. [Google Scholar] [CrossRef]
  6. Qiao, Z.; Shu, X. Coupled neurons with multi-objective optimization benefit incipient fault identification of machinery. Chaos Solitons Fractals 2021, 145, 110813. [Google Scholar] [CrossRef]
  7. Ye, J.; Feng, P.; Xu, C.; Ma, Y.; Huang, S. A novel approach for chatter online monitoring using coefficient of variation in machining process. Int. J. Adv. Manuf. Technol. 2018, 96, 287–297. [Google Scholar] [CrossRef]
  8. Frumusanu, G.R.; Constantin, I.C.; Marinescu, V.; Epureanu, A. Development of a stability intelligent control system for turning. Int. J. Adv. Manuf. Technol. 2013, 64, 643–657. [Google Scholar] [CrossRef]
  9. Tangjitsitcharoen, S. In-process monitoring and detection of chip formation and chatter for CNC turning. J. Mater. Process. Technol. 2009, 209, 4682–4688. [Google Scholar] [CrossRef]
  10. Liu, C.; Gao, X.; Chi, D.; He, Y.; Liang, M.; Wang, H. On-line chatter detection in milling using fast kurtogram and frequency band power. Eur. J. Mech. A/Solids 2021, 90, 104341. [Google Scholar] [CrossRef]
  11. Cao, H.; Zhou, K.; Chen, X. Chatter identification in end milling process based on EEMD and nonlinear dimensionless indicators. Int. J. Mach. Tools Manuf. 2015, 92, 52–59. [Google Scholar] [CrossRef]
  12. Zhang, C.; Li, B.; Chen, B.; Cao, H.; Zi, Y.; He, Z. Weak fault signature extraction of rotating machinery using flexible analytic wavelet transform. Mech. Syst. Signal Process. 2015, 64, 162–187. [Google Scholar] [CrossRef]
  13. Cao, H.; Lei, Y.; He, Z. Chatter identification in end milling process using wavelet packets and Hilbert–Huang transform. Int. J. Mach. Tools Manuf. 2013, 69, 11–19. [Google Scholar] [CrossRef]
  14. Zhang, Q.; Tu, X.; Li, F.; Hu, Y. An effective chatter detection method in milling process using morphological empirical wavelet transform. IEEE Trans. Instrum. Meas. 2019, 69, 5546–5555. [Google Scholar] [CrossRef]
  15. Hao, Y.; Zhu, L.; Yan, B.; Qin, S.; Cui, D.; Lu, H. Milling chatter detection with WPD and power entropy for Ti-6Al-4V thin-walled parts based on multi-source signals fusion. Mech. Syst. Signal Process. 2022, 177, 109225. [Google Scholar] [CrossRef]
  16. Ji, Y.; Wang, X.; Liu, Z.; Yan, Z.; Jiao, L.; Wang, D.; Wang, J. EEMD-based online milling chatter detection by fractal dimension and power spectral entropy. Int. J. Adv. Manuf. Technol. 2017, 92, 1185–1200. [Google Scholar] [CrossRef]
  17. Zhu, L.; Liu, C.; Ju, C.; Guo, M. Vibration recognition for peripheral milling thin-walled workpieces using sample entropy and energy entropy. Int. J. Adv. Manuf. Technol. 2020, 108, 3251–3266. [Google Scholar] [CrossRef]
  18. Dragomiretskiy, K.; Zosso, D. Variational Mode Decomposition. IEEE Trans. Signal Process. 2014, 62, 531–544. [Google Scholar] [CrossRef]
  19. Wang, Y.; Markert, R.; Xiang, J.; Zheng, W. Research on variational mode decomposition and its application in detecting rub-impact fault of the rotor system. Mech. Syst. Signal Process. 2015, 60, 243–251. [Google Scholar] [CrossRef]
  20. Li, C.; Liu, Y.; Liao, Y. An improved parameter-adaptive variational mode decomposition method and its application in fault diagnosis of rolling bearings. Shock Vib. 2021, 2021, 2968488. [Google Scholar] [CrossRef]
  21. Zhang, M.; Jiang, Z.; Feng, K. Research on variational mode decomposition in rolling bearings fault diagnosis of the multistage centrifugal pump. Mech. Syst. Signal Process. 2017, 93, 460–493. [Google Scholar] [CrossRef] [Green Version]
  22. Wu, S.; Feng, F.; Zhu, J.; Wu, C.; Zhang, G. A method for determining intrinsic mode function number in variational mode decomposition and its application to bearing vibration signal processing. Shock Vib. 2020, 2020, 8304903. [Google Scholar] [CrossRef]
  23. Li, X.; Wan, S.; Huang, X.; Hong, J. Milling chatter detection based on VMD and difference of power spectral entropy. Int. J. Adv. Manuf. Technol. 2020, 111, 2051–2063. [Google Scholar] [CrossRef]
  24. Yang, K.; Wang, G.; Dong, Y.; Zhang, Q.; Sang, L. Early chatter identification based on an optimized variational mode decomposition. Mech. Syst. Signal Process. 2019, 115, 238–254. [Google Scholar] [CrossRef]
  25. Liu, C.; Zhu, L.; Ni, C. Chatter detection in milling process based on VMD and energy entropy. Mech. Syst. Signal Process. 2018, 105, 169–182. [Google Scholar] [CrossRef]
  26. Aneesh, C.; Kumar, S.; Hisham, P.; Soman, K. Performance comparison of variational mode decomposition over empirical wavelet transform for the classification of power quality disturbances using support vector machine. Procedia Comput. Sci. 2015, 46, 372–380. [Google Scholar] [CrossRef] [Green Version]
  27. Ding, Y.; Jia, M.; Miao, Q.; Cao, Y. A novel time–frequency Transformer based on self–attention mechanism and its application in fault diagnosis of rolling bearings. Mech. Syst. Signal Process. 2022, 168, 108616. [Google Scholar] [CrossRef]
Figure 1. Modes comparison between pre−VMD and post−VMD signals.
Electronics 11 03779 g001
Figure 2. Frequency spectrum. (a) Spectrogram of the raw signal x(t). (b) Spectrogram of the reconstructed signal μ after VMD.
Electronics 11 03779 g002
Figure 3. The experimental platform of variable cutting depth milling.
Electronics 11 03779 g003
Figure 4. Experimental signal and the frequency spectrum. (a) Cutting force. (b) Spectrogram.
Electronics 11 03779 g004
Figure 5. Result of VMD processing. (a) IMFs. (b) Spectrogram.
Electronics 11 03779 g005
Figure 6. Time–frequency diagram of the raw signal and signal after VMD. (a) Original signal. (b) After VMD processing.
Electronics 11 03779 g006
Table 1. Tool parameters and material properties of Al6061.
Tool Workpiece
MaterialTungsten SteelMaterialAl6061
Tool diameter D (mm)10Tensile strength (MPa)552
Number of flutes N4Yield strength (MPa)485
Helix angle β (°) 45Modulus of elasticity (MPa)67.5
Overhang (mm)65Hardness (HB)150
Publisher’s Note: MDPI stays neutral with regard to jurisdictional claims in published maps and institutional affiliations.

