Article

Remote Heart Rate Estimation by Pulse Signal Reconstruction Based on Structural Sparse Representation

School of Big Data and Computer Science, Guizhou Normal University, Guiyang 550025, China
*
Author to whom correspondence should be addressed.
Electronics 2022, 11(22), 3738; https://doi.org/10.3390/electronics11223738
Submission received: 26 October 2022 / Revised: 9 November 2022 / Accepted: 9 November 2022 / Published: 15 November 2022

Abstract

:
In recent years, the physiological measurement based on remote photoplethysmography has attracted wide attention, especially since the epidemic of COVID-19. Many researchers paid great efforts to improve the robustness of illumination and motion variation. Most of the existing methods divided the ROIs into many sub-regions and extracted the heart rate separately, while ignoring the fact that the heart rates from different sub-regions are consistent. To address this problem, in this work, we propose a structural sparse representation method to reconstruct the pulse signals (SSR2RPS) from different sub-regions and estimate the heart rate. The structural sparse representation (SSR) method considers that the chrominance signals from different sub-regions should have a similar sparse representation on the combined dictionary. Specifically, we firstly eliminate the signal deviation trend using the adaptive iteratively re-weighted penalized least squares (Airpls) for each sub-region. Then, we conduct the sparse representation on the combined dictionary, which is constructed considering the pulsatility and periodicity of the heart rate. Finally, we obtain the reconstructed pulse signals from different sub-regions and estimate the heart rate with a power spectrum analysis. The experimental results on the public UBFC and COHFACE datasets demonstrate the significant improvement for the accuracy of the heart rate estimation under realistic conditions.

1. Introduction

Traditionally, the heart rate is usually measured with electrocardiography (ECG) [1] or photoplethysmography (PPG) [2]. Although the ECG and PPG measurements can effectively measure the heart rate, they are an invasive and contact-based measurement [3], in which dedicated skin-contact devices are used, and they cause discomfort and inconvenience for subjects. Recently, with the COVID-19 pandemic, a remote physiological measurement based on remote photoplethysmography (rPPG) has gained tremendous interest, which has many advantages compared to the traditional approaches [4,5]. rPPG is able to work only with an accessible camera, such as a smartphone camera, and is also able to achieve non-contact monitoring. In addition, the rPPG technique can conduct a real-time physiological estimation [6], monitor the health of post-operative patients in the ward [7], and monitor the health of drivers on the road.
The principle of the rPPG measurement is the fact that the optical absorption of a local tissue varies periodically with the blood volume due to the human heartbeat and leads to the subtle color variation, which can be recorded with a camera. The heart rate can be estimated by mining the subtle color variation from the videos. The common framework of the heart rate estimation based on the rPPG technology mainly includes three steps: divide the selection of the regions of interest (ROIs) to obtain the RGB channel signal, normalize the color channels, and calculate the heart rate. The challenge for this task is that the subtle optical absorption variation (not visible to the human eyes) can be easily affected by noises, such as head movements, lighting variations, and device noises.
To address those problems, the researchers have proposed lots of methods, which can be categorized into two kinds. The first one is the traditional methods, which considered the optical absorption and skin reflection model, such as the plane-orthogonal-to-skin (POS) method [8] and chrominance signal extraction method (CHROM) [9]. However, these methods do not always hold in handling complicated scenes, such as a large head movement or a dim lighting condition. In addition, samples of existing datasets are usually too complex to be modeled with multiple simple mathematical models. In recent years, due to the success breakthroughs of deep learning in various computer vision tasks, many deep neural networks for remote physiological signals prediction have been proposed through learning a network mapping from different manual representations of face videos [10,11]. The main efforts have been made to adequately model the spatial and temporal information (dynamics) presented in the facial videos. The key challenge of an rPPG-based physiological measurement is how to effectively extract the physiological information and suppress the adverse effects of the non-physiological information.
The existing approaches can be roughly classified into two categories, the end-to-end approaches [10,12,13] and two-step approaches [14,15], according to the network architecture. The end-to-end network should read the motion information from the input video frames, discriminate the different motion sources, and synthesize the heart rate signal. In the two-step approaches, the input video is first pre-processed and then the heart rate signal is extracted using deep learning methods. However, a lack of sufficient data and the regularity of these strong noises are also the main obstacles. Most of these studies focus on how to remove a motion, such as a head rotation and facial expressions, because any kind of motion on the ROIs will disturb the raw rPPG signal. Compared to the deep learning-based methods, the traditional methods directly estimate the heart rate without labels and are more explainable. Considering the difficulty of data acquisition in a real application, we study this problem under the unsupervised setting.
In the study, we find the fact that the chrominance signals from different sub-regions have a similar variation, as shown in Figure 1. We extract the raw chrominance signals from 14 different sub-regions over 280 frames, which are highly similar, although some differences are caused by the movement or illumination variations.
Motivated by this observation, in this work, we propose a new method named SSR2RPS via the SSR based on the fact that the heart rates from different sub-regions are consistent, as shown in Figure 2. Specifically, we divide the continuous face video sequence into multiple ROIs by using a face detection model, followed by the calculation of the chrominance feature of each sub-region. Then, we utilize the Airpls algorithm to eliminate the trend variations. Furthermore, we conduct the sparse representation on the hand-crafted dictionary, which is constructed considering the pulsatility and periodicity of the heart rate. Next, we obtained the reconstructed heart rate signals by averaging the reconstructed signals from different sub-regions. Finally, the heart rates are obtained by a frequency analysis.
Concretely, our contributions can be summarized as follows:
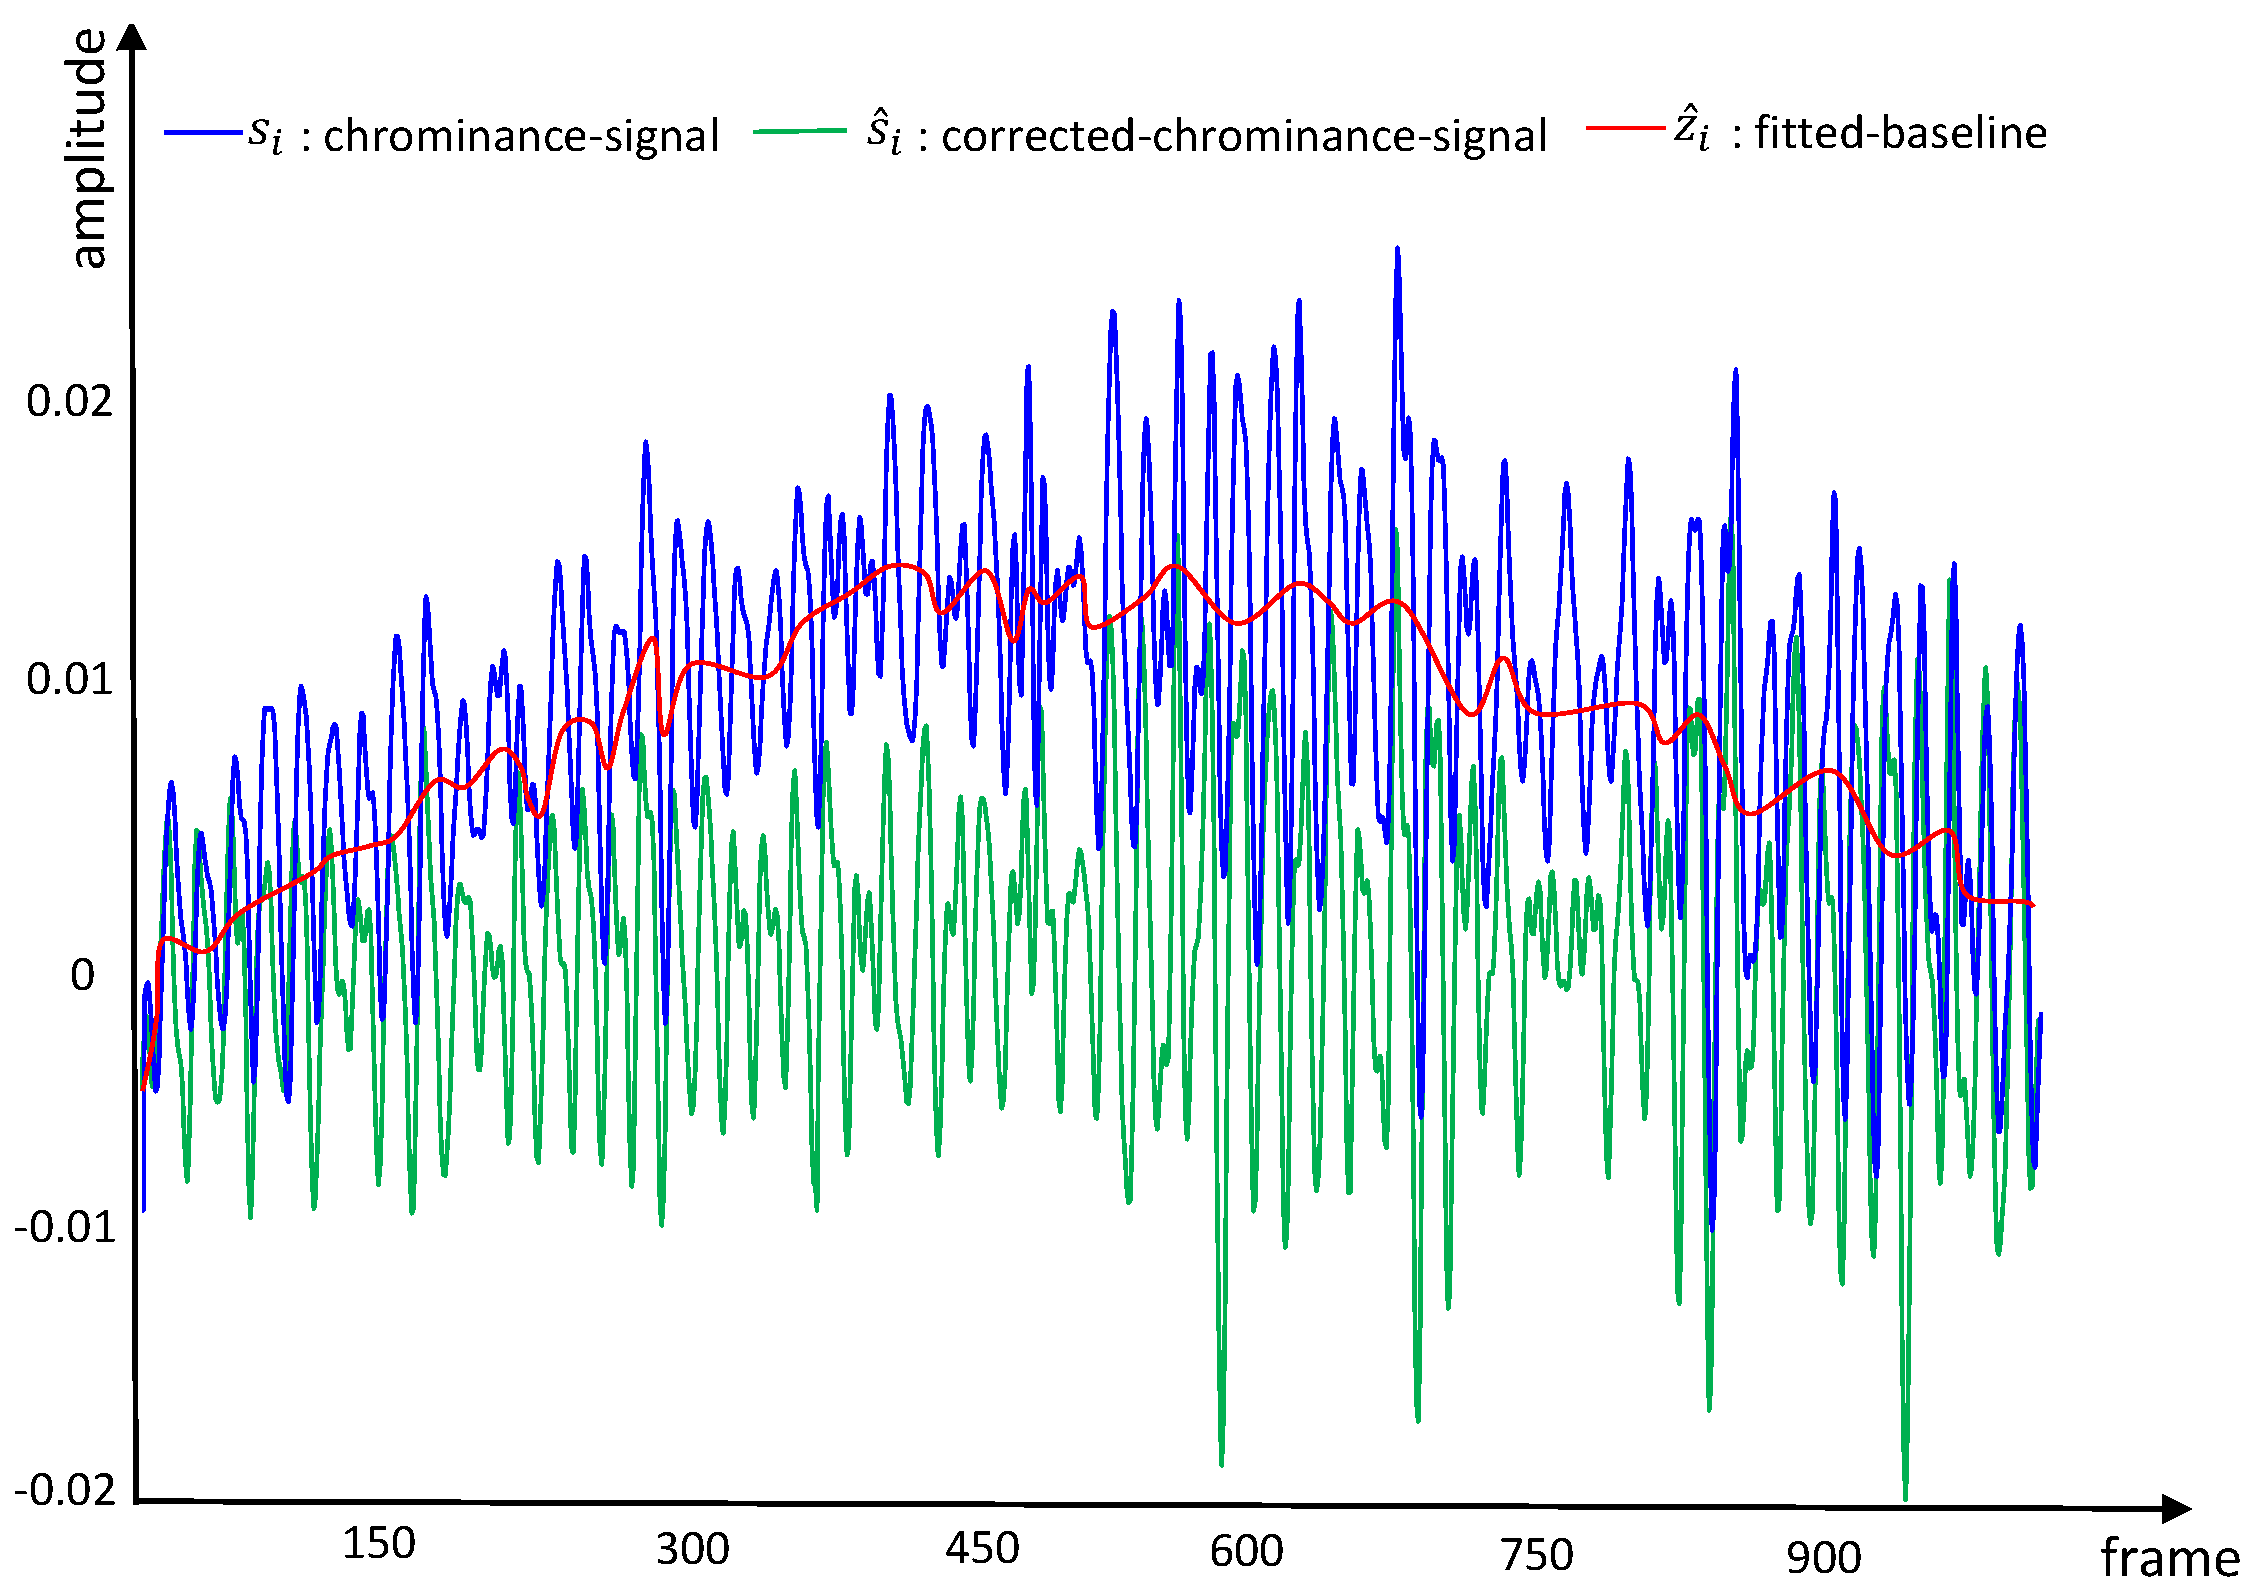
  • Based on the observation, we adopt the Airpls algorithm to eliminate the trend variation. The experimental results show the superiority of de-trending for the heart rate estimation.
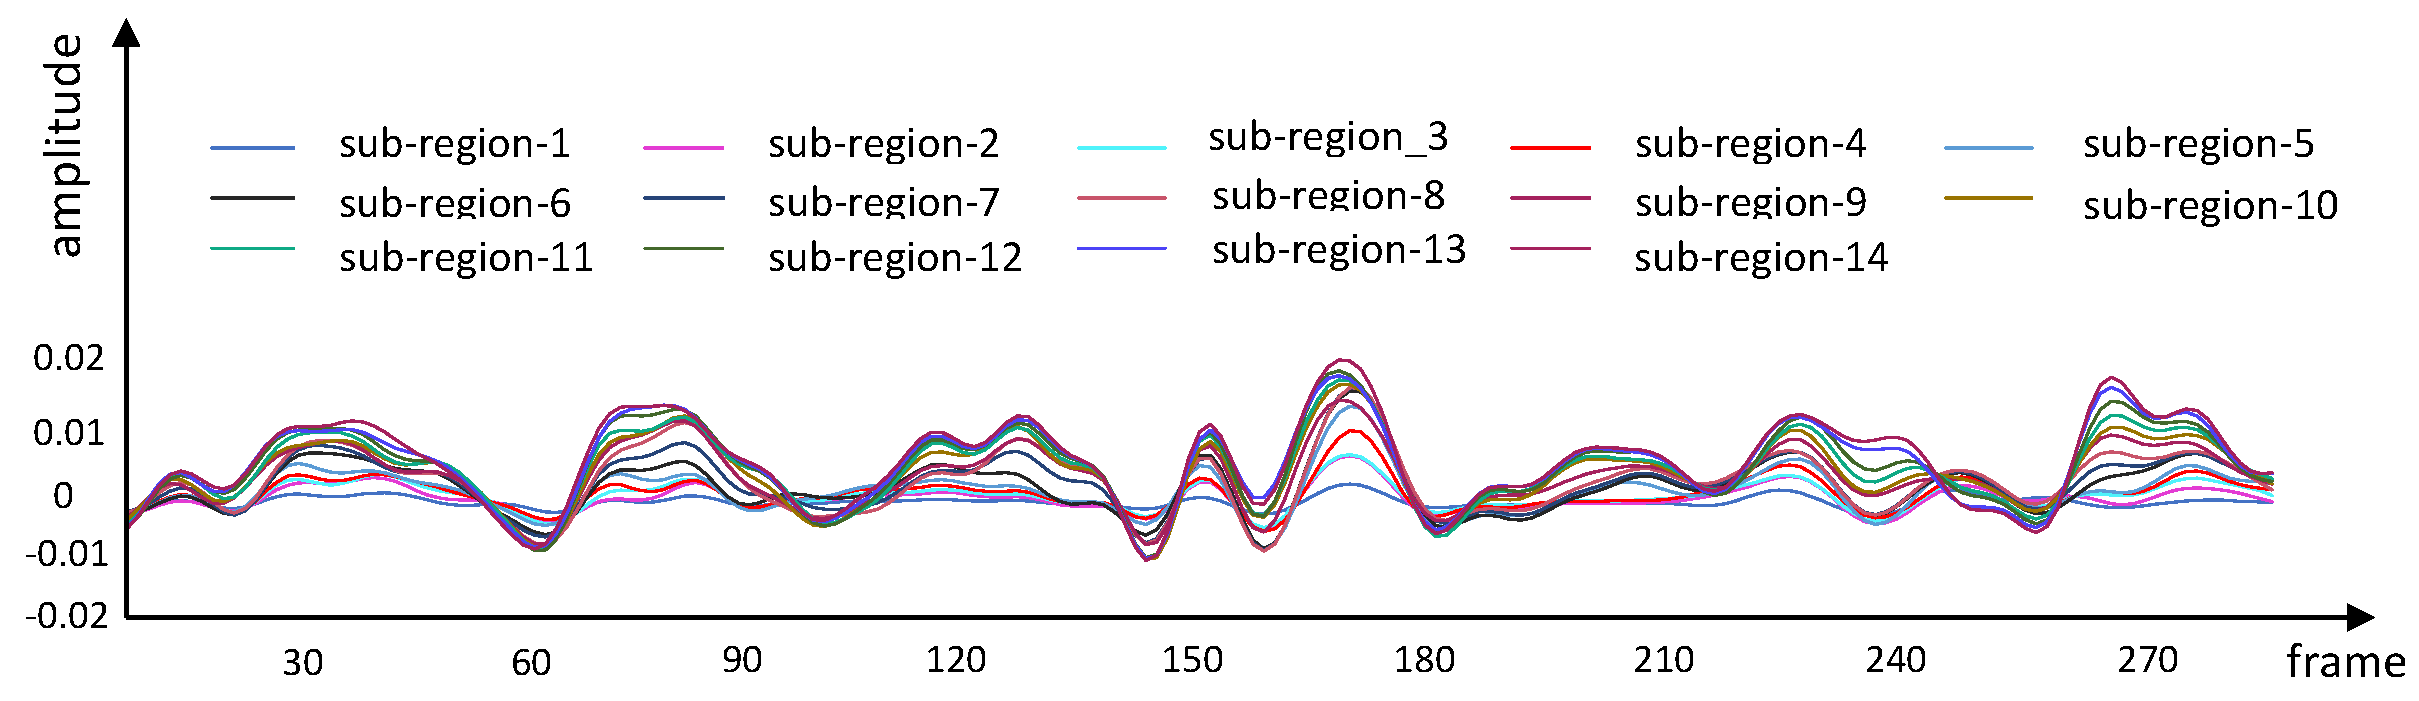
  • We find the fact that the heart rates from different sub-regions are consistent and propose the SSR by constraining the consistency of the sparse representation for different sub-regions.
  • The experimental results on the two benchmark datasets show that SSR2RPS significantly outperforms the state-of-the-art methods.
The remainder of this paper is structured as follows. The related work of rPPG is briefly reviewed in Section 2. The proposed method is described in detail in Section 3. Then, the experimental details and results are shown in Section 4. Finally, in Section 5, we draw our conclusions.

2. Related Works

2.1. Video-Based rPPG Measurement

The rPPG techniques aim to recover the blood volume change in the skin that are synchronous with the heart rate from the subtle color variations captured by a camera. Since Verkruysse et al. [16] evaluated the possibility of measuring the heart rate remotely from facial videos, many researchers have proposed different methods to recover the physiological data. Some works relied on the skin optical reflection model by projecting all RGB skin pixels channels into a more refined subspace, mitigating motion artifacts [9,17]. These approaches treat the raw traces as a pure signal but do not consider the physiological and optical principles of the imaging process. To address this issue, the skin reflection model is established, which quantitatively models the incident light, specular and diffusion reflection of the skin, and camera quantization noise. Based on this model, several pulse extraction algorithms are proposed [9,18,19]. The role of a differentiable local group of local transformations was introduced by Pilz et al. [20]; they emphasized the point of view on the unsupervised learning of invariant features. To extend the utilization of rPPG sensors, Lee et al. [6] proposed an algorithm that estimates the heart rate, which can be performed in real time using vision and robot manipulation algorithms.
In recent years, deep learning methods based on a CNN [10,21,22] were developed to overcome such limitations, and they have shown they effectively capture a minor color variation if sufficient training data are available. Disentangled representations were used to separate non-physiological signals from the pulse signals [12]. To recover more detailed rPPG signals for the challenge on remote physiological signal sensing (RePSS), Hu et al. [23] proposed an end-to-end efficient framework, which measured the average heart rate and estimated the corresponding blood volume–pulse curves simultaneously. Kang et al. [11] proposed a two-stream Transformer model; one stream followed the pulse signal in the facial area while the other figured out the perturbation signal from the surrounding region such that the difference in the two channels leads to an adaptive noise cancellation. Then, Gao et al. [24] proposed a new remote heart estimation algorithm using a signal-quality attention mechanism and long short-term memory networks. From the relevant research, heart rate estimation models based on deep learning methods achieve high accuracy rates [25]. However, deep learning methods have lots of disadvantages, such as high complexity, poor results across datasets [26], and difficulty in interpretation. In addition, deep learning methods usually require large amounts of data for training, and there are not enough public datasets in this field. For SSR2RPS, we do not require too much data to train the model parameters.

2.2. Sparse Representation
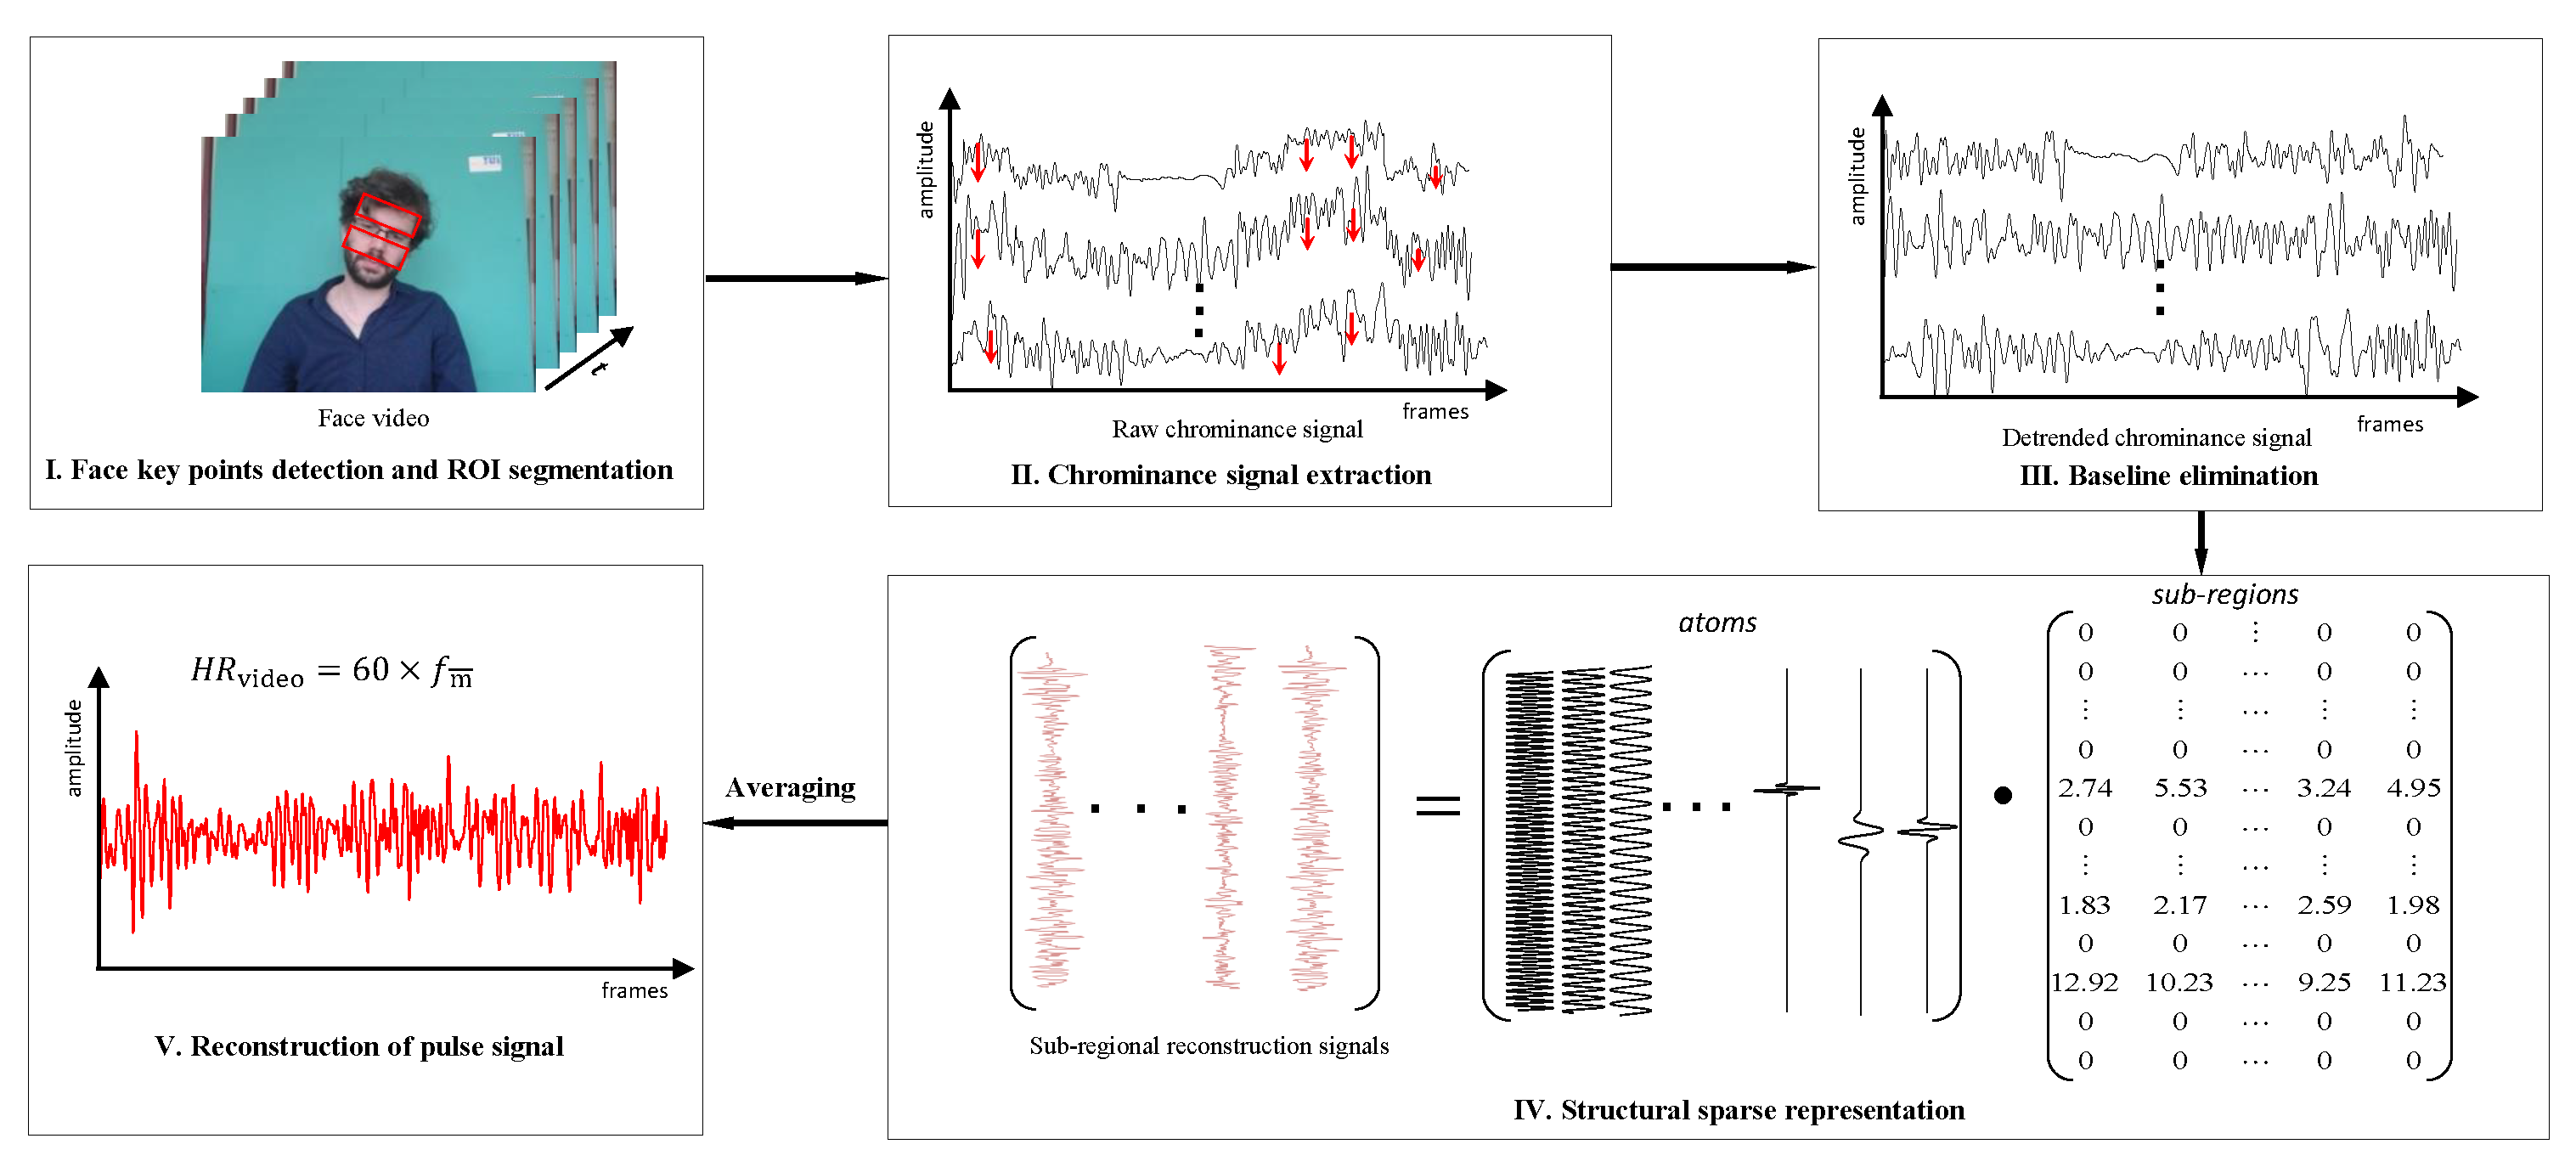
Given the signal y R n × 1 and over-complete dictionary D R n × m with m n , the sparse representation can be formulated following optimization based on the assumption that the signal y can be sparsely represented by only a few atoms from dictionary D :
x ^ = arg min x y D x 2 2 + λ x 0
Many algorithms have been proposed to solve Equation (1). In 1993, Mallat et al. [27] proposed a greedy algorithm, i.e., matching pursuit, which iteratively computes the best match according to the signal’s structures. Subsequently, Pati et al. [28] proposed the orthogonal matching pursuit (OMP) algorithm based on the MP algorithm, which has a faster convergence rate compared to the MP algorithm. In later studies, the researchers have also proposed various other matching algorithms in order to improve the OMP algorithm [29].
As an efficient signal representation framework, the sparse representation is also utilized to solve the heart rate estimation based on PPG or rPPG. For example, Zhang et al. [30] proposed to jointly estimate the spectra of PPG signals and simultaneous acceleration signals using a multi-measurement vector model in sparse signal recovery. Due to the sparsity constraint of the spectral coefficients, the spectral peaks of the motion artifacts in the PPG spectrum can be identified and removed. Based on the sparsity in the Fourier domain, Magdalena et al. [5] modeled the rPPG matrix signal as the superposition of a low-rank matrix containing a heart rate signal and noise matrix. However, it mainly focused on the sparsity in the Fourier domain with a Fourier transform, which might effectively represent the heart rate signals. Liu et al. [31] proposed to construct an original pulse using the chrominance signals of multiple facial sub-regions and employed the disturbance-adaptive orthogonal matching pursuit (DAOMP) algorithm to recover the underlying pulse matrix corrupted by facial instability. However, they considered the sub-regions separately and only with a cosine basis, which was not enough to represent the heart rate signal. Different from the above works, we propose the SSR in the time domain based on the consistency with the combined dictionary.

3. Framework

The proposed framework is presented in Figure 2, which includes five steps. The first step is to detect the key points of the face and divide the ROIs into sub-regions, followed by the extraction of the raw chrominance signal. Then, we eliminate the baseline and evaluate the signal quality. Furthermore, we conduct sparse decomposition and reconstruct the pulse signals. Finally, we calculate the average heart rate signal and use the power spectrum analysis (PSA) to calculate the heart rate.

3.1. Face Key Points Detection and ROI Segmentation

The rPPG algorithm based on face videos requires to find the face region and select the ROIs. In the past, the Viola–Jones algorithm [32] was used to select the ROIs, which usually includes the boundary background, except the face area. It was demonstrated that the forehead and cheek area contain rich physiological signals [33]. For example [34], the forehead and cheek regions were chosen as ROIs using single or additional coordinates within the facial region. In this work, we use the insightface [35] face detection model to locate key points, and the forehead and cheek areas are selected as ROIs, which are divided into r ( p × p pixels) sub-regions.

3.2. Extraction of Chrominance Signal

The chrominance signal is extracted from each ROI to construct the raw pulse signals. Specifically, given the RGB signals [ R n , G n , B n ] for each sub-region, we first calculate the combination of different channel signals using the formulation defined in Equation (2), i.e., calculate the two signals X s and Y s , and then we perform band-passed filter for X s and Y s to obtain the band-passed filtered versions of signals X f and Y f , respectively.
X s = 3 R n 2 G n Y s = 1.5 R n + G n 1.5 B n
Finally, the chrominance signal S is calculated with S = X f α Y f , where α = σ ( X f ) σ ( Y f ) , σ denotes the standard deviation. Details about the approach of the chrominance signal extraction can be found in [9].

3.3. De-Trending Filter

The raw chrominance signal, as shown in Figure 3 with blue curve, is non-stationary, which is often interfered by illumination variation and motion variations. In order to eliminate the interferences, the Airpls method is adopted. Specifically, for the raw chrominance signals S = [ s 1 , s 2 , , s r ] R l × r , l denotes frames of the input video, and r denotes sub-regions. We suppose Z = [ z 1 , z 2 , , z r ] R l × r is the fitted baseline. The i-th column s i represents the chrominance signal of the i-th sub-region, and z i represents the fitted baseline of the chrominance signal of the corresponding sub-region. De-trending filter can be obtained by solving following optimization problem:
z ^ i = arg min z i ( s i z i ) T W ( s i z i ) + λ z i 2
where W = d i a g ( w 1 , w 2 , , w l ) , and λ is the smoothing parameter, △ is the smooth matrix as below:
= 1 1 0 0 0 1 1 0 0 0 0 1 R l × l
The first term ( s i z i ) T W ( s i z i ) denotes the fidelity between the raw chrominance signal s i and the fitted baseline z i ; the second term z i 2 denotes the smoothness of the fitted baseline z i .
By calculating partial derivative of Equation (3) for z i and setting it to 0, we obtain the closed solution z ^ i = ( W + λ T ) 1 W s i . More details, please refer to reference [36]. Then, the corrected chrominance signal is obtained by s ^ i = s i z ^ i , as shown in Figure 3 with green curve. Finally, we obtain the corrected chrominance signals S ^ = [ s ^ 1 , s ^ 2 , , s ^ r ] .
Considering the uneven illumination of the subject’s face and other factors, which will lead to some sub-regions inaccurately capturing the heart rate signals, in order to solve this problem, we choose sub-regions containing richer heart rate signals, which can calculate the signal-to-noise ratio ( S N R ) of the chrominance signal. We calculate the S N R in a similar way to [9], as shown in Equation (5), where P S C denotes the power spectrum curve of the chrominance signal in frequency domain. The numerator is defined as the power in the range 6 HZ either side of the first (p1) and second (p2) harmonics of the power spectrum of the pulse signal, as shown in Figure 4. The denominator is the power of the rest in the range 0 to 240 HZ.
S N R = p 1 P S C + p 2 P S C p P S C p 1 P S C p 2 P S C
We calculate the S N R of each chrominance signal and the average S N R of the overall chrominance signal separately. We select the chrominance signal of higher S N R than overall average S N R to construct high-quality chrominance signals S ^ h = [ S ^ h 1 , S ^ h 2 , , S ^ h r ] , with r < r .

3.4. Reconstruction of the Heart Rate Signals

Considering the chrominance signals from different sub-regions have similar sparse representation on the hand-crafted dictionary, we propose a structural sparse representation method to reconstruct the pulse signals from different sub-regions. Usually, the high-quality chrominance signals S ^ h can be modeled as the combination of the pulse signals and the noise signals, i.e., S ^ h = S ^ h p u l s e + S ^ h n o i s e . SSR aims to reconstruct the pulse signals matrix ( P = D · X ^ ) as an approximation of the ideal pulse matrix S ^ h p u l s e .
It is well known that the rPPG signal is periodic and has pulsatility [37]. Therefore, we construct the dictionary with the combination of cosine dictionary and wavelet dictionary. Specifically, the cosine dictionary is expressed as D i c o s = cos 2 π * k i L / f r , where k i denotes the i-th frequency component, the interval between k i and k i + 1 is 1 60 HZ, L is the length of the generated signal sequence, and f r denotes the video frame rate. The wavelet dictionary is constructed to approximate the pulsatility of the heart rate signal, i.e., the wavelet dictionary is expressed as D j w a v e = w a v e l e t d i c t s h o r t 3 , N b , j , b , where s h o r t 3 denotes the wavelet family, N b denotes the number of generated points, j denotes the level vector, and b denotes the conversion factor. The composition of the combined dictionary is defined as D = D i c o s , D j w a v e .
We can find an SSR X ^ = [ x ^ 1 , x ^ 2 , , x ^ r ] in the combined dictionary. Due to the similar characteristics, the sparse representations of the reconstructed pulse signals of the same subject will share the same dictionary atoms. In this work, we provide the l 2 , 1 -norm regularization term to achieve this purpose. The objective function can be expressed as:
X ^ = arg min X S ^ h D · X 2 + μ X 2 , 1
The first term aims to reconstruct the pulse signals, and μ is the penalty parameter. The l 2 , 1 -norm of X is defined as X 2 , 1 = i = 1 n j = 1 m x i , j 2 = i = 1 n x i 2 . Considering the fast convergence of the method, we use the alternating direction method of multipliers (ADMM) algorithm [38] to solve this problem.

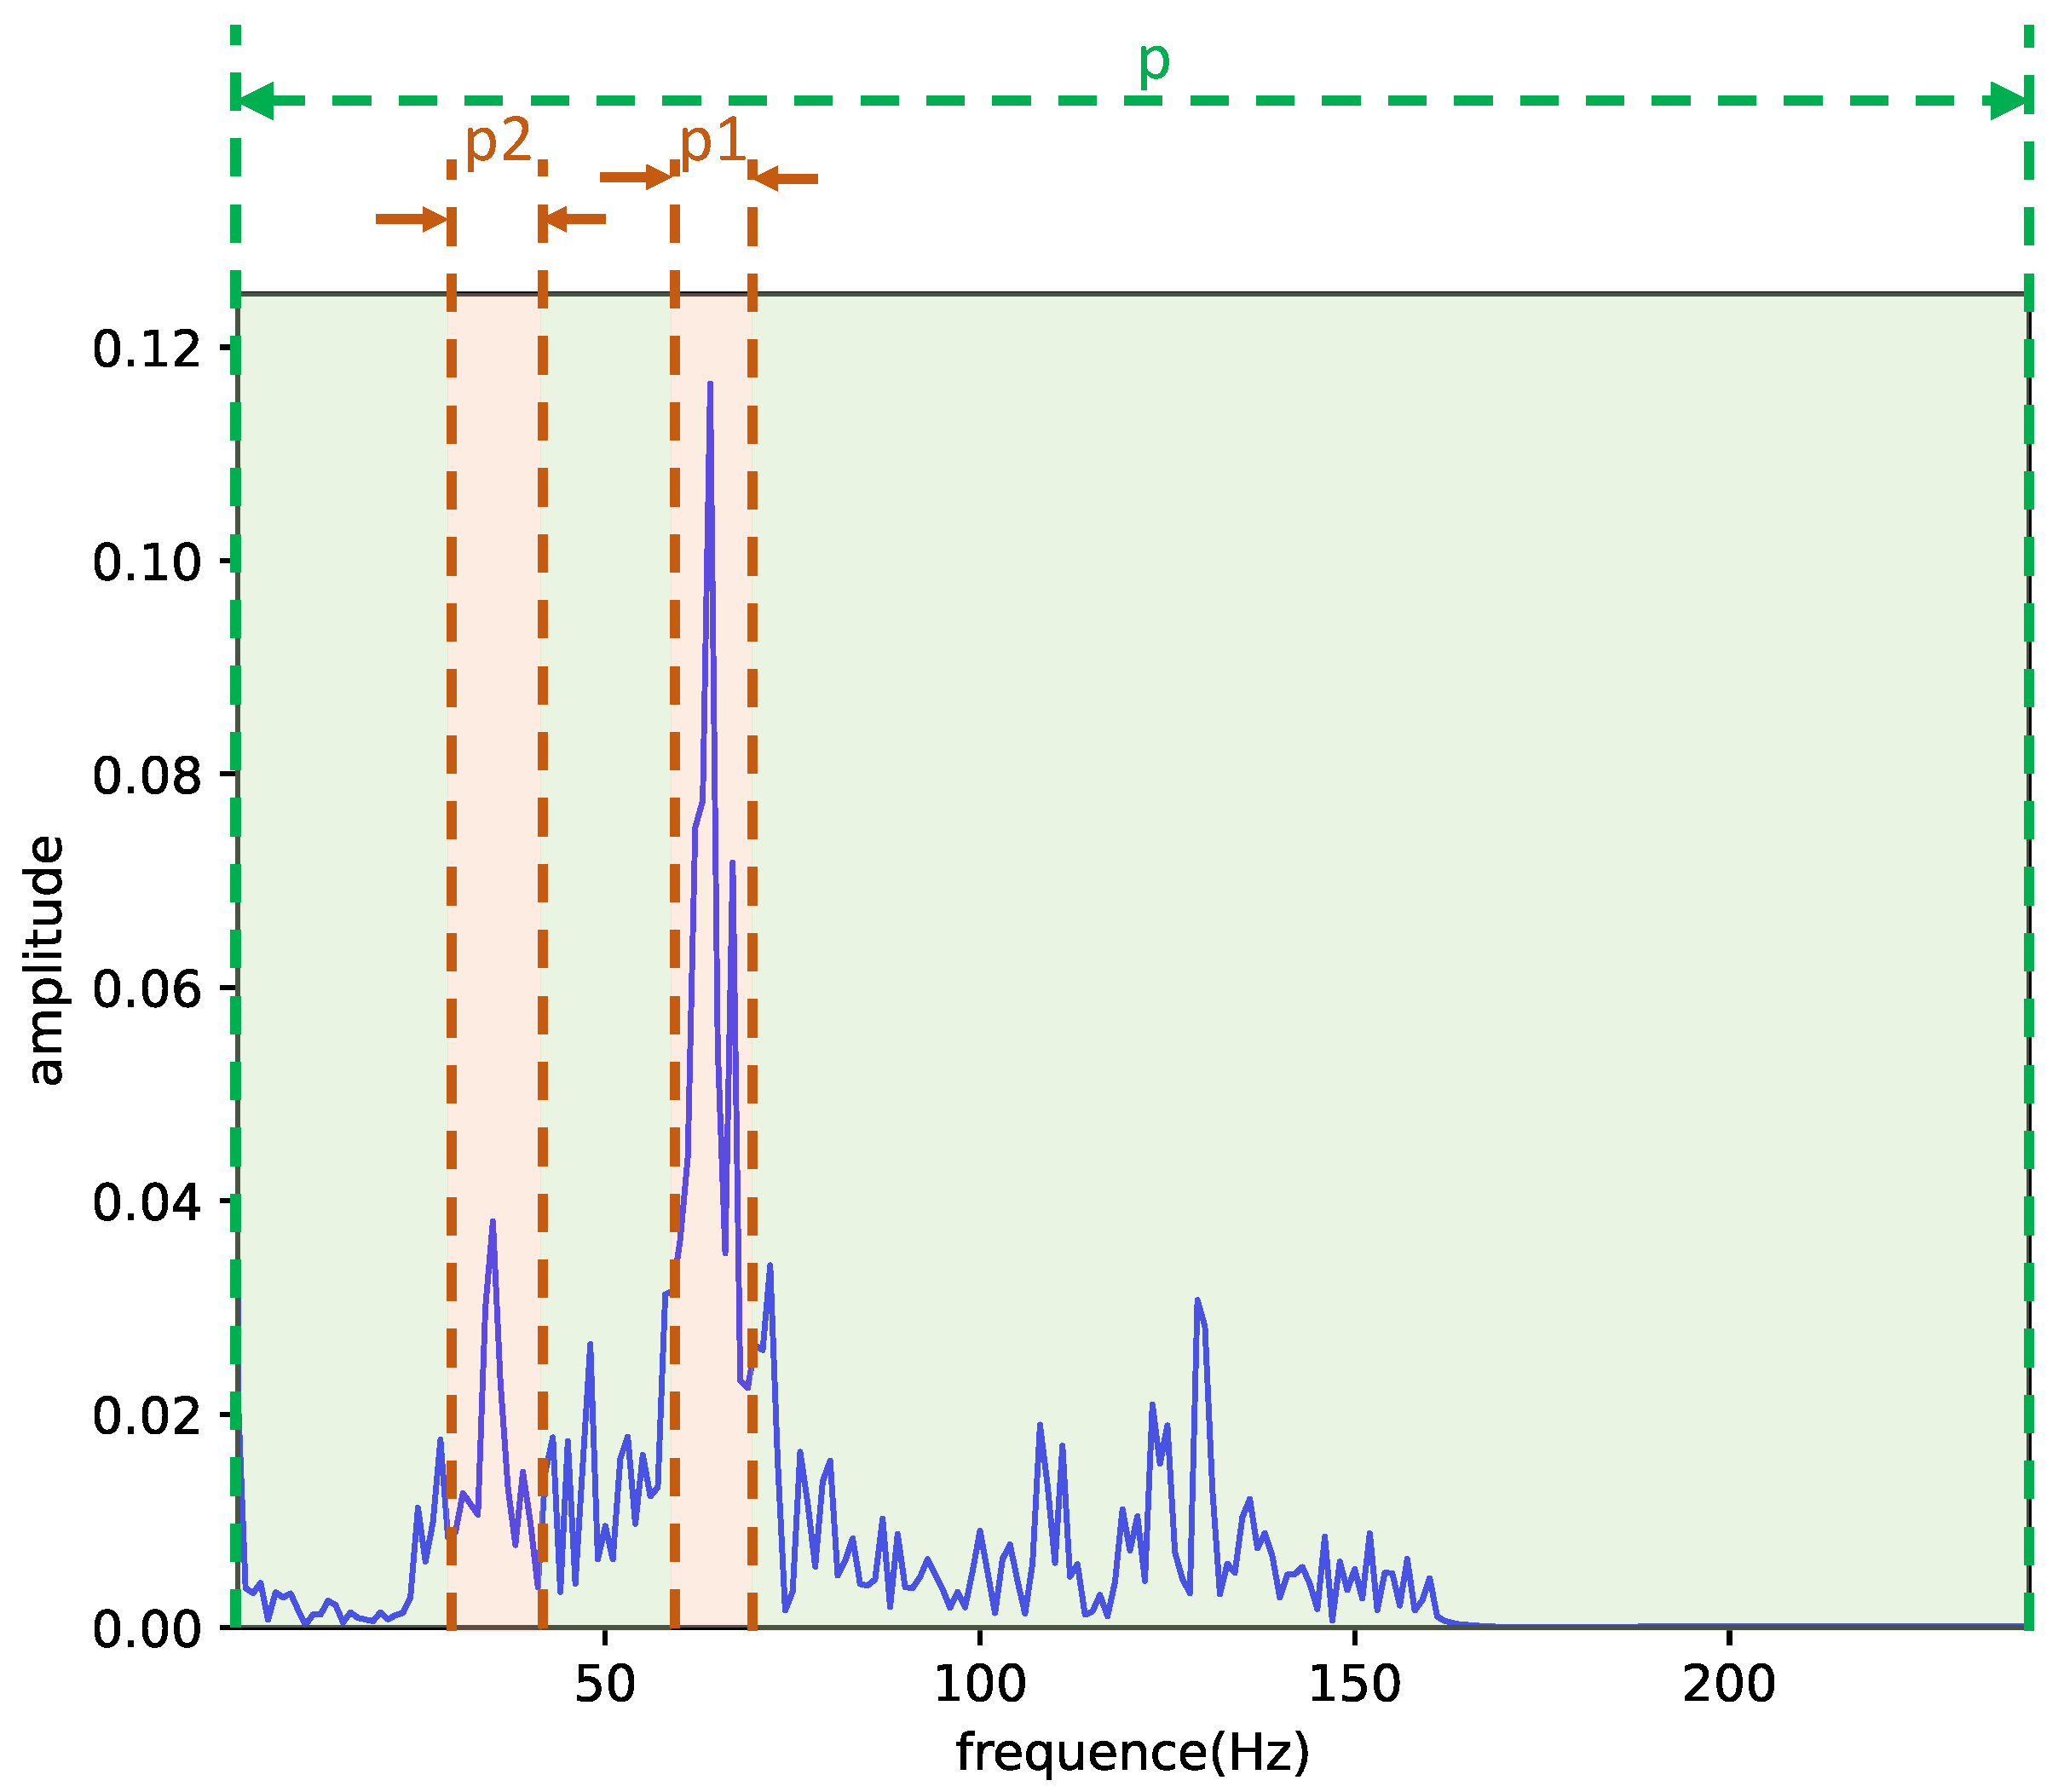
3.5. Heart Rate Signal Calculation

The heart rate signal estimation can be expressed as the average of the reconstructed pulse signals p ¯ , i.e.,
p ¯ = i = 1 r p i r
where r denotes the number of sub-regions with high-quality chrominance signal. The power spectral density distribution of the heart rate signal is calculated by using [39] method. We use the frequency with the maximum power response as the heart rate frequency f H R , the average heart rate estimation from the input video is calculated as H R v i d e o = 60 × f H R bpm.

3.6. Algorithm

The aforementioned framework for heart rate estimation is summarized in Algorithm 1.
Algorithm 1: Remote Heart Rate Estimation by Pulse Signal Reconstruction Based on Structural Sparse Representation.
Input: A video sequence with l frames. D : combined dictionary. μ : 0.5.
  1:
Face key point detection and split r ROIs.
  2:
Apply CHROM algorithm to extract chrominance signals S .
  3:
Apply Airpls algorithm to remove the baseline and obtain the corrected chrominance signals S ^ .
  4:
Calculate S N R by Equation (5) and select high-quality chrominance signals.
  5:
Construct the pulse signals S ^ h .
  6:
Solve the sparse coefficient matrix X ^ by Equation (6).
  7:
Reconstruct the pulse signals by P = D · X ^ .
  8:
Apply Equation (7) to average the pulse signals overall sub-regions.
  9:
Apply PSA method to find the frequency f H R corresponding the highest power component.
10:
Calculate the heart rate H R v i d e o = 60 × f H R .
Output: H R v i d e o .

4. Experimental Results

In this section, we introduce the experimental results which are tested on two public datasets, namely UBFC [40] and COHFACE [41]. The remainder of this section is structured as follows. Section 4.1 introduces the two public datasets and evaluation metrics. Section 4.2 shows the experimental results of SSR2RPS with several state-of-the-art methods. In Section 4.3, we describe the effect of the baseline elimination. Section 4.4 shows the parameters setting of SSR2RPS.

4.1. Datasets and Evaluation Metrics

The UBFC dataset [40] consists of 42 videos from 42 subjects, each video sequence with a resolution of 640 × 480 and a sampling rate of 30 HZ, in an uncompressed 8-bit RGB format. The referenced PPG signals are obtained by using a CMS50E transilluminated pulse oximeter. To compute the ground-truth heart rate for each video sequence, we use the PPG signal.
The COHFACE dataset [41] includes 40 subjects, 12 female and 28 male, whose average age is 35. Each subject contains four videos which are about one minute, two videos under the condition of the well-controlled lighting and two videos under the condition of ambient light. All subjects are required not to move or speak during the recording, and each video is recorded at a frequency of 20 HZ with a resolution of 640 × 480 pixels.
In order to evaluate the performance of SSR2RPS and compare it with several state-of-the-art methods, we consider four commonly used metrics in the literature on remote heart rate analysis. Specifically, we define H e ( i ) = H g t i H p r e d i , i.e., the error between the predicted heart rate H p r e d i and the ground-truth heart rate H g t i for the i-th video sequence. We calculate the mean error ( M E = i = 1 n H e ( i ) N ), mean absolute error ( M A E = i = 1 n H e ( i ) N ), root mean squared error ( R M S E = i = 1 n H e ( i ) 2 N ), and Pearson correlation coefficient ( ρ ) between signals H g t = H g t 1 , H g t 2 , , H g t i and H p r e d = H p r e d 1 , H p r e d 2 , , H p r e d i .

4.2. Comparison of Methods

In this section, we compare the proposed method with several state-of-the-art methods for averaging the heart rate prediction. Specifically, we analyze six well-known rPPG methods: ICA [42] and PCA [43] are used as the blind source separation methods, CHROM [9] and POS [8] are used as the skin reflection model methods, DAOMP [31] is used as the sparse representation method, and LGI [20] is used as the feature transform method.

4.2.1. Performance on UBFC Dataset

In order to validate the effectiveness of SSR2RPS, we compare SSR2RPS with other state-of-art methods, and the results are shown in Table 1. To fairly compare other methods for the remote heart rate estimation, we perform the same pre-processing as SSR2RPS on the input face video. We split each video into 1200 frames to estimate the average heart rate. The results for ICA and PCA are far worse than CHROM, POS, DAOMP, and LGI, as the latter methods strengthen the motion robustness of rPPG. Moreover, SSR2RPS achieves better results as M E = 1.70 , M A E = 2.57 , R M S E = 4.69 , and ρ = 0.97 . In addition, it can be found that the predicted heart rate H p r e d of SSR2RPS has a strong correlation with the ground-truth heart rate H g t , as shown in Figure 5. The reason why SSR2RPS shows the best results is that SSR2RPS is able to select atoms which are closer to the ground-truth heart rate for reconstructing the pulse signals.

4.2.2. Performance on COHFACE Dataset

We perform similar experiments on the more challenging sequences of the COHFACE dataset to test the effectiveness of SSR2RPS. We split the video into 1200 frames and set the maximum iterations to 50. Notably, the performance improvement is most significant under good conditions, with better experimental conditions as shown in Table 2. Compared to other state-of-the-art methods, SSR2RPS shows a better performance in all conditions. In addition, from Figure 6, it can be seen that the predicted heart rate H p r e d has a stronger correlation with the ground-truth heart rate H g t . We removed the effect of instability of the light on the heart rate estimation, so the results of SSR2RPS outperform other methods.

4.3. Effect of Baseline Elimination

We evaluate the performance of the Airpls de-trending with other elimination baseline methods, such as the linear de-trending and polynomial de-trending methods. For the polynomial de-trending method, we set the fourth order and the fifth order, respectively. The results are shown in Table 3. It is evidently observed that the Airpls de-trending shows the best result for the M A E is the lowest. For the Airpls de-trending, we conclude that it is able to remove the linear baseline and also the irregular baseline. Thus, more kinds of drift trends are eliminated. Among all the methods, the Airpls de-trending achieves the lowest M A E of the averaging heart rate estimation.

4.4. Parameter Setting

In this section, we present the parameter settings and discuss the effect of different parameters on the results. SSR2RPS includes four parameters: the sub-regions size ( p × p ), smoothing parameter λ , penalty parameter μ , and video length l. We conduct the experiment on the UBFC dataset with all the subjects. Figure 7 illustrates the effect of the parameters on the results. The values of the four parameters are explored on all the testing samples and are determined according to the best experimental results. The overlarge facial sub-region will lead to ignored heart rate signals and also affect the flexibility of the heart rate signals’ reconstruction. Different values of λ are illustrated in Figure 7b, from which we found that the best performance is achieved when λ = 0.1. It can be found that the acceptable values of μ ranged from 0.1 to 1.5, as the fidelity of the reconstructed pulse signals failed to meet the requirements given an excessively small μ , whereas the reconstructed pulse signals might be affected by noise if the value of μ is higher than 1.5. Then, in order to explore the performance of SSR2RPS at different video length l, we set l to 300, 600, 900, and 1200 frames, respectively. Figure 7d shows that the M A E decreases significantly when the video length is longer than 600. The reason for the stability of the M A E when the video length exceeds 600 is that the longer video length is able to provide more sufficient information for the proposed method to reconstruct the heart rate signals. As the analysis above illustrates, we set p × p = 20 × 20 , λ = 0.1 , μ = 0.5 , and l = 1200 .

5. Conclusions

In this paper, we present a new method for the remote heart rate estimation using SSR2RPS. The proposed method advances the literature with two innovations: eliminate the trend variations and an SSR to reconstruct pulse signals. Eliminating the trend variations aims to remove the noise which is recorded during a video capture. The SSR to reconstruct the pulse signals is used to select several atoms that are closer to the ground truth in the combined dictionary. As far as we know, it is the first work applying a structural sparse representation to reconstruct the pulse signals in the combined dictionary. We evaluate our framework on two public datasets and compare with other state-of-the-art methods. The results show that the performance of SSR2RPS is better than other methods for the heart rate estimation.

Author Contributions

Research design, literature search, data analysis, algorithm design, and manuscript writing, J.H.; provide research ideas, analyze research background, and supervise manuscript writing, W.O.; research design, software, data collection, and algorithm design software, J.X.; literature search, data analysis, and manuscript revision, and S.F. All authors have read and agreed to the published version of the manuscript.

Funding

This work is supported by the National Natural Science Foundation of China (No.61962010 and No.62262005).

Data Availability Statement

The data that support the findings of this study are available from the corresponding author [40,41] upon reasonable request.

Conflicts of Interest

The authors declare no conflict of interest.

References

  1. Jo, E.; Lewis, K.; Directo, D.; Kim, M.J.; Dolezal, B.A. Validation of biofeedback wearables for photoplethysmographic heart rate tracking. J. Sport Sci. Med. 2016, 15, 540. [Google Scholar]
  2. Spierer, D.K.; Rosen, Z.; Litman, L.L.; Fujii, K. Validation of photoplethysmography as a method to detect heart rate during rest and exercise. J. Med. Eng. Technol. 2015, 39, 264–271. [Google Scholar] [CrossRef] [PubMed]
  3. Diao, J.A.; Marwaha, J.S.; Kvedar, J.C. Video-based physiologic monitoring: Promising applications for the ICU and beyond. NPJ Digit. Med. 2022, 5, 1–2. [Google Scholar] [CrossRef] [PubMed]
  4. Pankaj; Kumar, A.; Komaragiri, R.; Kumar, M. Reference signal less Fourier analysis based motion artifact removal algorithm for wearable photoplethysmography devices to estimate heart rate during physical exercises. Comput. Biol. Med. 2022, 141, 105081. [Google Scholar] [CrossRef]
  5. Magdalena Nowara, E.; Marks, T.K.; Mansour, H.; Veeraraghavan, A. SparsePPG: Towards driver monitoring using camera-based vital signs estimation in near-infrared. In Proceedings of the IEEE Conference on Computer Vision and Pattern Recognition Workshops, Salt Lake City, UT, USA, 18–23 June 2018; pp. 1272–1281. [Google Scholar]
  6. Lee, H.; Ko, H.; Chung, H.; Nam, Y.; Hong, S.; Lee, J. Real-time realizable mobile imaging photoplethysmography. Sci. Rep. 2022, 12, 1–14. [Google Scholar] [CrossRef]
  7. Jorge, J.; Villarroel, M.; Tomlinson, H.; Gibson, O.; Darbyshire, J.L.; Ede, J.; Harford, M.; Young, J.D.; Tarassenko, L.; Watkinson, P. Non-contact physiological monitoring of post-operative patients in the intensive care unit. Nat. Partn. J. Digit. Med. 2022, 5, 1–11. [Google Scholar]
  8. Wang, W.; Den Brinker, A.C.; Stuijk, S.; De Haan, G. Algorithmic principles of remote PPG. IEEE Trans. Biomed. Eng. 2016, 64, 1479–1491. [Google Scholar] [CrossRef] [Green Version]
  9. De Haan, G.; Jeanne, V. Robust pulse rate from chrominance-based rPPG. IEEE Trans. Biomed. Eng. 2013, 60, 2878–2886. [Google Scholar] [CrossRef]
  10. Chen, W.; McDuff, D. Deepphys: Video-based physiological measurement using convolutional attention networks. In Proceedings of the European Conference on Computer Vision, Munich, Germany, 8–14 September 2018; pp. 349–365. [Google Scholar]
  11. Kang, J.; Yang, S.; Zhang, W. TransPPG: Two-stream Transformer for Remote Heart Rate Estimate. arXiv 2022, arXiv:2201.10873. [Google Scholar]
  12. Niu, X.; Yu, Z.; Han, H.; Li, X.; Shan, S.; Zhao, G. Video-based remote physiological measurement via cross-verified feature disentangling. In Proceedings of the European Conference on Computer Vision, Glasgow, UK, 23–28 August 2020; pp. 295–310. [Google Scholar]
  13. Hill, B.L.; Liu, X.; McDuff, D. Beat-to-beat cardiac pulse rate measurement from video. In Proceedings of the IEEE International Conference on Computer Vision, Montreal, QC, Canada, 10–17 October 2021; pp. 2739–2742. [Google Scholar]
  14. Qiu, Y.; Liu, Y.; Arteaga-Falconi, J.; Dong, H.; El Saddik, A. EVM-CNN: Real-time contactless heart rate estimation from facial video. IEEE Trans. Multimed. 2018, 21, 1778–1787. [Google Scholar] [CrossRef]
  15. Li, L.; Chen, C.; Pan, L.; Zhang, J.; Xiang, Y. Video is All You Need: Attacking PPG-based Biometric Authentication. arXiv 2022, arXiv:2203.00928. [Google Scholar]
  16. Verkruysse, W.; Svaasand, L.O.; Nelson, J.S. Remote plethysmographic imaging using ambient light. Optics Express 2008, 16, 21434–21445. [Google Scholar] [CrossRef] [PubMed] [Green Version]
  17. Wang, W.; Stuijk, S.; De Haan, G. A novel algorithm for remote photoplethysmography: Spatial subspace rotation. IEEE Trans. Biomed. Eng. 2015, 63, 1974–1984. [Google Scholar] [CrossRef] [PubMed]
  18. Zhang, X.; Xia, Z.; Dai, J.; Liu, L.; Jiang, X.; Feng, X. Heart rate estimation via self-adaptive region selection and multiregion-fusion 1D CNN. J. Electron. Imaging 2022, 31, 023006. [Google Scholar]
  19. Cai, K.; Yue, H.; Li, B.; Chen, W.; Huang, W. Combining chrominance features and fast ICA for noncontact imaging photoplethysmography. IEEE Access 2020, 8, 50171–50179. [Google Scholar] [CrossRef]
  20. Pilz, C.S.; Zaunseder, S.; Krajewski, J.; Blazek, V. Local group invariance for heart rate estimation from face videos in the wild. In Proceedings of the IEEE Conference on Computer Vision and Pattern Recognition Workshops, Salt Lake City, UT, USA, 18–23 June 2018; pp. 1254–1262. [Google Scholar]
  21. Yang, Z.; Wang, H.; Lu, F. Assessment of Deep Learning-based Heart Rate Estimation using Remote Photoplethysmography under Different Illuminations. arXiv 2022, arXiv:2107.13193. [Google Scholar] [CrossRef]
  22. Schrumpf, F.; Frenzel, P.; Aust, C.; Osterhoff, G.; Fuchs, M. Assessment of Non-Invasive Blood Pressure Prediction from PPG and rPPG Signals Using Deep Learning. Sensors 2021, 21, 6022. [Google Scholar] [CrossRef]
  23. Hu, C.; Zhang, K.Y.; Yao, T.; Ding, S.; Li, J.; Huang, F.; Ma, L. An End-to-end Efficient Framework for Remote Physiological Signal Sensing. In Proceedings of the IEEE International Conference on Computer Vision, IEEE, Montreal, QC, Canada, 10–17 October 2021; pp. 2378–2384. [Google Scholar]
  24. Gao, H.; Wu, X.; Geng, J.; Lv, Y. Remote Heart Rate Estimation by Signal Quality Attention Network. In Proceedings of the IEEE Conference on Computer Vision and Pattern Recognition, New Orleans, LA, USA, 19–24 June 2022; pp. 2122–2129. [Google Scholar]
  25. Li, T.; Chen, W. Bathtub ECG as a Potential Alternative to Light Stress Test in Daily Life. Electronics 2022, 11, 1310. [Google Scholar] [CrossRef]
  26. Pagano, T.P.; Santos, V.R.; Bonfim, Y.d.S.; Paranhos, J.V.D.; Ortega, L.L.; Sá, P.H.M.; Nascimento, L.F.S.; Winkler, I.; Nascimento, E.G.S. Machine Learning Models and Videos of Facial Regions for Estimating Heart Rate: A Review on Patents, Datasets, and Literature. Electronics 2022, 11, 1473. [Google Scholar] [CrossRef]
  27. Mallat, S.G.; Zhang, Z. Matching pursuits with time-frequency dictionaries. IEEE Trans. Signal Process. 1993, 41, 3397–3415. [Google Scholar] [CrossRef] [Green Version]
  28. Pati, Y.C.; Rezaiifar, R.; Krishnaprasad, P.S. Orthogonal matching pursuit: Recursive function approximation with applications to wavelet decomposition. In Proceedings of the 27th Asilomar Conference on Signals, Systems and Computers, Pacific Grove, CA, USA, 1–3 November 1993; pp. 40–44. [Google Scholar]
  29. Liu, S.; Lyu, N.; Wang, H. The implementation of the improved OMP for AIC reconstruction based on parallel index selection. IEEE Trans. Very Large Scale Integr. Syst. 2017, 26, 319–328. [Google Scholar]
  30. Zhang, Z. Photoplethysmography-based heart rate monitoring in physical activities via joint sparse spectrum reconstruction. IEEE Trans. Biomed. Eng. 2015, 62, 1902–1910. [Google Scholar] [CrossRef] [PubMed] [Green Version]
  31. Liu, X.; Yang, X.; Jin, J.; Wong, A. Detecting pulse wave from unstable facial videos recorded from consumer-level cameras: A disturbance-adaptive orthogonal matching pursuit. IEEE Trans. Biomed. Eng. 2020, 67, 3352–3362. [Google Scholar] [CrossRef] [PubMed]
  32. Dabhi, M.K.; Pancholi, B.K. Face detection system based on Viola-Jones algorithm. Int. J. Sci. Res. 2016, 5, 62–64. [Google Scholar]
  33. Wong, K.L.; Chin, J.W.; Chan, T.T.; Odinaev, I.; Suhartono, K.; Tianqu, K.; So, R.H. Optimising rPPG Signal Extraction by Exploiting Facial Surface Orientation. In Proceedings of the IEEE Conference on Computer Vision and Pattern Recognition, New Orleans, LA, USA, 19–24 June 2022; pp. 2165–2171. [Google Scholar]
  34. Kwon, S.; Kim, J.; Lee, D.; Park, K. ROI analysis for remote photoplethysmography on facial video. In Proceedings of the 2015 37th Annual International Conference of the IEEE Engineering in Medicine and Biology Society, Milan, Italy, 25–29 August 2015; pp. 4938–4941. [Google Scholar]
  35. Guo, J.; Deng, J.; Lattas, A.; Zafeiriou, S. Sample and Computation Redistribution for Efficient Face Detection. arXiv 2021, arXiv:2105.04714. [Google Scholar]
  36. Zhang, Z.M.; Chen, S.; Liang, Y.Z. Baseline correction using adaptive iteratively reweighted penalized least squares. Analyst 2010, 135, 1138–1146. [Google Scholar] [CrossRef]
  37. Černá, D.; Rebollo-Neira, L. Construction of wavelet dictionaries for ECG modeling. MethodsX 2021, 8, 101314. [Google Scholar] [CrossRef]
  38. Rajaei, A.; Fattaheian-Dehkordi, S.; Fotuhi-Firuzabad, M.; Moeini-Aghtaie, M. Decentralized transactive energy management of multi-microgrid distribution systems based on ADMM. Int. J. Electr. Power Energy Syst. 2021, 132, 107126. [Google Scholar] [CrossRef]
  39. Zhao, H.; Liu, H.; Jin, Y.; Dang, X.; Deng, W. Feature extraction for data-driven remaining useful life prediction of rolling bearings. IEEE Trans. Instrum. Meas. 2021, 70, 1–10. [Google Scholar]
  40. Bobbia, S.; Macwan, R.; Benezeth, Y.; Mansouri, A.; Dubois, J. Unsupervised skin tissue segmentation for remote photoplethysmography. Pattern Recognit. Lett. 2019, 124, 82–90. [Google Scholar] [CrossRef]
  41. Heusch, G.; Anjos, A.; Marcel, S. A reproducible study on remote heart rate measurement. arXiv 2017, arXiv:1709.00962. [Google Scholar]
  42. Poh, M.Z.; McDuff, D.J.; Picard, R.W. Advancements in noncontact, multiparameter physiological measurements using a webcam. IEEE Trans. Biomed. Eng. 2010, 58, 7–11. [Google Scholar] [CrossRef] [PubMed]
  43. Lewandowska, M.; Rumiński, J.; Kocejko, T.; Nowak, J. Measuring pulse rate with a webcam—A non-contact method for evaluating cardiac activity. In Proceedings of the 2011 Federated Conference on Computer Science and Information Systems, Szczecin, Poland, 18–21 September 2011; pp. 405–410. [Google Scholar]
Figure 1. The raw chrominance signals from 14 different sub-regions, which are highly similar.
Electronics 11 03738 g001
Figure 2. The overall framework of SSR2RPS. As shown in the figure, it includes the ROI segmentations, extraction of chrominance signal, de-trending for the chrominance signal, sparse decomposition, and estimation of heart rate averaged over all sub-regions.
Electronics 11 03738 g002
Figure 3. The de-trending filter of chrominance signal. The blue curve is the chrominance signal, the green curve is the corrected signal, and the red curve is the fitted baseline.
Electronics 11 03738 g003
Figure 4. Calculating the S N R : the ratio of the signal power spectrum in the region surrounding maximum and second largest peak divided by the rest of signal power spectrum.
Electronics 11 03738 g004
Figure 5. The ground-truth heart rate compared to the predicted heart rate of our method on the UBFC dataset. (a) Histogram of the H p r e d and the H g t . (b) Scatter plot comparing the H p r e d and the H g t on the UBFC dataset.
Electronics 11 03738 g005
Figure 6. Scatter plot comparing the ground-truth H g t and the predicted H p r e d on COHFACE dataset. The dark blue points indicate the average heart rate estimation under good conditions, and the light blue points indicate the average heart rate estimation under nature conditions.
Electronics 11 03738 g006
Figure 7. The parameterization of SSR2RPS. (a) Size of the sub-region. (b) Smoothing parameter of baseline elimination. (c) Penalty coefficient of SSR. (d) Video length.
Electronics 11 03738 g007
Table 1. Average heart rate prediction: comparison among different methods on UBFC dataset (best performance in bold).
Methods ME (bpm) MAE (bpm) RMSE (bpm) ρ
CHROM [9]5.926.379.100.91
ICA [42]24.8326.7832.590.37
PCA [43]12.4618.3622.320.31
POS [8]6.376.5210.520.86
DAOMP [31]6.687.3414.500.87
LGI [20]9.2310.2916.610.65
SSR2RPS1.702.574.690.97
Table 2. Average heart rate prediction: comparison among different methods on different conditions of the COHFACE dataset (best performance in bold).
MethodsGood Condition 0Good Condition 1
ME  (bpm) MAE  (bpm) RMSE  (bpm) ρ ME  (bpm) MAE  (bpm) RMSE  (bpm) ρ
CHROM [9]5.676.378.430.874.355.938.680.87
ICA [42]11.9916.4826.050.3612.9917.4829.540.30
PCA [43]3.9712.3314.370.454.187.429.380.43
POS [8]4.777.3611.760.695.638.3613.820.76
DAOMP [31]3.655.209.580.893.776.3711.260.83
LGI [20]8.2912.4613.640.627.8711.7414.540.63
SSR2RPS3.253.434.110.913.533.544.630.90
MethodsNature Condition 2Nature Condition 3
ME  (bpm) MAE  (bpm) RMSE  (bpm) ρ ME  (bpm) MAE  (bpm) RMSE  (bpm) ρ
CHROM [9]4.656.807.000.773.656.7010.260.84
ICA [42]9.9914.4820.190.2412.0417.4823.540.22
PCA [43]12.2417.3323.370.289.9715.3317.370.22
POS [8]6.6311.3618.820.707.139.3616.820.74
DAOMP [31]3.777.3413.630.763.077.8412.020.79
LGI [20]6.3110.9713.230.597.1311.7214.170.68
SSR2RPS4.274.685.310.884.264.755.760.85
Table 3. Performance of heart rate estimation on UBFC dataset shows the superiority of the baseline elimination (best performance in bold).
Methods ME  (bpm) MAE  (bpm) RMSE  (bpm) ρ
No elimination of trends4.084.569.160.88
Linear de-trending4.875.3210.280.86
Fourth-order polynomial de-trending3.273.737.020.93
Fifth-order polynomial de-trending3.413.797.000.93
Airpls de-trending1.702.574.690.97
Publisher’s Note: MDPI stays neutral with regard to jurisdictional claims in published maps and institutional affiliations.

