Article

A Novel Deep Learning Technique for Detecting Emotional Impact in Online Education

1
Faculty of Science and IT, Al-Zaytoonah University of Jordan, Amman 11733, Jordan
2
Sorbonne Center of Artificial Intelligence, Sorbonne University-Abu Dhabi, Abu Dhabi 38044, United Arab Emirates
3
Department of Information Technology, Faculty of Prince Al-Hussien bin Abdullah II for IT, The Hashemite University, Zarqa 13133, Jordan
4
Computer Engineering Department, Computer and Information Systems College, Umm Al-Qura University, Makkah 21955, Saudi Arabia
5
Hourani Center for Applied Scientific Research, Al-Ahliyya Amman University, Amman 19328, Jordan
6
Faculty of Information Technology, Middle East University, Amman 11831, Jordan
*
Authors to whom correspondence should be addressed.
Electronics 2022, 11(18), 2964; https://doi.org/10.3390/electronics11182964
Submission received: 26 July 2022 / Revised: 27 August 2022 / Accepted: 13 September 2022 / Published: 19 September 2022
(This article belongs to the Special Issue Big Data Analytics Using Artificial Intelligence)

Abstract

:
Emotional intelligence is the automatic detection of human emotions using various intelligent methods. Several studies have been conducted on emotional intelligence, and only a few have been adopted in education. Detecting student emotions can significantly increase productivity and improve the education process. This paper proposes a new deep learning method to detect student emotions. The main aim of this paper is to map the relationship between teaching practices and student learning based on emotional impact. Facial recognition algorithms extract helpful information from online platforms as image classification techniques are applied to detect the emotions of student and/or teacher faces. As part of this work, two deep learning models are compared according to their performance. Promising results are achieved using both techniques, as presented in the Experimental Results Section. For validation of the proposed system, an online course with students is used; the findings suggest that this technique operates well. Based on emotional analysis, several deep learning techniques are applied to train and test the emotion classification process. Transfer learning for a pre-trained deep neural network is used as well to increase the accuracy of the emotion classification stage. The obtained results show that the performance of the proposed method is promising using both techniques, as presented in the Experimental Results Section.

1. Introduction

Emotions are a vital and fundamental part of our existence. To comprehend a human’s most fundamental behavior, we must examine these feelings using emotional data, such as text, voice, face, facial emotions, and facial data [1,2]. Emotion analysis is used in computer vision, image processing, and high-speed photography applications to detect movement in images [3]. Emotion analysis aims to detect emotion in an image, track a person’s emotion through time, group items that move together, and determine motion direction. Human faces are thought to contain much information that humans use to make engagement decisions, and facial emotions are closely linked to perceived engagement [4].
Facial expressions reveal much about a person’s feelings, intentions, and internal states [5]. Facial expression systems are a type of automatic facial expression recognition system [6]. Such systems can function reasonably, displaying spontaneous and planned behavior and contrived facial expressions [7].
Emotional analysis employs a complicated framework for understanding customer responses [8,9]. Using emoji and text analysis, this method assesses the variances in the feelings expressed by different viewers or purchasers [10]. It is a detailed examination of the feelings and intensities felt as emotions develop and change [11,12,13].
Unlike sentiment analysis, emotional analysis considers human emotions’ nuances. It also investigates the viewer’s, buyer’s, or reader’s intentions and impulses [14,15]. These discoveries can be quite enlightening and are simple to put into action: if boredom is the predominant emotion, spice things up with humor, creativity, or a cliffhanger moment. A confused reaction can indicate that the material is too complicated and that you must convey it differently [16].
Emotions are essential in our life, as they are inborn with the ability to influence our behaviors and judgments [17]. Faces are often the best sign of this because they convey emotions without words and may be observed by others [18]. Facial emotions are created by muscle movements beneath the skin of the face [19,20]. Emotions, according to scholars, are a significant component of nonverbal communication and a rich source of social signals, and they are crucial in understanding human behavior [21]. By examining facial expressions and mood data, researchers can gain a deeper comprehension of complicated human actions [22].
A straightforward guide to students’ internal expressions is preferred to develop a successful strategy for teaching effectively and improving academic achievements [23]. This can reveal complex emotions and impulses, which are never simply black and white either for positive or negative emotions for any student [24].
Teachers could get real-time data on their pupils’ engagement with educational videos. Such data could indicate whether a video causes high anxiety or low involvement. The technology could aid in determining when and why pupils become disengaged, allowing intervention before it is too late [25]. This study looks at methods for automatically detecting student involvement based on facial expressions. We investigated whether human observers can reliably judge engagement from the face. The technology could assist in understanding when and why kids get distracted and possibly intervene before it becomes a problem [26]. Automated Instructional Systems (AITS) is a type of computer-assisted instruction that reports the video viewing speed that students choose as well as the student’s perception of the degree of difficulty.
In-depth emotional analysis is designed to help understand student behaviors and motivations [27]. This is the only way to properly understand how to change website or social media site content during online education. It encompasses the full range of human emotions. Emotions are strong feelings associated with each circumstance and play an important role in communication between students and teachers. Emoticons can be recognized by various features, including face, speech, and even text. Facial expressions are one of the most direct ways of communicating feelings and are necessary to appreciate a student’s internal feelings [28,29]. The facial expressions of students and/or teachers can be used to understand their emotions in the learning environment.
This paper aims to map the relationship between teaching practices and student learning based on students’ and teachers’ emotional impact. Facial recognition algorithms extract helpful information from online platforms as image classification techniques are applied to detect the emotion of student and/or teacher faces. To validate the proposed system, an online course with students is used; the findings suggest that this technique operates well. Based on emotional analysis, several deep learning techniques are applied to train and test the emotion classification process. Transfer learning for a pre-trained deep neural network is used as well to increase the accuracy of the emotion classification stage. The obtained results show that the performance of the proposed method is promising with both techniques, as presented in the Experimental Results Section.
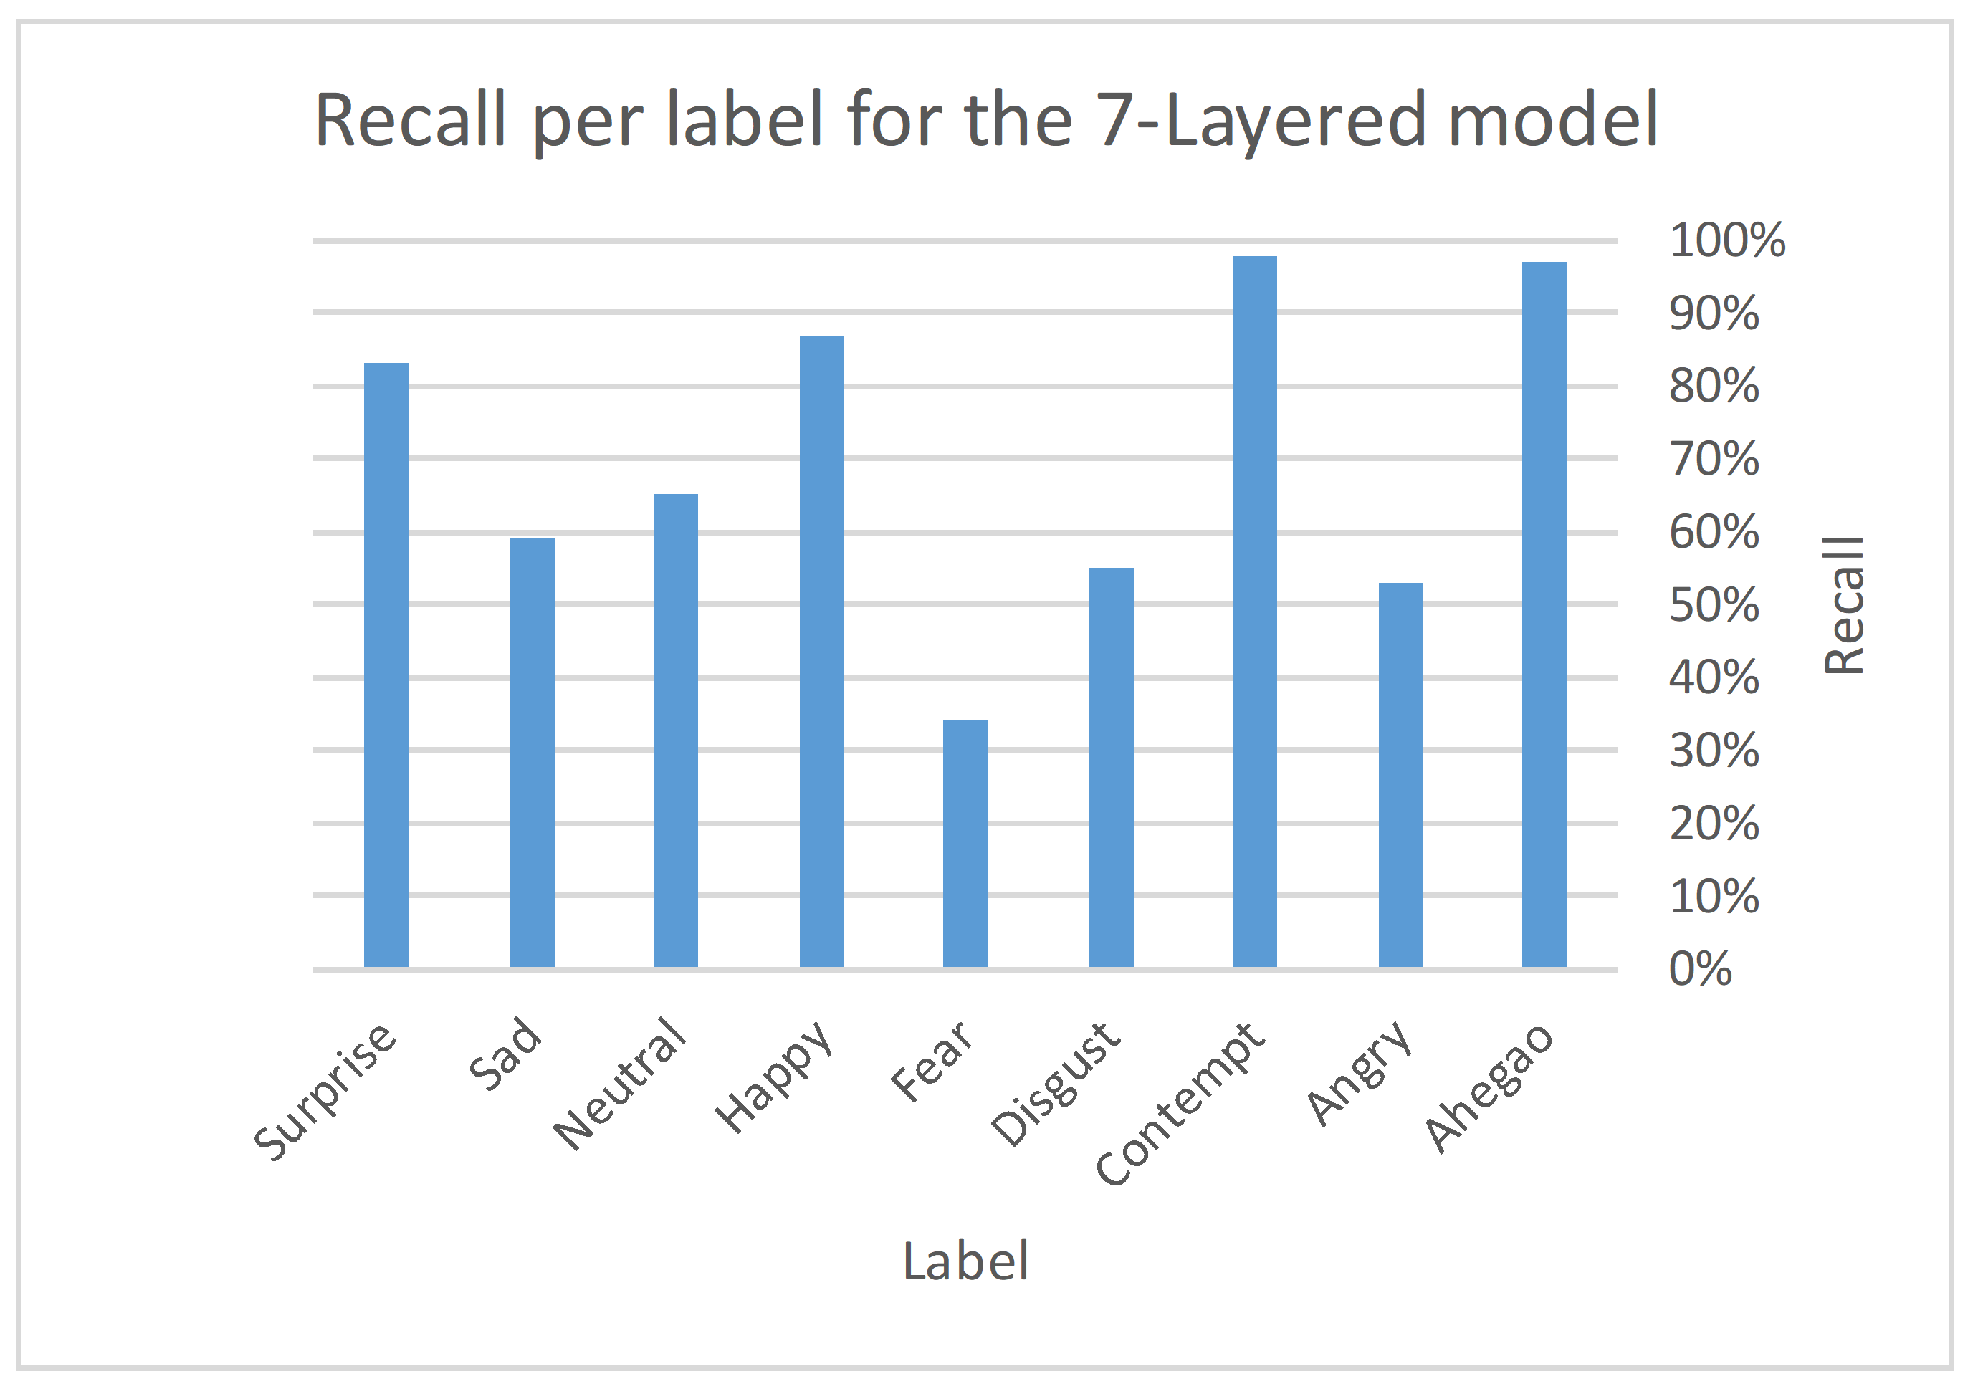
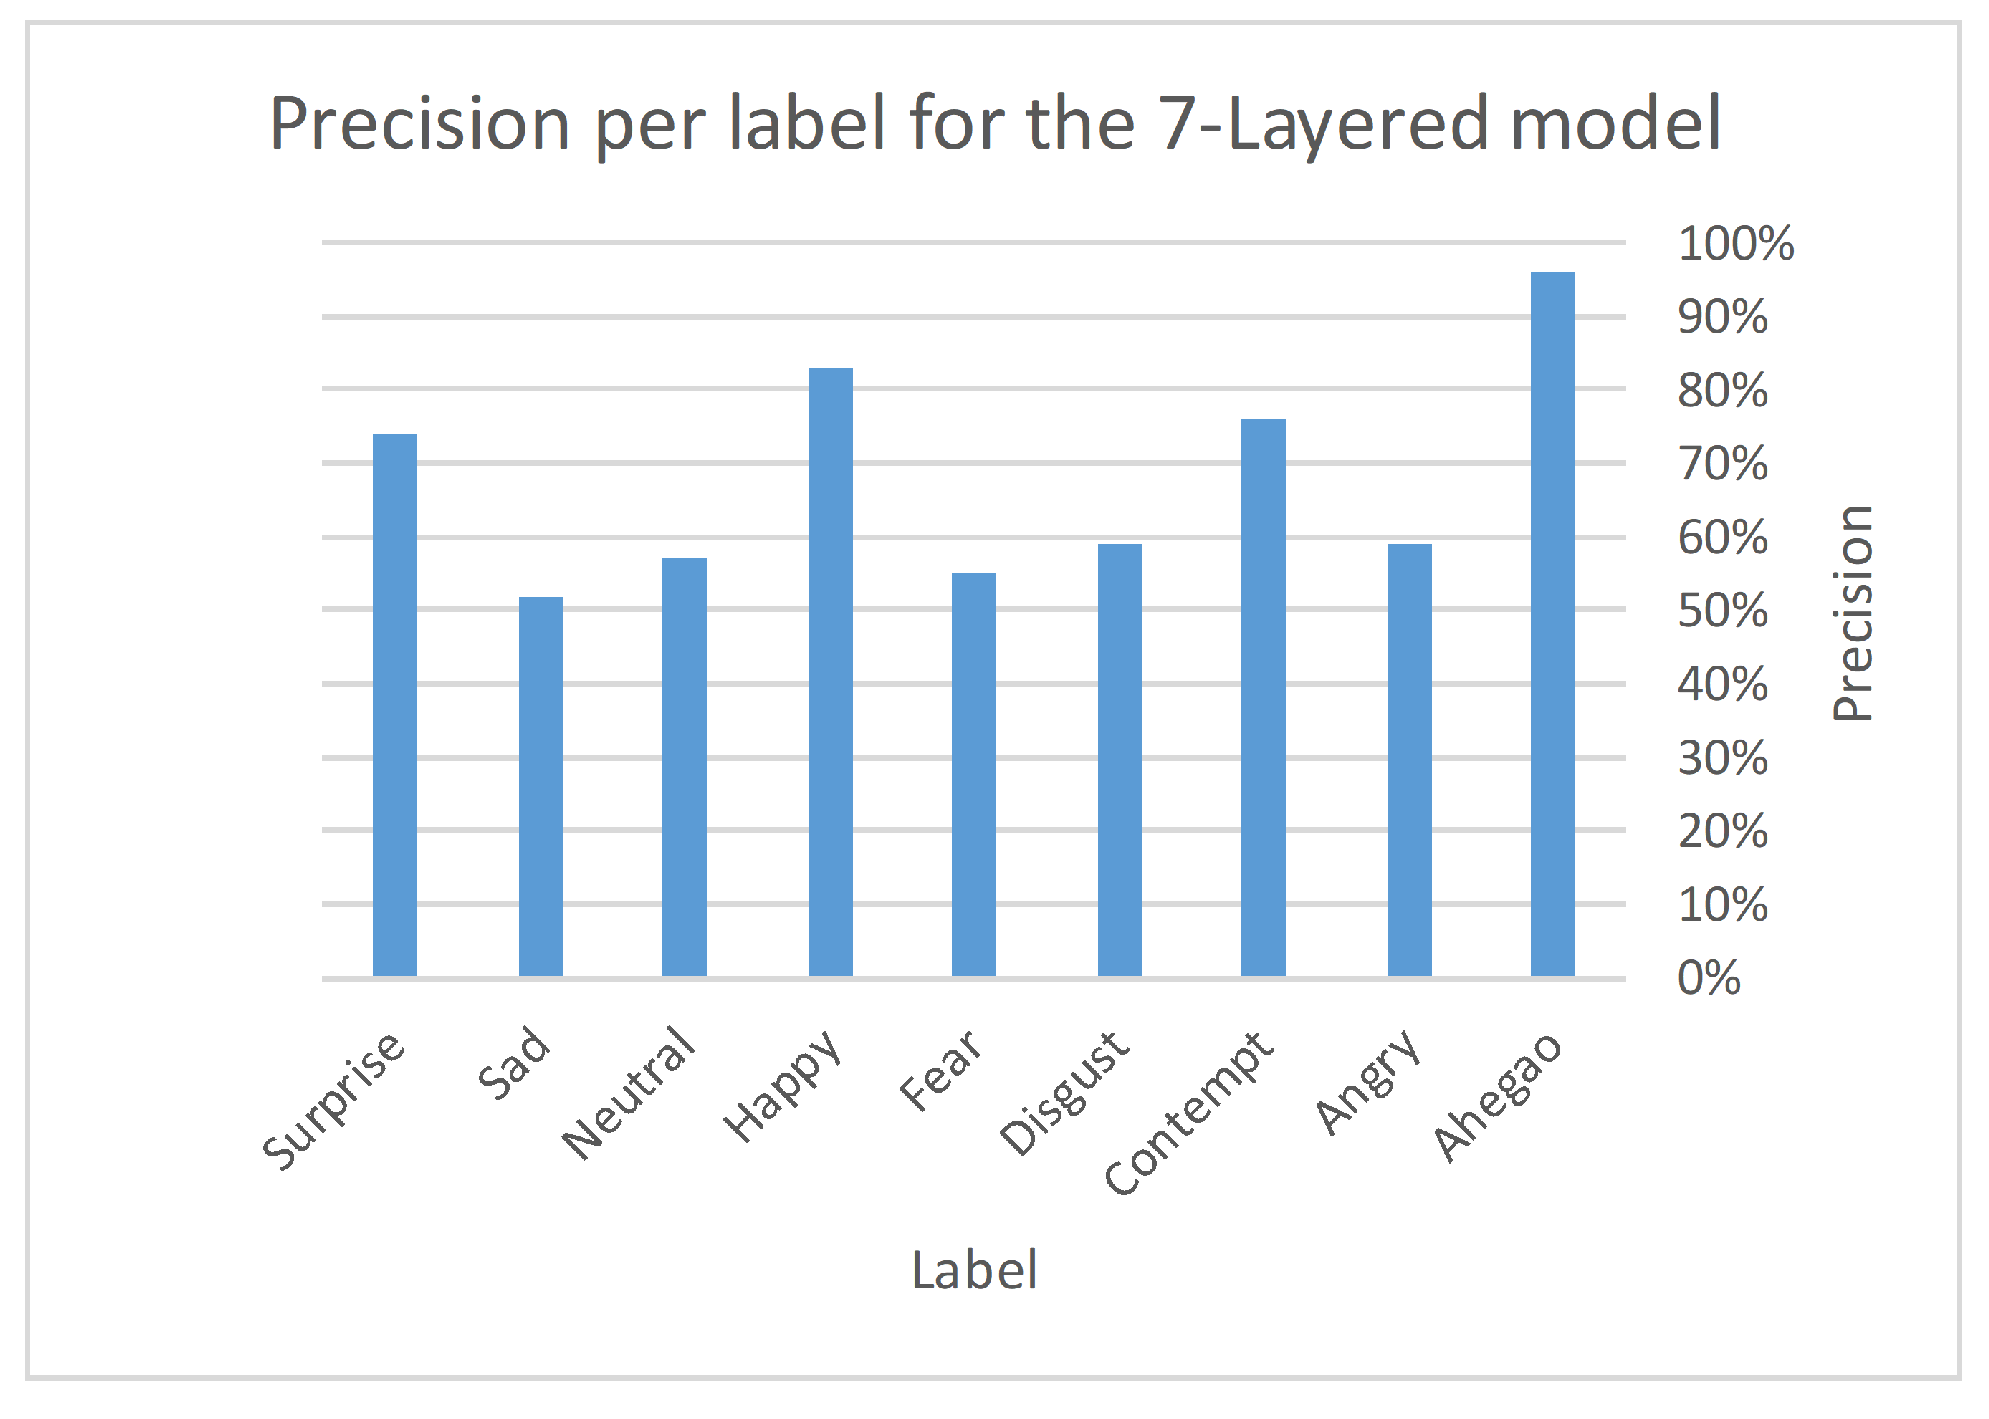
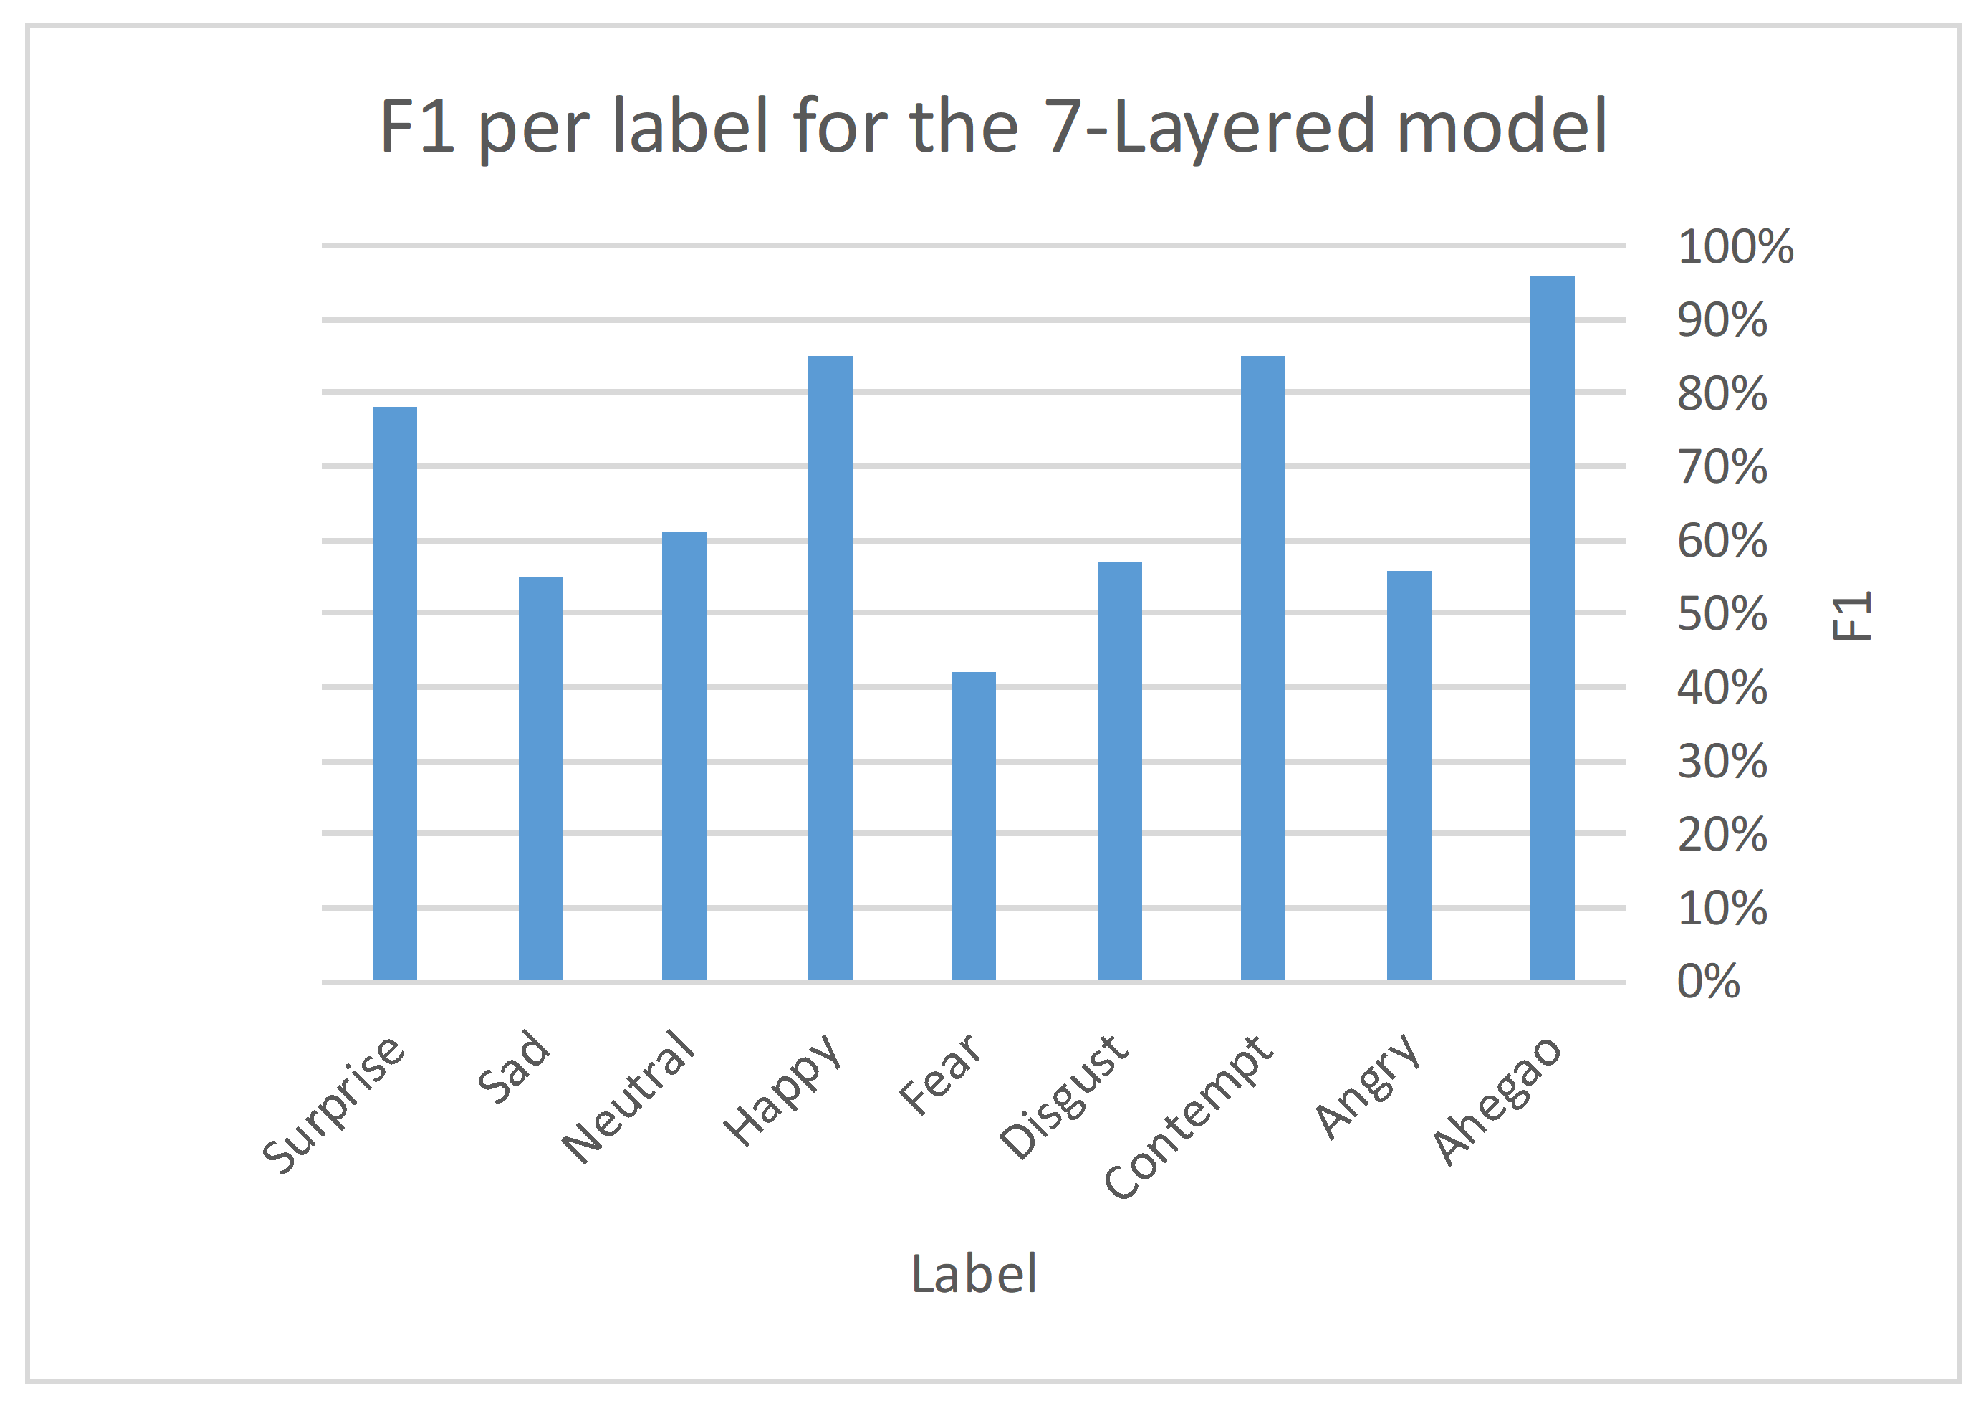
Application of the proposed system to a sample of online courses and in-class students resulted in an unexpected conclusion. In-class students mainly were positive and had interactive emotions such as happy, surprised, sad, and angry. Furthermore, the online students’ emotions were negative faces such as contempt, disgust, fear, and natural. It is worth mentioning that the ahegao emotion appeared a few times with only online course students and never appeared with in-class students. Furthermore, according to the grades achieved, it was expected that online course students would have lower total grades based on their emotions during the class. However, the system proved the opposite: online course students achieved higher grades than in-class students.
The benefit of applying the proposed system in real life relies on grouping students into two groups based on their class emotions: those who are more engaged with face-to-face education, and the others who can get better results by attending online courses. Moreover, according to the tested sample, 67% of the students who were not interested during face-to-face education, based on their emotions, will have better results if they attend the same course virtually.
The remaining of this paper is structured as follow: Section 2 reviews the related literature. The proposed system is introduced in Section 3. Section 4 includes the experimental results and discussions. Finally, the work is concluded and future work is mentioned in Section 6.

2. Literature Review

Teachers must comprehend student efficiency in a scientific atmosphere [30]. This problem does not occur in an offline setting since the teacher can see the pupils’ emotions and expressions. The concept described in this study assists teachers in adjusting their teaching approaches to match the interests, progress, and learning of their pupils [31,32].
The teacher is the most crucial element in the school, and his/her personality greatly influences student behavior, as no good educational situation can be achieved without teachers. Their values and behavior are personally affected by their characteristics and their style of dealing inside and outside the classroom [33].
A teacher who has desirable personal characteristics (based on student perception) is more able to bring about changes in their behavior and is more able to arouse their interest and direct them in the desired direction. The positive relationship between a teacher and the students allow them to learn how to lead and direct themselves [33]. Professors and teachers are the most important people affecting students, especially in the primary stages, which are considered the most important stages of study because the student acquires everything that comes to mind from information, whether negative or negative positive, at this stage.
Many types of research have been conducted since the sudden move to online education; many problems have been addressed in these research articles [34,35,36]. One of the important things that teachers should pay attention to is body language and facial expressions. Because the students focus on the teacher’s kinetic language accurately and can even verbally describe it, they constantly monitor his movements, so attention must be paid to students’ strength of observation to achieve the required communication. The effort is focused on the teacher, so he directs his physical movements, eyebrow expressions, tone of voice, the use of shoulders, and many other nonverbal movements [37].
Many previous researchers have worked on the present technique for developing emotion recognition hardware on image/pattern recognition systems [38,39]. Further, an important point that must be focused on, according to experts, is that communication with body language must be reciprocal. Students express themselves through their movements more than through speaking, and they sometimes may not dare to speak, but they express themselves through their behavior more, and the teacher must understand these movements and nonverbal signals to help with student engagement. Figure 1 illustrates a sample of teachers’ emotions in the classroom.
Many earlier studies have focused on emotion analysis (EA) for various purposes. The developers of [40] have given an emotion care scheme and web-based platform to recognize people’s emotional status during the continuing COVID-19 issue. They looked at eight emotions in various situations (i.e., anger, anticipation, disgust, fear, joy, sadness, surprise, and trust).
In [41], a convolutional neural network 2D (CNN-2D) input is a spectrogram built from speech sounds. Convolution layers, pooling layers, and fully connected layers are the three CNN layers that extract particular properties from spectrogram representations. When this model is used, the accuracy improves by 6.5 percent.
In [42], the authors’ proposed paradigm has much promise for use in mental health care. It could identify, monitor, and diagnose a patient’s mental health in a low-cost, user-friendly way. Their suggested approach employed the CK+ and FER2013 datasets to get information from AlexNet’s Fully Connected Layer 6.
In [43], a group of scientists created a system that employs sensors to log and disseminate real-time mood data. The platform is intended to make it simple to prototype new computer interfaces that can detect, respond to, and adapt to human emotion. They expect it will contribute to the advancement of effective computing technology.
In [44], after being trained on a large dataset consisting of animations of the characters Tom and Jerry with a size of 8K by downloading videos from a popular YouTube channel, the proposed integrated deep neural network (DNN) correctly identifies the character, segments their face masks, and recognizes the resulting emotions. With 96 percent accuracy and an F1 score of 0.85, VGG 16 exceeded the competition. The study’s primary goal was to integrate DNN and validate it on vast data to better comprehend and analyze emotions. The suggested integrated DNN includes Mask R-CNN for cartoon figure detection, and well-known learning architectures/models such as VGG16, InceptionV3, ResNet-50, and MobileNetV2.
In [45], a sophisticated Lie-Sensor is developed for detecting fraud or malicious intent and authorizing its validation. Face emotions are labeled as ’Happiness,’ ’Sadness,’ ’Surprise,’ and ’Hate’ in a suggested live emotional intelligence detector. It also uses text classification to forecast a message’s label separately. Finally, it compares the two labels and determines whether the message is genuine. The authors of [46] present a method for recognizing facial expressions in photographs of people of various ages, genders, and nationalities. “Emotion sketches”, simplified depictions of facial expressions, are proposed. The study explains how to get emotion sketches and confirms the method by using them to train and test neural networks. Emotion sketches were used to train three neural networks of different types in order to classify facial expressions as ’Positive’, ’Negative’, ’Awe’ and ’Neutral’. The prediction results were encouraging, with over 70% accuracy given by each network on a query dataset.
In [47], for facial sentiment analysis, the researchers suggest a real-time streaming image-based PingPong (PP2) method, line-segment feature analysis (LFA), and convolutional recurrent neural network (CRNN) model. The accuracy of face recognition using the suggested method is compared to the loss rate for other models in a performance evaluation. This study was carried out to address security issues that may arise with driver convenience services that use video in smart automobiles. We built an encoding–decrypting procedure on videos to improve the security of real-time stream videos. Using two variable clock functions and memory, the PP2 algorithm generated random numbers. PP2LFA-CRNN models were compared to AlexNet and CRNN models. The learning rate was 96.8% in the experiment using the test dataset, which was higher than expected.
In [48], the PP2LFA-CRNN model was compared to AlexNet and CRNN models in terms of performance. The test dataset experiment’s learning rate was 96.8%, which was more excellent than previous techniques (CRNN: 94.2 percent and AlexNet: 91.3 percent). The experiment revealed that a person’s visual attention matches their purchasing and consumption habits. More consumer cognition research will help researchers better understand human behavior for various applications, including marketing, health care, personal qualities, wellness, and many more. In [49], the authors suggested using RIEA (relationship identification using emotion analysis) to find relationships between intelligent agents. Their study extracted emotions and mapped them onto a set of human interactions using cognitive psychology and natural language processing theories.
In [50], the authors offered a current assessment of computational analytic tools for assessing emotional facial expression in Parkinson’s disease patients (PWP). An NVIDIA GeForce 920M GPU was used to develop a deep-learning-based model. Techniques for computational facial expression analysis in Parkinson’s disease have many applications. Many of the proposed approaches to improving clinical assessment contain flaws. Hypomimia is a biomarker for Parkinson’s disease that we believe is significant. In [51], a new software application designed as a serious game to teach children with autism how to understand and express their emotions was released. Children naturally grab objects and engage with the system with their faces. The system was assessed based on its relevance for children with autism spectrum disorder (ASD). ASD is a neurodevelopmental disease that affects a person’s social skills, particularly those related to emotional awareness and recognition. These skills can be learned, especially early in life. The researchers designed a game with no distracting elements so that children’s attention is focused on learning to understand emotions.
The research in [52] investigated the effects of the proportion of non-competitive people and the length of emotional and cognitive time on the evolution of cooperation. Emotion comes through people’s relationships, and studies have shown that emotion greatly impacts people’s decision-making. Among non-competitive individuals, the fraction of cooperators increases with the minimum, whereas in competitive individuals, the proportion of cooperators peaks at M = 5. Individual emotions being introduced into strategy evolution is congruent with real-world phenomena. Our findings will help researchers better understand how strategies and emotions co-evolve. In [53], electroencephalogram (EEG) signals were used to detect a patient’s mental state. EEG-based e-healthcare systems can be deployed and used in various smart contexts. They can assist disabled people in moving or controlling various devices, computers, and artificial limbs. Participants looked at images on a 15-inch display from a distance of roughly 70 cm. The display had gaze sensors mounted, and participants wore a head cap to measure functional near-infrared spectroscopy (fNIRS) signals. The proposed approach was compared via two different types of comparison methodologies.
In [54], A team of researchers at the University of British Columbia (UBC) in Canada developed a machine-learning model that achieves state-of-the-art single-network accuracy on FER2013 without using extra training data. They adopted the VGGNet architecture, rigorously fine-tuned its hyperparameters, and experimented with various optimization methods. Without additional training data, researchers at the University of Bristol achieved the highest single-network accuracy on FER2013. They used the VGG network to build a series of experiments to test various optimization algorithms and learning rate schedulers for better prediction accuracy. This paper achieved single-network state-of-the-art classification accuracy on FER2013 using a VGGNet. They also conducted extra tuning of their model using cosine annealing and combined the training and validation datasets to improve the classification accuracy further.
In [55], the authors presented emotion analysis (EA), which determines whether or not a text has any emotion. EA has grown in popularity recently, particularly for social media applications such as tweets and Facebook posts. The authors considered several instances of public posts and focused on several emotions in a single post. In [56], the authors presented a headline emotion classification. The content words were extracted to form different word pairs with joy, disgust, fear, anger, sadness, and surprise emotions. In [57], Vasileios Hatzivassiloglou and Kathleen R. McKeown found and validated limitations from conjunctions on the positive or negative semantic orientation of conjoined adjectives from a large corpus. A log-linear regression model uses these constraints to predict if conjoined adjectives are similar.
In [58], the authors distinguished six basic emotions using supervised machine learning. The support vector machine (SVM) classifier outperformed all other classifiers. On previously unseen examples, it generalized well. In [59], the authors proposed a system that automatically recognizes facial expressions from an image and classifies emotions. The system uses a simplified ’Viola Jones Face Detection’ method for face localization. The different feature vectors are combined to improve recognition and classification performance. In [60], the authors explored a couple of machine learning algorithms and feature-extraction techniques to help accurately identify human emotion. In [61], the authors reviewed the recent literature on speech emotion recognition. Thirty-two representative speech databases were reviewed from the point of view of their language, number of speakers, and emotions. The importance of choosing different classification models has been discussed.
EA has also been employed in the educational field; student and/or teacher emotions could be detected using smart systems. Many researchers have studied the effects of people’s emotions on others. In [62], the authors tried to analyze online learning behaviors based on image emotion recognition. Key frames were extracted from human faces using an improved local binary pattern (LBP) and wavelet transform. The authors designed the structure for an online learning behavior analysis system. They also proposed a strategy for learning to recognize emotions through facial expressions. They extracted significant frames from facial expression photographs using an upgraded LBP and wavelet transform. The mean expression feature was then solved using many extracted key frames. Data and histograms show that the suggested technique can improve the effectiveness of image emotion recognition in experiments.
The authors of [63] established the SELCSI (Student Emotional Learning in Cultural Safety Instrument). The preliminary validity and reliability of students’ emotional learning scales were discovered. This tool could help researchers better understand how nursing and midwifery students learn to practice in a culturally acceptable manner. The tool’s use has significant theoretical, educational, and methodological implications. The SELCSI is a tool to assist students to understand how health students learn to engage with First Peoples and communities in a culturally appropriate manner. For nursing and midwifery education, the instrument’s use has substantial theoretical, pedagogical, and methodological implications. In [64], the researchers’ goal was to look at the impact of mindfulness techniques on stress perception and psychological well-being. The study included 45 graduate students split into two groups: intervention and control. Analysis of variance (ANOVA) for repeated measures was used to evaluate quantitative data, while thematic content analysis was used to analyze the interviews. The interviews revealed the presence of mixed feelings about graduate school and the development of new coping methods to deal with this work environment. In both groups, the results showed an increase in mindfulness and psychological well-being, as well as a decrease in perceived stress.
The research in [65] presents an EEG-based emotion detection method for detecting a patient’s emotional state. The overall categorization accuracy was found to be 83.87 percent. Four electrodes are used to test a new technique based on the EEG database “DEAP”. When compared to existing algorithms, it performs well. It uses electroencephalogram (EEG) signals to detect a patient’s mental state. EEG-based e-healthcare systems can be used in a variety of smart settings. They can assist disabled people with operating or controlling various devices, computers, and prosthetic limbs. In [66], the authors presented a system to detect the engagement level of the students. The system correctly identified when students were “very engaged”, “nominally engaged”, and “not engaged at all”. The students with the best scores also had higher concentration indexes and were more attentive to details of their work.
Concluding the literature review, artificial intelligence (AI) and recent deep learning techniques could be applied to many areas that facilitate human lives [67,68]. Furthermore, it could be applied in medical applications [69,70], recommender systems [71], job-seeking [72], smart cities and localization [73], hospitals [74,75], object tracking [76,77,78], software engineering [79,80], E-commerce [81], emotional analysis [82], agriculture applications [83,84], and many others [85].

3. Methodology

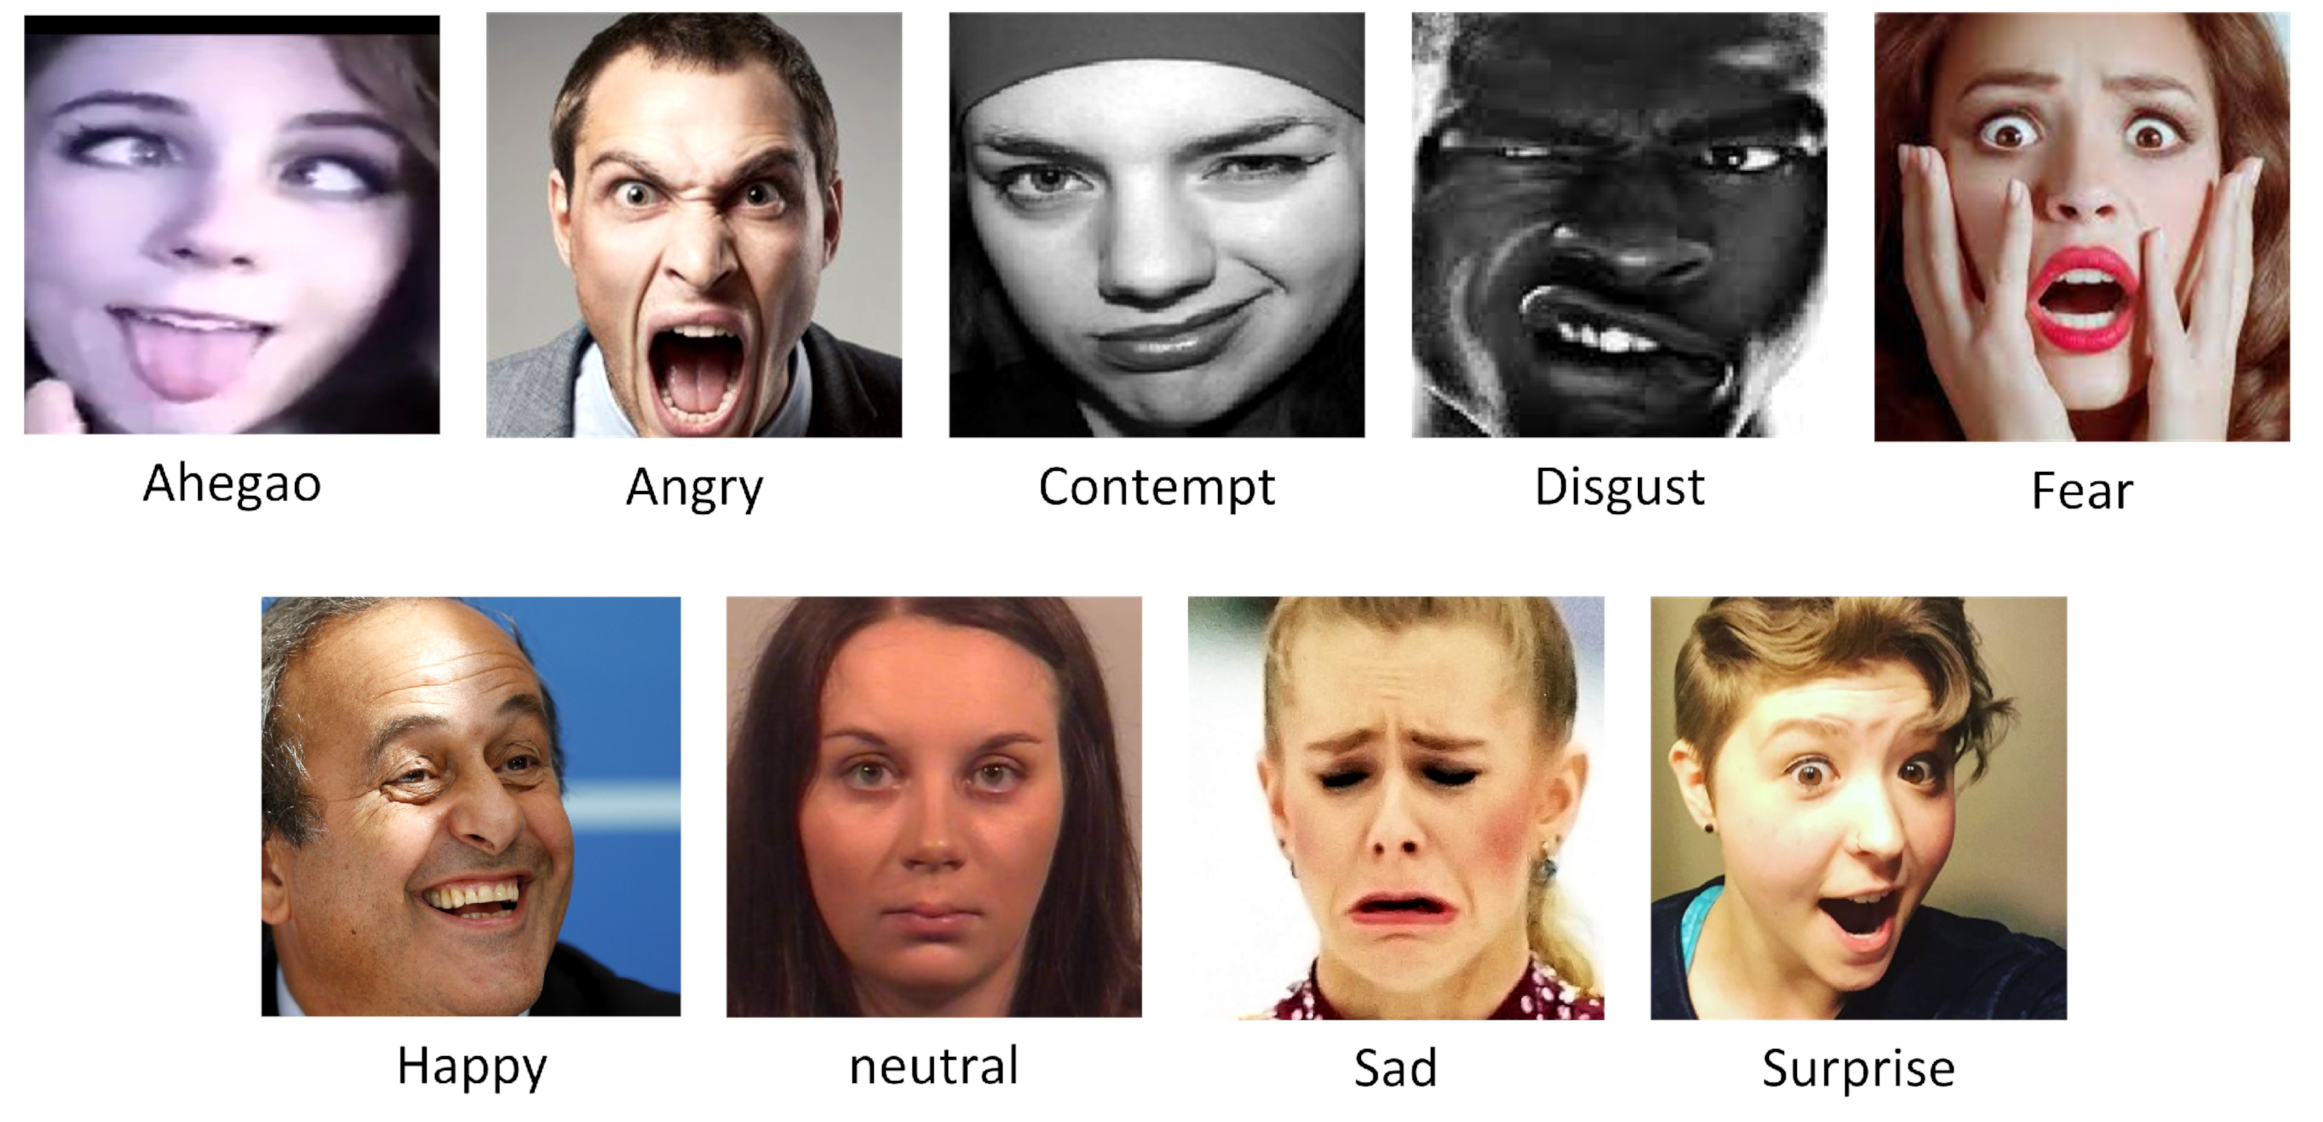
Face Reader is the most reliable automated method for recognizing a variety of specific qualities in facial photographs, including the nine basic or universal expressions of happiness, sadness, anger, surprise, neutrality, disdain, Ahegao, fear, and disgust. According to Paul Ekman, these emotional categories are basic or universal emotions. Face Reader can also detect a ’neutral’ condition and evaluate ’contempt.’ Action units, valence, arousal, gaze direction, head orientation, and personal factors such as gender and age are also calculated.
Online students exhibit varied levels of involvement while participating in these instructional activities, including boredom, annoyance, delight, neutral, bewilderment, and learning gain. Online educators must accurately and efficiently assess online learners’ engagement status to give individualized pedagogical support. Automatic categorization methods extract features from various traits such as eye movement, facial expressions, gestures, and postures or physiological and neurological sensors. These methods do not interfere with learners’ engagement detection in their learning environments, enabling them to be grouped into different subject areas.
The amount of arousal or alertness is commonly associated with participation in the neuroscience literature. The detected emotion of either student or the teacher are the indicators used to assess engagement and attentiveness. These methods require using computer-vision-based approaches that are not practical in real-world educational settings.
Computer-vision-based approaches can assess whether a learner is engaged in an activity. The assessment procedure is unobtrusive and simple to use, comparable to how a teacher monitors whether a pupil is motivated without disrupting his or her activity in the classroom.

3.1. Proposed System

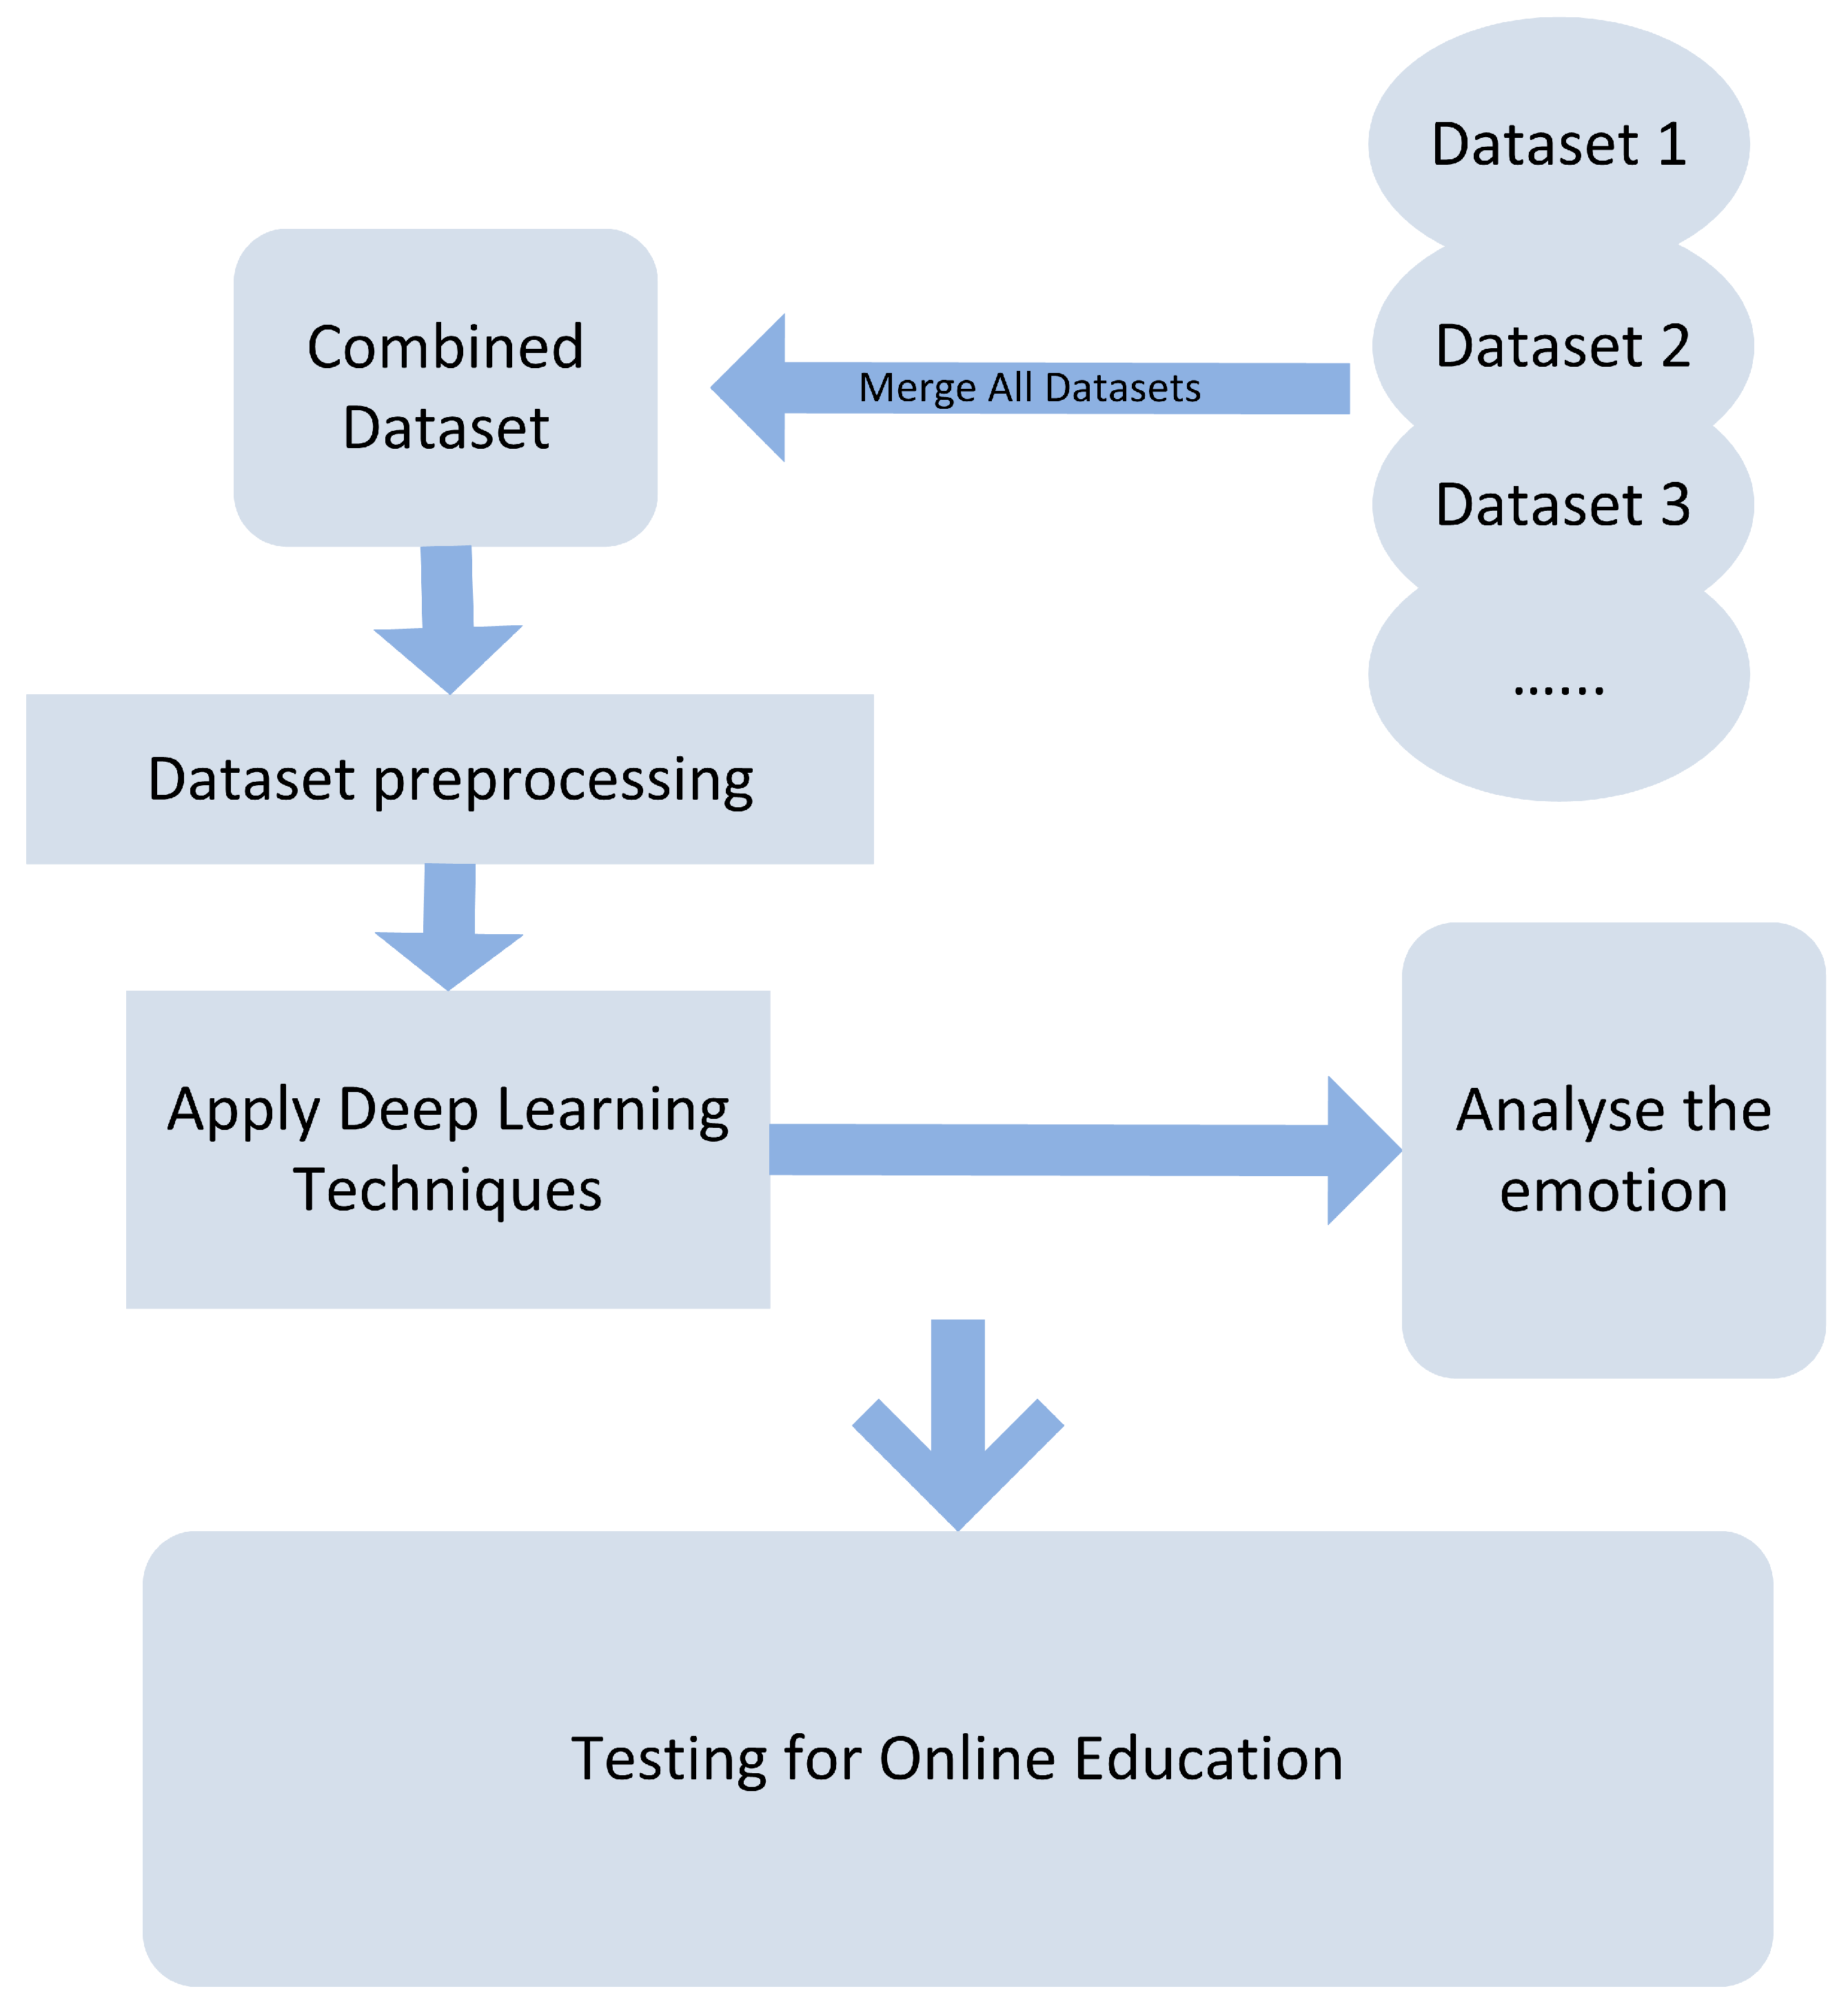
Several datasets have been used in the proposed system; some are collected from the web, and others have been previously implemented by other researchers (more information about the dataset will be explained in detail in the next section). The proposed system employs deep learning techniques to test the emotions in the dataset after applying preprocessing stages to reduce the features and remove noise. Figure 2 illustrates the proposed system implemented to analyze teacher and student emotions.

3.2. Dataset

Many available datasets can be used for EA, and some of them are employed in this research. The following describes the well-known datasets in the field.
Among the most comprehensive databases for face affect in still images, AffectNet includes category and dimensional models; 1250 emotion-related tags in English, German, Spanish, Portuguese, Arabic, and Farsi were used to collect the data.
The CK+ (Extended Cohn–Kanade Dataset) is a publicly available benchmark dataset for action unit and emotion recognition. There are 5876 images in the collection from 123 persons, with expression sequences ranging from neutral to peak. The images in the CK+ collection all share the same backdrop, are mostly grayscale, and are 640 × 490 pixels in size.
A training set of 28,000 labeled photos, a development set of 3500 annotated images, and a test set of 3500 images comprise the Fer-2013 (Facial Expression Recognition 2013) dataset. The dataset was created by combining the results of each emotion’s Google image search with synonyms for the emotions. Each image in FER-2013 is tagged with one of seven emotions: happy, sad, furious, afraid, surprise, disgust, and neutral, with happiness being the most common, resulting in a 24.4 percent baseline for random guessing.
EMOTIC (Emotion Recognition in Context) is a database of photographs of people in real-life scenarios labeled with their apparent emotions. The EMOTIC dataset includes two types of emotion representation: discrete categories (a set of 26) and continuous dimensions (24) (e.g., valence, arousal, and dominance). There are 23,571 images and 34,320 people tagged in the collection. In reality, some images were hand-picked from Google’s search engine.
The Google Facial Expression Comparison dataset is a popular emotion dataset with many people using it. There are labeled triplet images in the collection. The top six raters assign each triplet a label. The dataset aids in establishing which of the two faces has similar feelings in each scenario. The data are mainly used to summarize albums, determine emotions, and other similar tasks.
Ascertain is a multi-modal database for implicit personality and affects recognition that may be used to track physiological responses to assess personality traits and emotional states. The data contain 58 individuals’ Big Five personality scores and emotional self-ratings, synchronously recorded EEG, ECG, galvanic skin response (GSR), and facial activity data acquired while watching affective movie clips with off-the-shelf sensors.
Dreamer is a multi-modal database that contains electroencephalogram (EEG) and electrocardiogram (ECG) information collected during affect elicitation with audio–visual stimuli. Signals from 23 people were captured in this dataset, together with the subjects’ self-assessment of their affective state regarding valence, arousal, and dominance following each stimulus.
K-EmoCon is a multi-modal dataset compiled from 32 persons who participated in 16 paired social discussions. The data were gathered using three off-the-shelf wearable sensors, audio–visual video of debate participants, and continual emotional annotations.
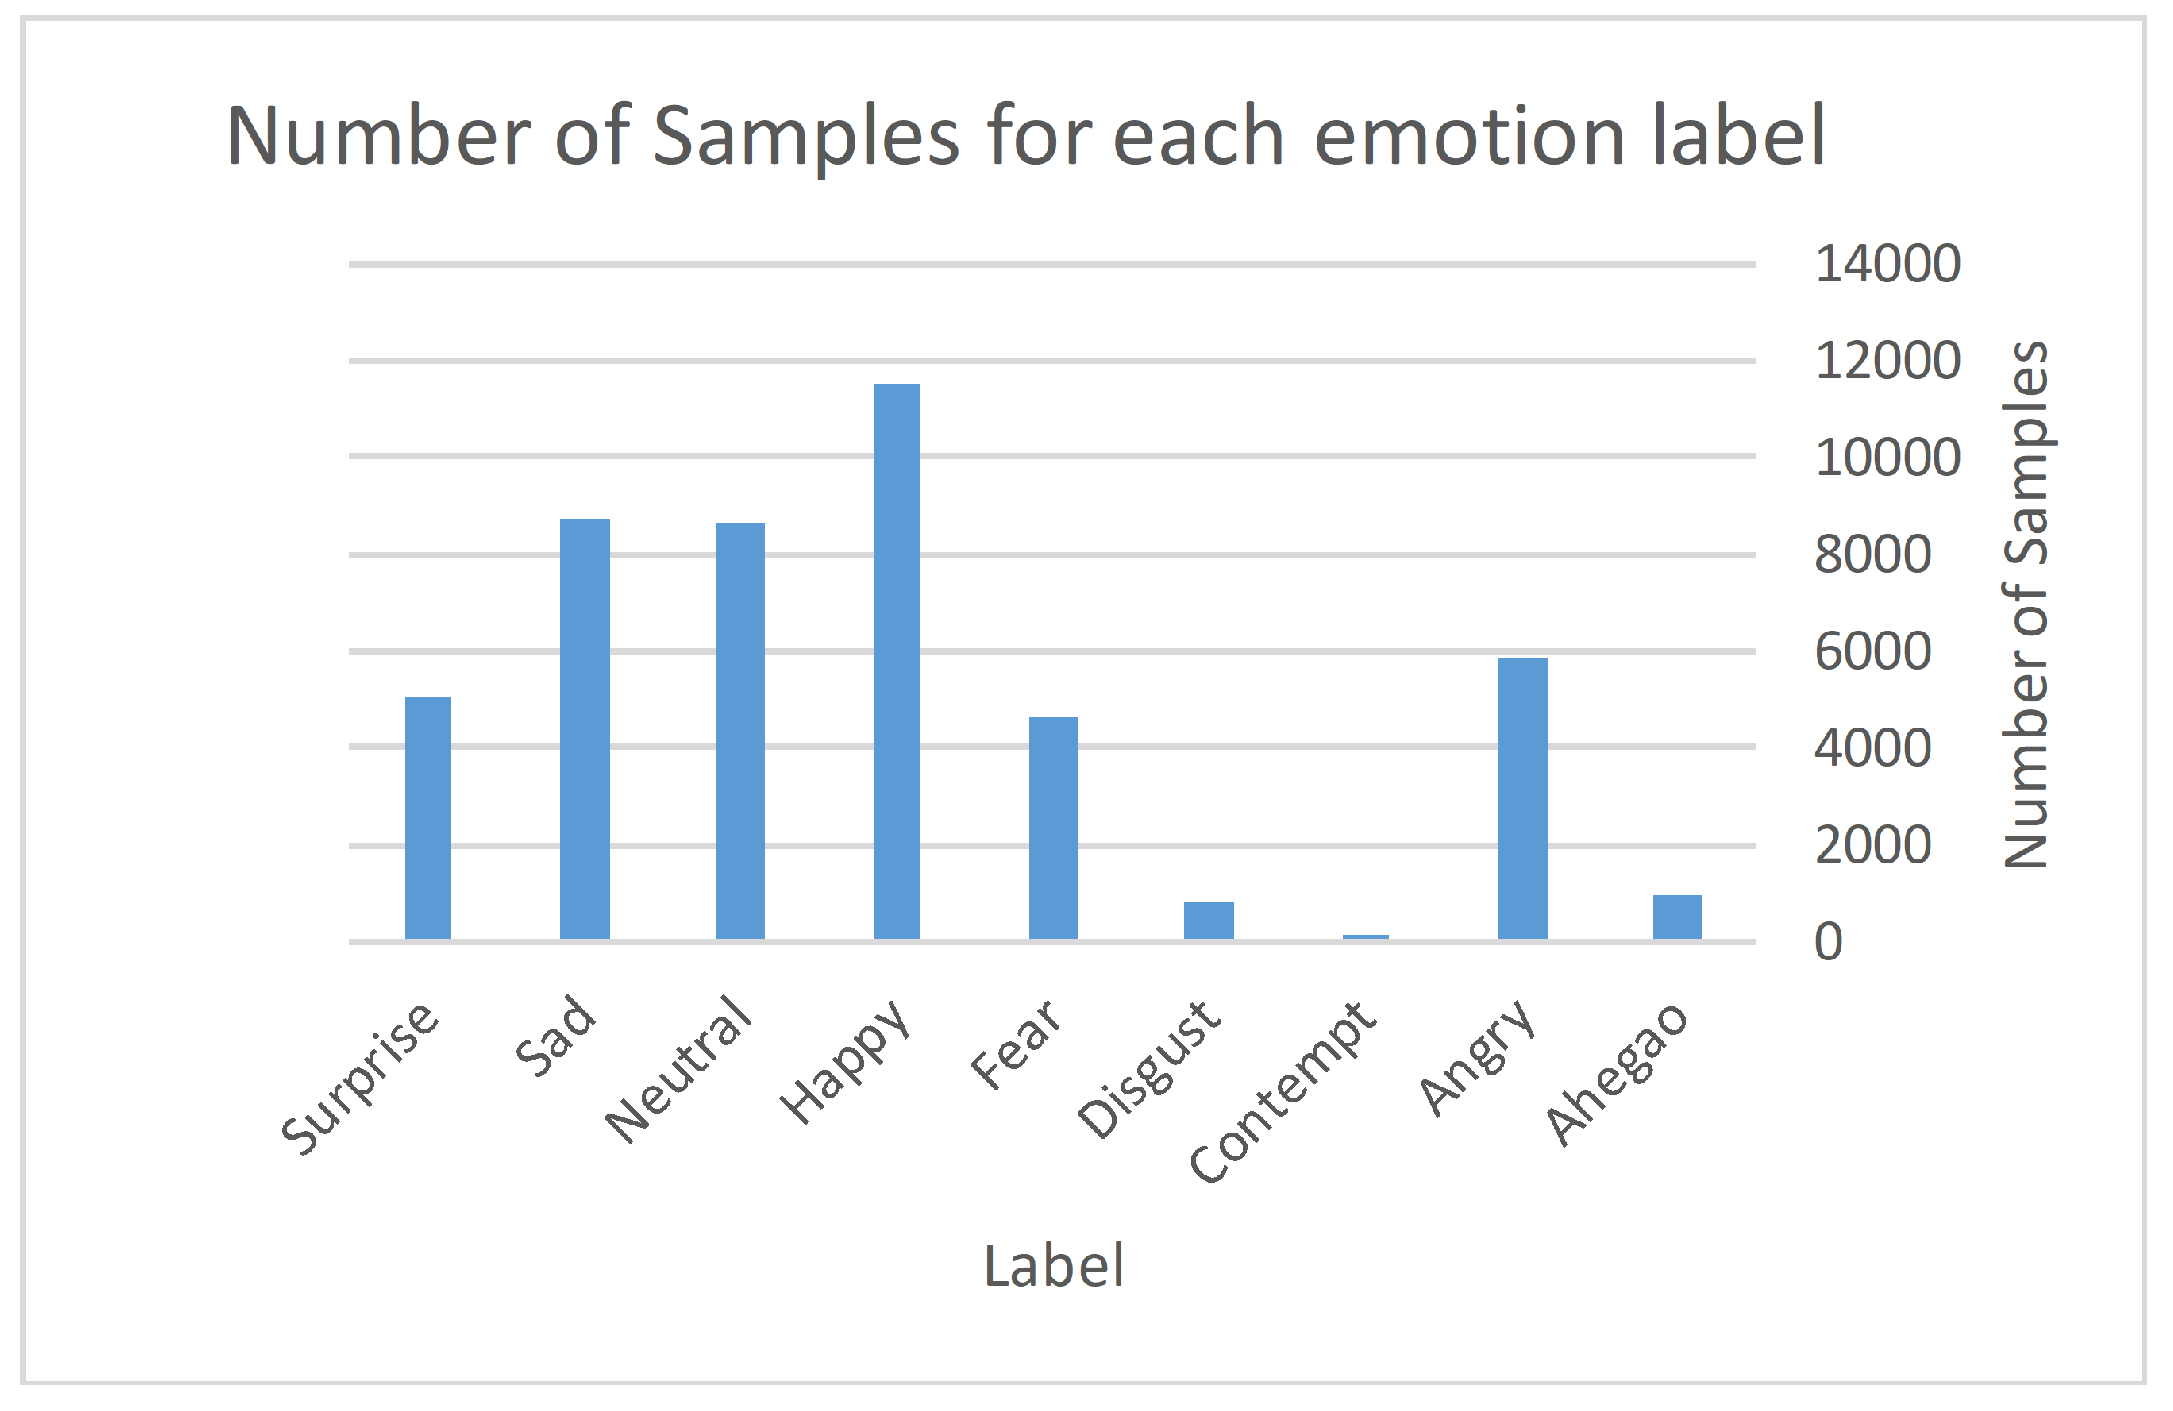
In this paper, we collected data by downloading it from the Kaggle website, where we obtained a dataset for analyzing emotions of images with different names such as fer-2013, CK+48, jaffedbase, OAHEGA EMOTION RECOGNITION DATASET, and Natural Human Face Images for Emotion Recognition, as described in detail in Table 1. We consolidated the examples from the various datasets into a separate file for each emotion: ahegao, anger, contempt, happiness, fear, disgust, neutrality, surprise, and sad.
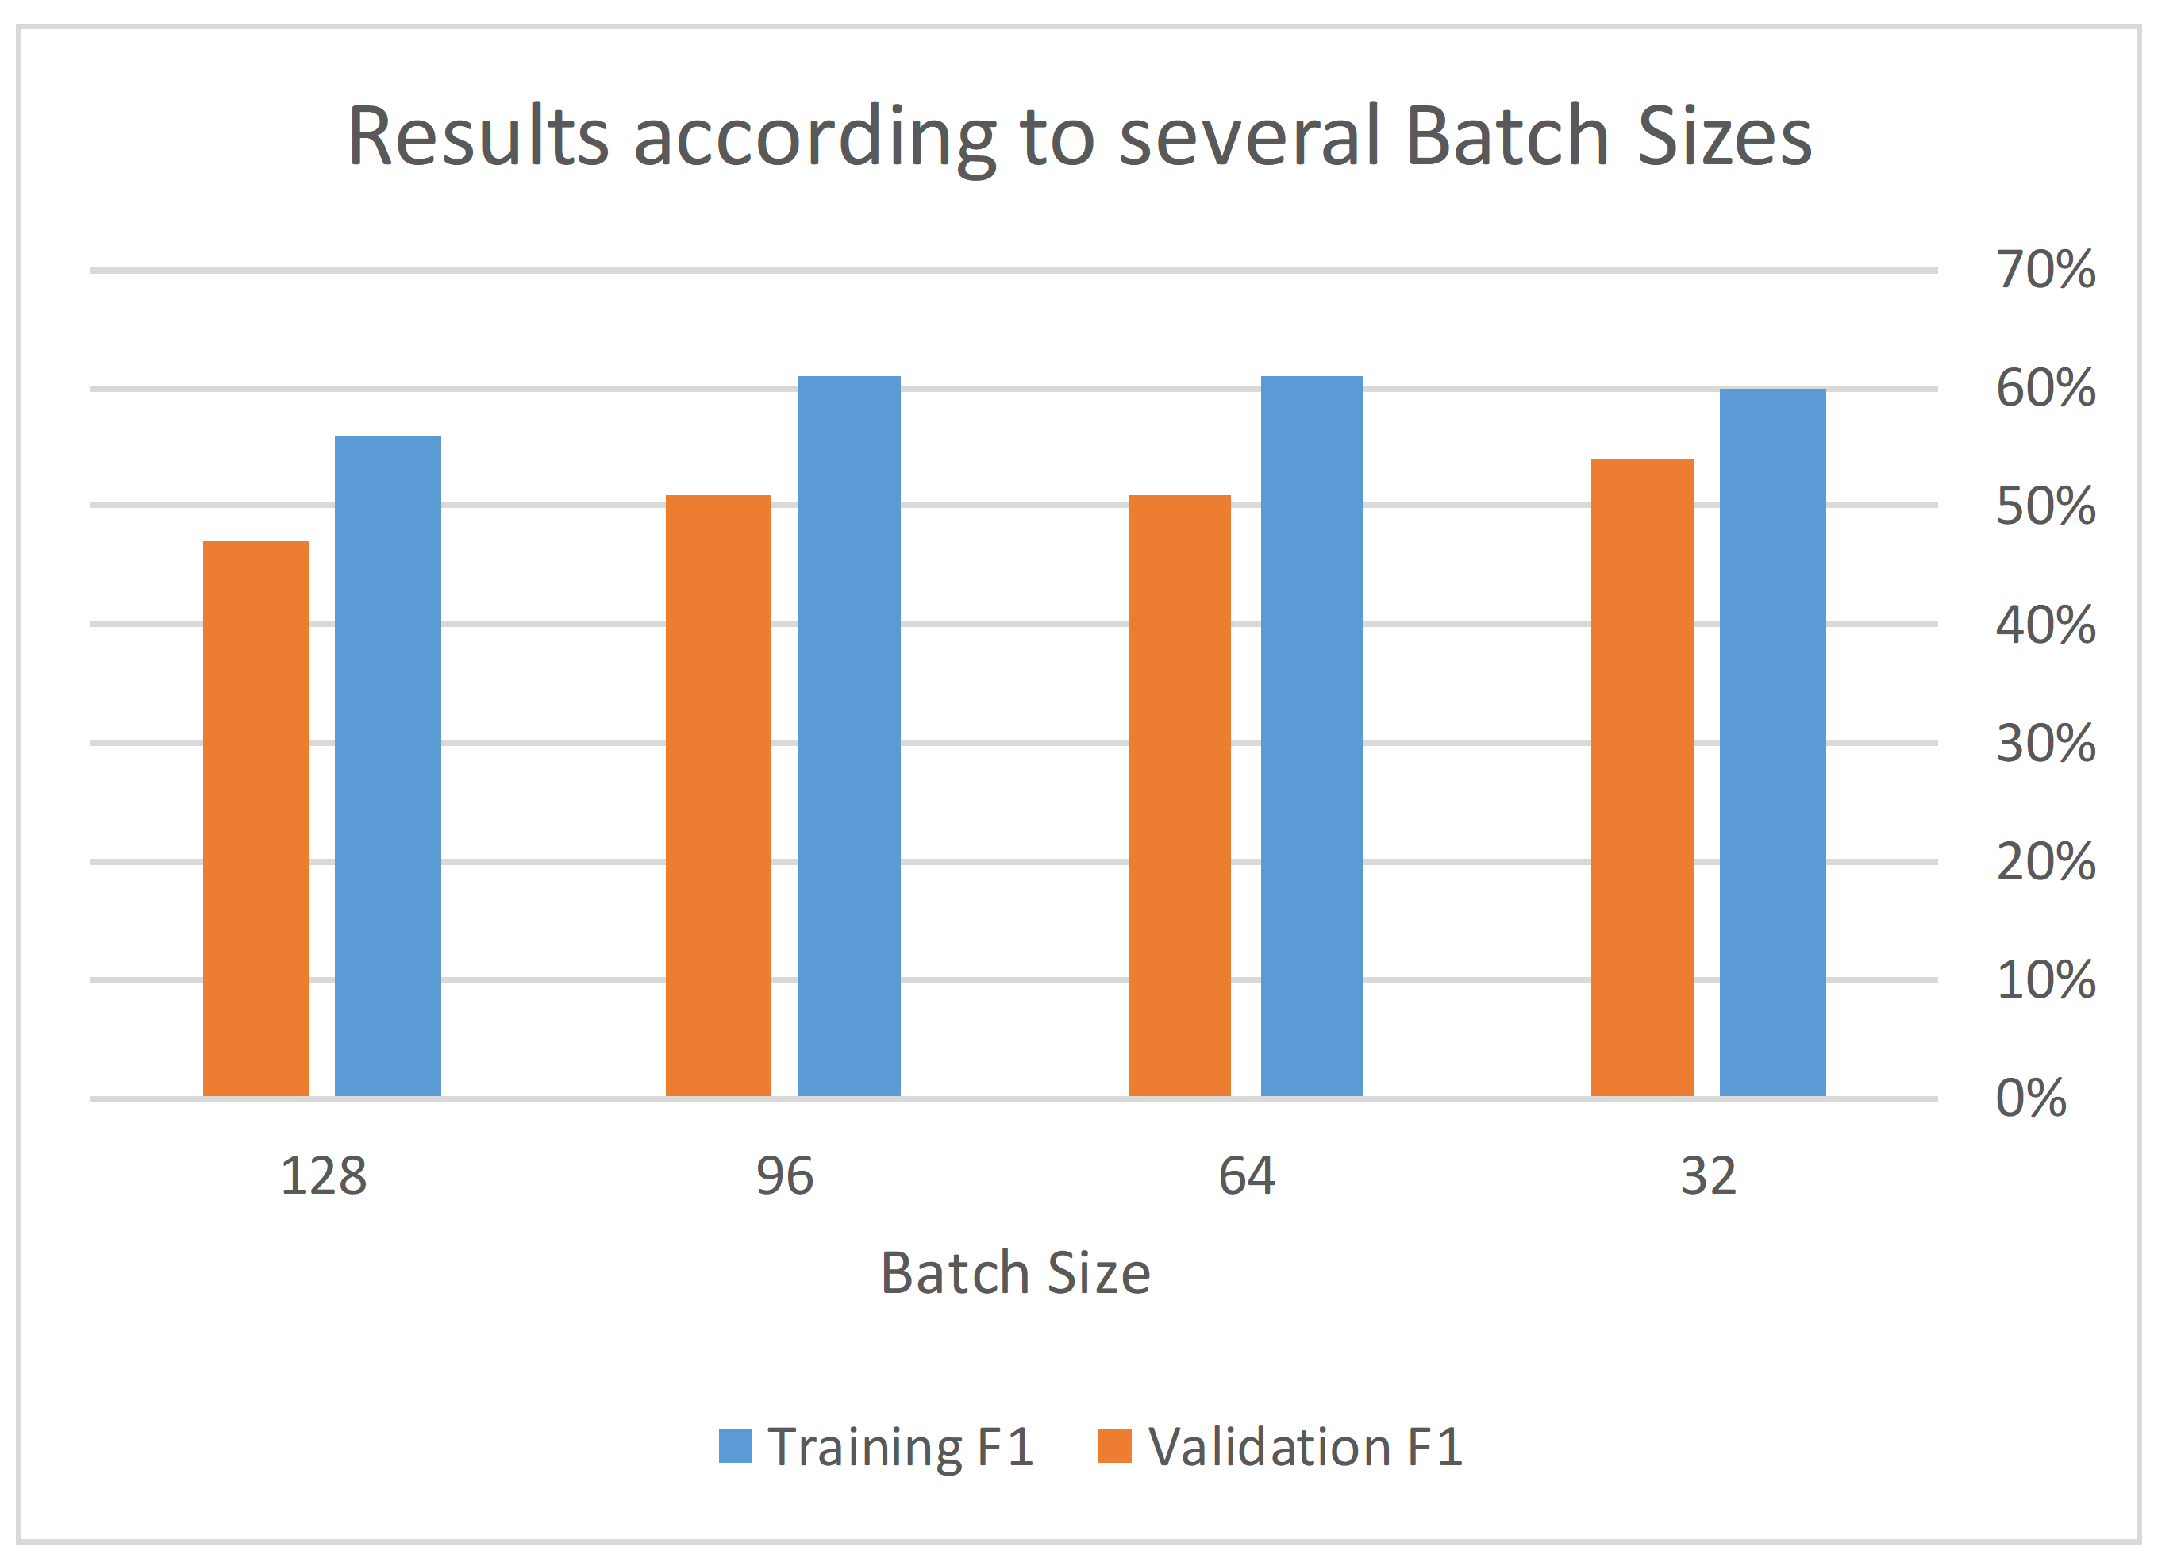
Then, we divided each separate file into two groups: 80% training and 20% testing. We used cross validation to optimize the training and testing percentages, as illustrated in Table 1:
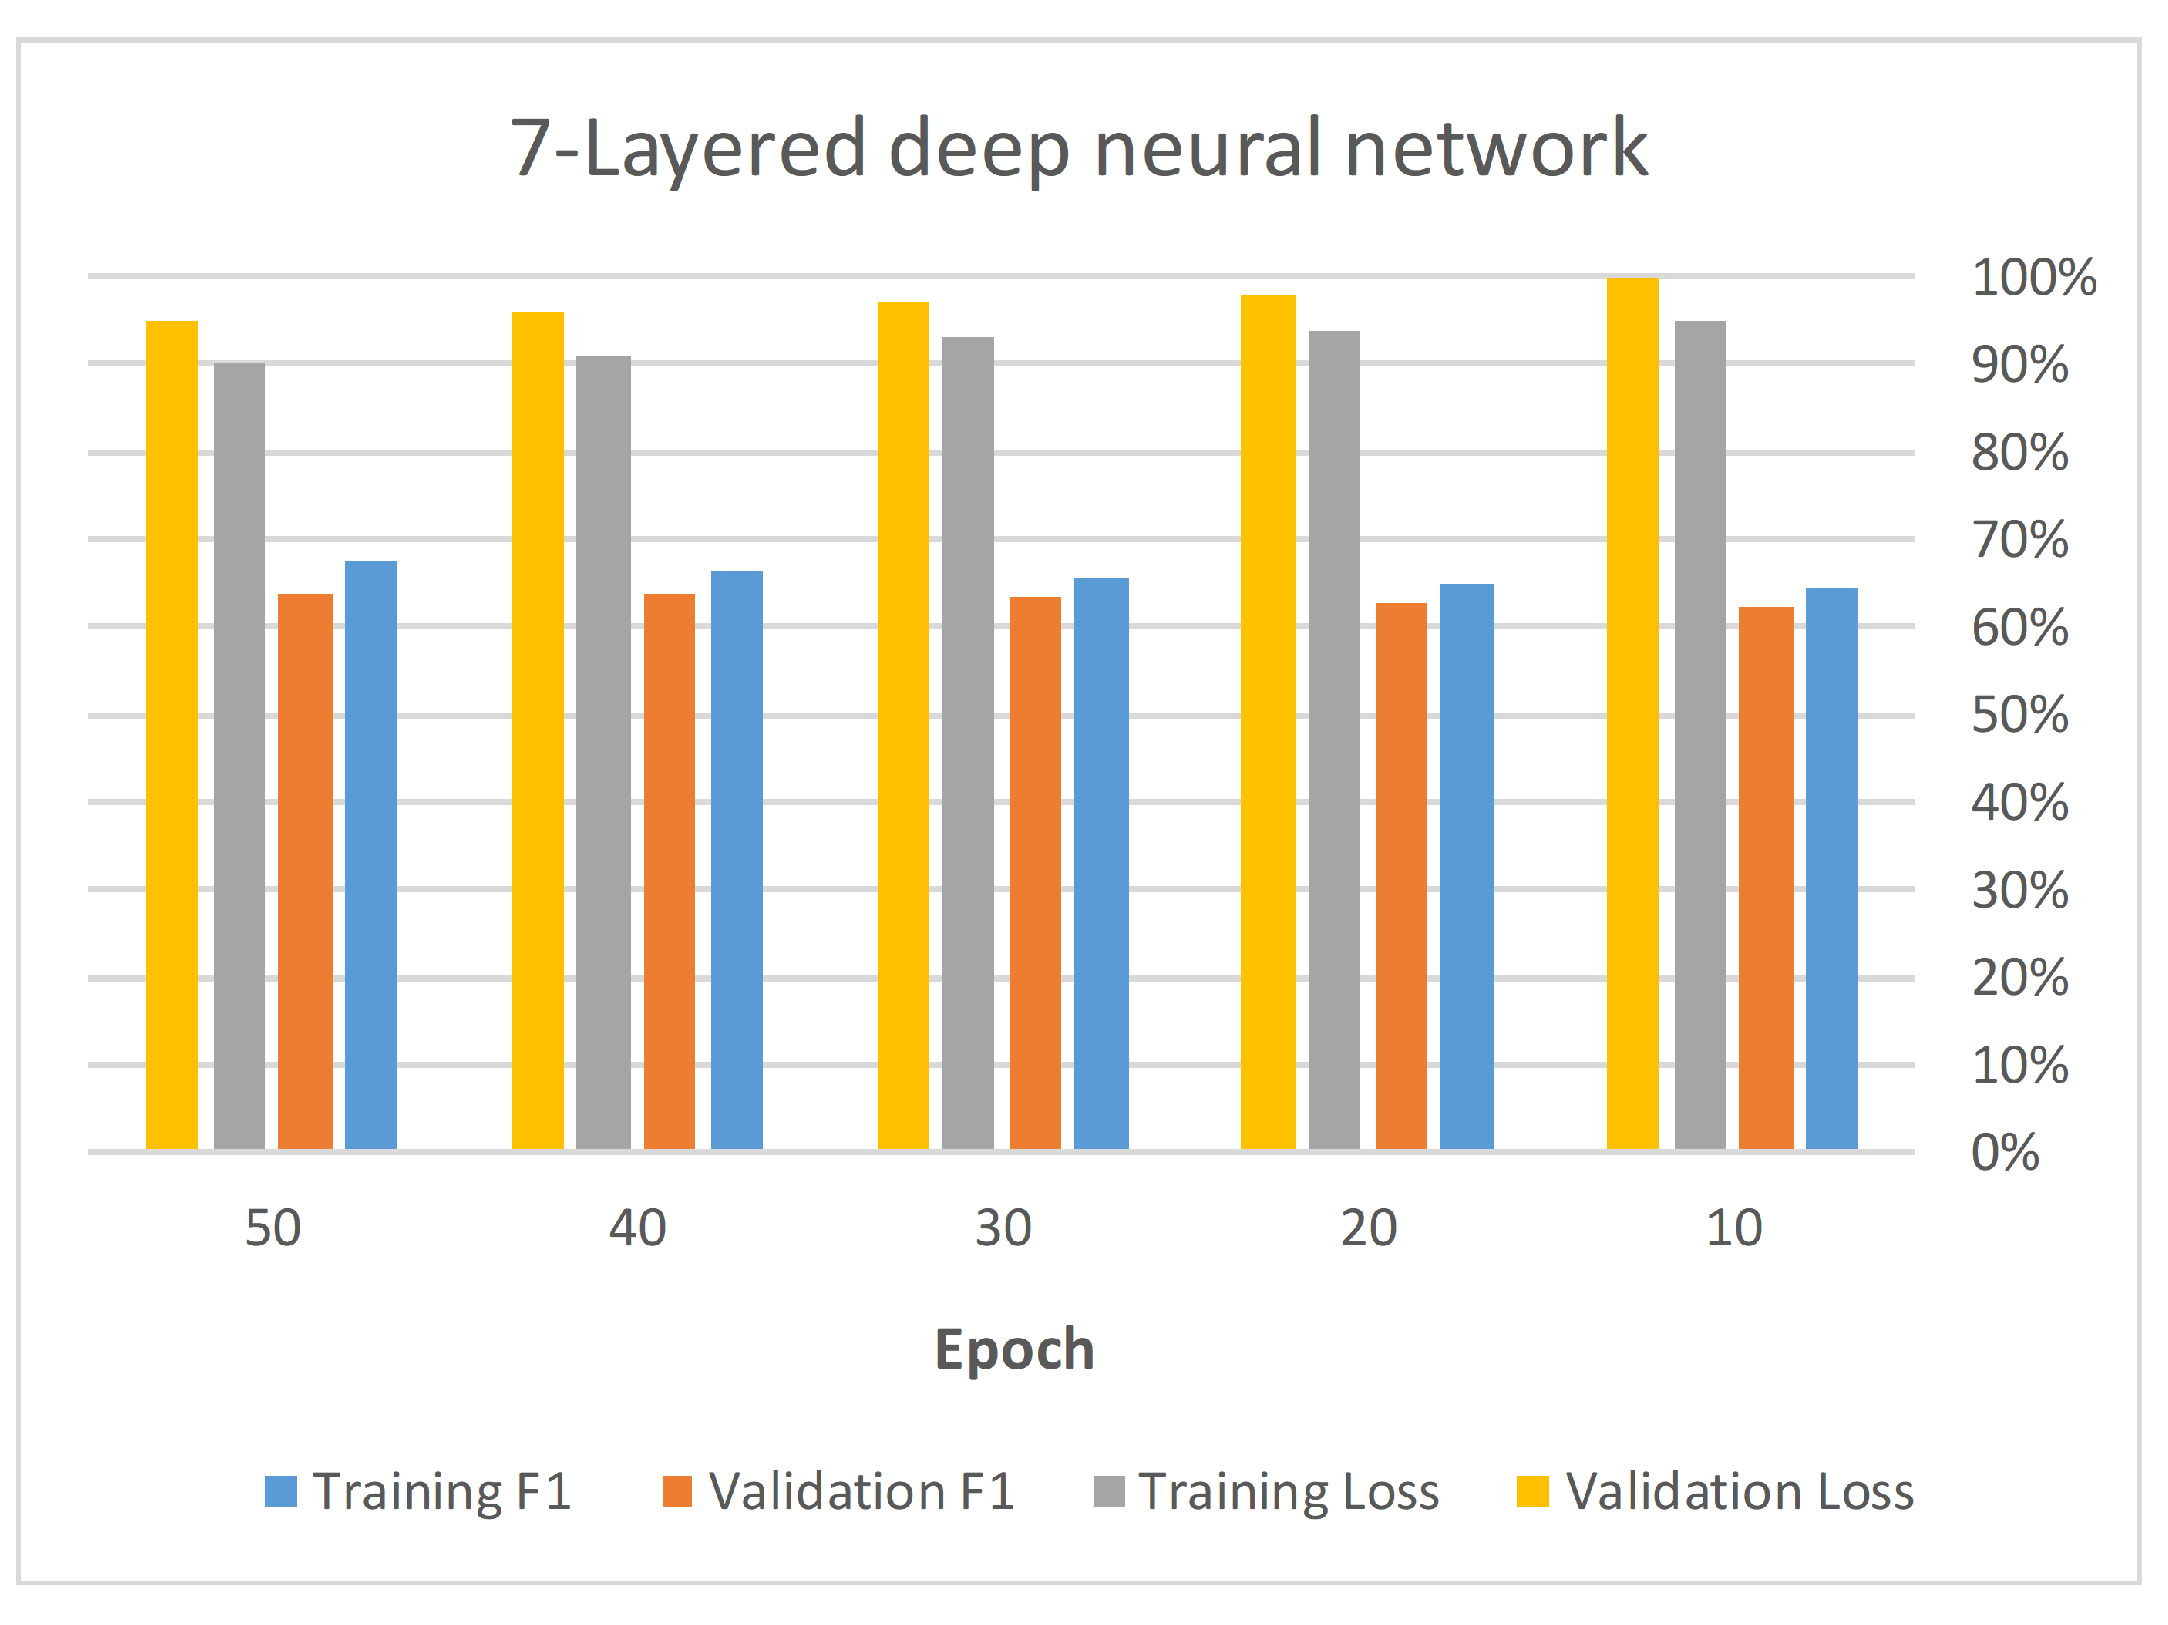
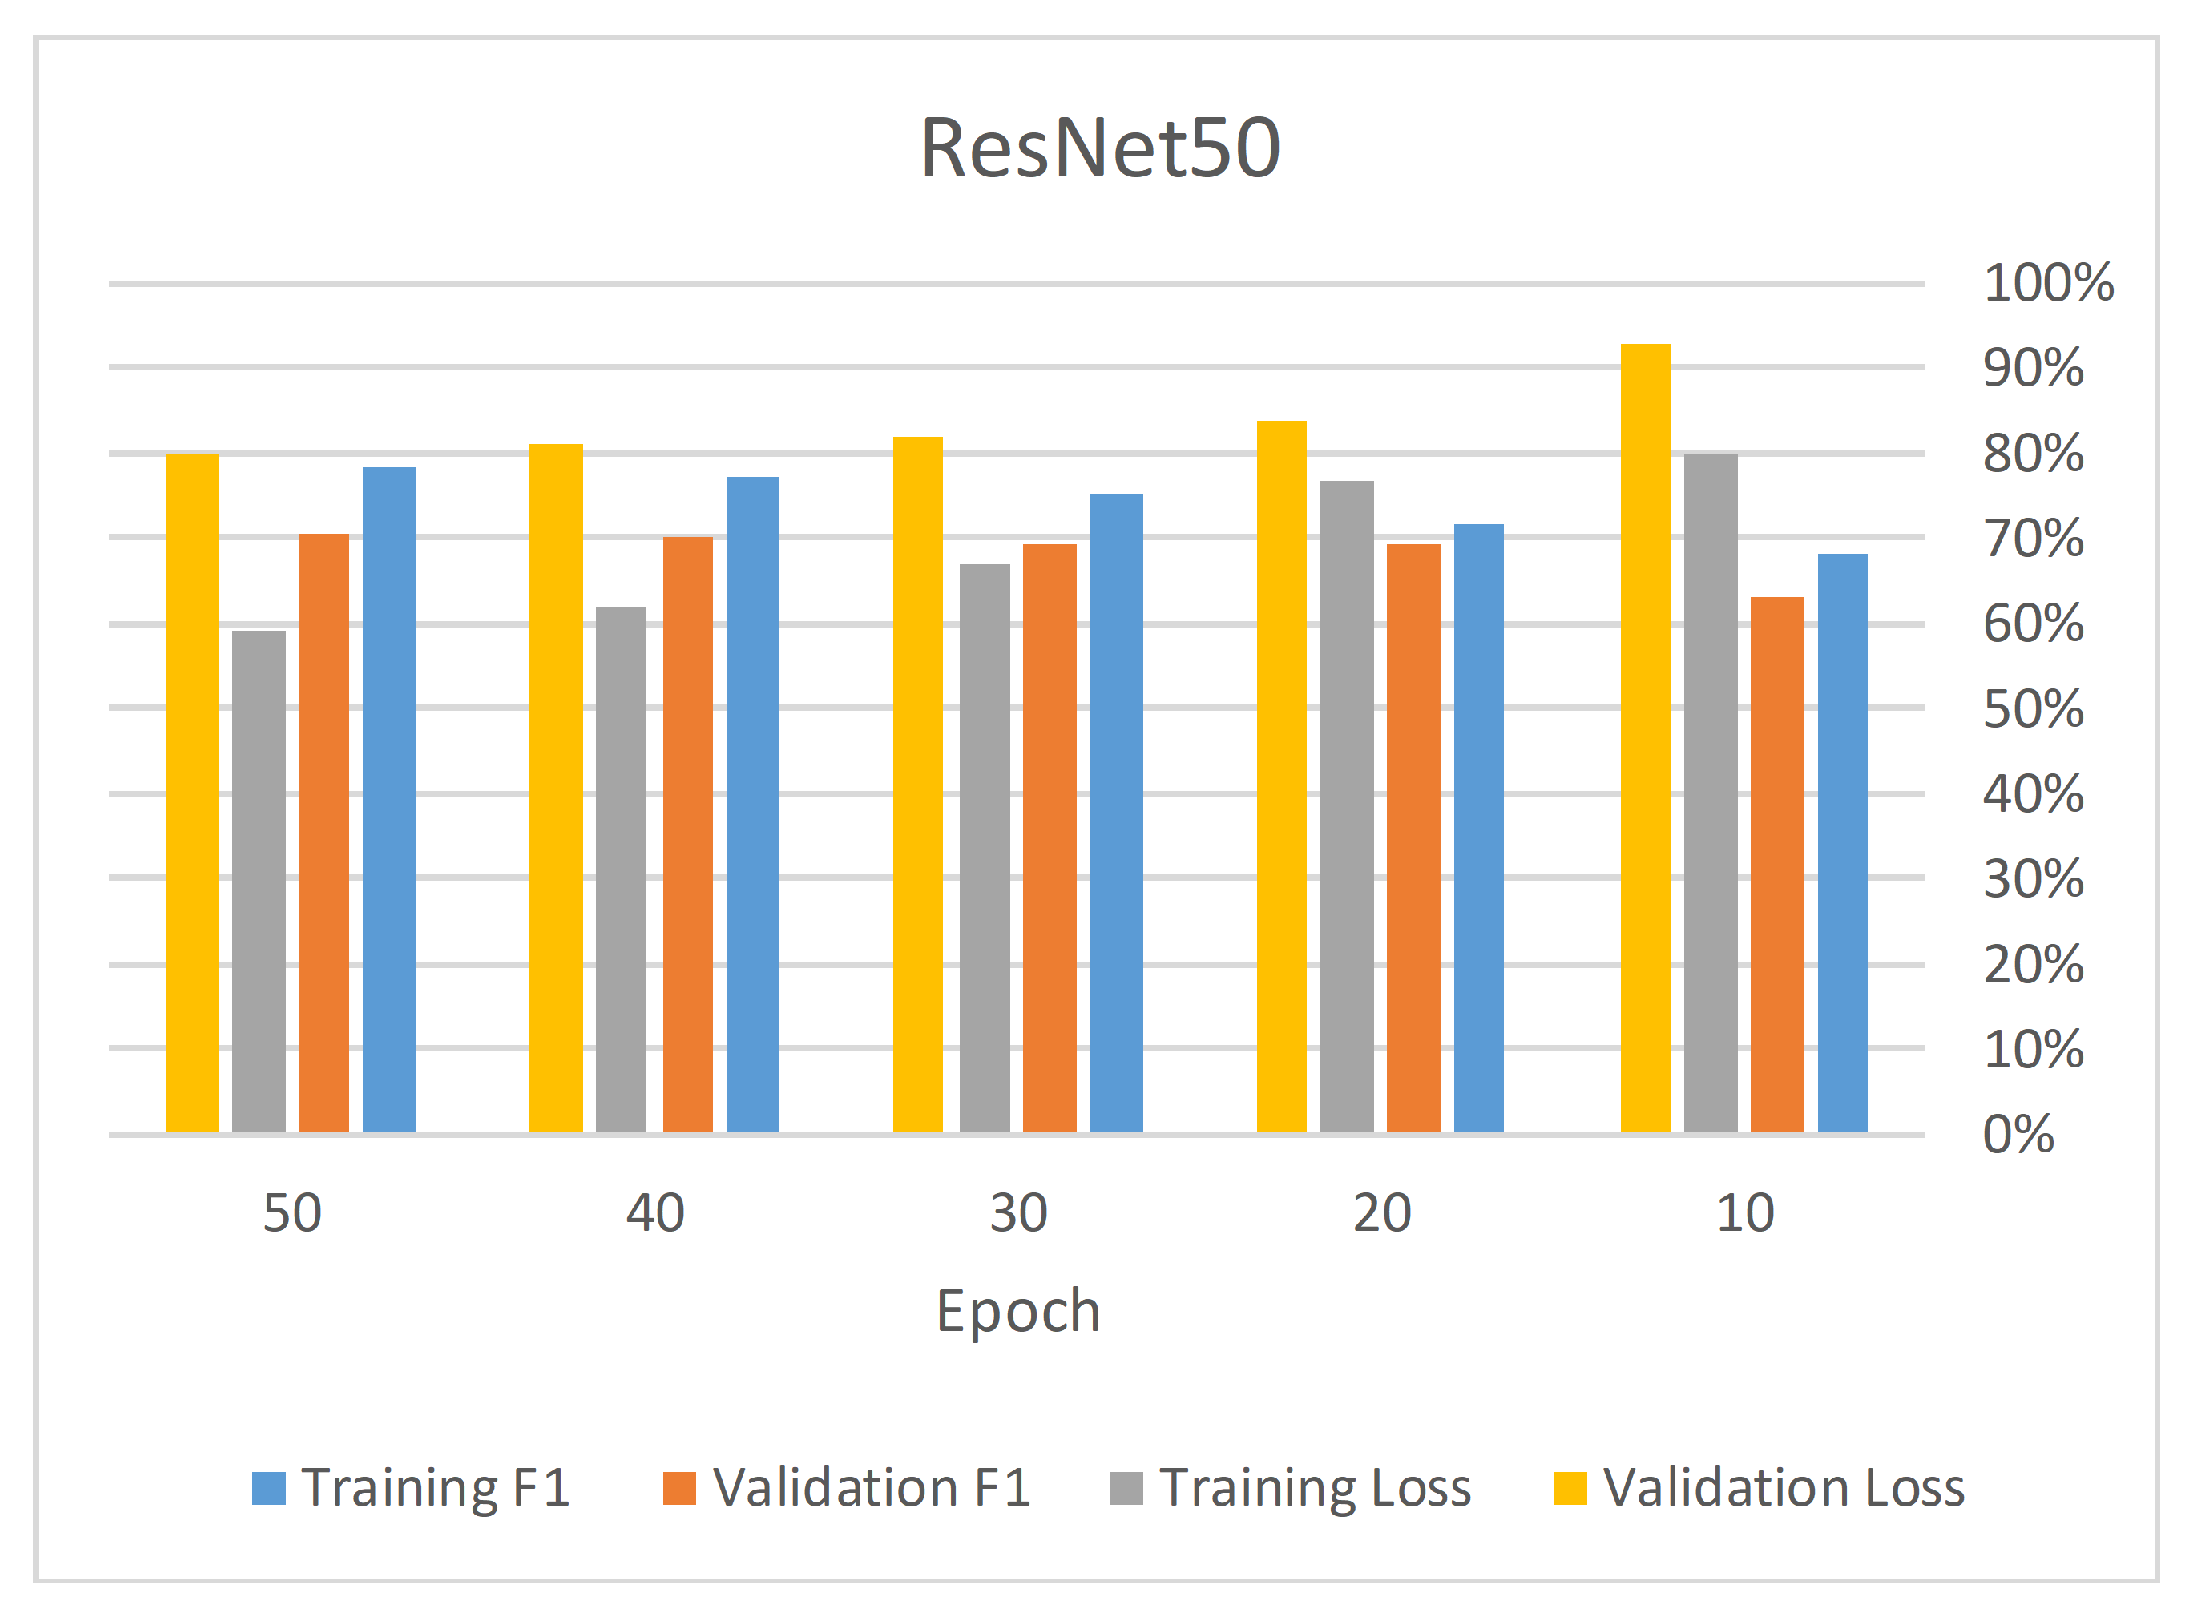
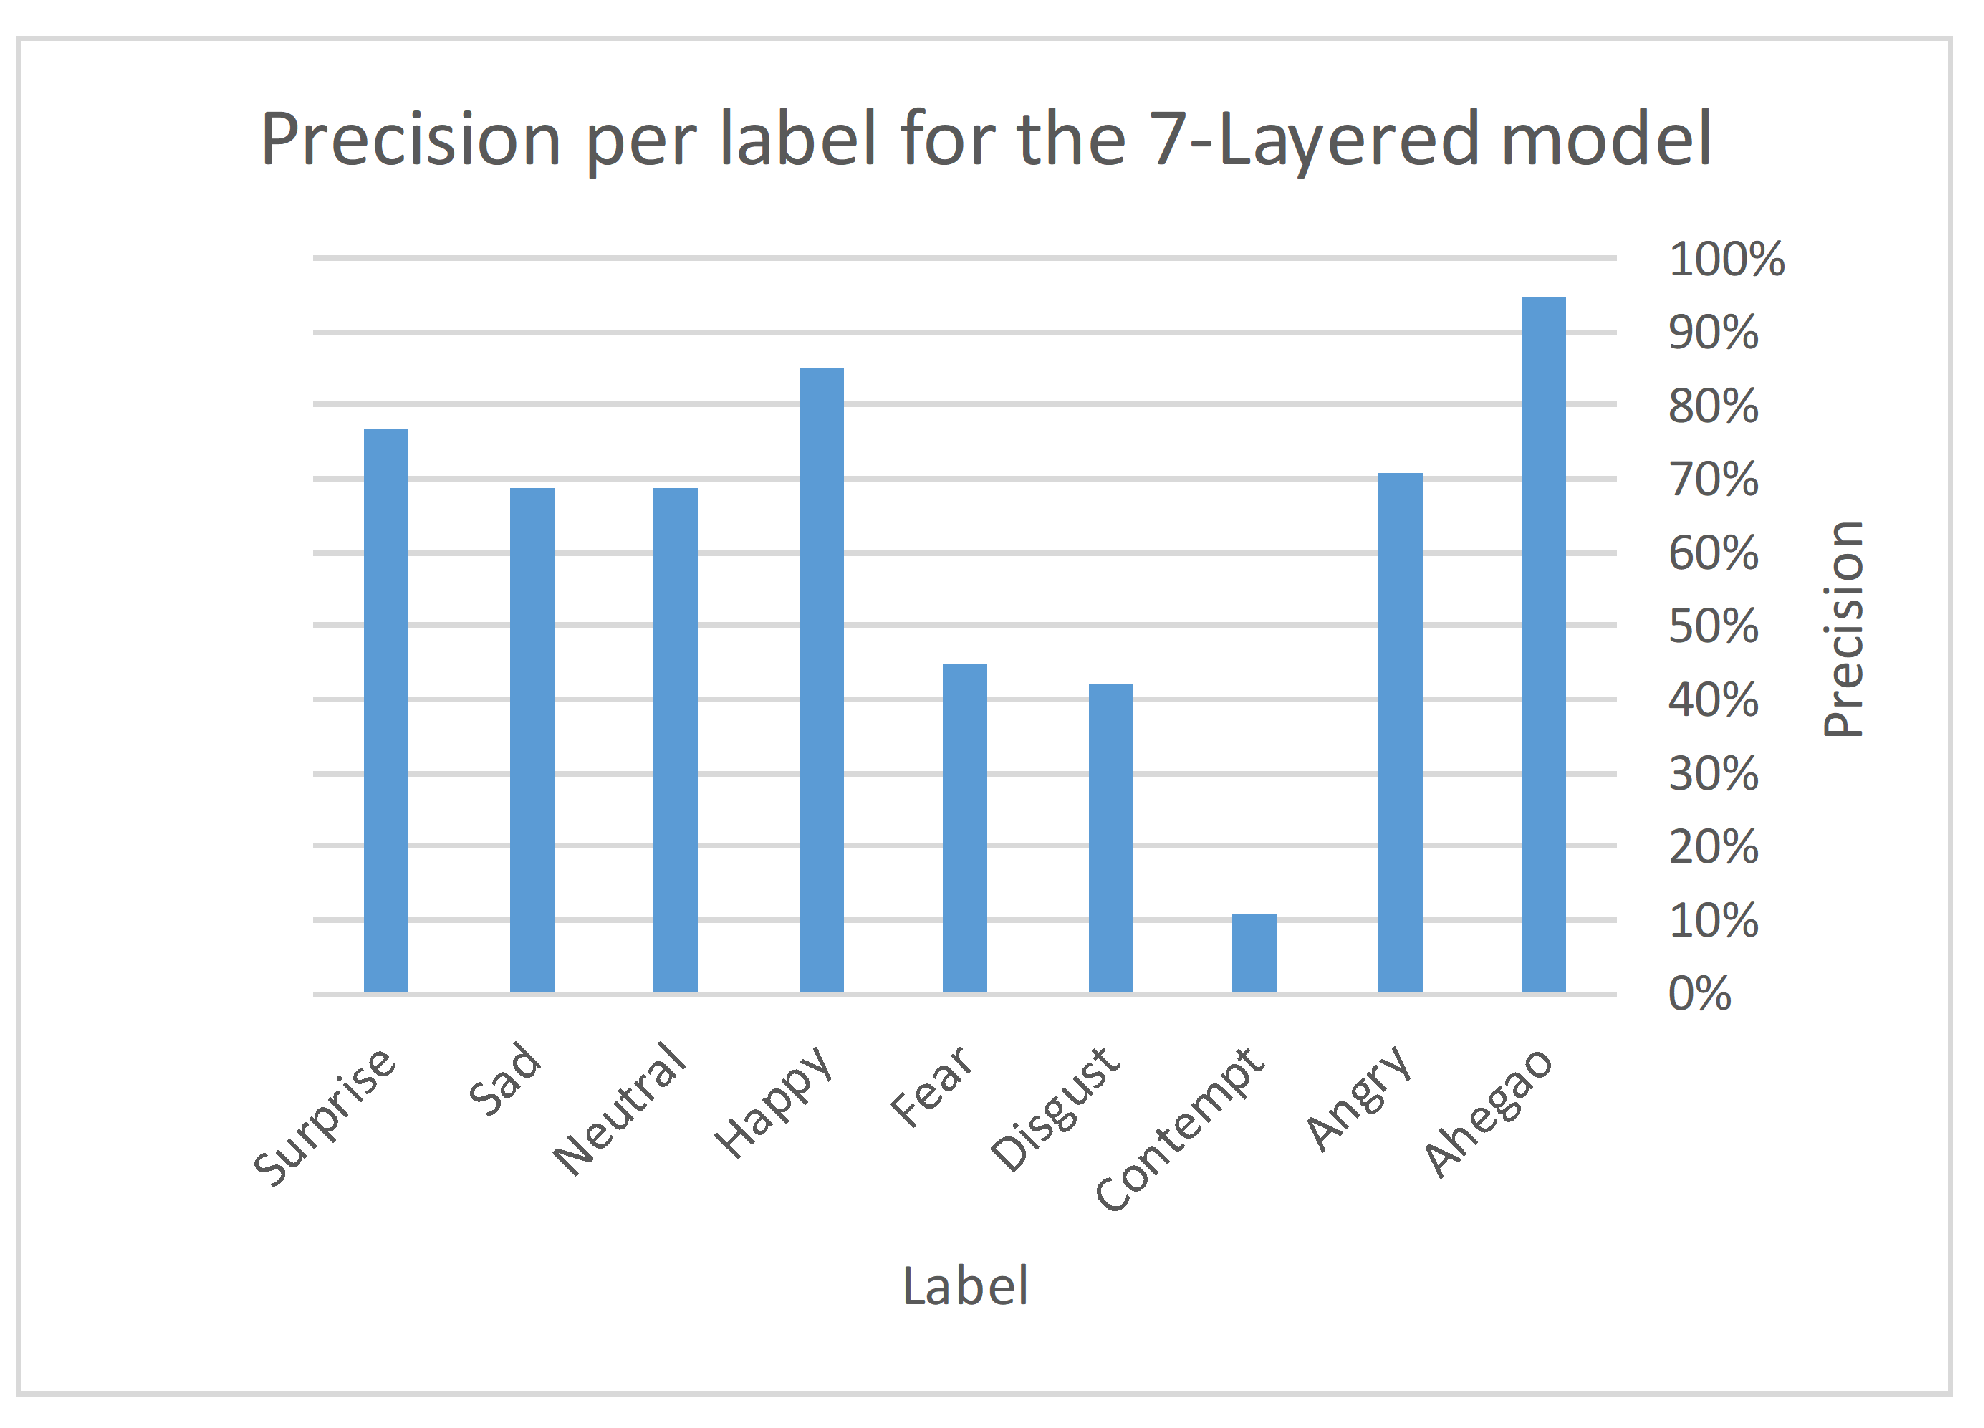
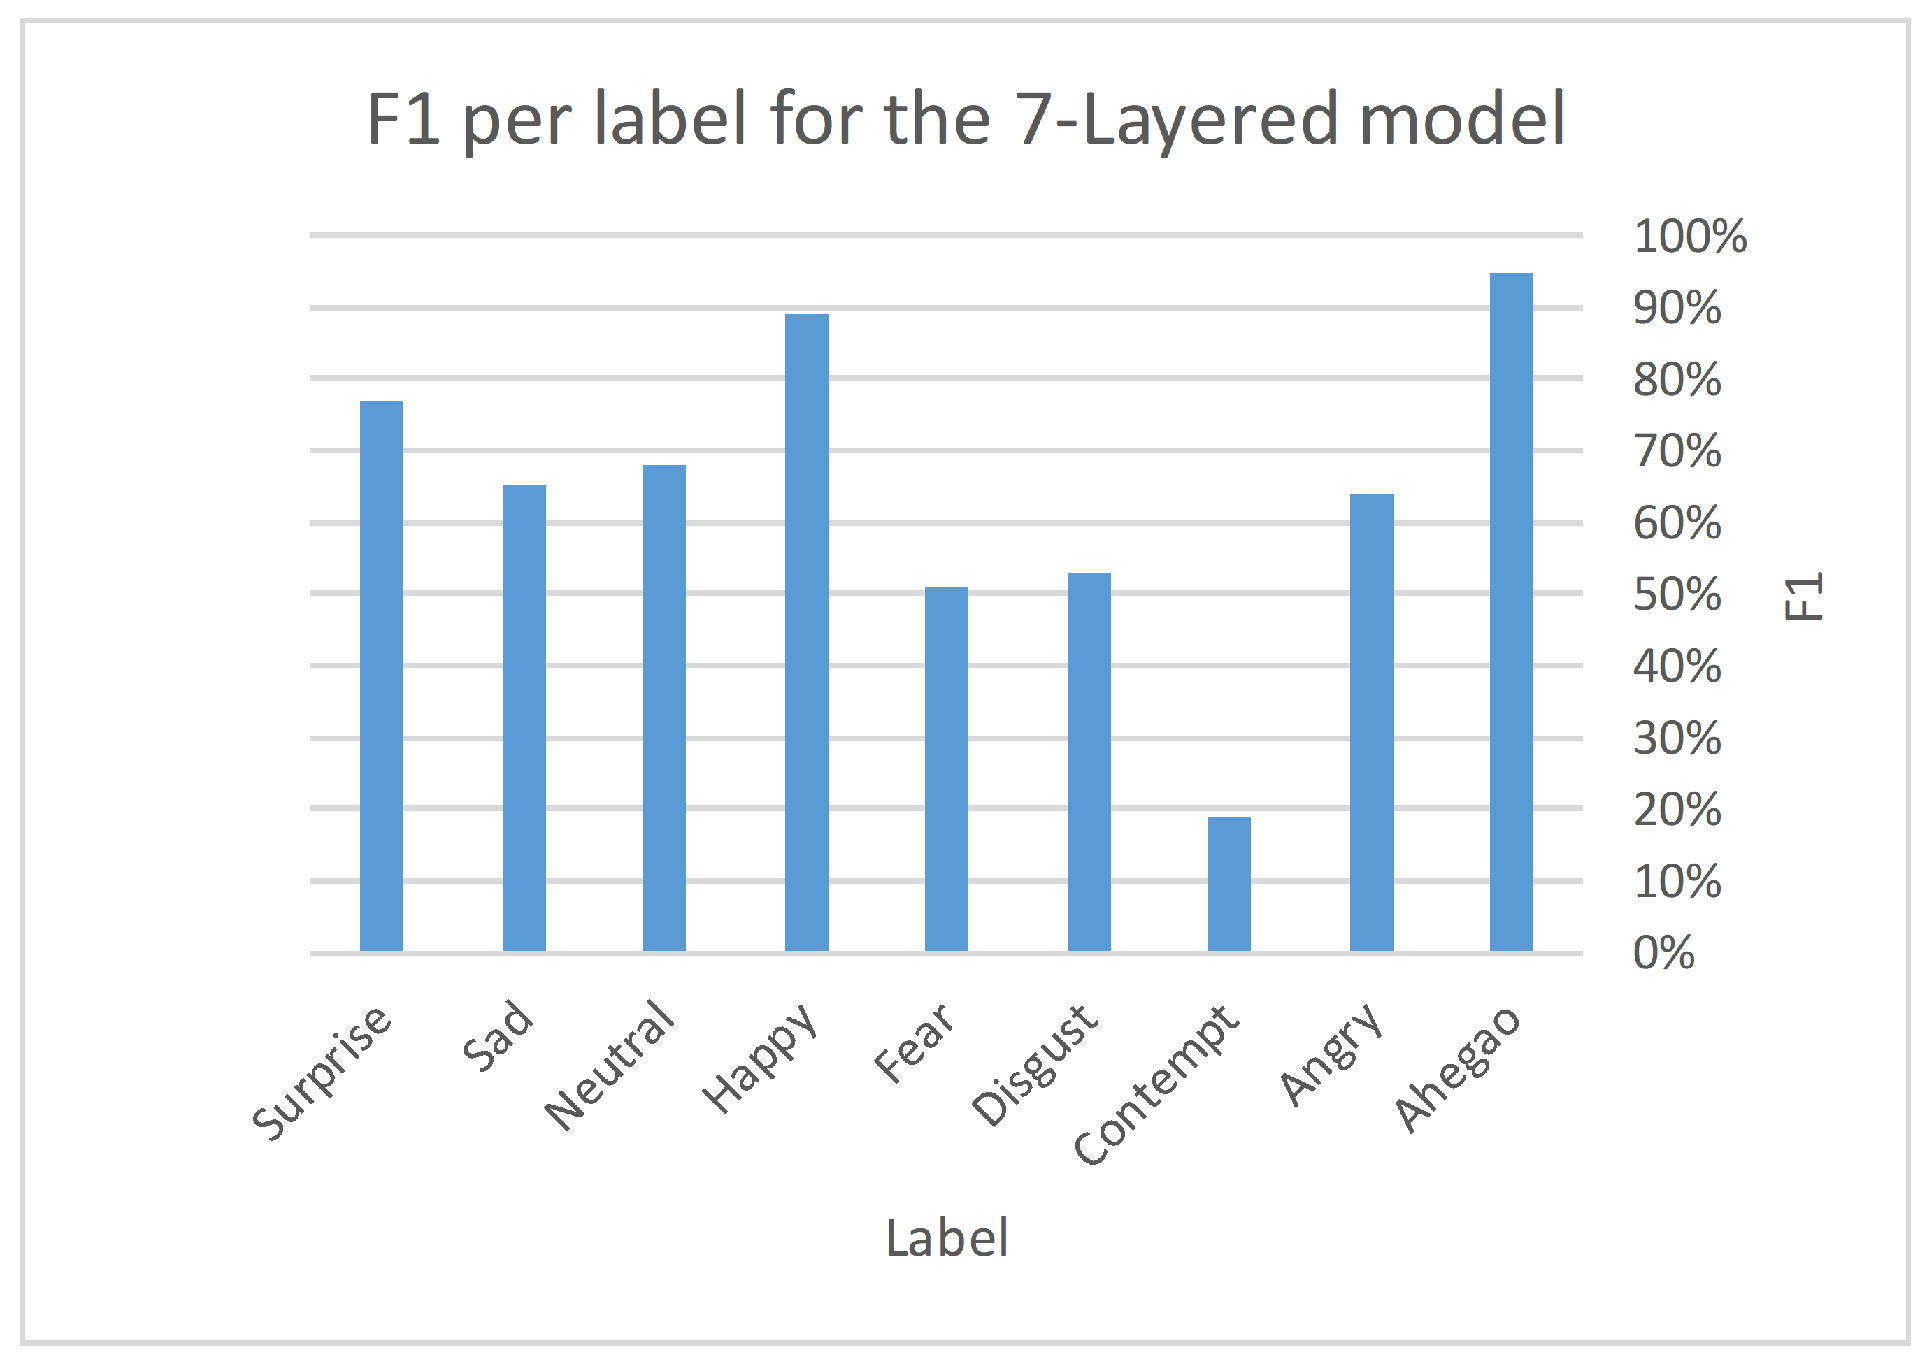
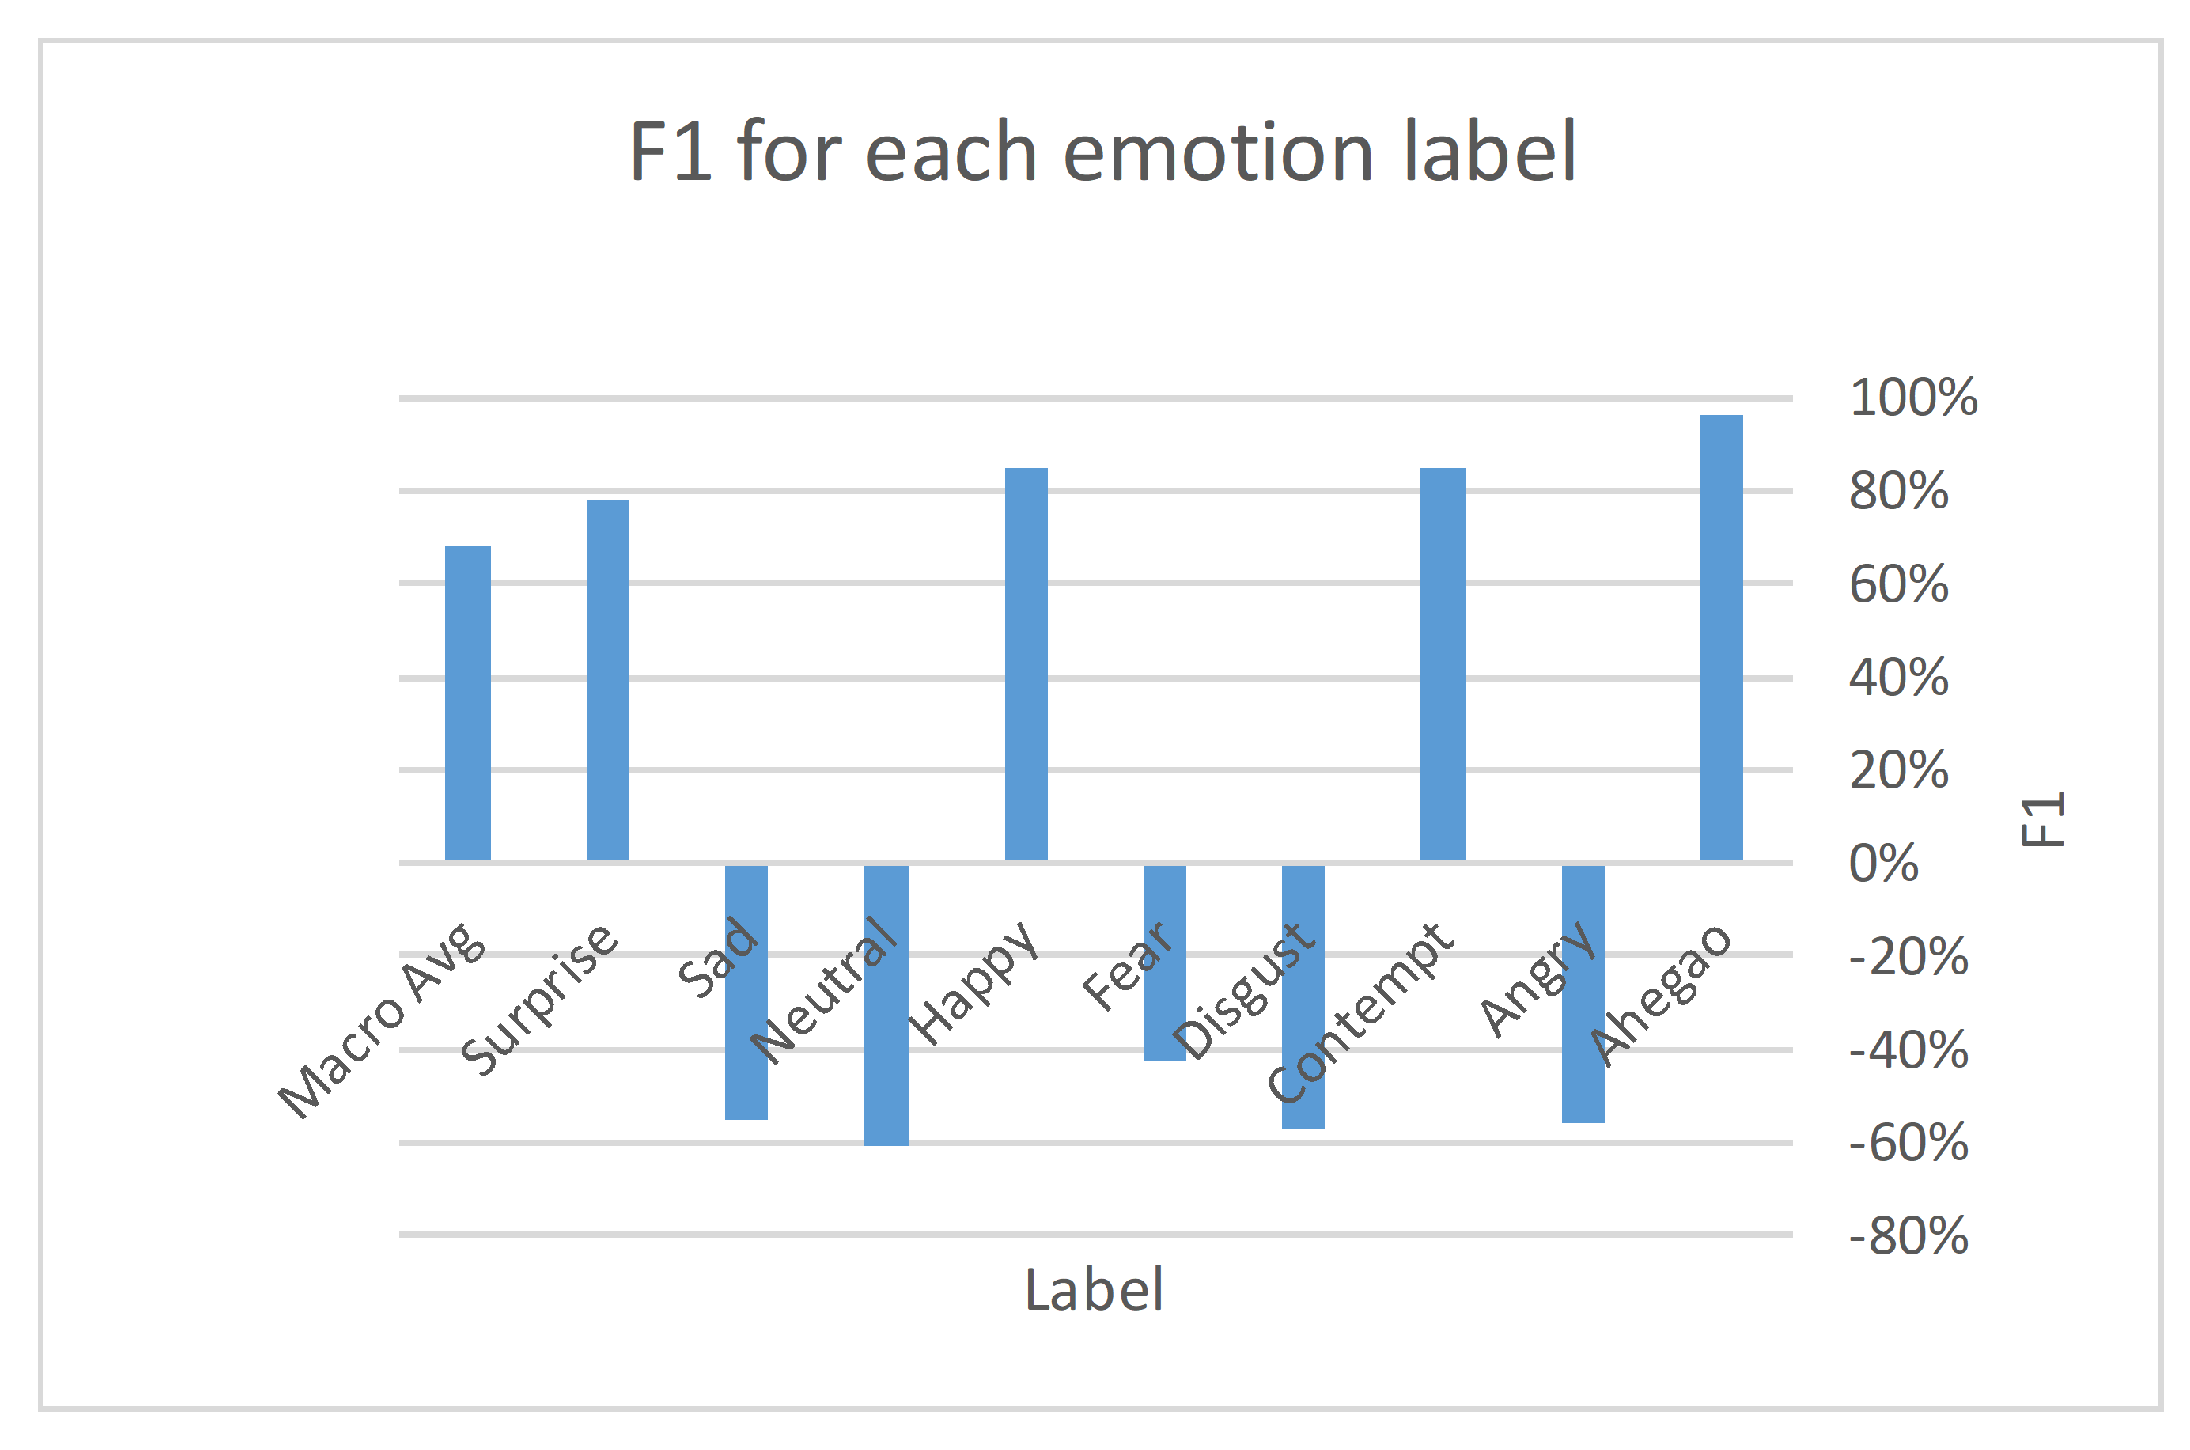
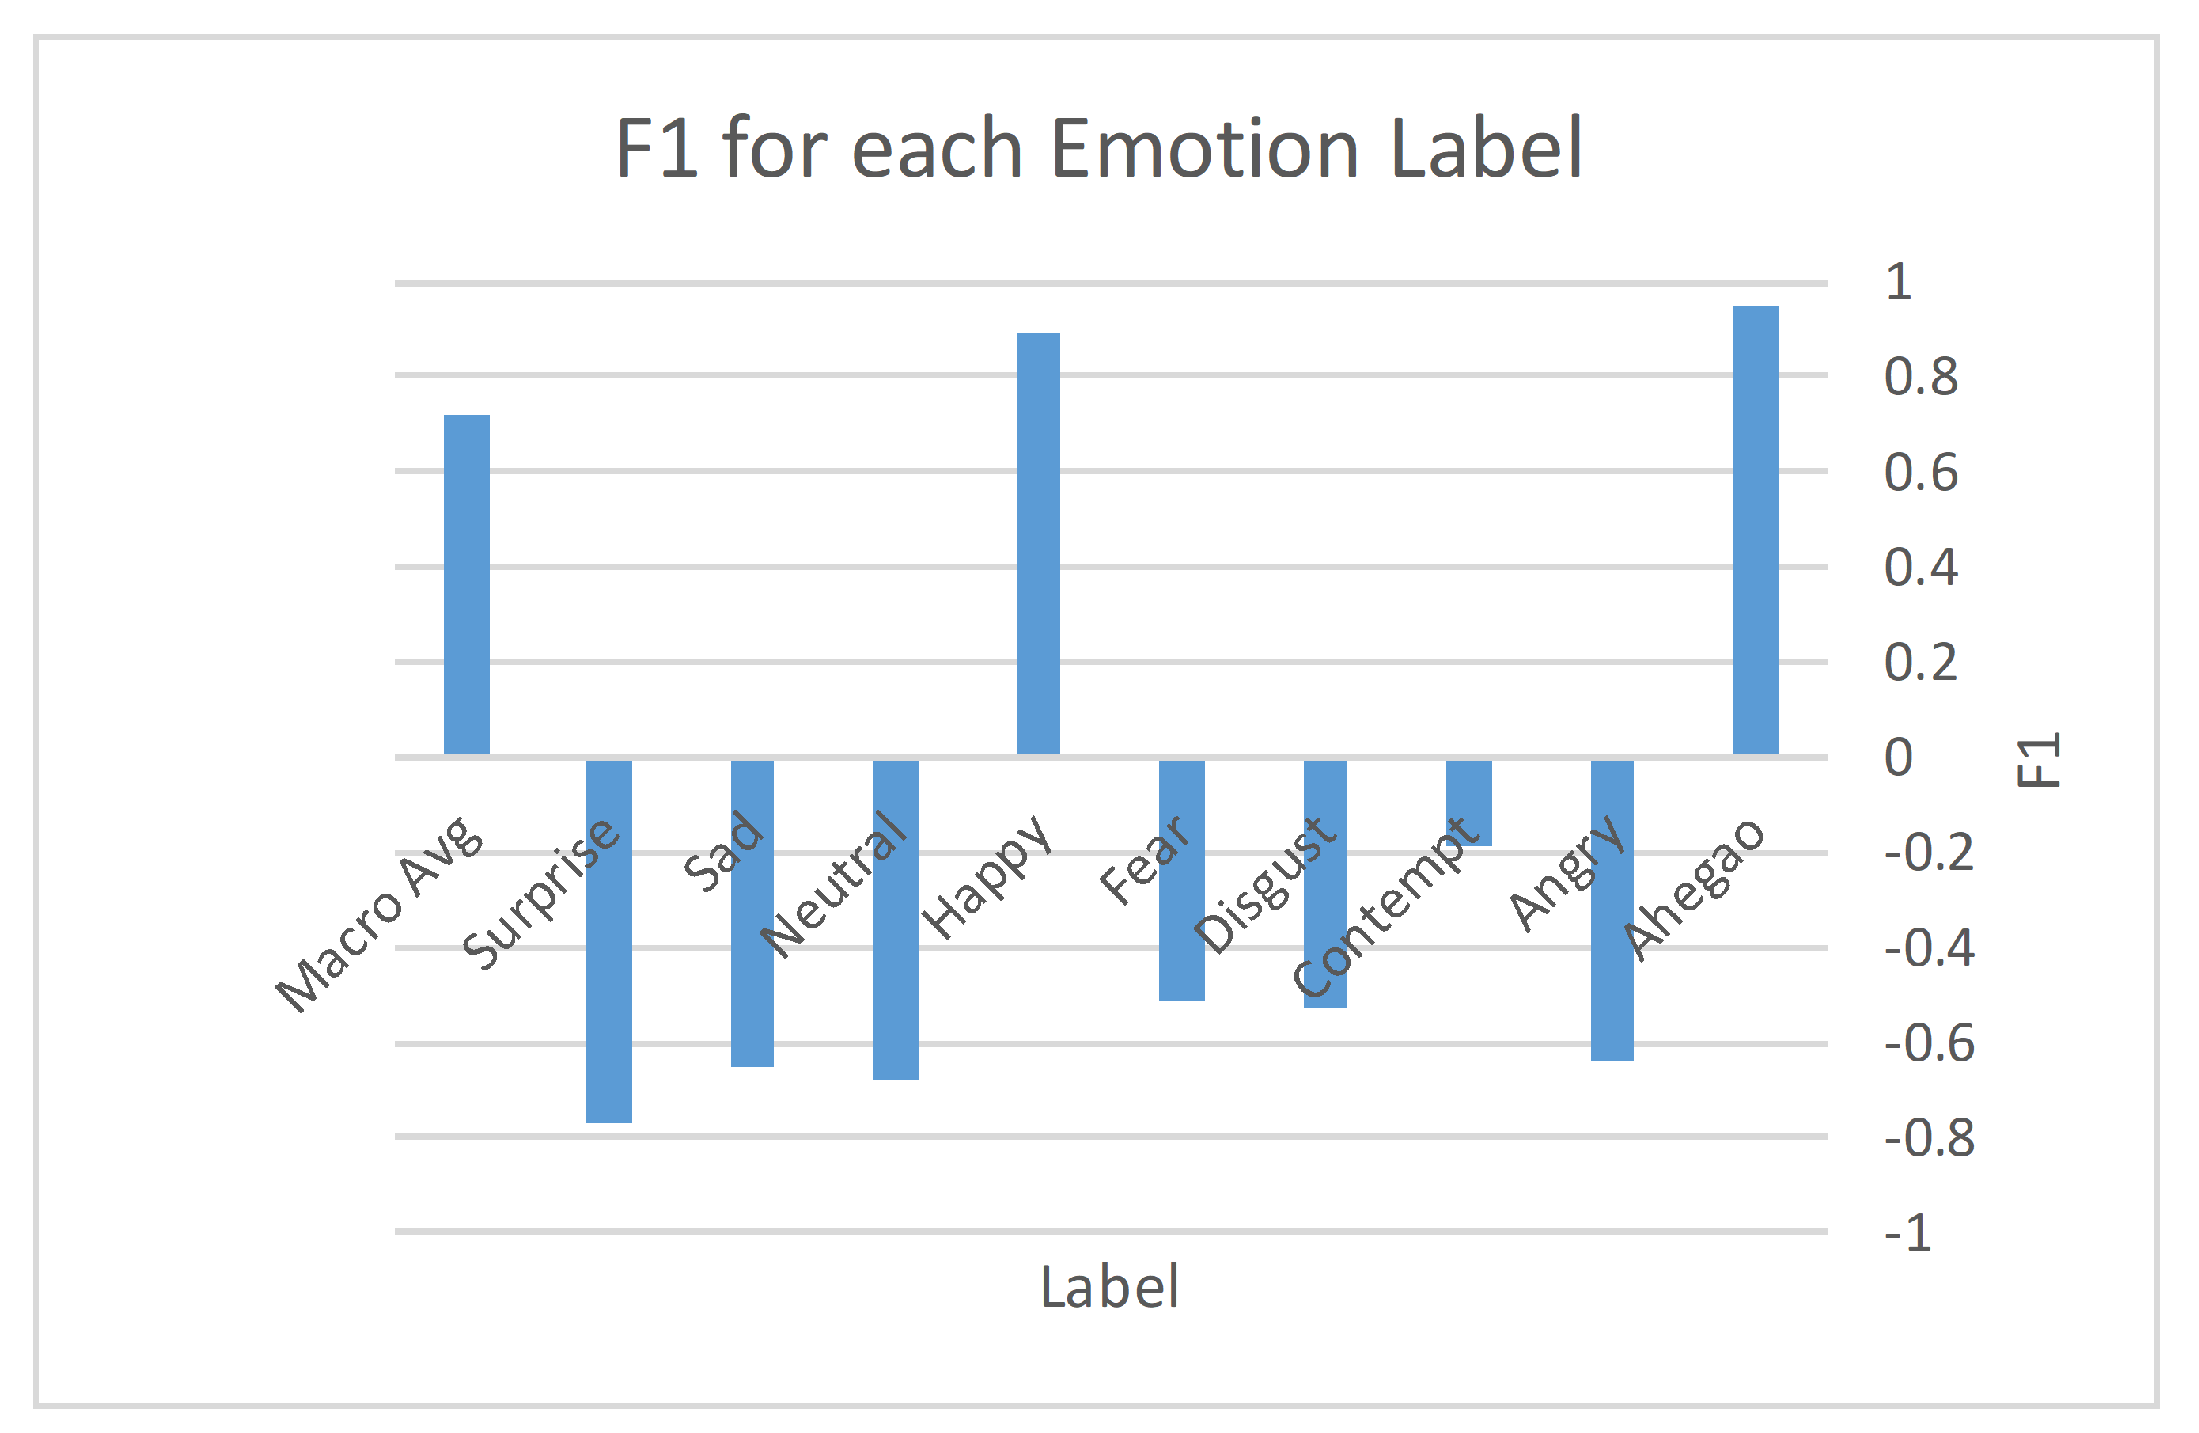
In this paper, we apply several algorithms to each of our datasets separately and then to our aggregate dataset, with the aim of revealing the extent to which teachers influence students in the educational process by focusing on analyzing feelings, which is the main objective of this paper. A sample of the dataset used in this research is illustrated in Figure 3.
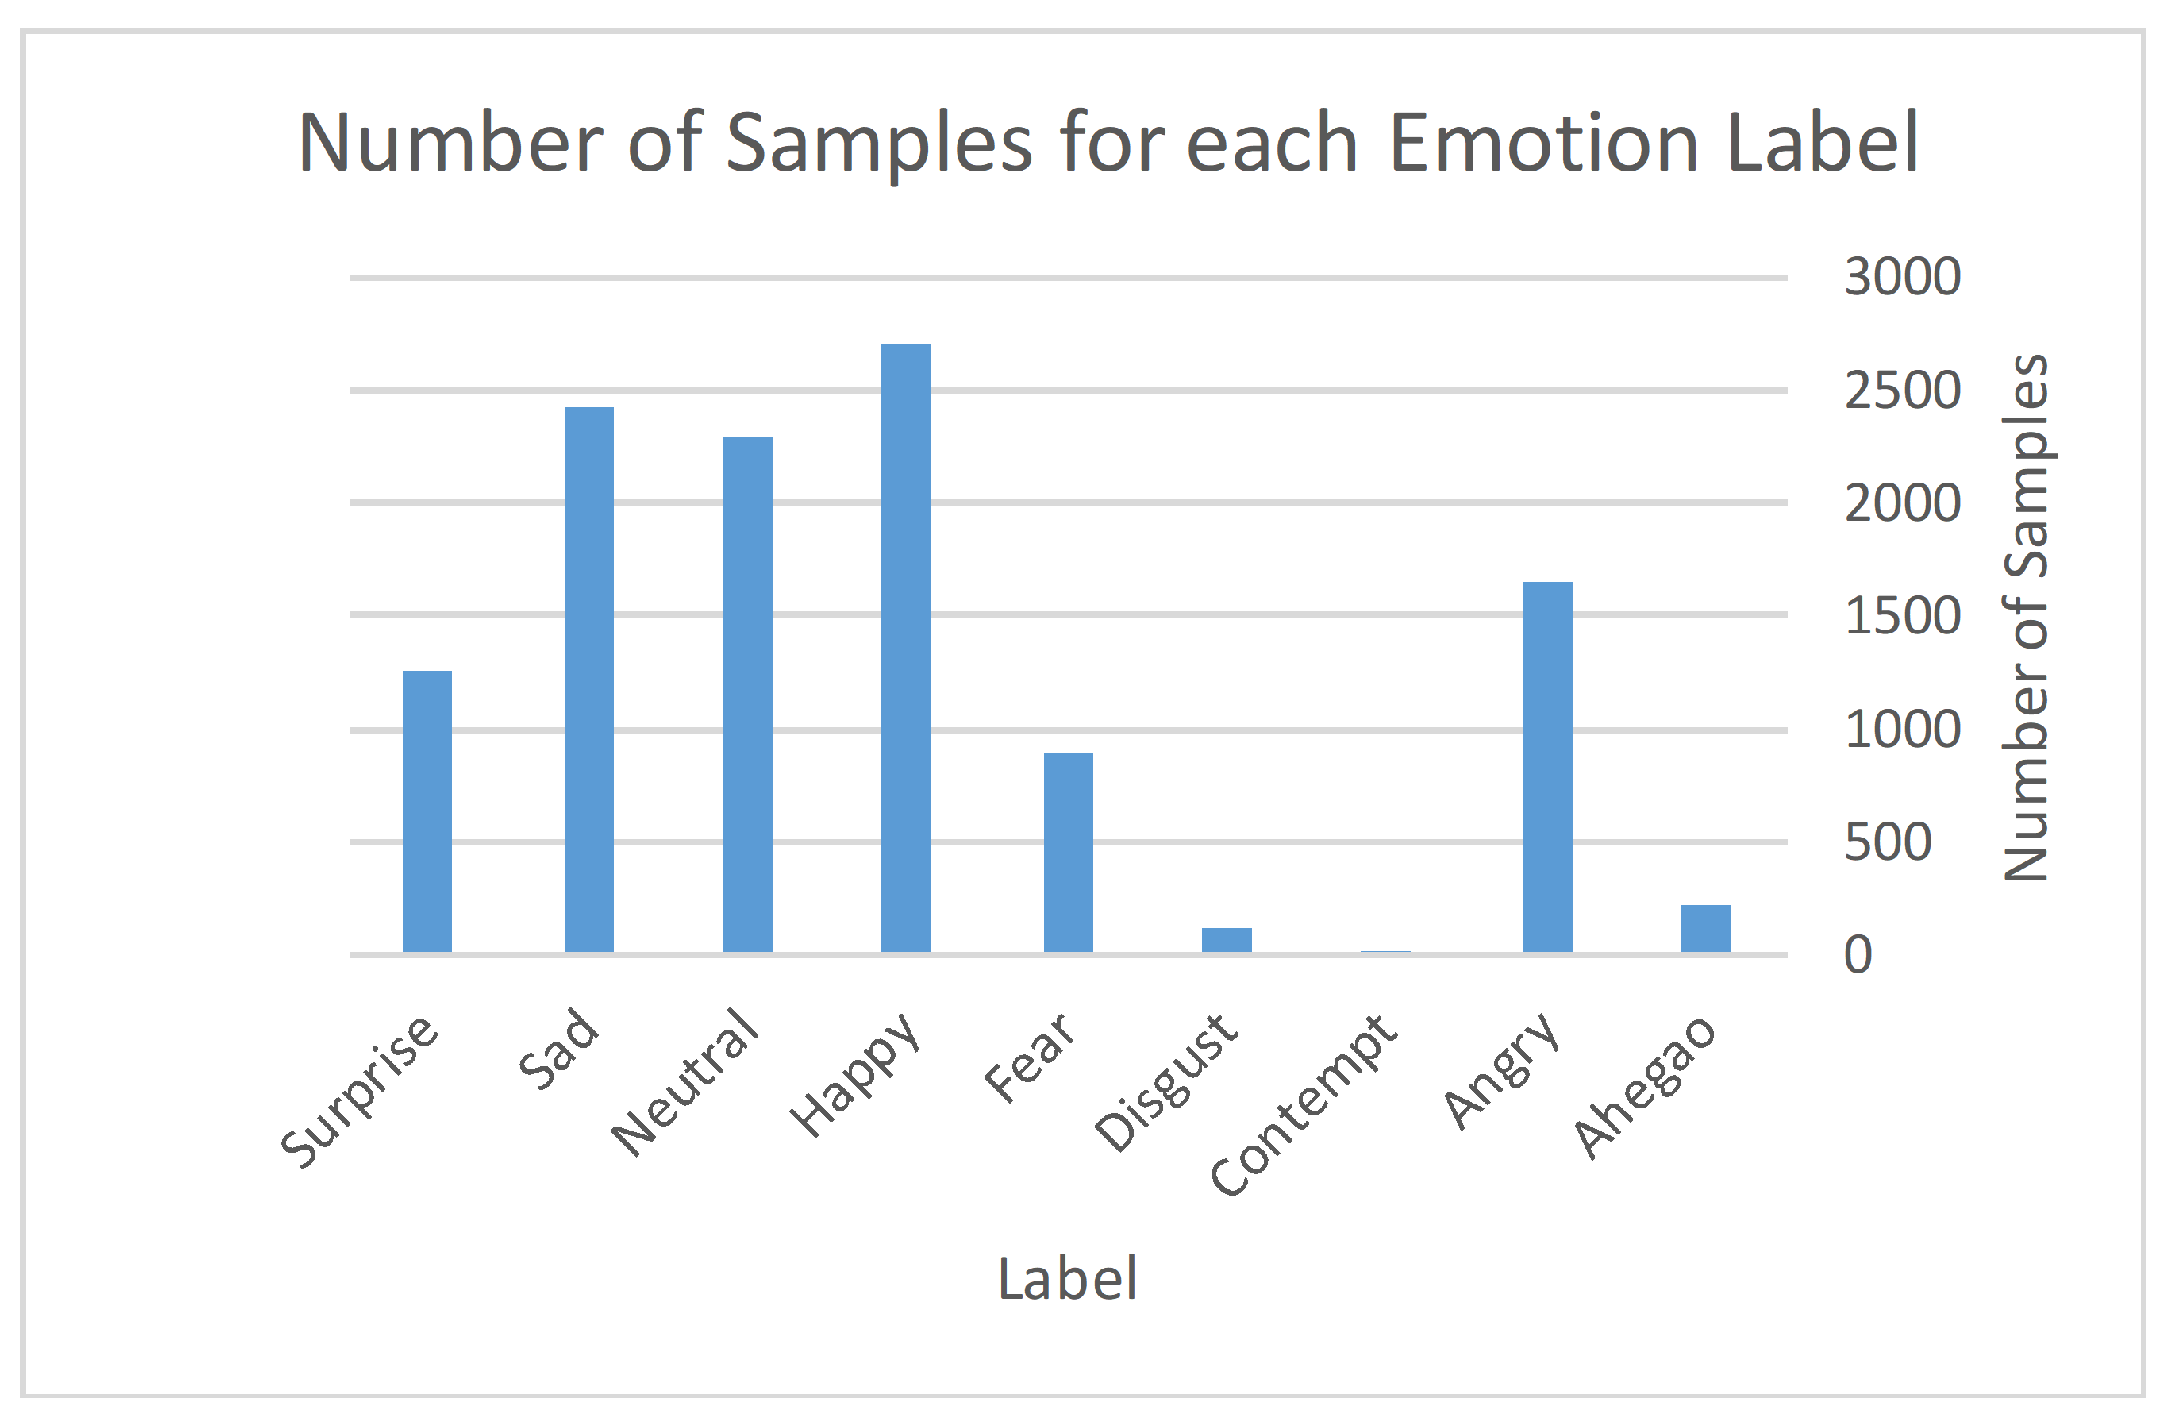
The second step was to make the dataset stabled, so we converted all images to the same extension and size and made them gray (black and white). Our purpose is to build stabled dataset to be ready for use in many experiments in several papers for education purposes. This paper’s main contribution is linking the emotional impact of both students and teachers on online education. The unbalanced data that was noticed from Table 1 will be resolved in future work as both oversampling and under-sampling techniques will be implemented and applied to the gathered dataset to make the accuracy much better according to the emotion classification process.

4. Experimental Results

4.1. Evaluation Measurements

The evaluation method is based on calculating retrieval, accuracy, and F1. For each label, we find the TP, FP, TN, and FN. Table 2 presents the Confusion Matrix.
The labels of the Confusion Matrix are explained below:
  • Positive = the expectation was real;
  • Negative = the prediction was not true;
  • True = the prediction was correct;
  • False = incorrect prediction.
The evaluation measurements used in the experiments are given as follows:
  • Recall: the percentage of correctly assigned records in that class among all the records belonging to that class. It is given by Equation  (1).
    R = T P / ( T P + F N ) ,
  • Precision: the percentage of correctly assigned records for that class among all the assigned records of that class. It is given by Equation  (2).
    P = T P / ( T P + F P ) ,
  • F1: the harmonic mean between the Recall and the Precision. It is given by Equation (3).
    F 1 = ( 2 R P ) / ( R + P ) ,
  • Loss: the difference between the actual and the predicted result. It is given in Equation (4).
    L o s s = ( Y a c t u a l L o g ( Y p r e d i c t e d ) + ( 1 Y a c t u a l ) L o g ( 1 Y p r e d i c t e d ) ) ,

4.2. Experimental Settings

For the conducted experiments, we used an Intel(R) Core(TM) i7-10870H CPU @ 2.20GHz with 32GB RAM and an Nvidia RTX 3070 GPU. For the implementation of the algorithms, we used Python 3.8.8 and MATLAB 2020b.

4.3. The Compared Deep Artificial Neural Networks

In this work for the sake of classifying images, we adopted two deep architectures: ResNet50 and a 7-layered deep CNN. ResNet50 is a CNN model that was trained on the ImageNet dataset. The model can classify an image to one of the 1000 labels available. The dataset contains millions of records, and the CNN is 50 layers deep. The pre-trained model has been widely used in various image applications. We also used another deep model that is composed of seven convolutional layers. The architecture of the model is given as follows.
  • _____________________________________________________________________________________________________________________________________
  • Model: "sequential"
  • _ _ _ _ _ _ _ _ _ _ _ _ _ _ _ _ _ _ _ _ _ _ _ _ _ _ _ _ _ _ _ _ _ _ _ _ _ _ _ _ _ _ _ _ _ _ _ _ _ _ _ _ _ _ _ _ _ _ _ _ _ _ _ _ _
  • Layer (type)               Output Shape           Param #
  • = = = = = = = = = = = = = = = = = = = = = = = = = = = = = = = = = = = = = = = = = = = = = = = = = = = = = = = = = = = = = = = = =
  • conv2d (Conv2D)             (None, 48, 48, 64)       640
  • _ _ _ _ _ _ _ _ _ _ _ _ _ _ _ _ _ _ _ _ _ _ _ _ _ _ _ _ _ _ _ _ _ _ _ _ _ _ _ _ _ _ _ _ _ _ _ _ _ _ _ _ _ _ _ _ _ _ _ _ _ _ _ _ _
  • batch_ normalization(BatchNo)      (None, 48, 48, 64)        256
  • _ _ _ _ _ _ _ _ _ _ _ _ _ _ _ _ _ _ _ _ _ _ _ _ _ _ _ _ _ _ _ _ _ _ _ _ _ _ _ _ _ _ _ _ _ _ _ _ _ _ _ _ _ _ _ _ _ _ _ _ _ _ _ _ _
  • activation (Activation)         (None, 48, 48, 64)        0
  • _ _ _ _ _ _ _ _ _ _ _ _ _ _ _ _ _ _ _ _ _ _ _ _ _ _ _ _ _ _ _ _ _ _ _ _ _ _ _ _ _ _ _ _ _ _ _ _ _ _ _ _ _ _ _ _ _ _ _ _ _ _ _ _ _
  • max_ pooling2d (MaxPooling2D)      (None, 24, 24, 64)        0
  • _ _ _ _ _ _ _ _ _ _ _ _ _ _ _ _ _ _ _ _ _ _ _ _ _ _ _ _ _ _ _ _ _ _ _ _ _ _ _ _ _ _ _ _ _ _ _ _ _ _ _ _ _ _ _ _ _ _ _ _ _ _ _ _ _
  • dropout (Dropout)            (None, 24, 24, 64)        0
  • _ _ _ _ _ _ _ _ _ _ _ _ _ _ _ _ _ _ _ _ _ _ _ _ _ _ _ _ _ _ _ _ _ _ _ _ _ _ _ _ _ _ _ _ _ _ _ _ _ _ _ _ _ _ _ _ _ _ _ _ _ _ _ _ _
  • conv2d_ 1 (Conv2D)            (None, 24, 24, 128)      204928
  • _ _ _ _ _ _ _ _ _ _ _ _ _ _ _ _ _ _ _ _ _ _ _ _ _ _ _ _ _ _ _ _ _ _ _ _ _ _ _ _ _ _ _ _ _ _ _ _ _ _ _ _ _ _ _ _ _ _ _ _ _ _ _ _ _
  • batch_ normalization_ 1 (Batch)     (None, 24, 24, 128)       512
  • _ _ _ _ _ _ _ _ _ _ _ _ _ _ _ _ _ _ _ _ _ _ _ _ _ _ _ _ _ _ _ _ _ _ _ _ _ _ _ _ _ _ _ _ _ _ _ _ _ _ _ _ _ _ _ _ _ _ _ _ _ _ _ _ _
  • activation_ 1 (Activation)       (None, 24, 24, 128)        0
  • _ _ _ _ _ _ _ _ _ _ _ _ _ _ _ _ _ _ _ _ _ _ _ _ _ _ _ _ _ _ _ _ _ _ _ _ _ _ _ _ _ _ _ _ _ _ _ _ _ _ _ _ _ _ _ _ _ _ _ _ _ _ _ _ _
  • max_ pooling2d_ 1 (MaxPooling2     (None, 12, 12, 128)        0
  • _ _ _ _ _ _ _ _ _ _ _ _ _ _ _ _ _ _ _ _ _ _ _ _ _ _ _ _ _ _ _ _ _ _ _ _ _ _ _ _ _ _ _ _ _ _ _ _ _ _ _ _ _ _ _ _ _ _ _ _ _ _ _ _ _
  • dropout_ 1 (Dropout)          (None, 12, 12, 128)        0
  • _ _ _ _ _ _ _ _ _ _ _ _ _ _ _ _ _ _ _ _ _ _ _ _ _ _ _ _ _ _ _ _ _ _ _ _ _ _ _ _ _ _ _ _ _ _ _ _ _ _ _ _ _ _ _ _ _ _ _ _ _ _ _ _ _
  • conv2d_ 2 (Conv2D)           (None, 12, 12, 512)       590336
  • _ _ _ _ _ _ _ _ _ _ _ _ _ _ _ _ _ _ _ _ _ _ _ _ _ _ _ _ _ _ _ _ _ _ _ _ _ _ _ _ _ _ _ _ _ _ _ _ _ _ _ _ _ _ _ _ _ _ _ _ _ _ _ _ _
  • batch_ normalization_ 2 (Batch)     (None, 12, 12, 512)       2048
  • _ _ _ _ _ _ _ _ _ _ _ _ _ _ _ _ _ _ _ _ _ _ _ _ _ _ _ _ _ _ _ _ _ _ _ _ _ _ _ _ _ _ _ _ _ _ _ _ _ _ _ _ _ _ _ _ _ _ _ _ _ _ _ _ _
  • activation_ 2 (Activation)       (None, 12, 12, 512)        0
  • _ _ _ _ _ _ _ _ _ _ _ _ _ _ _ _ _ _ _ _ _ _ _ _ _ _ _ _ _ _ _ _ _ _ _ _ _ _ _ _ _ _ _ _ _ _ _ _ _ _ _ _ _ _ _ _ _ _ _ _ _ _ _ _ _
  • max_ pooling2d_ 2 (MaxPooling2     (None, 6, 6, 512)         0
  • _ _ _ _ _ _ _ _ _ _ _ _ _ _ _ _ _ _ _ _ _ _ _ _ _ _ _ _ _ _ _ _ _ _ _ _ _ _ _ _ _ _ _ _ _ _ _ _ _ _ _ _ _ _ _ _ _ _ _ _ _ _ _ _ _
  • dropout_ 2 (Dropout)          (None, 6, 6, 512)         0
  • _ _ _ _ _ _ _ _ _ _ _ _ _ _ _ _ _ _ _ _ _ _ _ _ _ _ _ _ _ _ _ _ _ _ _ _ _ _ _ _ _ _ _ _ _ _ _ _ _ _ _ _ _ _ _ _ _ _ _ _ _ _ _ _ _
  • conv2d_ 3 (Conv2D)           (None, 6, 6, 512)        2359808
  • _ _ _ _ _ _ _ _ _ _ _ _ _ _ _ _ _ _ _ _ _ _ _ _ _ _ _ _ _ _ _ _ _ _ _ _ _ _ _ _ _ _ _ _ _ _ _ _ _ _ _ _ _ _ _ _ _ _ _ _ _ _ _ _ _
  • batch_ normalization_ 3 (Batch)     (None, 6, 6, 512)        2048
  • _ _ _ _ _ _ _ _ _ _ _ _ _ _ _ _ _ _ _ _ _ _ _ _ _ _ _ _ _ _ _ _ _ _ _ _ _ _ _ _ _ _ _ _ _ _ _ _ _ _ _ _ _ _ _ _ _ _ _ _ _ _ _ _ _
  • activation_ 3 (Activation)       (None, 6, 6, 512)         0
  • _ _ _ _ _ _ _ _ _ _ _ _ _ _ _ _ _ _ _ _ _ _ _ _ _ _ _ _ _ _ _ _ _ _ _ _ _ _ _ _ _ _ _ _ _ _ _ _ _ _ _ _ _ _ _ _ _ _ _ _ _ _ _ _ _
  • max_ pooling2d_ 3 (MaxPooling2)    (None, 3, 3, 512)         0
  • _ _ _ _ _ _ _ _ _ _ _ _ _ _ _ _ _ _ _ _ _ _ _ _ _ _ _ _ _ _ _ _ _ _ _ _ _ _ _ _ _ _ _ _ _ _ _ _ _ _ _ _ _ _ _ _ _ _ _ _ _ _ _ _ _
  • dropout_ 3 (Dropout)          (None, 3, 3, 512)         0
  • _ _ _ _ _ _ _ _ _ _ _ _ _ _ _ _ _ _ _ _ _ _ _ _ _ _ _ _ _ _ _ _ _ _ _ _ _ _ _ _ _ _ _ _ _ _ _ _ _ _ _ _ _ _ _ _ _ _ _ _ _ _ _ _ _
  • flatten (Flatten)           (None, 4608)             0
  • _ _ _ _ _ _ _ _ _ _ _ _ _ _ _ _ _ _ _ _ _ _ _ _ _ _ _ _ _ _ _ _ _ _ _ _ _ _ _ _ _ _ _ _ _ _ _ _ _ _ _ _ _ _ _ _ _ _ _ _ _ _ _ _ _
  • dense (Dense)             (None, 256)            1179904
  • _ _ _ _ _ _ _ _ _ _ _ _ _ _ _ _ _ _ _ _ _ _ _ _ _ _ _ _ _ _ _ _ _ _ _ _ _ _ _ _ _ _ _ _ _ _ _ _ _ _ _ _ _ _ _ _ _ _ _ _ _ _ _ _ _
  • batch_ normalization_ 4 (Batch)    (None, 256)             1024
  • _ _ _ _ _ _ _ _ _ _ _ _ _ _ _ _ _ _ _ _ _ _ _ _ _ _ _ _ _ _ _ _ _ _ _ _ _ _ _ _ _ _ _ _ _ _ _ _ _ _ _ _ _ _ _ _ _ _ _ _ _ _ _ _ _
  • activation_ 4 (Activation)       (None, 256)             0
  • _ _ _ _ _ _ _ _ _ _ _ _ _ _ _ _ _ _ _ _ _ _ _ _ _ _ _ _ _ _ _ _ _ _ _ _ _ _ _ _ _ _ _ _ _ _ _ _ _ _ _ _ _ _ _ _ _ _ _ _ _ _ _ _ _
  • dropout_ 4 (Dropout)          (None, 256)             0
  • _ _ _ _ _ _ _ _ _ _ _ _ _ _ _ _ _ _ _ _ _ _ _ _ _ _ _ _ _ _ _ _ _ _ _ _ _ _ _ _ _ _ _ _ _ _ _ _ _ _ _ _ _ _ _ _ _ _ _ _ _ _ _ _ _
  • dense_ 1 (Dense)            (None, 512)            131584
  • _ _ _ _ _ _ _ _ _ _ _ _ _ _ _ _ _ _ _ _ _ _ _ _ _ _ _ _ _ _ _ _ _ _ _ _ _ _ _ _ _ _ _ _ _ _ _ _ _ _ _ _ _ _ _ _ _ _ _ _ _ _ _ _ _
  • batch_ normalization_ 5 (Batch)    (None, 512)             2048
  • _ _ _ _ _ _ _ _ _ _ _ _ _ _ _ _ _ _ _ _ _ _ _ _ _ _ _ _ _ _ _ _ _ _ _ _ _ _ _ _ _ _ _ _ _ _ _ _ _ _ _ _ _ _ _ _ _ _ _ _ _ _ _ _ _
  • activation_ 5 (Activation)       (None, 512)             0
  • _ _ _ _ _ _ _ _ _ _ _ _ _ _ _ _ _ _ _ _ _ _ _ _ _ _ _ _ _ _ _ _ _ _ _ _ _ _ _ _ _ _ _ _ _ _ _ _ _ _ _ _ _ _ _ _ _ _ _ _ _ _ _ _ _
  • dropout_ 5 (Dropout)          (None, 512)             0
  • _ _ _ _ _ _ _ _ _ _ _ _ _ _ _ _ _ _ _ _ _ _ _ _ _ _ _ _ _ _ _ _ _ _ _ _ _ _ _ _ _ _ _ _ _ _ _ _ _ _ _ _ _ _ _ _ _ _ _ _ _ _ _ _ _
  • dense_ 2 (Dense)            (None, 9)              4617
  • = = = = = = = = = = = = = = = = = = = = = = = = = = = = = = = = = = = = = = = = = = = = = = = = = = = = = = = = = = = = = = = = =
  • Total params: 4,479,753
  • Trainable params: 4,475,785
  • Non-trainable params: 3,968
  • _____________________________________________________________________________________________________________________________________

4.4. Experimental Results

We conducted two sets of experiments. The first was conducted using the 7-layered deep neural network, and the second was conducted by transferring the pre-trained widely used RESNET50 architecture. The results in Table 3 illustrate the F1 measurement and loss for the 7-layered deep neural network, and after using 50 epochs and a batch size of 10, both the F1 measurement and the loss are represented in Figure 4. The F1 increased exponentially with the increase in the epochs for both the training set and the validation set until reaching a point at which the F1 increase tended to be linear. That point was reached with approximately ten epochs. It was also noted that the increase in the F1 for the training set was more than that of the validation set. This was expected due to the overfitting common in training sets. The best F1 was 0.64 for the validation and 0.68 for the training set. These readings were achieved using 50 epochs. As for the loss, it showed opposite behavior to the F1, as it started to decrease rapidly until reaching 10 epochs, at which point it started to decrease linearly. The best loss for the validation set was 0.95, whereas the best loss for the training set was 0.9.
When the ResNet50 architecture was used instead, relatively similar performance was obtained. Using 50 epochs, it can be noticed from Table 4 that the best F1 was 0.7 for the validation set and 0.785 for the training set. As for the loss, it reached 0.8 for the validation set and 0.59 for the training set, as shown in Figure 5.
Table 5 and Figure 6 provide the Recall per label for the 7-layered model. Table 6 and Figure 7 provide the Precision per label for the 7-layered model. Table 7 and Figure 8 provide the F1 per label for the 7-layered model based on the validation of transfer learning using the pre-trained deep neural network ResNet50. Table 8 and Figure 9 provide the Recall per label for the 7-layered model. Table 9 and Figure 10 provides the precision per label for the 7-layered model. Table 10 and Figure 11 provides the F1 per label for the 7-layered model.
Clearly, the performance of the model varies per label. The best Precision was for the Ahegao label, and the Happy label was next. The worst Precision was for the Sad label, and the neutral label was next. As for the Recall, the best Recall was for the Contempt label, followed by Ahegao; the worst Recall was for the Fear label, followed by Angry. Regarding the F1, the labels are ranked as follows:
A h e g a o C o n t e m p t a n d H a p p y S u r p r i s e N e u t r a l D i s g u s t a n d A n g r y F e a r
The variance of the performance per label can be attributed to the difficulty of the emotion. For example, the Happy emotion is much more evident than the Fear emotion. Therefore, it is easier for the classifier to detect the Happy emotion.
We conducted more experiments to study the effect of the number of samples per label on the performance. Based on the achieved results with the 7-layered model, Table 11 provides the F1 for each label along with the corresponding number of samples. Figure 12 and  Figure 13 illustrates the F1 for each label and the corresponding number of samples, respectively. For the results achieved using the pre-trained deep NN (ResNet50) model, Table 12 provides the F1 for each label along with the corresponding number of samples. Figure 14 and  Figure 15 illustrate the F1 for each label and the corresponding number of samples, respectively.
Unexpectedly, the number of samples did not have much effect on the performance. The four best F1 values were for a set of labels with various numbers of samples. To study the effect of the number of batches, we conducted a further set of experiments using batch size values increasing gradually from 32 to 128 using 10 epochs on the 7-layered model. The results are provided in Table 13 and Figure 16.
From these results, it is noticeable that changing the batch size can slightly change the performance of the deep learning method. The best batch size ranged from 32–64.

5. Discussion

This study aims to analyze the acceptance of technology by students and how it affects achievements based on emotions after participating in an online course. A survey of 271 students (119 registered in face-to-face instruction, 252 registered in an online course) revealed a higher level of positive emotions than negative emotions.
Online course students had higher levels of aheago, anger, contempt, and disgust but less happy and surprise. Furthermore, the results show that students in online courses reported significantly higher grades, as technological achievements related significantly with class enjoyment.
Based on a five-point scale survey (1 = not related; 5 = very related), the following nine emotions were measured: ahegao, anger, contempt, happiness, fear, disgust, neutrality, surprise, and sad. The emotions varied in terms of valence and activation: positive activating, negative activating, positive deactivating (not measured), and negative deactivating.
For the assessment scales to show important connections with student emotions, both control and value scales and technology-related beliefs and age were included as covariates in further analyses of variance. An in-depth analysis was conducted to assess differences in students’ grades for both online and face-to-face education.
Based on analyzing the conducted survey, the covariate effects can explain significant differences in students’ negative emotions in both online and face-to-face education. Surprisingly, for domain-specific achievement, neither the main effect nor the covariates showed significant effects, although the t-test confirmed a significant difference between the groups.
The purpose of this research was to analyze to what extent there are differences in the experiences of specific teachers’ students with respective to how their achievement is related to individual emotions; this has been evaluated by comparing students who attended the course physically with those who attended it virtually. As a result of what we conducted here, students with positive emotions have more benefits than those with negative emotions in university courses in education.
Further results regarding emotions and their appraisals showed that achievement task value was rated higher in the on-campus group, while technological control was higher in the online group. Consequently, domain-specific achievement was higher in the on-campus group. This supports the previous assumption that for some students, it seems to be difficult to learn to self-regulate.
In sum, it has been shown in this study that the learning environment might affect student achievement task value and technological control. On the other hand, the results indicate that the learning environment (i.e., online vs. face-to-face) seemed to have only weak effects on student achievement in this study.

6. Conclusions and Future Work

In this work, we propose the use of emotion detection in education. This work aims to improve educational outcomes by finding the hidden emotions of students. In order to detect emotions, we propose to use deep learning as a result of its wide use and excellent performance. In detail, we propose to use ResNet50 and a 7-layer model. After comparing the two models using various parameters, it was clear that these models performed efficiently and proved their ability to detect emotions correctly. The best-obtained F1 was 0.63 for the 7-layered model and 0.7 for ResNet50 for the validation data. As expected, the F1 measurement for the training data was slightly higher due to overfitting. Performance varied slightly when changing some deep learning parameters, such as the number of epochs and the batch size.
In future work, more architectures can be compared. Additionally, parameters of the deep neural network can be further optimized. Moreover, the use of pre-trained models can be further studied and compared with non-trained deep architectures. In addition, image enhancement techniques can help improve detection accuracy by emphasizing the essential features.
Here are some challenges and future targets: It is unclear how often the engagement detection decision should be made. What is the maximum duration of a video clip that can be assigned to a single level in the case of a short fragment? It is uncertain what criterion should be used when classifying training data.        

Author Contributions

Conceptualization, S.A., A.Z. and S.A.S.; methodology, S.A. and B.H.; software, A.M. and S.A.; validation, S.A., K.H.A. and L.A.; formal analysis, S.A.S. and B.H.; investigation, L.A., A.M. and S.A.; resources, S.A.S.; data curation, S.A.S. and K.H.A.; writing—original draft preparation, S.A., K.H.A. and B.H.; writing—review and editing, S.A., R.A.Z. and B.H.; visualization, R.A.Z., A.Z., L.A., K.H.A. and A.M.; supervision, L.A. and B.H.; project administration, S.A.; funding acquisition, S.A. and R.A.Z. All authors of this research have contributed equally in this paper. All authors have read and agreed to the published version of the manuscript.

Funding

This research received no external funding.

Institutional Review Board Statement

Not applicable.

Informed Consent Statement

Not applicable.

Data Availability Statement

All data used in this research will be available upon request.

Acknowledgments

The authors would like to thank the Deanship of Scientific Research at Umm Al-Qura University for supporting this work through grant (22UQU4320277DSR11).

Conflicts of Interest

The authors declare no conflict of interest.

References

  1. Walker, S.A.; Double, K.S.; Kunst, H.; Zhang, M.; MacCann, C. Emotional intelligence and attachment in adulthood: A meta-analysis. Personal. Individ. Differ. 2022, 184, 111174. [Google Scholar] [CrossRef]
  2. Ghanem, B.; Rosso, P.; Rangel, F. An emotional analysis of false information in social media and news articles. ACM Trans. Internet Technol. (TOIT) 2020, 20, 1–18. [Google Scholar] [CrossRef]
  3. Radlak, K.; Smolka, B. A novel approach to the eye movement analysis using a high speed camera. In Proceedings of the 2012 2nd International Conference on Advances in Computational Tools for Engineering Applications (ACTEA), Beirut, Lebanon, 12–15 December 2012; IEEE: Piscataway, NJ, USA, 2012; pp. 145–150. [Google Scholar]
  4. Whitehill, J.; Serpell, Z.; Lin, Y.C.; Foster, A.; Movellan, J.R. The faces of engagement: Automatic recognition of student engagementfrom facial expressions. IEEE Trans. Affect. Comput. 2014, 5, 86–98. [Google Scholar] [CrossRef]
  5. Olsson, A.; Ochsner, K.N. The role of social cognition in emotion. Trends Cogn. Sci. 2008, 12, 65–71. [Google Scholar] [CrossRef] [PubMed]
  6. Sandbach, G.; Zafeiriou, S.; Pantic, M.; Yin, L. Static and dynamic 3D facial expression recognition: A comprehensive survey. Image Vis. Comput. 2012, 30, 683–697. [Google Scholar] [CrossRef]
  7. Motley, M.T.; Camden, C.T. Facial expression of emotion: A comparison of posed expressions versus spontaneous expressions in an interpersonal communication setting. West. J. Commun. (Includes Commun. Rep.) 1988, 52, 1–22. [Google Scholar] [CrossRef]
  8. Brown, S.P.; Lam, S.K. A meta-analysis of relationships linking employee satisfaction to customer responses. J. Retail. 2008, 84, 243–255. [Google Scholar] [CrossRef]
  9. Park, E.; Jang, Y.; Kim, J.; Jeong, N.J.; Bae, K.; Del Pobil, A.P. Determinants of customer satisfaction with airline services: An analysis of customer feedback big data. J. Retail. Consum. Serv. 2019, 51, 186–190. [Google Scholar] [CrossRef]
  10. Lou, Y.; Zhang, Y.; Li, F.; Qian, T.; Ji, D. Emoji-based sentiment analysis using attention networks. Acm Trans. Asian -Low-Resour. Lang. Inf. Process. (TALLIP) 2020, 19, 1–13. [Google Scholar] [CrossRef]
  11. Rodrigo-Ruiz, D. Effect of teachers’ emotions on their students: Some evidence. J. Educ. Soc. Policy 2016, 3, 73–79. [Google Scholar]
  12. Wang, M.; Deng, W. Deep face recognition: A survey. Neurocomputing 2021, 429, 215–244. [Google Scholar] [CrossRef]
  13. Adjabi, I.; Ouahabi, A.; Benzaoui, A.; Taleb-Ahmed, A. Past, Present, and Future of Face Recognition: A Review. Electronics 2020, 9, 1188. [Google Scholar] [CrossRef]
  14. Abualigah, L.; Kareem, N.K.; Omari, M.; Elaziz, M.A.; Gandomi, A.H. Survey on Twitter Sentiment Analysis: Architecture, Classifications, and Challenges. In Deep Learning Approaches for Spoken and Natural Language Processing; Springer: Berlin/Heidelberg, Germany, 2021; pp. 1–18. [Google Scholar]
  15. Abualigah, L.; Alfar, H.E.; Shehab, M.; Hussein, A.M.A. Sentiment analysis in healthcare: A brief review. In Recent Advances in NLP: The Case of Arabic Language; 2020; pp. 129–141. [Google Scholar]
  16. Ransan-Cooper, H.; Lovell, H.; Watson, P.; Harwood, A.; Hann, V. Frustration, confusion and excitement: Mixed emotional responses to new household solar-battery systems in Australia. Energy Res. Soc. Sci. 2020, 70, 101656. [Google Scholar] [CrossRef]
  17. Solomon, R.C. On emotions as judgments. Am. Philos. Q. 1988, 25, 183–191. [Google Scholar]
  18. Torre, J.B.; Lieberman, M.D. Putting feelings into words: Affect labeling as implicit emotion regulation. Emot. Rev. 2018, 10, 116–124. [Google Scholar] [CrossRef]
  19. Zhang, J.; Chen, K.; Zheng, J. Facial expression retargeting from human to avatar made easy. IEEE Trans. Vis. Comput. Graph. 2020, 28, 1274–1287. [Google Scholar] [CrossRef]
  20. Yagi, S.; Nakata, Y.; Nakamura, Y.; Ishiguro, H. Can an android’s posture and movement discriminate against the ambiguous emotion perceived from its facial expressions? PLoS ONE 2021, 16, e0254905. [Google Scholar] [CrossRef]
  21. He, Y.; Choi, C.Y. A Study of Facial Expression of Digital Character with Muscle Simulation System. Int. J. Adv. Smart Converg. 2019, 8, 162–169. [Google Scholar]
  22. Alzubi, S.; Hawashin, B.; Mughaid, A.; Jararweh, Y. Whats Trending? An Efficient Trending Research Topics Extractor and Recommender. In Proceedings of the 2020 11th International Conference on Information and Communication Systems (ICICS), Virtual, 7–9 April 2020; IEEE: Piscataway, NJ, USA, 2020; pp. 191–196. [Google Scholar]
  23. Corcoran, R.P.; Cheung, A.C.; Kim, E.; Xie, C. Effective universal school-based social and emotional learning programs for improving academic achievement: A systematic review and meta-analysis of 50 years of research. Educ. Res. Rev. 2018, 25, 56–72. [Google Scholar] [CrossRef]
  24. Chen, C.H.; Yang, Y.C. Revisiting the effects of project-based learning on students’ academic achievement: A meta-analysis investigating moderators. Educ. Res. Rev. 2019, 26, 71–81. [Google Scholar] [CrossRef]
  25. Ekman, P.; Friesen, W.V. Facial action coding system. Environ. Psychol. Nonverbal Behav. 1978. [Google Scholar]
  26. Littlewort, G.; Whitehill, J.; Wu, T.; Fasel, I.; Frank, M.; Movellan, J.; Bartlett, M. The computer expression recognition toolbox (CERT). In Proceedings of the 2011 IEEE International Conference on Automatic Face & Gesture Recognition (FG), Santa Barbara, CA, USA, 21–25 March 2011; IEEE: Piscataway, NJ, USA, 2011; pp. 298–305. [Google Scholar]
  27. Hewson, E.R. Students’ emotional engagement, motivation and behaviour over the life of an online course: Reflections on two market research case studies. J. Interact. Media Educ. 2018, 1. [Google Scholar] [CrossRef]
  28. Bieniek-Tobasco, A.; McCormick, S.; Rimal, R.N.; Harrington, C.B.; Shafer, M.; Shaikh, H. Communicating climate change through documentary film: Imagery, emotion, and efficacy. Clim. Chang. 2019, 154, 1–18. [Google Scholar] [CrossRef]
  29. Hong, W.; Bernacki, M.L.; Perera, H.N. A latent profile analysis of undergraduates’ achievement motivations and metacognitive behaviors, and their relations to achievement in science. J. Educ. Psychol. 2020, 112, 1409. [Google Scholar] [CrossRef]
  30. Anis, M.Z.A.; Susanto, H.; Mardiani, F. Analysis of the Effectiveness of MPBH: The Mains of Mandai as a Saving Food in Banjarmasin Community. In Proceedings of the 2nd International Conference on Social Sciences Education (ICSSE 2020), Virtually, 24-27 September 2020; Atlantis Press: Amsterdam, The Netherlands, 2021; pp. 89–94. [Google Scholar]
  31. Danişman, Ş.; Güler, M.; Karadağ, E. The Effect of Teacher Characteristics on Student Achievement: A Meta-Analysis Study. Croat. J. Educ. 2019, 21, 1367–1398. [Google Scholar]
  32. Smale-Jacobse, A.E.; Meijer, A.; Helms-Lorenz, M.; Maulana, R. Differentiated instruction in secondary education: A systematic review of research evidence. Front. Psychol. 2019, 10, 2366. [Google Scholar] [CrossRef]
  33. Bitler, M.; Corcoran, S.; Domina, T.; Penner, E. Teacher Effects on Student Achievement and Height: A Cautionary Tale. NBER Working Paper No. 26480. Natl. Bur. Econ. Res. 2019, 14, 900–924. [Google Scholar]
  34. Abdallah, M.; Jaber, K.M.; Salah, M.; Jawad, M.A.; AlQbailat, N.; Abdalla, A. An E-learning Portal Quality Model: From Al-Zaytoonah University Students’ Perspective. In Proceedings of the 2021 International Conference on Information Technology (ICIT), Amman, Jordan, 14–15 July 2021; IEEE: Piscataway, NJ, USA, 2021; pp. 553–557. [Google Scholar]
  35. Jaber, K.M.; Abduljawad, M.; Ahmad, A.; Abdallah, M.; Salah, M.; Alhindawi, N. E-learning Mobile Application Evaluation: Al-Zaytoonah University as a Case Study. Int. J. Adv. Soft Comput. Its Appl. 2021, 3, 13. [Google Scholar] [CrossRef]
  36. Maqableh, M.; Alia, M. Evaluation online learning of undergraduate students under lockdown amidst COVID-19 Pandemic: The online learning experience and students’ satisfaction. Child. Youth Serv. Rev. 2021, 128, 106160. [Google Scholar] [CrossRef]
  37. H’mida, C.; Kalyuga, S.; Souissi, N.; Rekik, G.; Jarraya, M.; Khacharem, A. Is the human movement effect stable over time? The effects of presentation format on acquisition and retention of a motor skill. J. Comput. Assist. Learn. 2022, 38, 167–177. [Google Scholar] [CrossRef]
  38. Nikam, R.D.; Lee, J.; Choi, W.; Banerjee, W.; Kwak, M.; Yadav, M.; Hwang, H. Ionic Sieving Through One-Atom-Thick 2D Material Enables Analog Nonvolatile Memory for Neuromorphic Computing. Small 2021, 17, 2103543. [Google Scholar] [CrossRef] [PubMed]
  39. Marini, M.; Ansani, A.; Paglieri, F.; Caruana, F.; Viola, M. The impact of facemasks on emotion recognition, trust attribution and re-identification. Sci. Rep. 2021, 11, 1–14. [Google Scholar] [CrossRef] [PubMed]
  40. Gupta, V.; Jain, N.; Katariya, P.; Kumar, A.; Mohan, S.; Ahmadian, A.; Ferrara, M. An emotion care model using multimodal textual analysis on COVID-19. Chaos Solitons Fractals 2021, 144, 110708. [Google Scholar] [CrossRef]
  41. Indira, D. An Enhanced CNN-2D for Audio-Visual Emotion Recognition (AVER) Using ADAM Optimizer. Turk. J. Comput. Math. Educ. (TURCOMAT) 2021, 12, 1378–1388. [Google Scholar]
  42. Fei, Z.; Yang, E.; Li, D.D.U.; Butler, S.; Ijomah, W.; Li, X.; Zhou, H. Deep convolution network based emotion analysis towards mental health care. Neurocomputing 2020, 388, 212–227. [Google Scholar] [CrossRef]
  43. McDuff, D.; Rowan, K.; Choudhury, P.; Wolk, J.; Pham, T.; Czerwinski, M. A multimodal emotion sensing platform for building emotion-aware applications. arXiv 2019, arXiv:1903.12133. [Google Scholar]
  44. Jain, N.; Gupta, V.; Shubham, S.; Madan, A.; Chaudhary, A.; Santosh, K. Understanding cartoon emotion using integrated deep neural network on large dataset. Neural Comput. Appl. 2021, 1–21. [Google Scholar] [CrossRef]
  45. Patel, F.; Patel, N.; Bharti, S.K. Lie-Sensor: A Live Emotion Verifier or a Licensor for Chat Applications using Emotional Intelligence. arXiv 2021, arXiv:2102.11318. [Google Scholar]
  46. COSTACHE, A.; POPESCU, D. Emotion Sketches: Facial Expression Recognition in Diversity Groups. Sci. Bull. 2021, 83, 29–40. [Google Scholar]
  47. Kim, C.M.; Kim, K.H.; Lee, Y.S.; Chung, K.; Park, R.C. Real-time streaming image based PP2LFA-CRNN model for facial sentiment analysis. IEEE Access 2020, 8, 199586–199602. [Google Scholar] [CrossRef]
  48. Zamani, H.; Abas, A.; Amin, M. Eye tracking application on emotion analysis for marketing strategy. J. Telecommun. Electron. Comput. Eng. (JTEC) 2016, 8, 87–91. [Google Scholar]
  49. Qamar, S.; Mujtaba, H.; Majeed, H.; Beg, M.O. Relationship identification between conversational agents using emotion analysis. Cogn. Comput. 2021, 13, 673–687. [Google Scholar] [CrossRef]
  50. Sonawane, B.; Sharma, P. Review of automated emotion-based quantification of facial expression in Parkinson’s patients. Vis. Comput. 2021, 37, 1151–1167. [Google Scholar] [CrossRef]
  51. Garcia-Garcia, J.M.; Penichet, V.M.; Lozano, M.D.; Fernando, A. Using emotion recognition technologies to teach children with autism spectrum disorder how to identify and express emotions. Univers. Access Inf. Soc. 2021, 1–17. [Google Scholar] [CrossRef]
  52. Chen, W.; Wang, J.; Yu, F.; He, J.; Xu, W.; Wang, R. Effects of emotion on the evolution of cooperation in a spatial prisoner’s dilemma game. Appl. Math. Comput. 2021, 411, 126497. [Google Scholar] [CrossRef]
  53. Pizarro, R.; Bekios-Calfa, J. Emotion recognition using multimodal matchmap fusion and multi-task learning. Iet Digit. Libr. 2021. [Google Scholar]
  54. Khaireddin, Y.; Chen, Z. Facial emotion recognition: State of the art performance on FER2013. arXiv 2021, arXiv:2105.03588. [Google Scholar]
  55. Alzu’bi, S.; Badarneh, O.; Hawashin, B.; Al-Ayyoub, M.; Alhindawi, N.; Jararweh, Y. Multi-label emotion classification for Arabic tweets. In Proceedings of the 2019 Sixth International Conference on Social Networks Analysis, Management and Security (SNAMS), Granada, Spain, 22–25 October 2019; IEEE: Piscataway, NJ, USA, 2019; pp. 499–504. [Google Scholar]
  56. Kozareva, Z.; Navarro, B.; Vázquez, S.; Montoyo, A. UA-ZBSA: A headline emotion classification through web information. In Proceedings of the Fourth International Workshop on Semantic Evaluations (SemEval-2007), Prague, Czech Republic, 23–24 June 2007; pp. 334–337. [Google Scholar]
  57. Hatzivassiloglou, V.; McKeown, K. Predicting the semantic orientation of adjectives. In Proceedings of the 35th Annual Meeting of the Association for Computational Linguistics and 8th Conference of the European Chapter of the Association for Computational Linguistics, Madrid, Spain, 7–12 July 1997; pp. 174–181. [Google Scholar]
  58. Chaffar, S.; Inkpen, D. Using a heterogeneous dataset for emotion analysis in text. In Canadian Conference on Artificial Intelligence; Springer: Berlin/Heidelberg, Germany, 2011; pp. 62–67. [Google Scholar]
  59. Jayalekshmi, J.; Mathew, T. Facial expression recognition and emotion classification system for sentiment analysis. In Proceedings of the 2017 International Conference on Networks & Advances in Computational Technologies (NetACT), Thiruvananthapuram, India, 20–22 July 2017; IEEE: Piscataway, NJ, USA, 2017; pp. 1–8. [Google Scholar]
  60. Song, Z. Facial Expression Emotion Recognition Model Integrating Philosophy and Machine Learning Theory. Front. Psychol. 2021, 12. [Google Scholar] [CrossRef]
  61. Koolagudi, S.G.; Rao, K.S. Emotion recognition from speech: A review. Int. J. Speech Technol. 2012, 15, 99–117. [Google Scholar] [CrossRef]
  62. Wang, S. Online Learning Behavior Analysis Based on Image Emotion Recognition. Trait. Signal 2021, 38. [Google Scholar] [CrossRef]
  63. Mills, K.; Creedy, D.K.; Sunderland, N.; Allen, J. Examining the transformative potential of emotion in education: A new measure of nursing and midwifery students’ emotional learning in first peoples’ cultural safety. Nurse Educ. Today 2021, 100, 104854. [Google Scholar] [CrossRef] [PubMed]
  64. Ali, M.; Mosa, A.H.; Al Machot, F.; Kyamakya, K. EEG-based emotion recognition approach for e-healthcare applications. In Proceedings of the 2016 Eighth International Conference on Ubiquitous and Future Networks (Icufn), Vienna, Austria, 5–8 July 2016; IEEE: Piscataway, NJ, USA, 2016; pp. 946–950. [Google Scholar]
  65. Moroto, Y.; Maeda, K.; Ogawa, T.; Haseyama, M. Human Emotion Estimation Using Multi-Modal Variational AutoEncoder with Time Changes. In Proceedings of the 2021 IEEE 3rd Global Conference on Life Sciences and Technologies (LifeTech), Nara, Japan, 9–11 March 2021; IEEE: Piscataway, NJ, USA, 2021; pp. 67–68. [Google Scholar]
  66. Sharma, P.; Joshi, S.; Gautam, S.; Maharjan, S.; Filipe, V.; Reis, M.J. Student engagement detection using emotion analysis, eye tracking and head movement with machine learning. arXiv 2019, arXiv:1909.12913. [Google Scholar]
  67. Danandeh Mehr, A.; Rikhtehgar Ghiasi, A.; Yaseen, Z.M.; Sorman, A.U.; Abualigah, L. A novel intelligent deep learning predictive model for meteorological drought forecasting. J. Ambient. Intell. Humaniz. Comput. 2022, 1–15. [Google Scholar] [CrossRef]
  68. Sumari, P.; Syed, S.J.; Abualigah, L. A novel deep learning pipeline architecture based on CNN to detect Covid-19 in chest X-ray images. Turk. J. Comput. Math. Educ. (TURCOMAT) 2021, 12, 2001–2011. [Google Scholar]
  69. AlZu’bi, S.; Jararweh, Y.; Al-Zoubi, H.; Elbes, M.; Kanan, T.; Gupta, B. Multi-orientation geometric medical volumes segmentation using 3d multiresolution analysis. Multimed. Tools Appl. 2018, 1–26. [Google Scholar] [CrossRef]
  70. Al-Zu’bi, S.; Hawashin, B.; Mughaid, A.; Baker, T. Efficient 3D medical image segmentation algorithm over a secured multimedia network. Multimed. Tools Appl. 2021, 80, 16887–16905. [Google Scholar] [CrossRef]
  71. Hawashin, B.; Aqel, D.; Alzubi, S.; Elbes, M. Improving recommender systems using co-appearing and semantically correlated user interests. Recent Adv. Comput. Sci. Commun. (Formerly: Recent Patents Comput. Sci.) 2020, 13, 240–247. [Google Scholar] [CrossRef]
  72. AlZu’bi, S.; Aqel, D.; Mughaid, A.; Jararweh, Y. A multi-levels geo-location based crawling method for social media platforms. In Proceedings of the 2019 Sixth International Conference on Social Networks Analysis, Management and Security (SNAMS), Granada, Spain, 22–25 October 2019; IEEE: Piscataway, NJ, USA, 2019; pp. 494–498. [Google Scholar]
  73. Elbes, M.; Alrawashdeh, T.; Almaita, E.; AlZu’bi, S.; Jararweh, Y. A platform for power management based on indoor localization in smart buildings using long short-term neural networks. Trans. Emerg. Telecommun. Technol. 2020, e3867. [Google Scholar] [CrossRef]
  74. AlZu’bi, S.; AlQatawneh, S.; ElBes, M.; Alsmirat, M. Transferable HMM probability matrices in multi-orientation geometric medical volumes segmentation. Concurr. Comput. Pract. Exp. 2019, 32, e5214. [Google Scholar] [CrossRef]
  75. Alasal, S.A.; Alsmirat, M.; Baker, Q.B.; Alzu’bi, S. Lumbar disk 3D modeling from limited number of MRI axial slices. Int. J. Electr. Comput. Eng. 2020, 10, 4101. [Google Scholar]
  76. Alsarayreh, M.A.; Alia, M.A.; Maria, K.A. A novel image steganographic system based on exact matching algorithm and key-dependent data technique. J. Theor. Appl. Inf. Technol. 2017, 95. [Google Scholar]
  77. Alqatawneh, S.; Jaber, K.M.; Salah, M.; Yehia, D.B.; Alqatawneh, O. Employing of Object Tracking System in Public Surveillance Cameras to Enforce Quarantine and Social Distancing Using Parallel Machine Learning Techniques. Int. J. Adv. Soft Comput. Its Appl. 2021, 13. [Google Scholar] [CrossRef]
  78. Rezaee, H.; Aghagolzadeh, A.; Seyedarabi, M.H.; Al Zu’bi, S. Tracking and occlusion handling in multi-sensor networks by particle filter. In Proceedings of the 2011 IEEE GCC Conference and Exhibition (GCC), Dubai, United Arab Emirates, 19–22 February 2011; IEEE: Piscataway, NJ, USA, 2011; pp. 397–400. [Google Scholar]
  79. Muhairat, M.; ALZu’bi, S.; Hawashin, B.; Elbes, M.; Al-Ayyoub, M. An Intelligent Recommender System Based on Association Rule Analysis for Requirement Engineering. J. Univers. Comput. Sci. 2020, 26, 33–49. [Google Scholar] [CrossRef]
  80. Lafi, M.; Hawashin, B.; AlZu’bi, S. Maintenance requests labeling using machine learning classification. In Proceedings of the 2020 Seventh International Conference on Software Defined Systems (SDS), Paris, France, 20–23 April 2020; IEEE: Piscataway, NJ, USA, 2020; pp. 245–249. [Google Scholar]
  81. Alsmadi, A.; AlZu’bi, S.; Hawashin, B.; Al-Ayyoub, M.; Jararweh, Y. Employing deep learning methods for predicting helpful reviews. In Proceedings of the 2020 11th International Conference on Information and Communication Systems (ICICS), Irbid, Jordan, 7–9 April 2020; IEEE: Piscataway, NJ, USA, 2020; pp. 7–12. [Google Scholar]
  82. Maria, K.A.; Zitar, R.A. Emotional agents: A modeling and an application. Inf. Softw. Technol. 2007, 49, 695–716. [Google Scholar] [CrossRef]
  83. Aqel, D.; Al-Zubi, S.; Mughaid, A.; Jararweh, Y. Extreme learning machine for plant diseases classification: A sustainable approach for smart agriculture. Clust. Comput. 2021, 1–14. [Google Scholar] [CrossRef]
  84. AlZu’bi, S.; Hawashin, B.; Mujahed, M.; Jararweh, Y.; Gupta, B.B. An efficient employment of internet of multimedia things in smart and future agriculture. Multimed. Tools Appl. 2019, 78, 29581–29605. [Google Scholar] [CrossRef]
  85. Alkhatib, K.; Khazaleh, H.; Alkhazaleh, H.A.; Alsoud, A.R.; Abualigah, L. A New Stock Price Forecasting Method Using Active Deep Learning Approach. J. Open Innov. Technol. Mark. Complex. 2022, 8, 96. [Google Scholar] [CrossRef]
Figure 1. A sample of teachers’ emotions in the classroom.
Electronics 11 02964 g001
Figure 2. Proposed emotional impact detection system.
Electronics 11 02964 g002
Figure 3. A sample of the implemented dataset.
Electronics 11 02964 g003
Figure 4. F1 measure and loss for training and validation stages using 7-layered deep neural network.
Electronics 11 02964 g004
Figure 5. F1 measure and loss for training and validation stages using ResNet50.
Electronics 11 02964 g005
Figure 6. Recall per label for the 7-layered model.
Electronics 11 02964 g006
Figure 7. Precision per label for the 7-layered model.
Electronics 11 02964 g007
Figure 8. F1 measure per label for the 7-layered model.
Electronics 11 02964 g008
Figure 9. Recall per label for the pre-trained deep NN (ResNet59).
Electronics 11 02964 g009
Figure 10. Precision per label for the pre-trained deep NN (ResNet59).
Electronics 11 02964 g010
Figure 11. F1 measure per label for the pre-trained deep NN (ResNet59).
Electronics 11 02964 g011
Figure 12. F1 measure for each label.
Electronics 11 02964 g012
Figure 13. The corresponding number of samples for each label.
Electronics 11 02964 g013
Figure 14. F1 measure for each label using ResNet50 model.
Electronics 11 02964 g014
Figure 15. The corresponding number of samples for each label using ResNet50 model.
Electronics 11 02964 g015
Figure 16. Results based on batch size.
Electronics 11 02964 g016
Table 1. Number of dataset images used for training vs. testing.
Emotion LabelTotal ImagesImages/Feature
TrainingTesting
Aheago1205964241
Anger732158561465
Contempt20816642
Disgust1015812203
Fear579846381160
Happy14,37311,4982875
Neutral10,77986232156
Sad10,87286972175
Surprise629050321258
Total57,86146,28611,575
Table 2. Confusion Matrix.
Positive (1)Negative (0)
Predicted Positive (1)True Positives (TPs)False Positive (FPs)
Predicted Negative (0)False Negatives (FNs)True Negatives (TNs)
Table 3. Accuracy of EA using 7-layered deep neural network and multiple epochs.
EpochTraining F1Validation F1Training LossValidation Loss
100.64500.62500.95001.0000
200.65000.62900.94000.9800
300.65700.63300.93000.9700
400.66300.63700.91000.9600
500.67300.64000.90000.9500
Table 4. Accuracy of EA using ResNet50 and multiple epochs.
EpochTraining F1Validation F1Training LossValidation Loss
100.68000.63000.80000.9300
200.71580.69160.76600.8387
300.75030.69500.67110.8200
400.77000.70000.62000.8100
500.78500.70500.59000.8000
Table 5. Recall per label for the 7-layered model.
LabelRecall
Ahegao0.97
Angry0.53
Contempt0.98
Disgust0.55
Fear0.34
Happy0.87
Neutral0.65
Sad0.59
Surprise0.83
Macro Avg0.7
Table 6. Precision per label for the 7-layered model.
LabelPrecision
Ahegao0.96
Angry0.59
Contempt0.76
Disgust0.59
Fear0.55
Happy0.83
Neutral0.57
Sad0.52
Surprise0.74
Macro Avg0.68
Table 7. F1 measure per label for the 7-layered model.
LabelF1
Ahegao0.96
Angry0.56
Contempt0.85
Disgust0.57
Fear0.42
Happy0.85
Neutral0.61
Sad0.55
Surprise0.78
Macro Avg0.68
Table 8. Recall per label for the pre-trained deep NN (ResNet59).
LabelRecall
Ahegao0.94
Angry0.59
Contempt0.67
Disgust0.73
Fear0.58
Happy0.93
Neutral0.66
Sad0.61
Surprise0.78
Macro Avg0.72
Table 9. Precision per label for the pre-trained deep NN (ResNet59).
LabelPrecision
Ahegao0.95
Angry0.71
Contempt0.11
Disgust0.42
Fear0.45
Happy0.85
Neutral0.69
Sad0.69
Surprise0.77
Macro Avg0.63
Table 10. F1 measure per label for the pre-trained deep NN (ResNet59).
LabelF1
Ahegao0.95
Angry0.64
Contempt0.19
Disgust0.53
Fear0.51
Happy0.89
Neutral0.68
Sad0.65
Surprise0.77
Macro Avg0.72
Table 11. F1 for each label along with the corresponding number of samples.
LabelF1Number of Samples
Ahegao96%946
Angry−56%5856
Contempt85%166
Disgust−57%812
Fear−42%4638
Happy85%11,498
Neutral−61%8623
Sad−55%8697
Surprise78%5032
Macro Avg68%46,268
Table 12. F1 for each label along with the corresponding number of samples using ResNet50 model.
LabelF1Number of Samples
Ahegao95%223
Angry−64%1650
Contempt−19%6
Disgust−53%124
Fear−51%896
Happy89%2701
Neutral−68%2297
Sad−65%2419
Surprise−77%1257
Macro Avg72%11,573
Table 13. Results based on batch size.
Batch SizeTraining F1Validation F1
3260%54%
6461%51%
9661%51%
12856%47%
Publisher’s Note: MDPI stays neutral with regard to jurisdictional claims in published maps and institutional affiliations.

