Article

Simulation and Optimization of Piezoelectric Micromachined Ultrasonic Transducer Unit Based on AlN

School of Microelectronics and Control Engineering, Changzhou University, Changzhou 213164, China
*
Author to whom correspondence should be addressed.
Electronics 2022, 11(18), 2915; https://doi.org/10.3390/electronics11182915
Submission received: 12 July 2022 / Revised: 21 August 2022 / Accepted: 31 August 2022 / Published: 14 September 2022
(This article belongs to the Collection Instrumentation, Noise, Reliability)

Abstract

:
The relatively low piezoelectric constant of aluminum nitride (AlN) piezoelectric film limits the development and application of the acoustic field performance of AlN-based micromachined ultrasonic transducers; thus, in this study we establish a mid- to low-frequency transducer unit model to address this problem. The transducer operates at 4.5 MHz, and the construction of a clamped structure is first investigated to ensure the feasibility of performance analysis. Secondly, the effectiveness of the optimized upper electrode distribution proposed in this paper in improving the acoustic field radiation of the array element is also compared with the original structure. Finally, the influence of the optimized electrode geometry parameters on the acoustic wave direction is analyzed. The finite element simulations are performed in the COMSOL Multiphysics (COMSOL) software and post-processing results are analyzed. Based on the simulation results, the proposed optimal distribution of the upper electrode makes the radiation beam uniform and symmetrical in the case of both the clamped model and the optimized structure model. In the case of the upper electrode radius of 28 µm, this electrode division operation makes the unit vibration mode switching in the frequency range more moderate. The sound field radiation improvement of the proposed optimized structure model is better than that of the clamped structure.

1. Introduction

Recently, with the continuous development of ultrasonic technology and the emergence of integrated circuits and microelectromechanical system technology, ultrasonic sensors have been widely used in industry, agriculture, biomedicine, and other industries such as 2D/3D ranging [1], medical imaging detection [2], cleaning and sonication [3], and non-destructive testing [4,5]. According to the functional principle, micromachined ultrasonic transducers can be divided into piezoelectric (piezoelectric micromachined ultrasonic transducers, PMUTs) and capacitive (capacitive micromachined ultrasonic transducers). Compared with the capacitive type, piezoelectric transducers do not require a high bias voltage, thereby reducing the complexity of the circuit. Moreover, they do not require small capacitor gaps, reducing the fabrication complexity; additionally, the low resistance and drive voltage provide long-term reliability.
As an essential component of an ultrasonic system, a micromachined ultrasonic transducer can directly realize the mutual conversion of sound and electrical energy. Compared with the traditional bulk ultrasonic transducer, the novel microelectromechanical system ultrasonic transducer is miniaturized, easy to integrate (with low power consumption), has high reliability and high sensitivity, and is widely used. Despite these advances, PMUTs are yet to achieve the high sound pressure levels (SPLs) and directivity required for automotive parking assistance, medical probes, etc.
Studies on PMUTs have advanced significantly. Research has evolved from the change of the diaphragm shape to the setting of different boundary conditions, from the evolution of the piezoelectric material to the selection of vibration modes, and the transformation of the operating frequency range of the device. The number of studies on PMUTs also varies from single to multiple or even large and high-density arrays. The piezoelectric materials used in PMUTs are mainly lead zirconate titanate [6,7] and aluminum nitride (AlN) [8,9]. Compared with lead zirconate titanate, AlN is an environmentally friendly lead-free piezoelectric material and can be applied to implantable biomedical devices [10,11]. Its lower dielectric constant improves the signal-to-noise ratio, is compatible with standard CMOS processes, and has good acoustic matching [12,13,14].
In this paper, an aluminum nitride PMUT array element morphology with an optimized upper electrode structure is constructed to enhance the acoustic field radiation characteristics of the array element. Firstly, the construction of the clamp structure is studied to ensure the feasibility of the performance analysis. Secondly, the effectiveness of the optimized upper electrode distribution proposed in this paper in improving the sound field radiation of the array elements is also compared with the original structure. Thirdly, the influence of the optimized electrode geometry parameters on the acoustic wave direction is analyzed. Finite element simulations are performed in COMSOL Multiphysics (COMSOL) software and post-processing results are analyzed. In the case of the upper electrode radius of 28 µm, this electrode division operation makes the unit vibration mode switching in the frequency range more moderate, indicating that the designed upper electrode structure can effectively improve the acoustic field radiation characteristics of the array element.

2. Design and Modeling

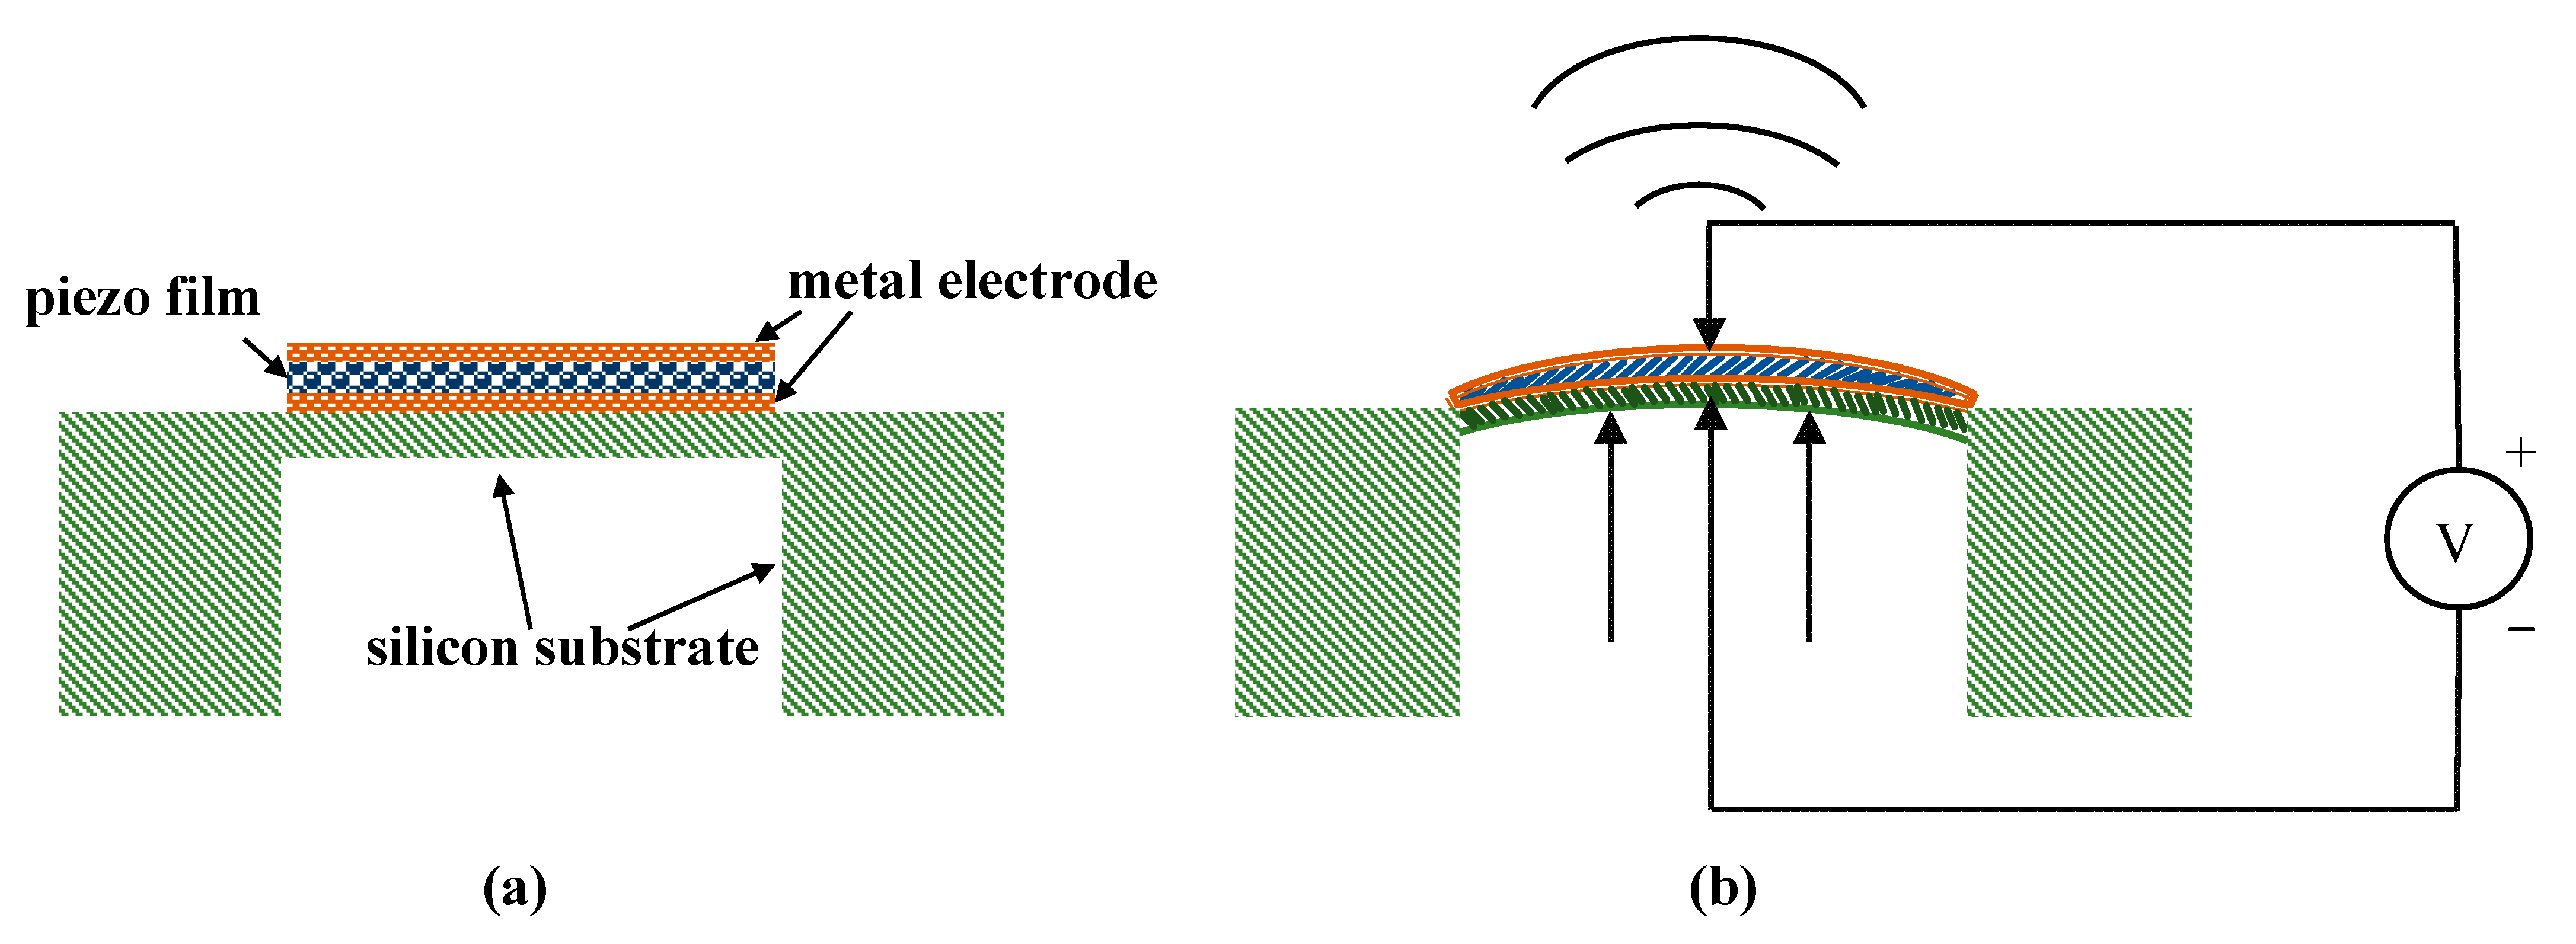
2.1. Piezoelectric Effect
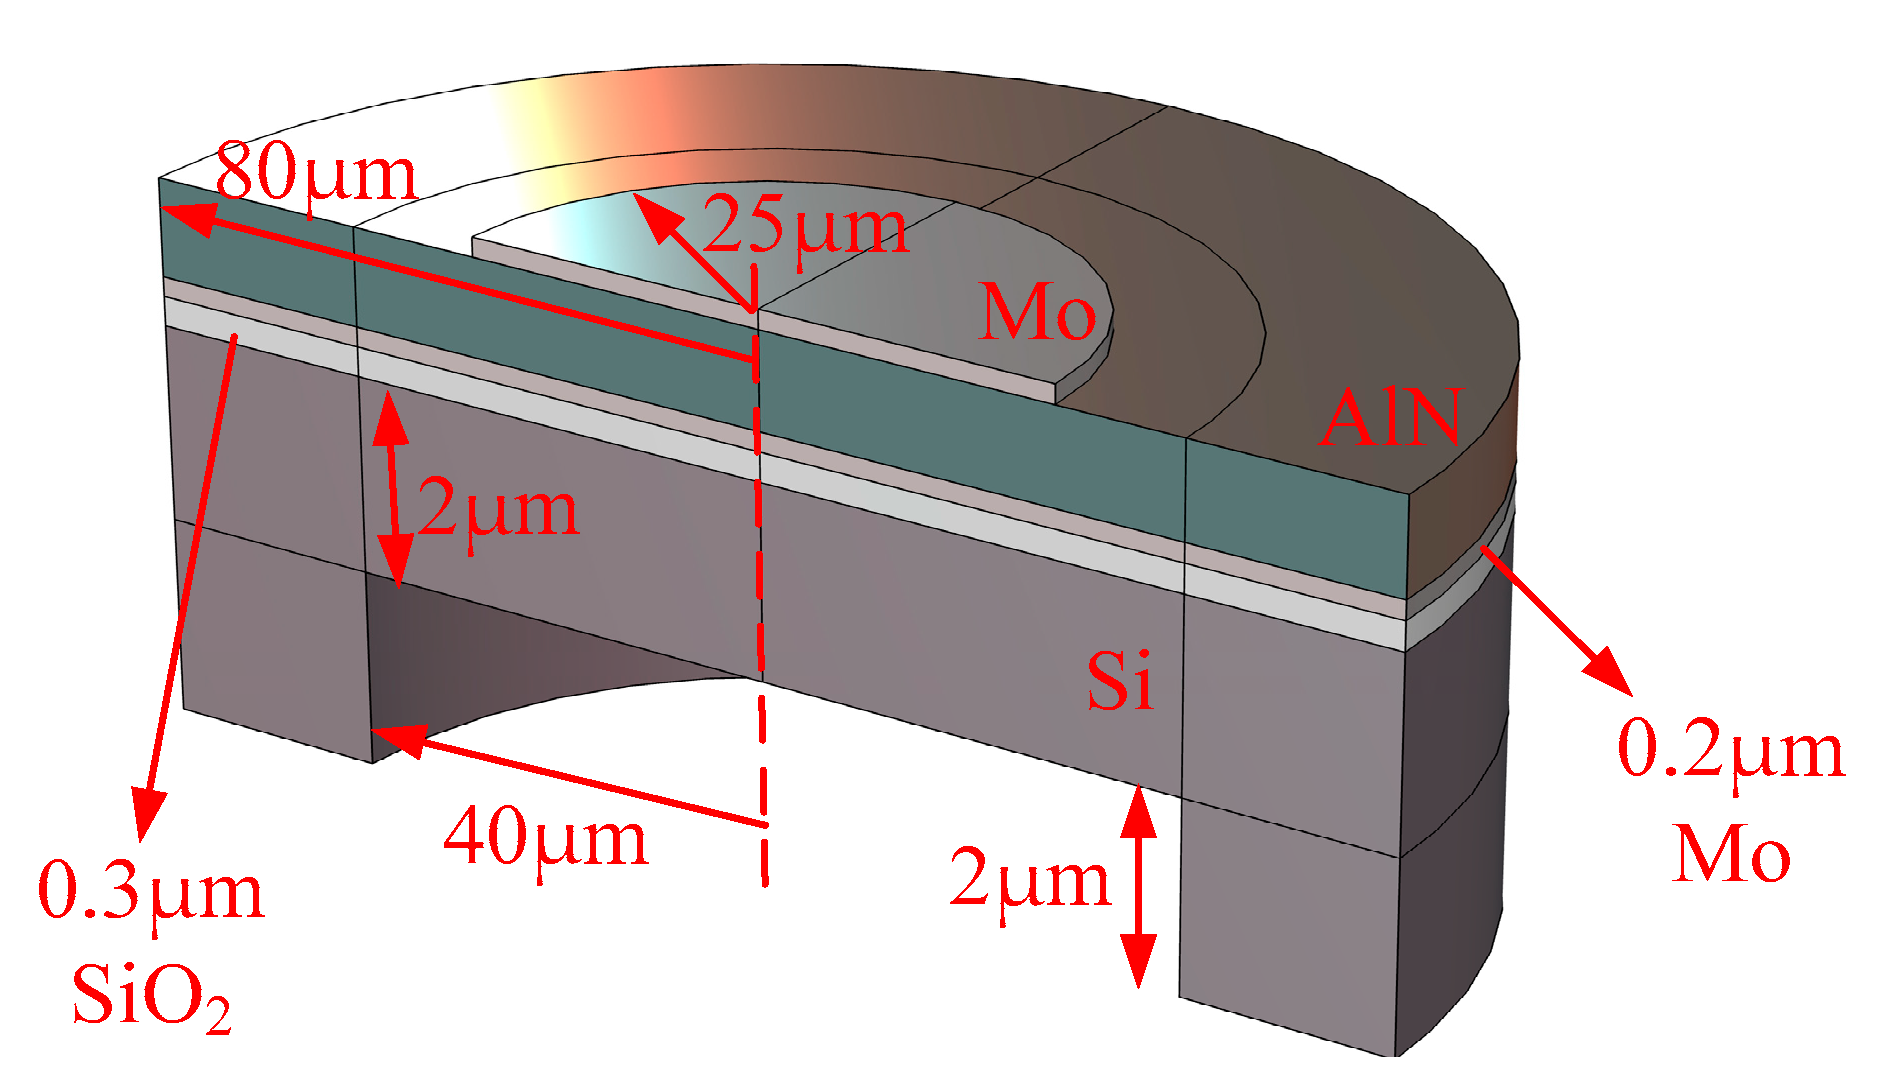
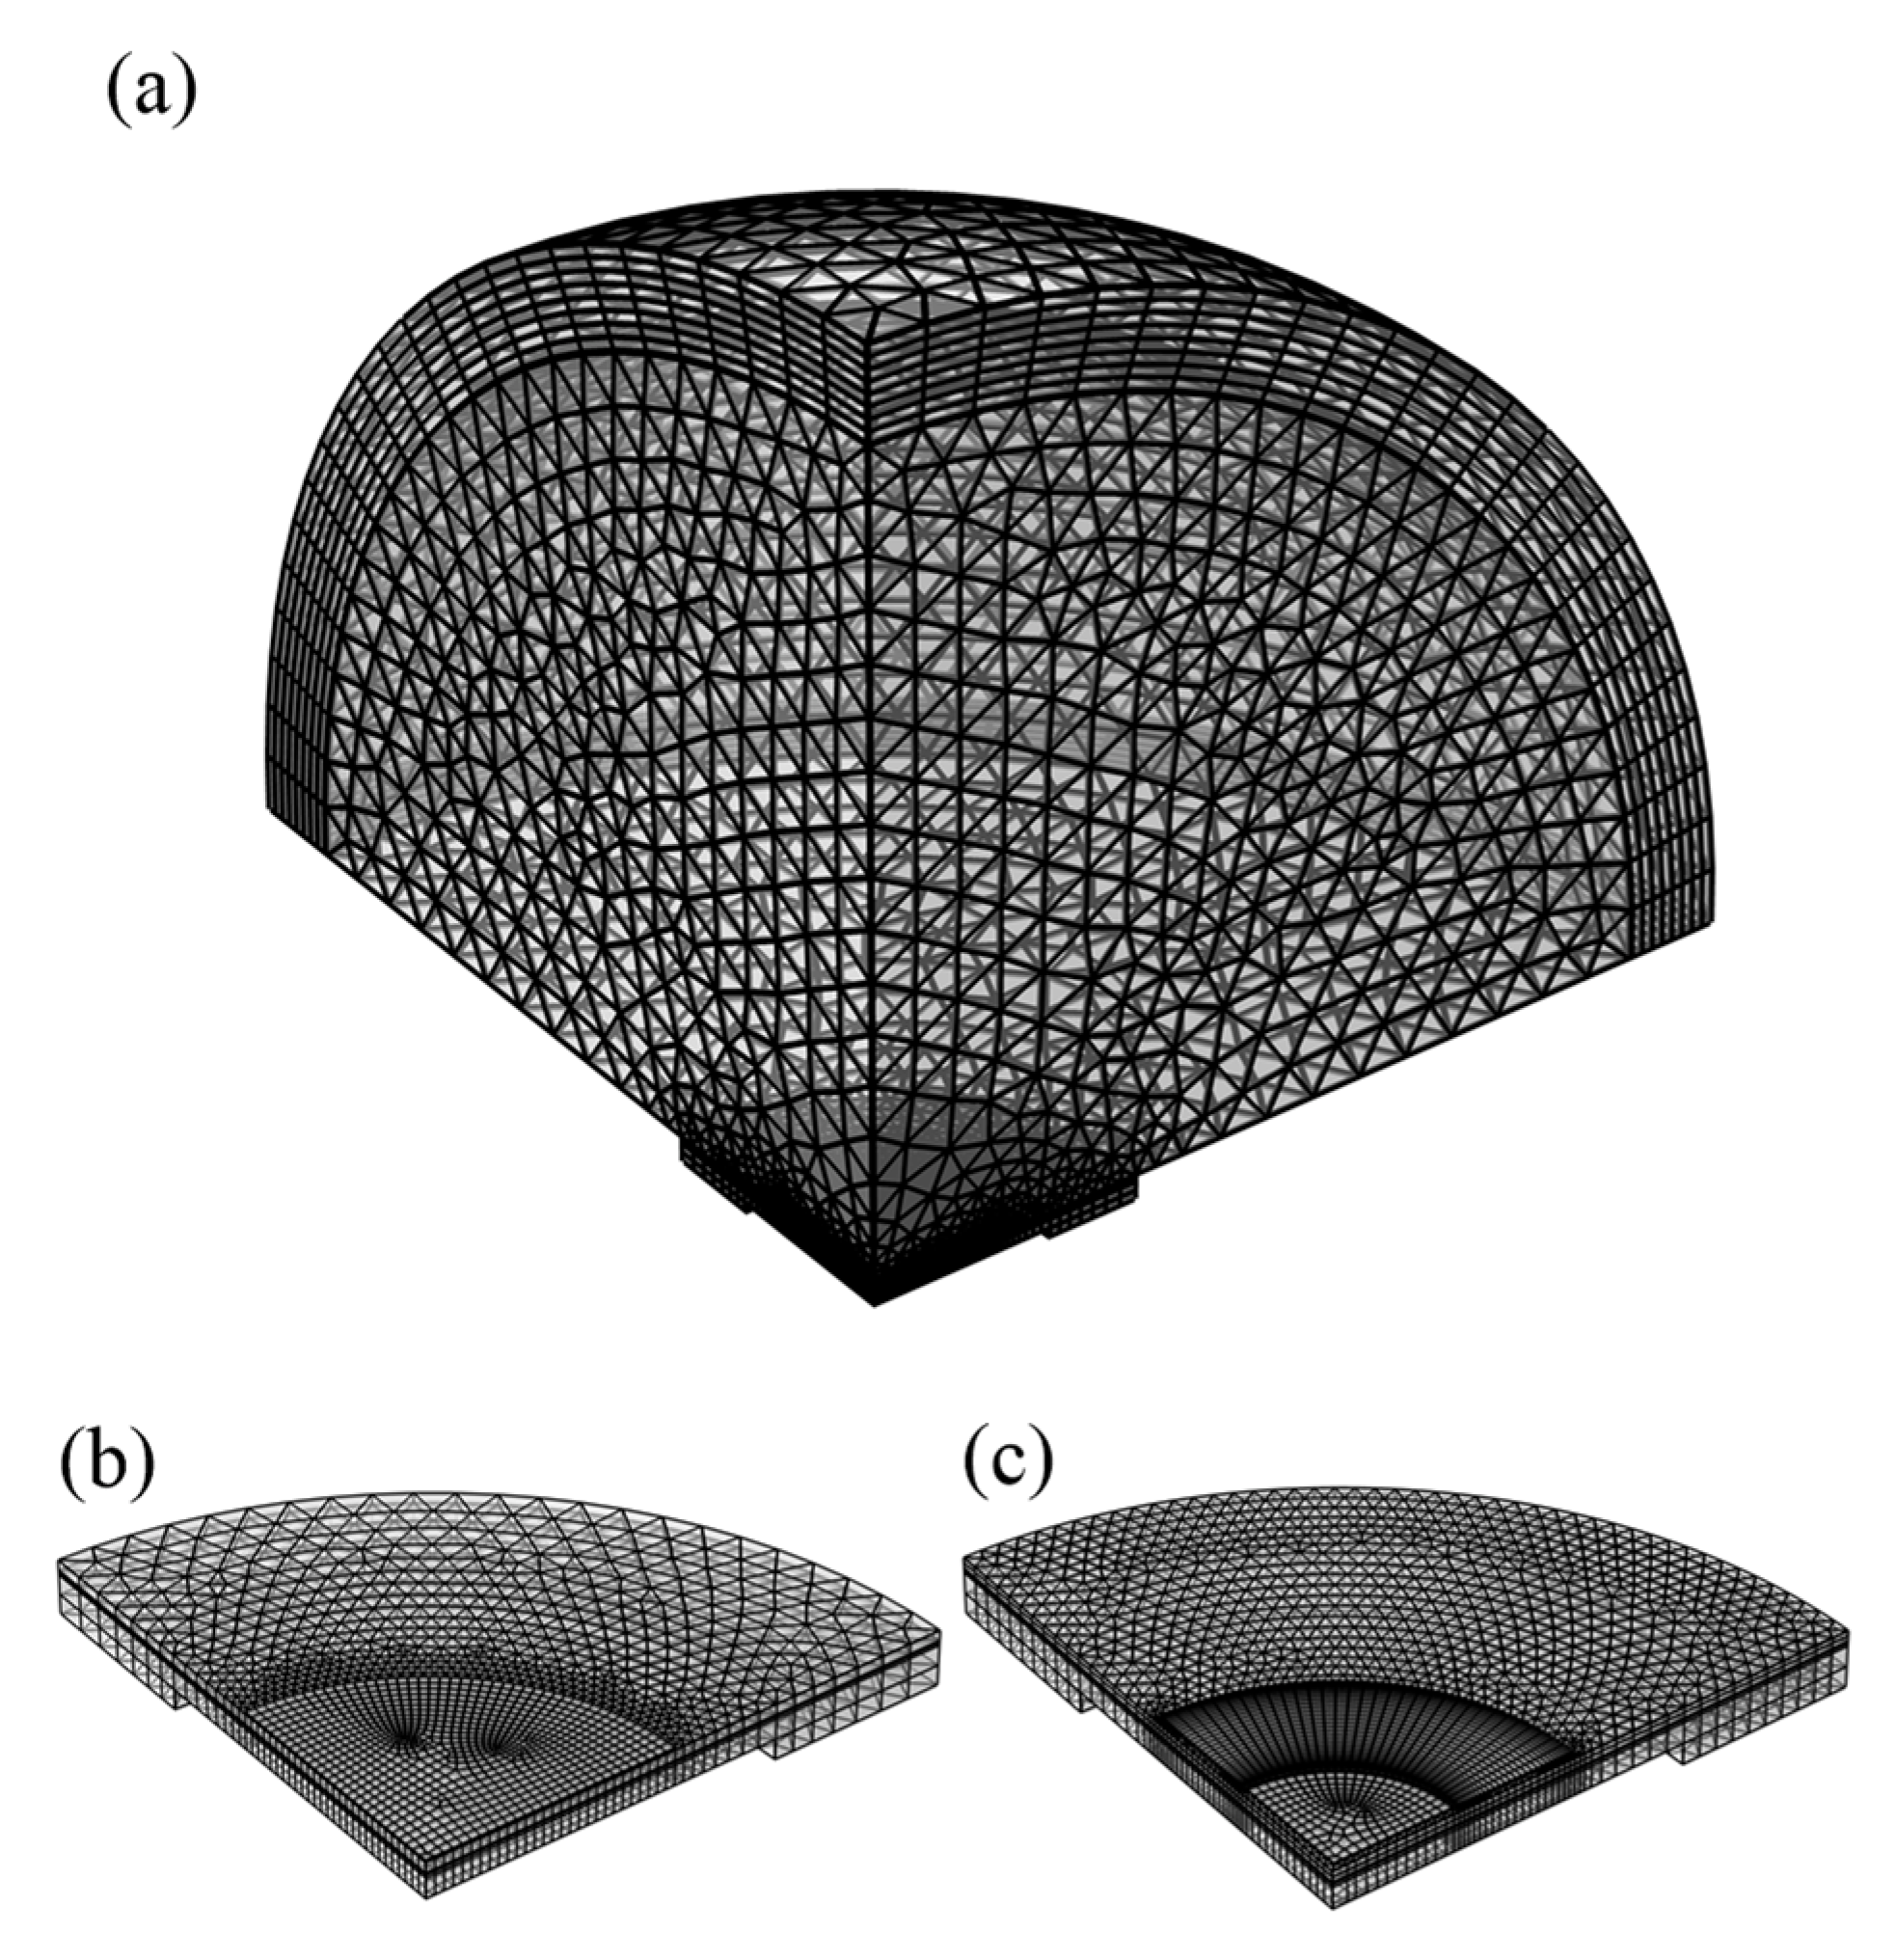
The piezoelectric effect indicates that a piezoelectric body is electrically polarized under an external mechanical force, leading to the appearance of bound charges with opposite signs on the surfaces of both ends of the piezoelectric body. Moreover, charge density is proportional to external mechanical force. This phenomenon is known as the positive piezoelectric effect. A piezoelectric body is deformed by an external electric field, which is proportional to the strength of the external electric field. This phenomenon is referred to as the inverse piezoelectric effect. A solid with a positive piezoelectric effect must also have an inverse piezoelectric effect, and vice versa. Positive and inverse piezoelectric effects are collectively referred to as piezoelectric effects [15,16]. The symmetry of the crystal structure determines whether the crystal has a piezoelectric effect. A schematic of the operation of a single-sensor unit is shown in Figure 1.
Piezoelectric materials are polarized in the thickness direction; thus, when a penetrating electric field is applied in the thickness direction of the model in Figure 1, the pressure is generated in the transverse direction of the piezoelectric film (owing to the inverse piezoelectric effect) and bends the film structure. When the electric field is removed, the system returns to its original shape, owing to elasticity; thus, a pressure wave that propagates through the medium is generated. When the reflected sound wave collides with the membrane structure and bends it, the device causes the electric charge in the polarized piezoelectric material to rearrange, owing to the piezoelectric effect.
After the corresponding processing, useful information regarding the characteristics of the measured medium is obtained. In the vibration modes of this multilayer structure, the operating frequency of the device is not entirely determined by the thickness of the piezoelectric layer, which differs from conventional transducers. The frequency of the composite structure is determined by the dimensions of the membrane and the material of the inner layers. These relatively independent factors provide greater design flexibility for frequency control.

2.2. Model Building

As the core component of piezoelectric ultrasonic transducers, piezoelectric array elements have different geometric shapes for different types of transducers. Although piezoelectric ultrasonic transducers all rely on the piezoelectric effect and the inverse piezoelectric effect, the specific ways of generating vibration of the array elements [17,18,19] with different physical structures may be different, and the focus of application performance may also be different. Here we choose a circular double-lamination structure, which can be well coupled with air and liquid media.
The basic unit of a PMUT transducer consists of a piezoelectric layer, an elastic support layer, and electrode layers on the upper and lower surfaces of the piezoelectric layer. Its three-dimensional equivalent model is shown in Figure 2, according to which the entire radius of the unit is 80 µm and the radius of the upper electrode is 25 µm. The thickness of each layer from top to bottom corresponding to the thickness of the electrode layer is 0.2 µm, the piezoelectric layer is 1 µm thick, the insulating layer is 0.3 µm thick, and the total thickness of the substrate layer is 4 µm.
The 3D equivalent model of the piezoelectric micromechanical transducer element, based on COMSOL, is modeled as follows: First, the geometric model is initially established under the geometric node and the model material is added. The unit uses AlN as the piezoelectric material and Mo as the electrode, SiO2 is the insulating layer and Si is the substrate (the materials involved in the structure can be obtained from the material library using COMSOL). A tiny part of the silicon at the lower end of the center of the transducer structure is etched away, effectively reducing the thickness of the active center region such that the device becomes a thin-film composite PMUT transducer. In this study, we used a 2D axisymmetric model and a 3D model in which a perfectly matched layer (PML) area added outside the water area effectively expanded the propagation range and simulated the propagation and absorption effects of sound waves at the boundary. The basic parameters of the AlN material required for the simulation are mentioned in the following. The density is 3250 kg/m3.
The relative permittivity matrix is
s = 9.21 0 0 0 9.21 0 0 0 10.26
The piezoelectric stress constant matrix is
e = 0 0 0 0 −0.48 0 0 0 0 −0.48 0 0 −0.58 −0.58 1.55 0 0 0
The elastic constant matrix is
C E = 397 143 112 0 0 0 143 397 112 0 0 0 112 112 372 0 0 0 0 0 0 116 0 0 0 0 0 0 116 0 0 0 0 0 0 125
Second, physical boundary conditions are set up. To prevent the influence of boundary reflection, the PML domain and the bottom of the layer to which silicon belongs to a fixed boundary condition (under the solid mechanics physics interface) are set. The absorption of elastic waves in the PML domain results in the damping of the structure, also known as anchor loss. In addition, the model incorporates mechanical and electrical failures in the piezoelectric AlN layer using a loss factor. The structural loss factor represents the hysteresis in the stress–strain curve, and the dielectric loss factor represents the polarization loss, which appears as the hysteresis of the material polarization relative to the electric field curve. The structural and dielectric loss factors are the imaginary parts of mechanical stiffness and relative permittivity, respectively. The automatic loss ηc(ηc = 0.001) and dielectric loss ηεs(ηεs = 0.001) are added. The device is subsequently meshed. The most prominent mesh element is specified as 1/5 of the corresponding minimum wavelength, and the sweep feature is used to partition the PML domain(as shown in Table 1 and Figure 3). The model’s dense solid area and relatively sparse mesh density distribution settings in the water area are completed. Subsequently, a “boundary layer mesh” is applied to set smooth transition boundaries to accurately simulate the performance of computing devices and reduce the computation time to a certain extent. Finally, the study type is added and the results are viewed. The study type is the frequency domain, with 1D/2D/3D plots available to view various performance attributes in the results.

3. Performance Simulation and Optimization Analysis
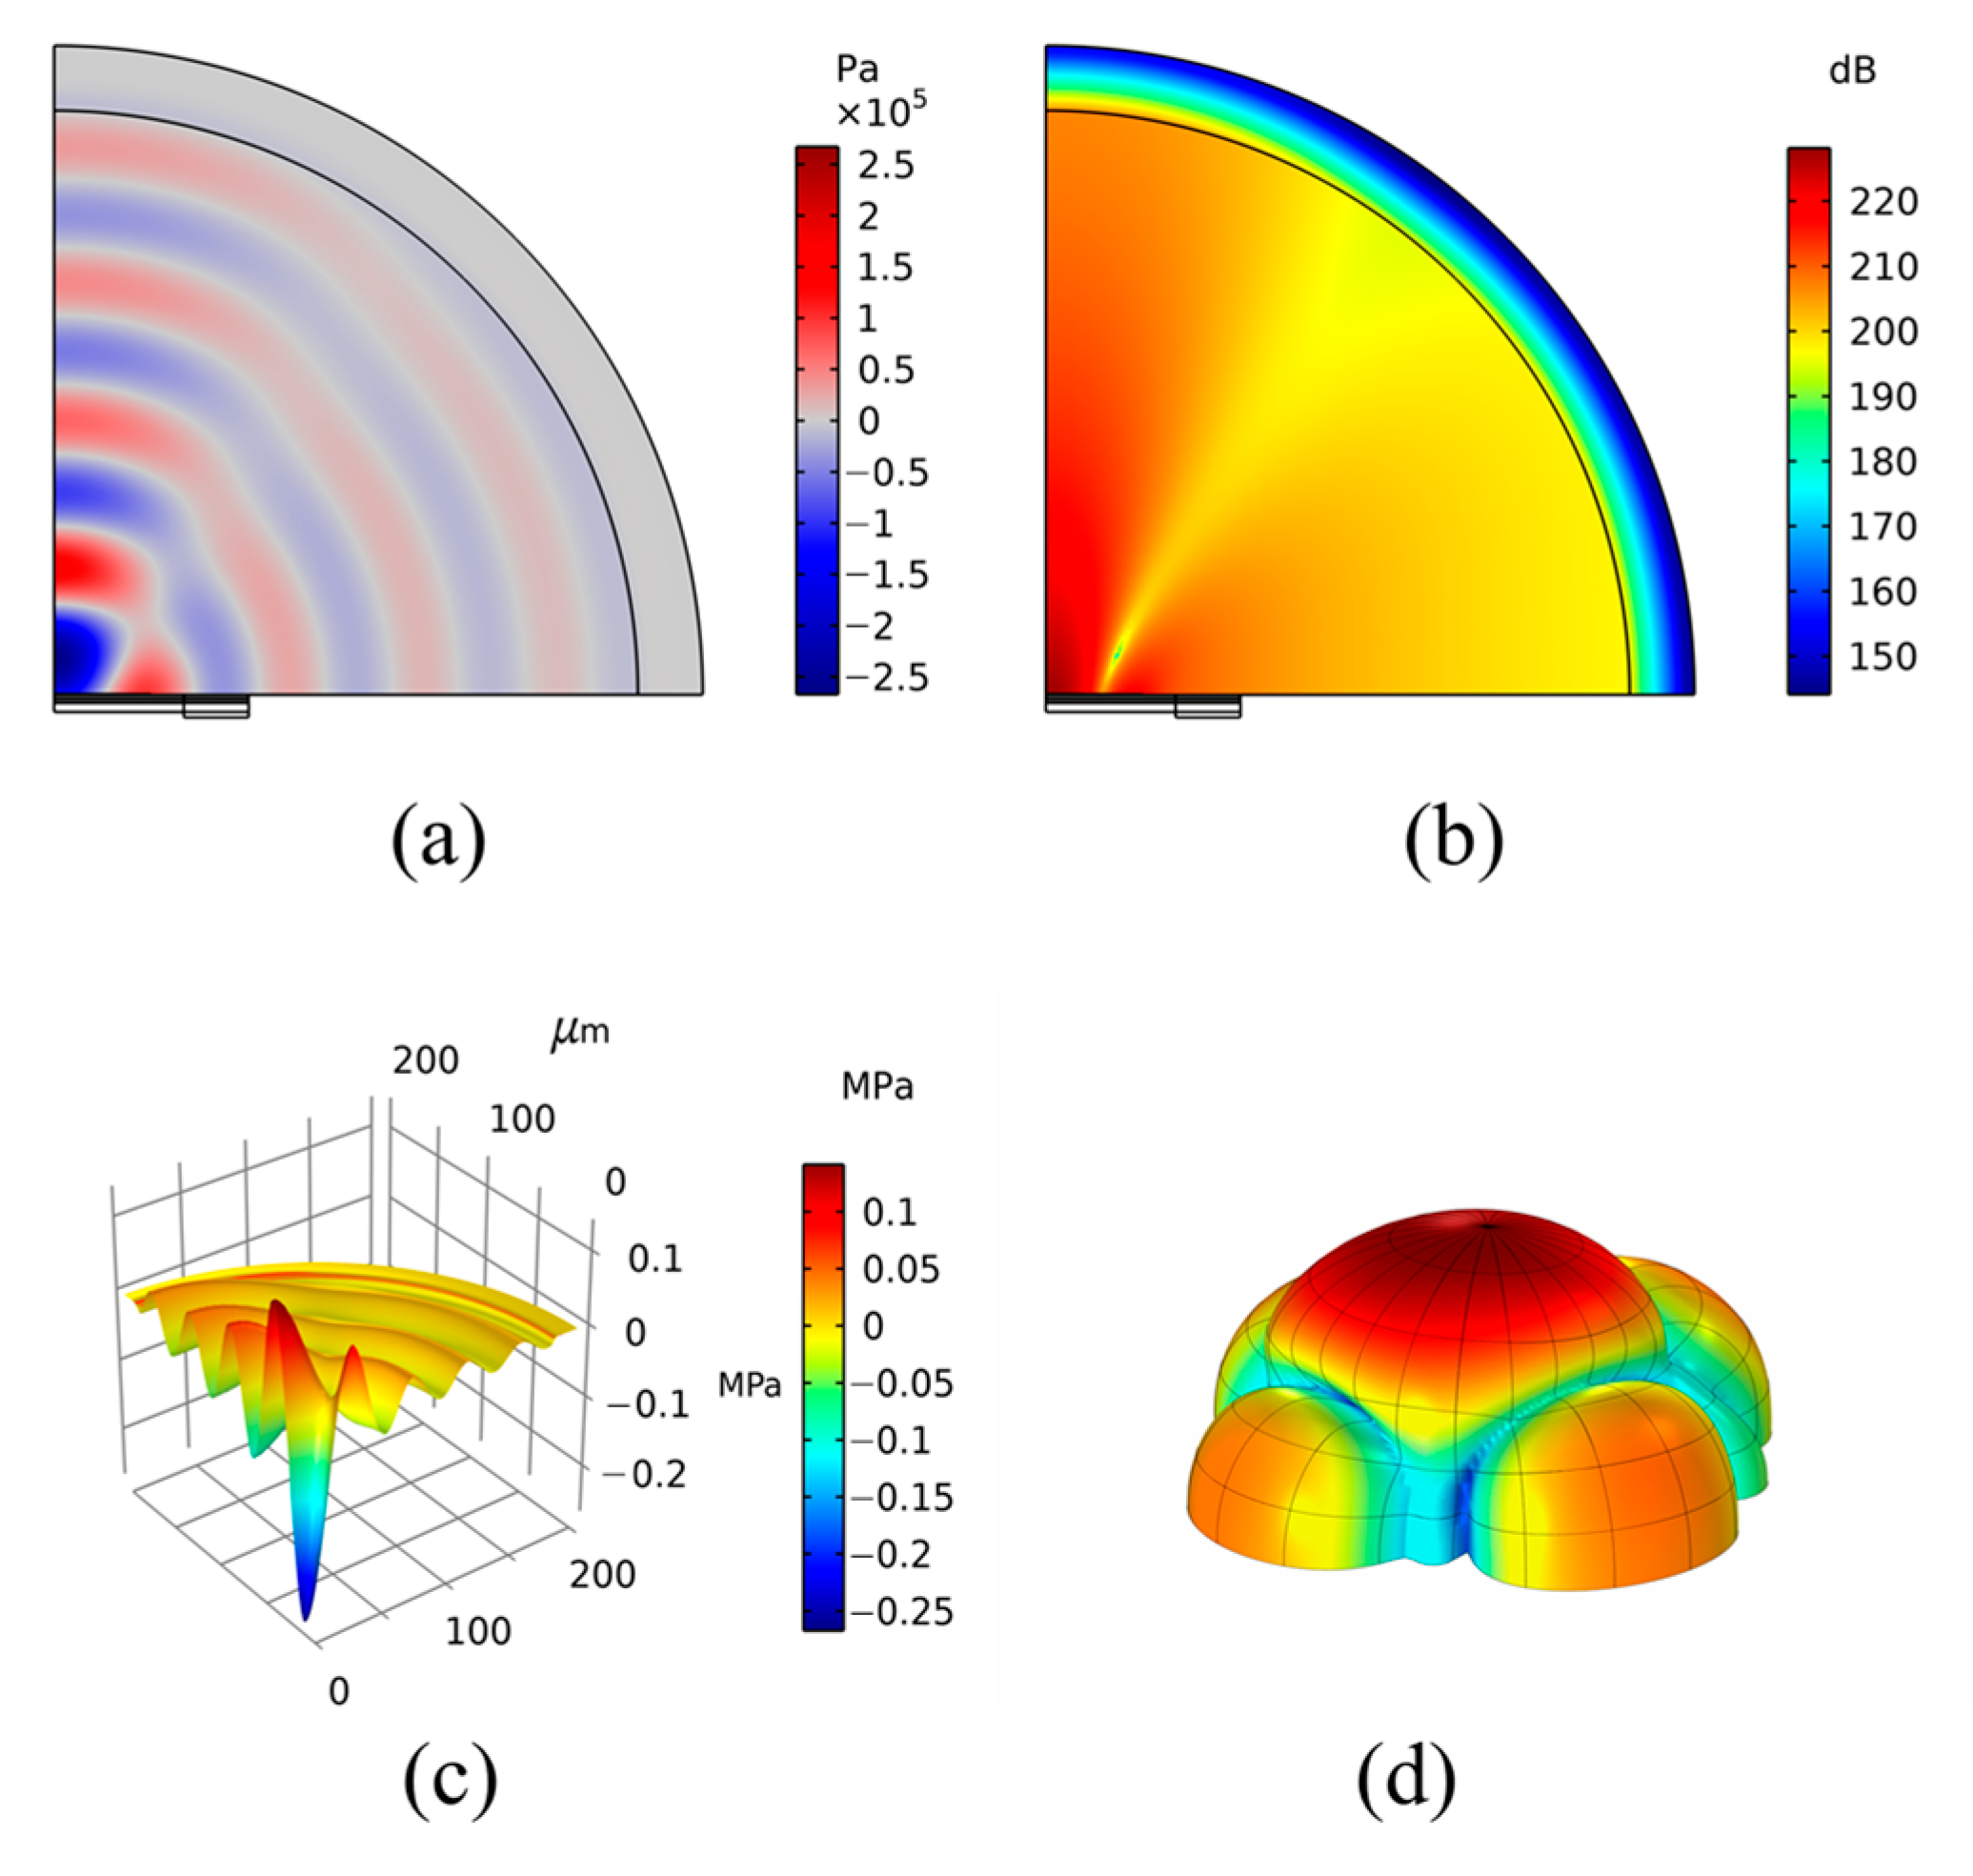
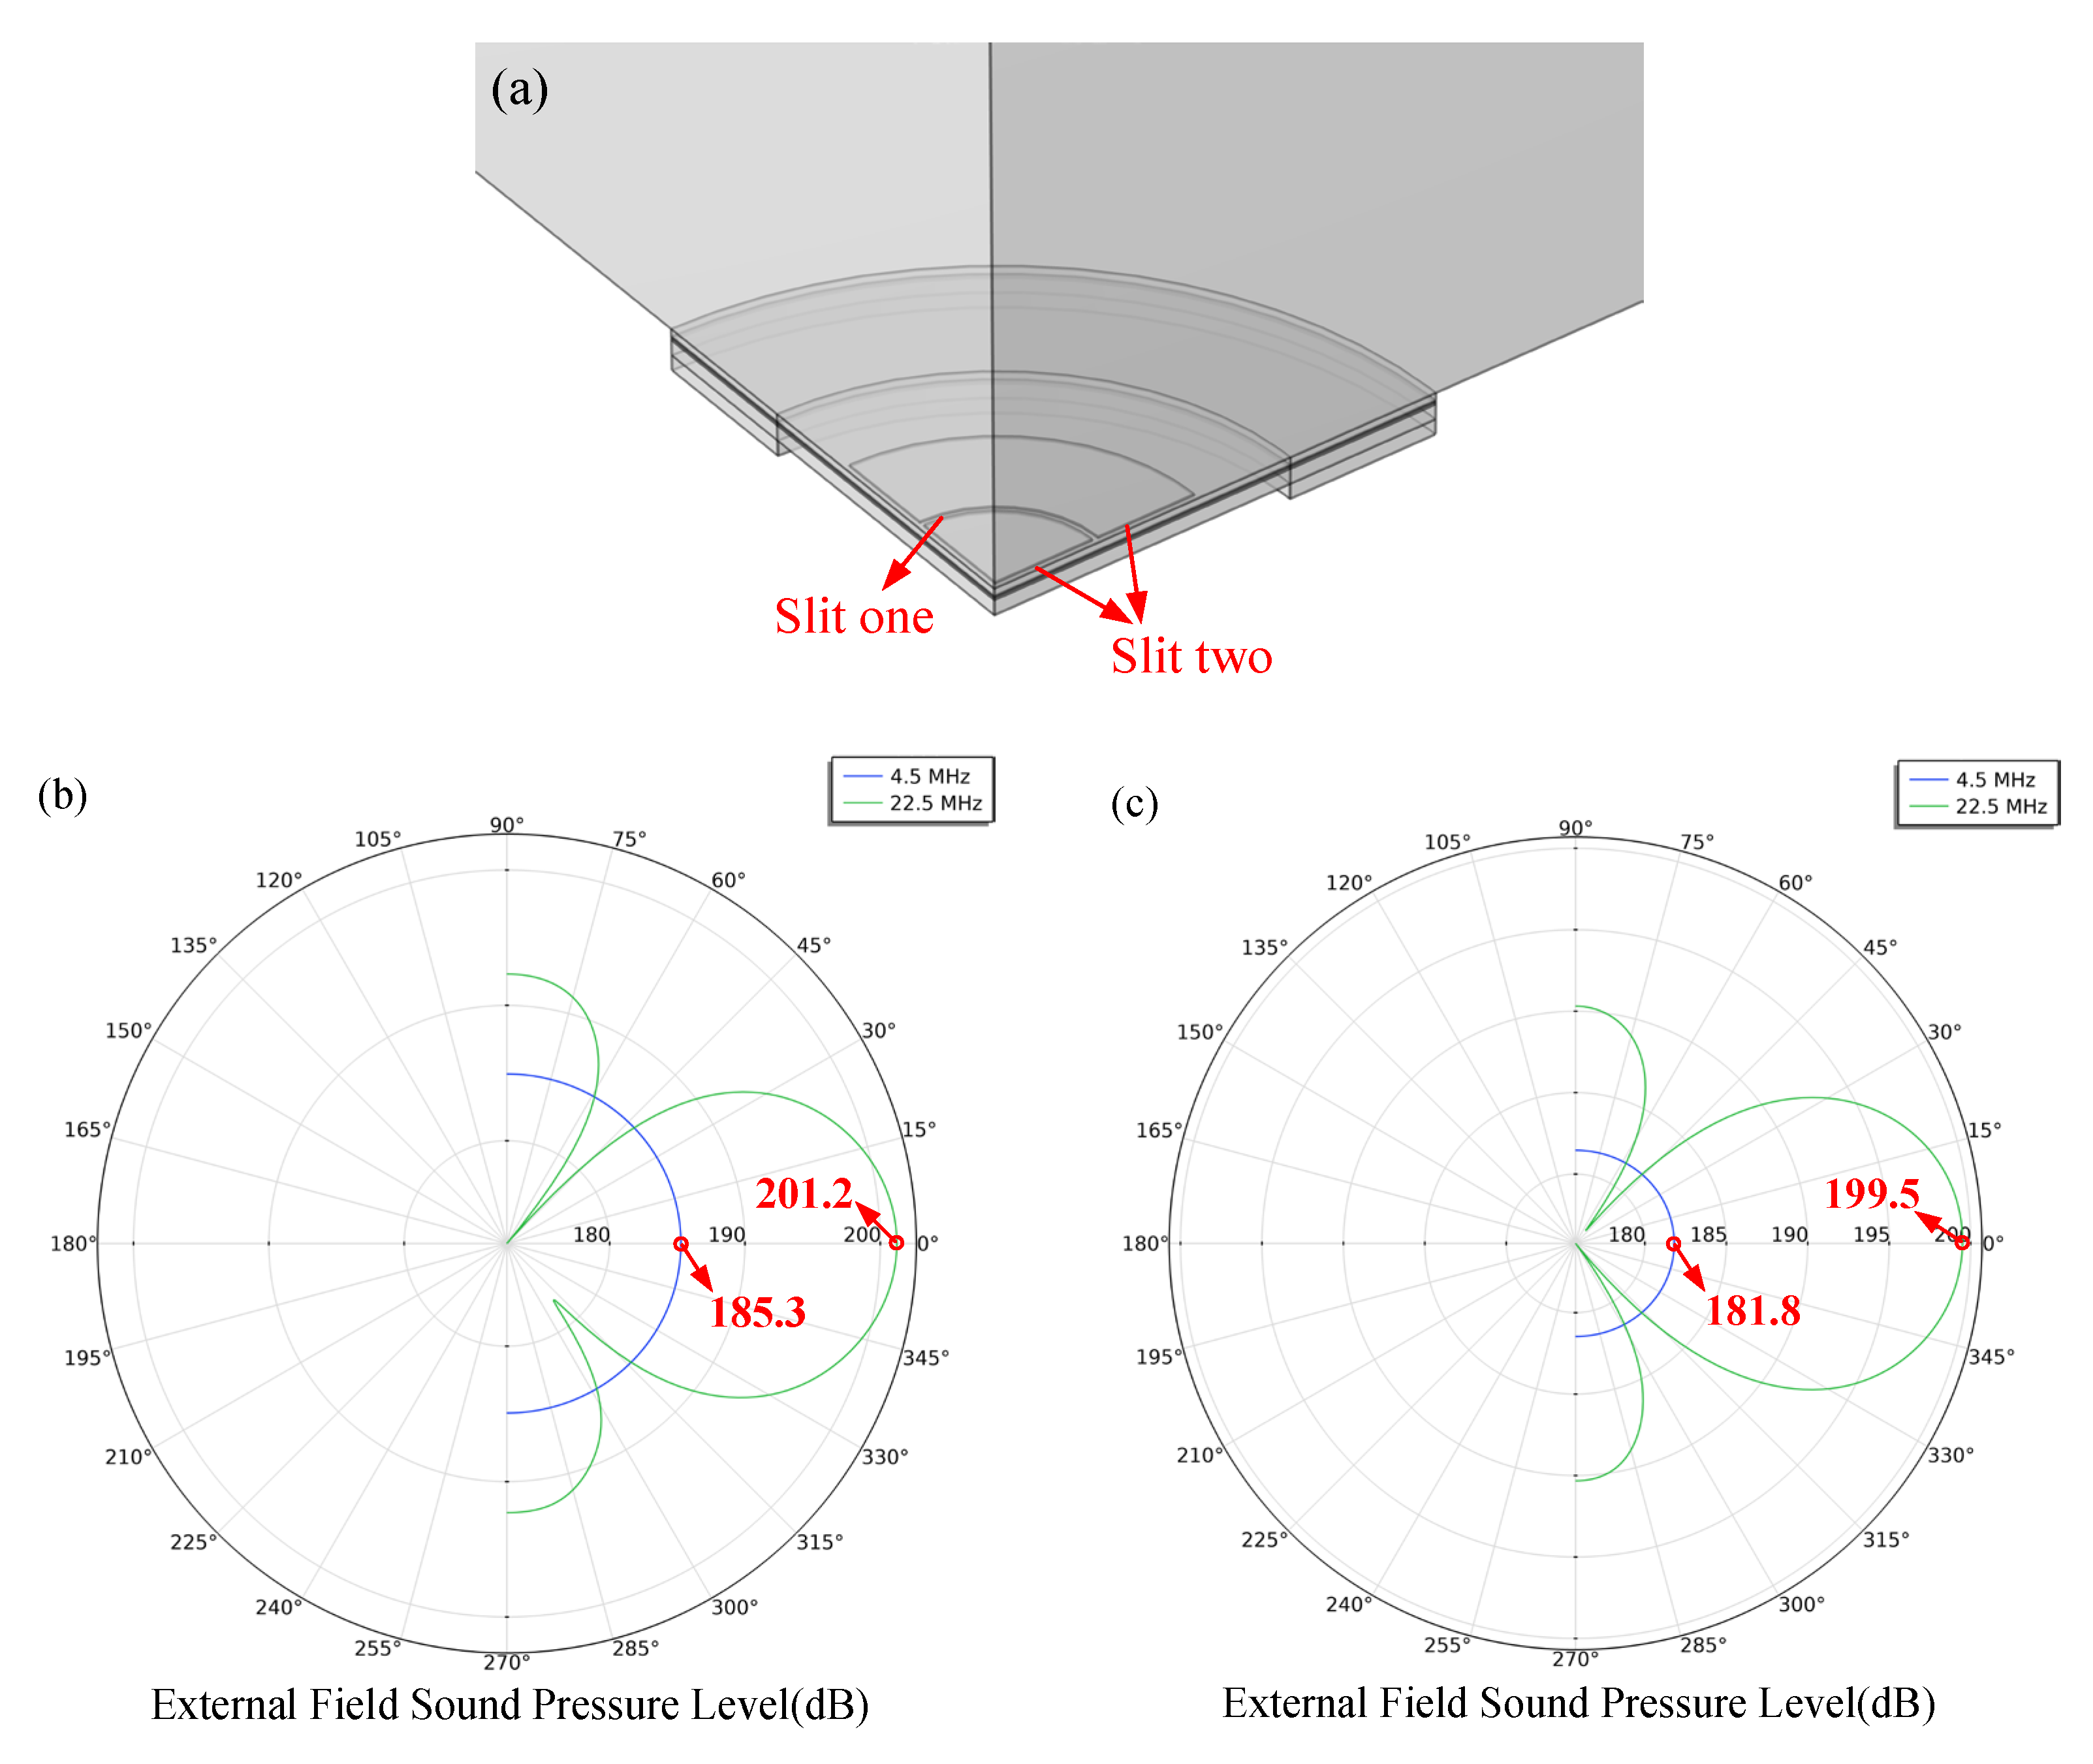
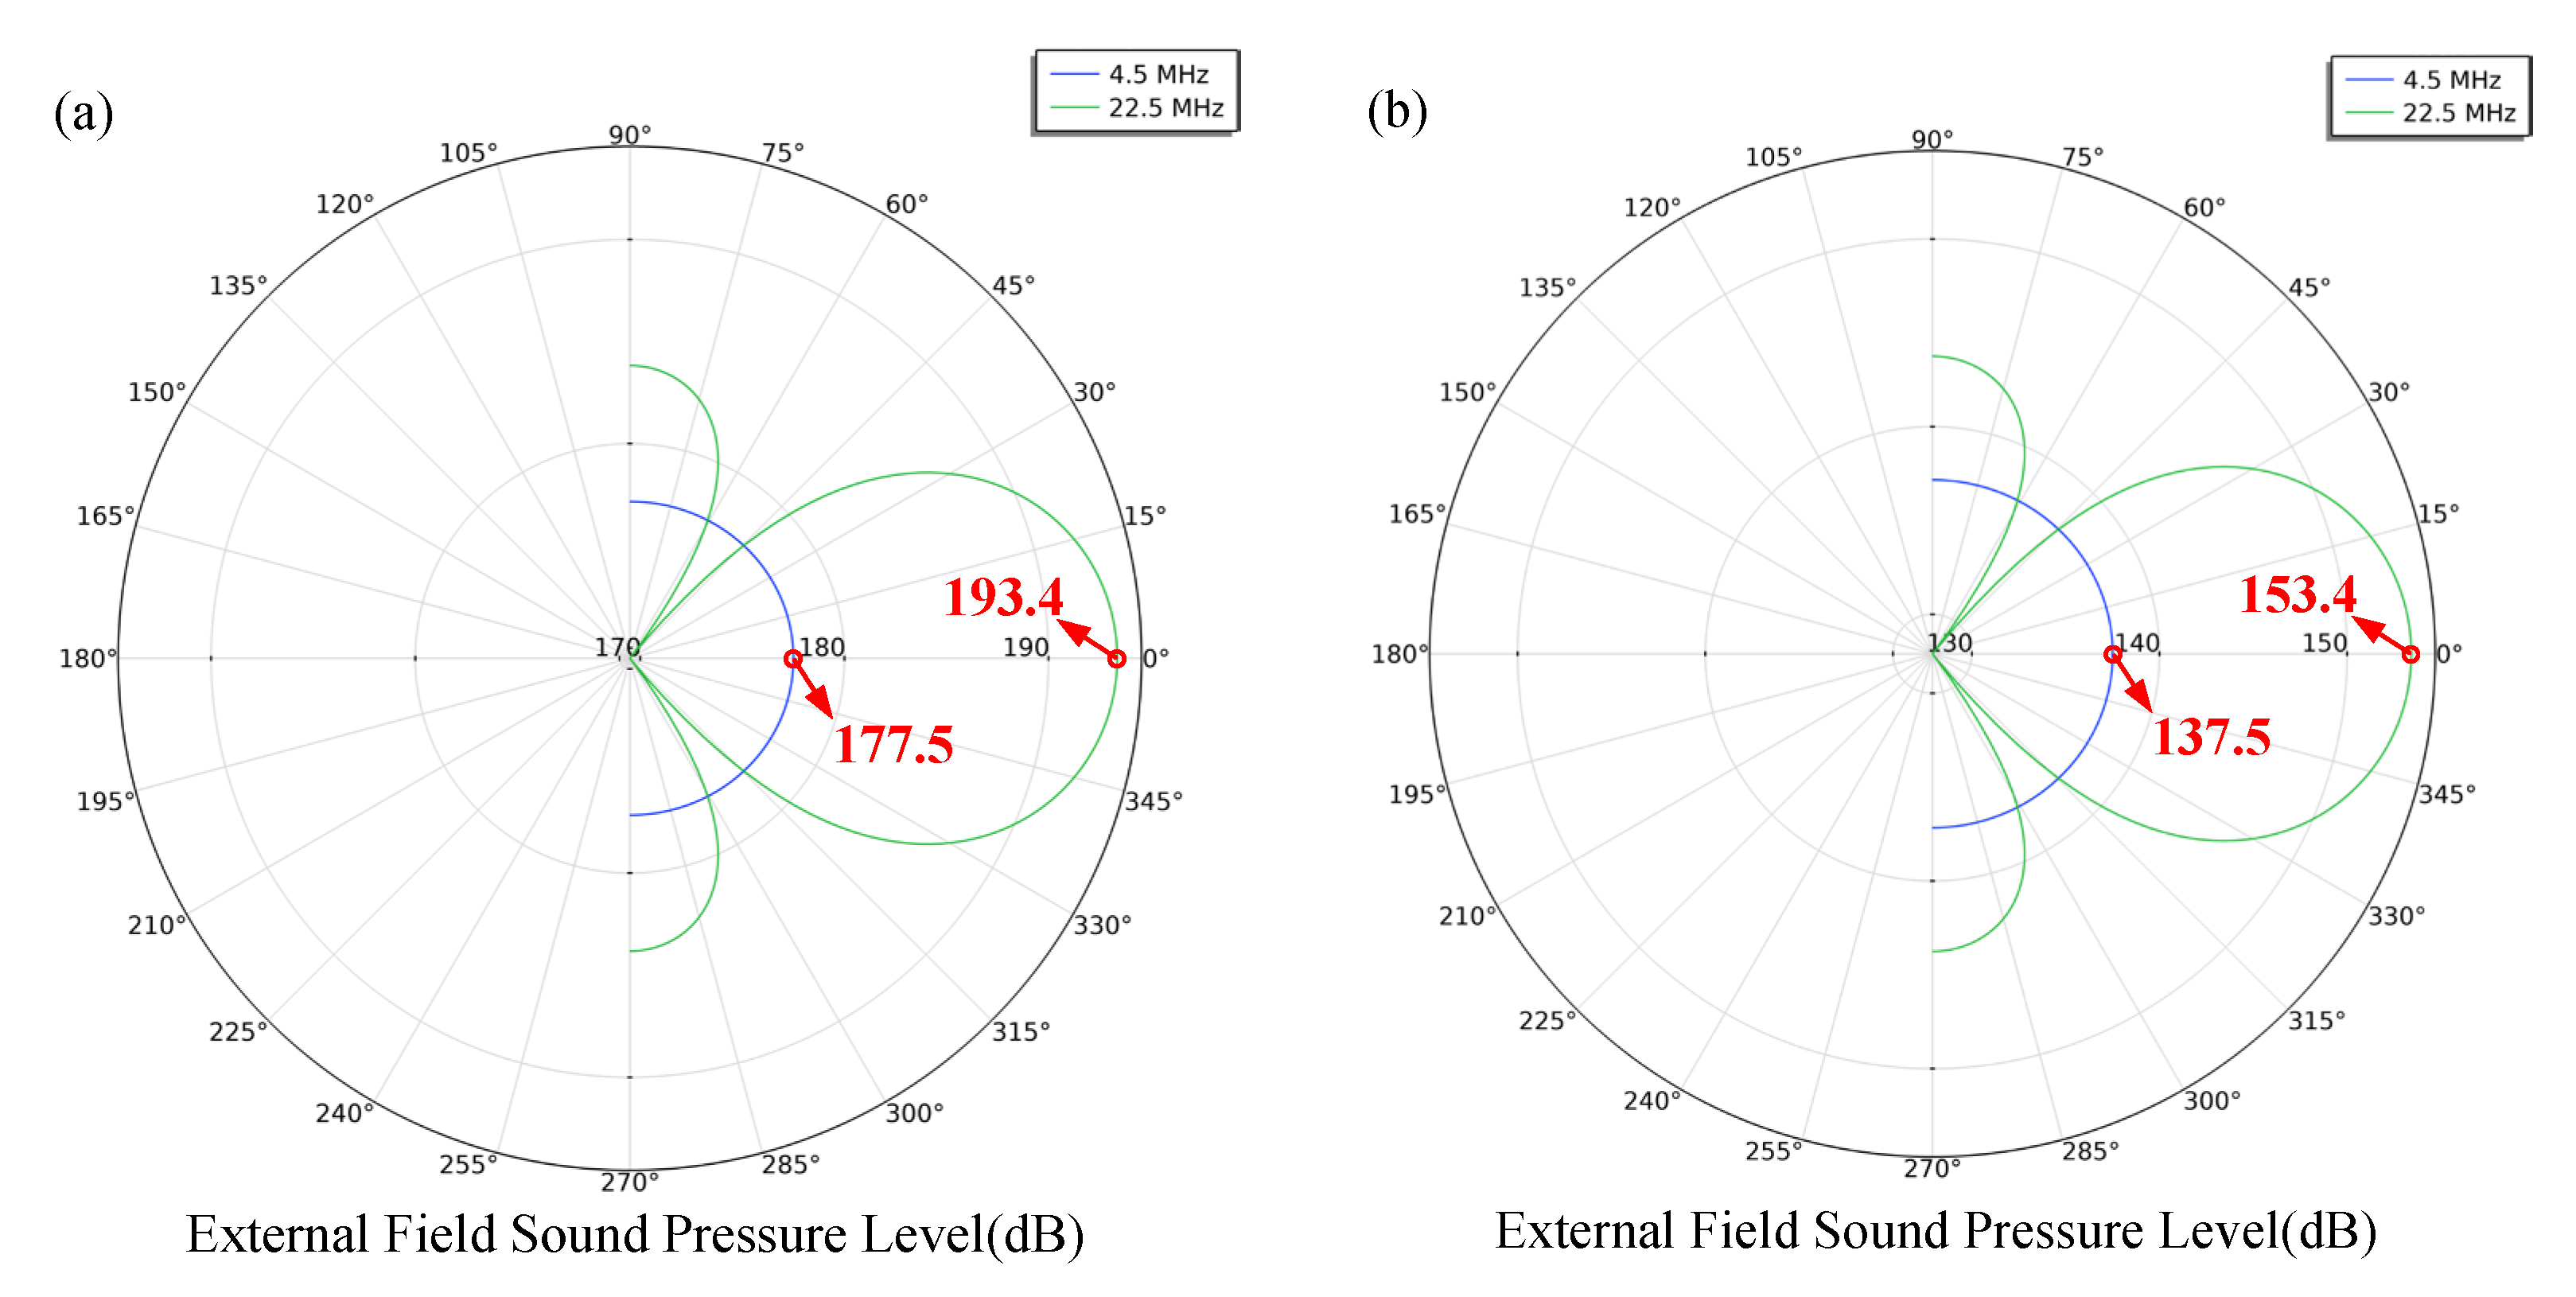
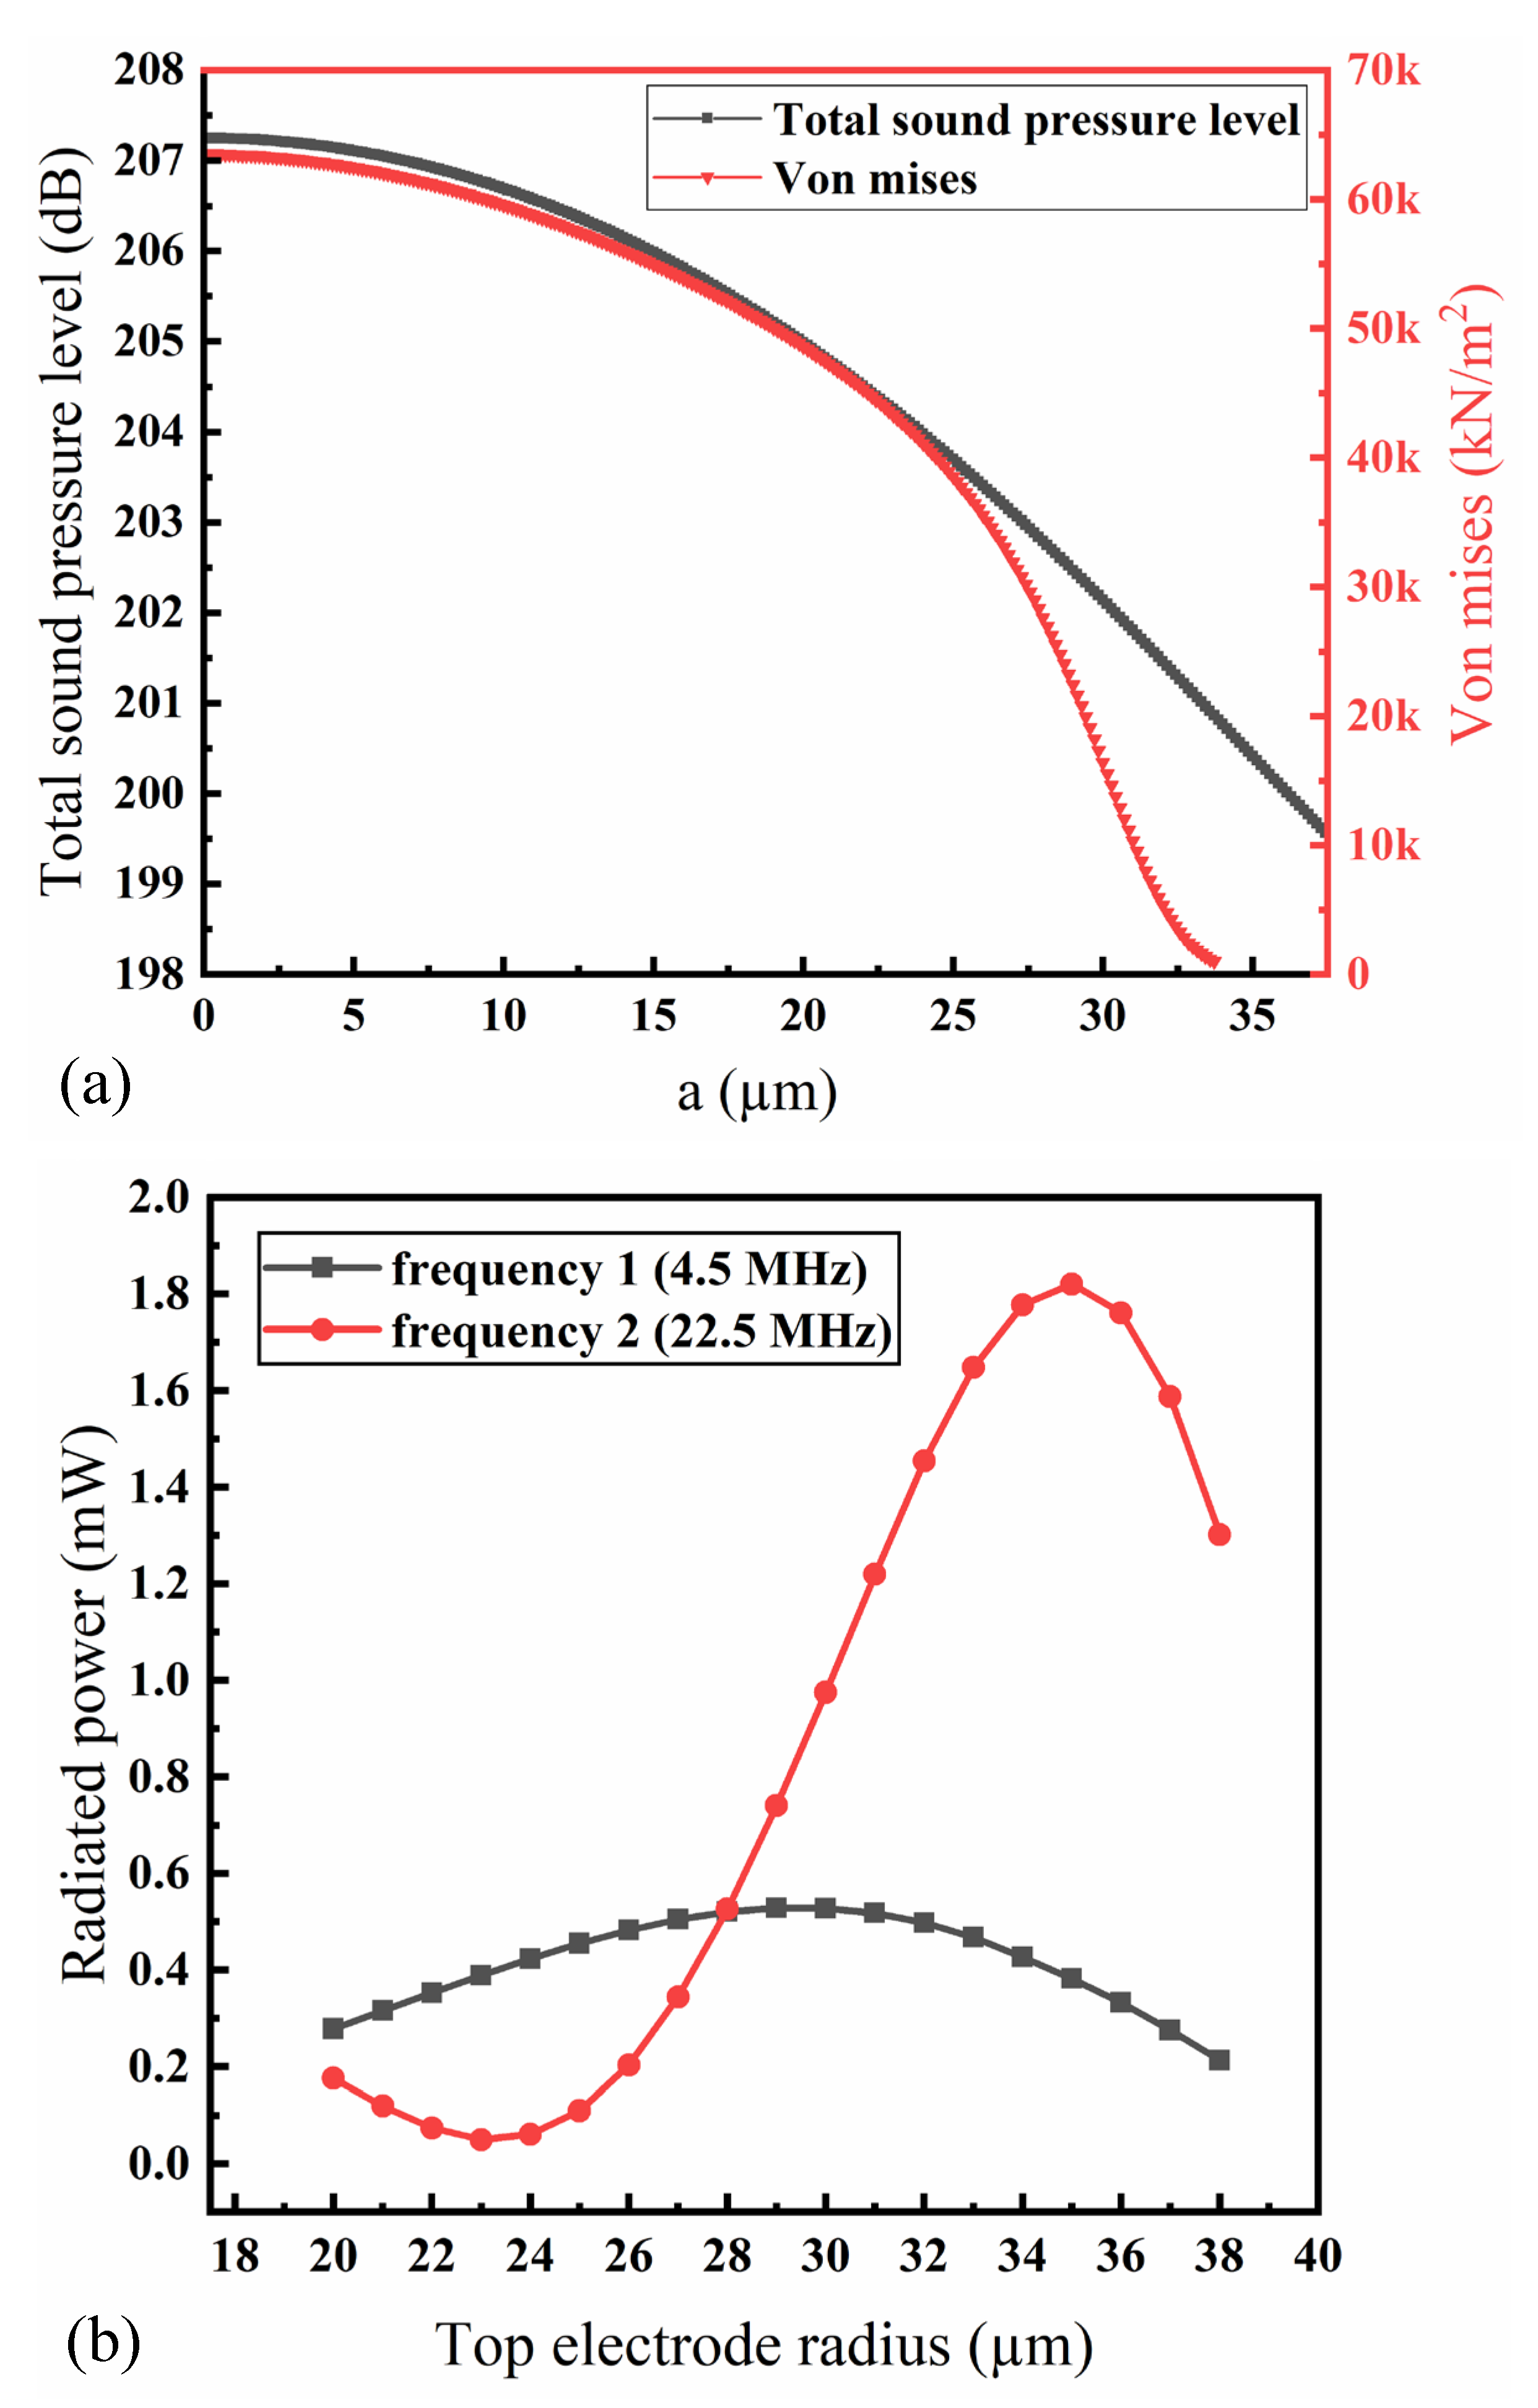
In practical applications, a PMUT usually comprises many elements in an array to meet the performance requirements of high transmission power, directivity, and high sensitivity. Therefore, the overall performance of the transducers must be reflected in the performance of a single element of the PMUT. The determination of the unit’s natural frequency and vibration mode based on factors such as model size, structure, and material is a perspective for future research. The attenuation of ultrasonic waves in tissues is significant; thus, the resonance frequency of a PMUT in liquid is approximately 4.5 MHz. COMSOL software was used to study the eigenfrequency results in the steady-state analysis, and the simulation frequency range was initially set at 2–40 MHZ. The range of the scanning frequency domain was increased to a certain extent and the working state of the array elements was observed and compared when the low frequency transitioned to the high frequency.

3.1. Modal Analysis

Modal analysis is mainly used to analyze the vibration characteristics of the structure; the natural frequency and vibration mode are determined according to factors such as the structure and material [20,21], providing the basis for subsequent analysis. Let the thickness and radius distributions of the flexural vibration disk have the proportions a(h ≪ a). According to the linear elasticity and the bending vibration theories of thin plates, because the force on the thin disk and the bending of the disk are all axisymmetric bending vibrations (in which the shear and torsional inertia in the container are ignored), the bending vibration amplitude of the thin plate is small. The axisymmetric bending displacement of the disk is expressed as follows [22]:
y ρ t = A J 0 k ρ + B I 0 k ρ exp j ω t
where J 0 k ρ and I 0 k ρ are zero-order Bessel functions, k 4 = ρ v h ω 2 / D , D = E h 3 / 12 1 σ 2 , E is Young’s modulus, D is the sheet stiffness constant, ρv is the density, σ is Poisson’s ratio, k is the wavenumber, and ω is the angular frequency. A and B A and B are undetermined constants that are determined using the boundary conditions of the disk. a is the radius of the upper electrode. The bending moment and transverse shear force at the boundary of the flexural vibration disk are zero [23]. Thus, the following three equations can be obtained:
X 1 = A k J 0 k a J 1 k a a + σ J 1 k a a
X 2 = B k I 0 k a I 1 k a a + σ I 1 k a a
Let X1 = X2,
A J 1 = k a + B I 1 k a = 0
From Equations (2)–(4), the resonance frequency equation of the bending vibration of the boundary-free disk can be obtained as follows:
X 3 = k a J 0 k a I 1 k a + I 0 k a J 1 k a
X 4 = 2 1 σ J 1 k a I 1 k a
Let X3 = X4; through the material parameters of the given disc, the relationship between the geometric size of the element and the resonance frequency can be obtained,, and the resonance frequency of the model can be obtained from this relationship.
COMSOL software was used to establish a simulation model to simulate the first three-order bending vibration modes of the piezoelectric micromechanical transducer in water. The first three-order bending vibration modes of the piezoelectric micromechanical transducer in water were simulated. Thus, we obtained the simulation results of the first-, second-, and third-order models, as shown in Figure 4. According to the disc’s characteristics of resonance in the vibration, a system will have multiple resonance frequencies. When the external drive is close to or equal to the system’s natural frequency the system is prone to vibration, and other frequencies are less likely to vibrate. Therefore, there are multiple resonance frequencies of the device. At different resonance frequencies, the vibration modes of the device will be different. Through modal simulation, we aimed to find the bending vibration mode from many resonant frequencies and mode shapes.
Figure 4 gives the first three resonant modes from which we extracted the first three modes, from which we can see that, for a circular film with a fixed constrained boundary applied, the first resonance is the bending we expect in vibration mode. When the second-order resonance occurs, it can be seen that a stagnation point appears in the middle of the film. As shown in the figure, along the radial direction, the first-, second-, and third-order bending vibrations correspond to one, two, and three displacement nodes, respectively. As the resonance order increases, the stagnation points will increase. This limits the longitudinal resonance displacement of the circular film, resulting in decreasing longitudinal resonance displacement and lower energy conversion efficiency. The figure shows the first three-order resonance frequencies. We can read the corresponding resonance frequency according to the previous vibration mode. The first-order resonance frequency corresponding to the first-order resonance mode is 4.5 MHz.

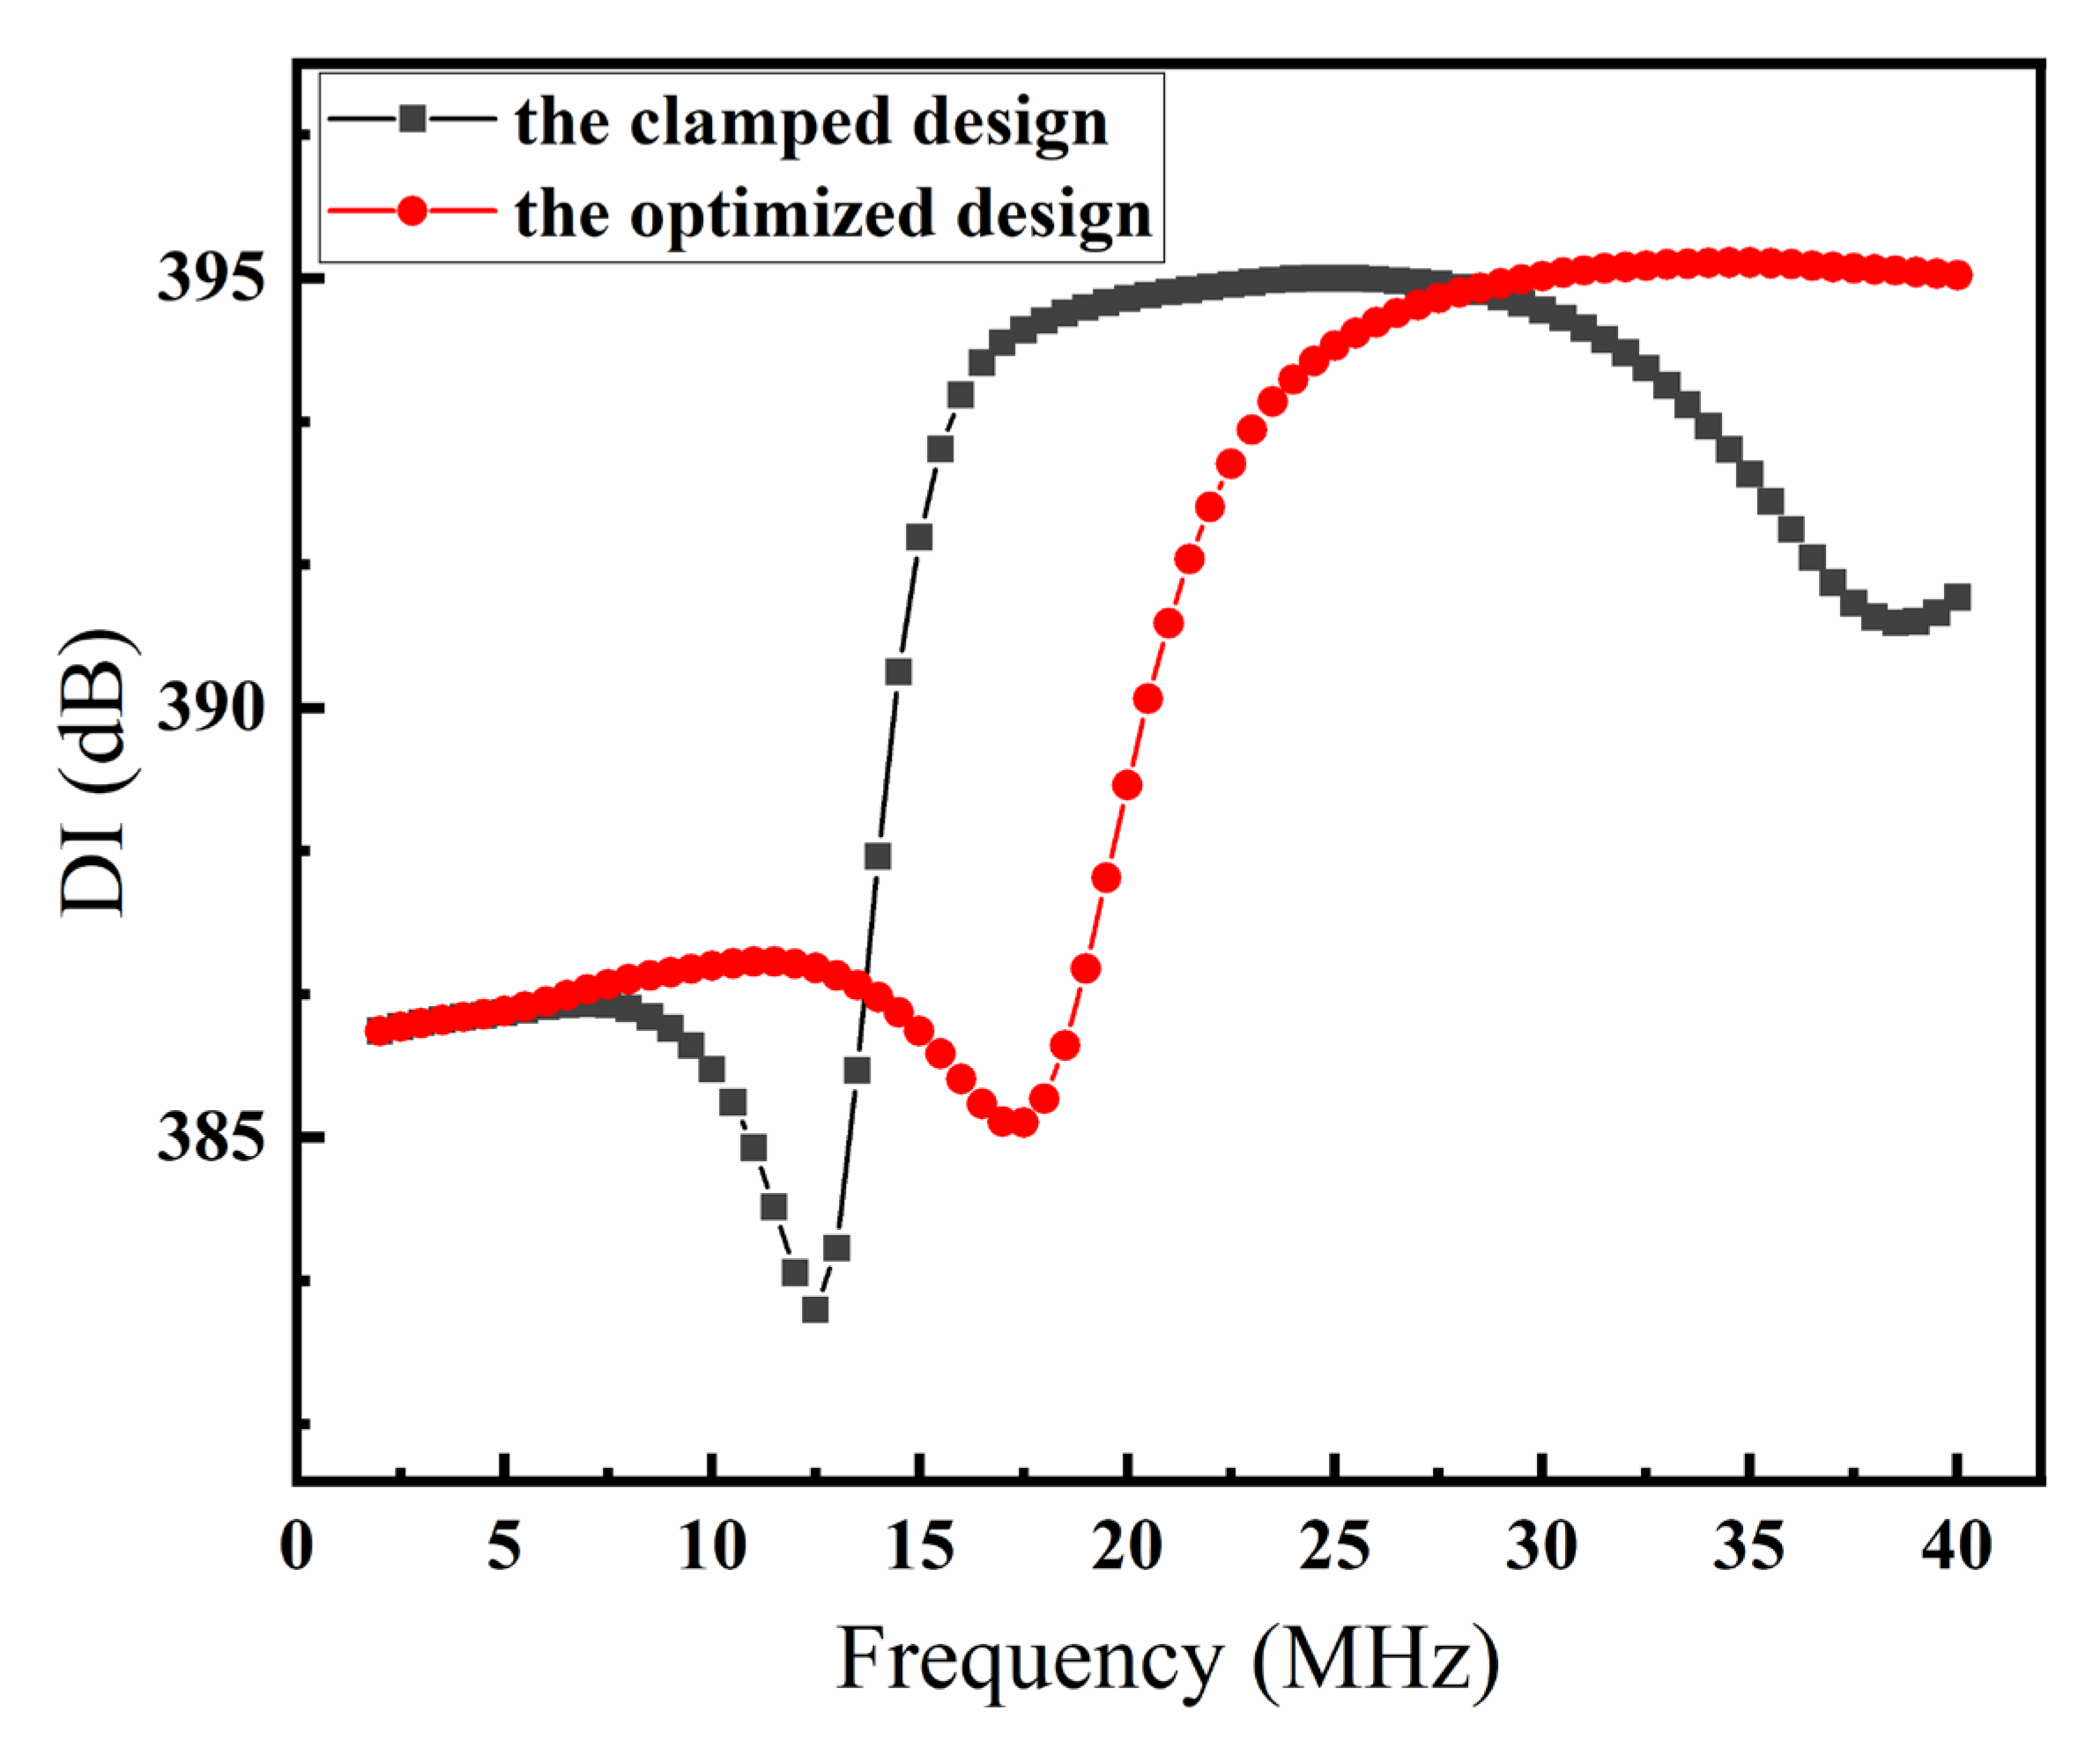
3.2. Frequency-Domain Analysis and Optimization

The size of the ultrasonic transducer unit can be regarded as a point relative to the infinite sound field. Thus, under the excitation of the set frequency, the sound wave generated by the transducer propagates in the form of spherical waves in water [24]. Two-dimensional illustrations of the sound pressure and sound pressure field are shown in Figure 5a,b, respectively. From the figure, the maximum sound pressure appears on the central surface of the transducer. It gradually decays along the propagation direction and the decay speed decreases. The height map of the sound pressure and the sound wave radiation profile diagram are shown in Figure 5c,d, respectively, which show the change in sound pressure radiation and sound wave propagation during device operation.
This study optimizes the single-unit structure, the upper electrode is divided, and the distribution of the upper electrode is optimized to improve the SPL of the external field and sound field radiation symmetry. The SPL of the external field [25,26] is a physical quantity that describes the amount of sound energy radiated to the medium sound field by a transmitter at a certain distance in the near- or far-field. The transmitter size directly influences the effect of ultrasonic processing. In the frequency domain analysis, to simplify the calculation and reduce the analysis time of the solver, 1/4 of the model is reserved for calculation. The modified unit model and external field radiation patterns at the two frequencies are shown in Figure 6. As can be seen, the sound wave radiation after the modification is better than that before modification. The acoustic radiation symmetry of the optimized structure is improved by maintaining a certain SPL. This is because the mechanical dynamic range is increased by the optimized structure to a certain extent,, such that part of the residual stress on the element is released.
The axial sound pressure generated by membrane vibration can be expressed as follows:
P r 0 = 2 ρ 0 c 0 u 0 sin 1 2 k ω r 1 + a / r 2 1
where ρ 0 is the density, c 0 is the speed of sound, u 0 is the amplitude of vibration velocity, k ω is the wavenumber, and r is the distance from the sound source.
The SPL can be expressed as follows:
S P L = 20 log 10 P e P r e f
where P e is the effective value of the sound pressure to be measured, P r e f is the reference sound pressure, and SPL denotes the sound pressure level in decibels (dB).
Based on the modal analysis and transmission of the sound field on the solid–liquid contact surface, the device unit functions properly and the radiated sound energy is stable. However, in reality, the sound field radiation received at a certain distance should be analyzed [27] outside the unit model solution domain to ensure that the sound energy radiated by the transducer can be reflected at the action point. A point is taken on the acoustic axis of the unit reference and the situation of the receiving acoustic energy is simulated at this point. By analyzing the sound pressure radiation patterns with different external field radii in the direction of the sound axis, we observed that when the radius of the external field is considered, the SPL of the external field decreases with an increase in distance; however, the directivity does not weaken. The sound-wave radiation can be maintained in a uniform and balanced state. The beam patterns of the cell model at 0.5 mm and 50 mm are shown in Figure 7. The aforementioned research is based on a situation in which no obstacles exist on the acoustic axis. Follow-up studies are required to determine whether an obstacle exists.
The up-and-down vibration of the transducer results in a change in air pressure, which in turn generates sound pressure. The change in sound pressure can be reflected by considering the SPL, which is the practical value of the sound pressure to represent the sound intensity. Figure 8 shows the magnitudes of the stress at the acoustic–structure interface of the ultrasonic transducer, generated SPL, and radiated power. From the first vertical axis (left) of Figure 8a, the stress on the device is close to the center point. The numerical value is the largest at the edge, and the stress at the edge is the smallest, corresponding to the largest vibration amplitude and the most extensively radiated sound pressure at the center of the device. The second vertical axis (right) shows a graph of the SPL generated by the sound-radiating surface, which is consistent with the stress response. The high stress on the device at the center point results in a high vibration intensity and, consequently, high SPLs. The change in the radiated power of the external field with the radius of the upper electrode at the two frequencies is shown in Figure 8b. The trend of Line 1 (black) is stable and the fluctuation of Line 2 (red) is apparent. This is because the device primarily performs piston-like vibrations [28] at low frequencies. At this time, no stagnation point exists in the middle of the thin plate; thus, the electrode change has little effect on the vibrating film. However, as the frequency increases, a stagnation point appears in the middle of the thin plate and the array element. The vibration type changes to a predominantly Gaussian form [29]. When the radius of the upper electrode is 28 µm, the two curves intersect, indicating that the device can function at two frequencies instead of one.
The external SPL [30,31] reflects the strength of the sound energy radiated by the array element. Under normal circumstances, to increase the working distance of the transmitter, the transducer will also be made to have a specific emission directivity [32,33,34]. Directivity improvement can increase the intensity of the radiated signal and correspondingly increase the intensity of the echo signal, thereby increasing the working distance of the device.
Directivity refers to the number of decibels of SPL on the sound axis of the directional transmitter higher than that of the radiated sound field of the non-directional transmitter at the same distance. The larger the index, the higher the sound energy concentration in the sound axis direction, which can increase the working distance of the array element [35,36].
The degree of concentration of acoustic energy radiated by the ultrasonic transducer in the symmetry axis direction of the acoustic radiation can be expressed as follows:
D I = 10 log 10 P f r o n t P a v e
where Ifront is the on-axis intensity at a certain point in the axial direction, Iave is the average intensity of the monopolar source at a certain point in the axial direction, and DI represents the directivity index. Figure 9 shows the directivity index of the array element (red curve) with an optimized electrode distribution compared with the directivity of the clamped element (black curve). Notably, both directivity indices are similar when the transducer is operating in piston mode at lower frequencies. With an increase in the frequency, the former is evidently softer in mode switching and the trend of the curve in the second half is stable.

4. Conclusions

This study focused on a circular double-stack piezoelectric ultrasonic transducer with AlN as the piezoelectric layer film. The finite-element simulation software COMSOL was used to analyze the characteristics. Regarding the performance simulation and optimization, a detailed investigation and simulation analysis were conducted, the working principle of the transducer was analyzed, and an acoustic–solid–electric multiphysics coupling model was established. Modal and frequency-domain analyses were performed, and the distribution of the electrodes on the transducer was optimized. Based on these results, the acoustic field radiation performance of the transducer was significantly improved. These simulation analyses provide an essential reference and basis for directivity studies of AlN circular double-stack piezoelectric ultrasonic transducers, and are also of particular research significance for the practical development of medical probes. Of course, the structure is still in the preliminary research stage, and further research follow-up and experiments are required to improve the operability of the model.

Author Contributions

X.S. contributed the idea, analysis, measurements, and paper writing; X.R. and H.W. assisted in the measurement; X.L. and X.J. contributed to the idea and assisted in the work development, writing, review, and editing. All authors have read and agreed to the published version of the manuscript.

Funding

This work was supported by National Natural Science Foundation of China (No. 41875026).

Data Availability Statement

Data and code are available from the corresponding authors upon reasonable request.

Conflicts of Interest

The authors declare no conflict of interest.

References

  1. Roh, Y. Ultrasonic transducers for medical volumetric imaging. Jpn. J. Appl. Phys. 2014, 53, 6. [Google Scholar] [CrossRef]
  2. Davis, G.T. Piezoelectric polymer transducers. Adv. Dent. Res. 1987, 1, 45–49. [Google Scholar] [CrossRef]
  3. Tuziuti, T. Influence of sonication conditions on the efficiency of ultrasonic cleaning with flowing micrometer-sized air bubbles. Ultrason. Sonochem. 2016, 29, 604–611. [Google Scholar] [CrossRef] [PubMed]
  4. Darmon, M.; Toullelan, G.; Dorval, V. An Experimental and Theoretical Comparison of 3D Models for Ultrasonic Non-Destructive Testing of Cracks: Part I, Embedded Cracks. Appl. Sci. 2022, 12, 19. [Google Scholar] [CrossRef]
  5. Nesvijski, E.G. Some aspects of ultrasonic testing of composites. Compos. Struct. 2000, 48, 151–155. [Google Scholar] [CrossRef]
  6. Ichiki, M.; Ashida, K.; Kitahara, T. Characterization of piezoelectric lead zirconate titanate from the viewpoint of transducer and power generator properties. Jpn. J. Appl. Phys. 2002, 41, 7080–7083. [Google Scholar] [CrossRef]
  7. Ishikawa, M.; Kurosawa, M.K.; Endoh, A.; Takeuchi, S. Lead zirconate titanate thick-film ultrasonic transducer for 1 to 20 MHz frequency bands fabricated by hydrothermal polycrystal growth. Jpn. J. Appl. Phys. 2005, 44, 4342–4346. [Google Scholar] [CrossRef]
  8. Fei, C.L.; Liu, X.L.; Zhu, B.P.; Li, D.; Yang, X.F.; Yang, Y.T.; Zhou, Q.F. AlN piezoelectric thin films for energy harvesting and acoustic devices. Nano Energy 2018, 51, 146–161. [Google Scholar] [CrossRef]
  9. Hou, R.Z.; Hutson, D.; Kirk, K.J.; Fu, Y.Q. AlN thin film transducers for high temperature non-destructive testing applications. J. Appl. Phys. 2012, 111, 7. [Google Scholar] [CrossRef]
  10. Lu, Y.; Tang, H.-Y.; Fung, S.; Boser, B.E.; Horsley, D.A. Short-range and high-resolution ultrasound imaging using an 8 MHz aluminum nitride PMUT array. In Proceedings of the 2015 28th IEEE International Conference on Micro Electro Mechanical Systems (MEMS), Estoril, Portugal, 18–22 January 2015; pp. 140–143. [Google Scholar]
  11. Defay, E.; Ben Hassine, N.; Emery, P.; Parat, G.; Abergel, J.; Devos, A. Tunability of Aluminum Nitride Acoustic Resonators: A Phenomenological Approach. IEEE Trans. Ultrason. Ferroelectr. Freq. Control 2011, 58, 2516–2520. [Google Scholar] [CrossRef]
  12. Shin, E.; Yeo, H.G.; Yeon, A.; Jin, C.; Park, W.; Lee, S.C.; Choi, H. Development of a High-Density Piezoelectric Micromachined Ultrasonic Transducer Array Based on Patterned Aluminum Nitride Thin Film. Micromachines 2020, 11, 623. [Google Scholar] [CrossRef]
  13. Guedes, A.; Shelton, S.; Przybyla, R.; Izyumin, I.; Boser, B.; Horsley, D. Aluminum nitride pMUT based on a flexurally-suspended membrane. In Proceedings of the 2011 16th International Solid-State Sensors, Actuators and Microsystems Conference, Beijing, China, 5–9 June 2011; pp. 2062–2065. [Google Scholar]
  14. Karuthedath, C.B.; Sebastian, A.T.; Saarilahti, J.; Sillanpaa, T.; Pensala, T. Design and Fabrication of aluminum nitride piezoelectric micromachined ultrasonic transducers for air flow measurements. In Proceedings of the 2019 IEEE International Ultrasonics Symposium (IUS), Glasgow, UK, 6–9 October 2019; pp. 2489–2492. [Google Scholar]
  15. Singh, A.K.; Gorain, U.K. Development of vibrating disc piezoelectric gyroscope. Def. Sci. J. 2004, 54, 387–393. [Google Scholar] [CrossRef]
  16. Guan, Y.F. Performance Analysis of a Microfluidic Pump Based on Combined Actuation of the Piezoelectric Effect and Liquid Crystal Backflow Effect. Micromachines 2019, 10, 584. [Google Scholar] [CrossRef]
  17. Shao, W.W.; Li, P.Y.; Li, Z.J.; Xu, J.; Jiao, Y.; Cui, Y.Y. A micro dual-frequency transducer based on contour-extensional vibration and thickness mode. AIP Adv. 2018, 8, 105301. [Google Scholar] [CrossRef]
  18. Zhao, H.; Li, H.S.; Wang, Y.; Liu, Z.J.; Bian, J.C.; Chen, J.G. A Thickness-Mode High-Frequency Underwater Acoustic Transducer with a Low Sidelobe Level. Actuators 2021, 10, 226. [Google Scholar] [CrossRef]
  19. Farhat, G. Diagnostic Ultrasound Imaging: Inside Out; Thieme: Stuttgart, German, 2007. [Google Scholar]
  20. Codina, R.; Tuerk, O. Modal analysis of elastic vibrations of incompressible materials using a pressure-stabilized finite element method. Finite Elem. Anal. Des. 2022, 206, 103760. [Google Scholar] [CrossRef]
  21. Zhan, J.; Wang, C.; Yan, Y.; Deng, L.; Zhu, W.; Liu, J. Modal Analysis and Condition Evaluation of Substructures for Simply Supported High-Speed Railway Bridge Based on a Simplified Model. J. Bridge Eng. 2022, 27, 04022058. [Google Scholar] [CrossRef]
  22. Meeker, T.R. Publication and Proposed Revision of ANSI/IEEE Standard 176-1987 “ANSI/IEEE Standard on Piezoelectricity”. IEEE Trans. Ultrason. Ferroelectr. Freq. Control. 2002, 43, 717. [Google Scholar]
  23. Zhao, J.; Liu, G.; Huo, S.; Li, Z. Modes and modal analysis of three-dimensional (3D) structures based on the smoothed finite element methods (S-FEMs) using automatically generatable tetrahedral meshes. Eng. Anal. Bound. Elem. 2022, 140, 262–281. [Google Scholar] [CrossRef]
  24. Yue, S.; Hou, H. Method for estimating the radiated sound power of moving sound sources with linear array beamforming. Appl. Acoust. 2021, 182, 108191. [Google Scholar] [CrossRef]
  25. Varshney, K.; Rosa, J.E.; Shapiro, I.; Scott, D. Air-Infiltration Measurements in Buildings Using Sound Transmission Loss Through Small Apertures. Int. J. Green Energy 2013, 10, 482–493. [Google Scholar] [CrossRef]
  26. Grothues, T.M.; Davis, W.C. Sound pressure level weighting of the center of activity method to approximate sequential fish positions from acoustic telemetry. Can. J. Fish. Aquat. Sci. 2013, 70, 1359–1371. [Google Scholar] [CrossRef]
  27. Saliunas, D.; Volkovas, V.; Janusevicius, T. Study of measured indoor low-frequency noise levels resulting from outdoor noise sources, using a simplified physical model as well as empirical and FEM calculations. J. Vibroeng. 2016, 18, 2693–2713. [Google Scholar] [CrossRef]
  28. Wang, T.; Sawada, R.; Lee, C. A Piezoelectric micromachined ultrasonic transducer using piston-like membrane motion. IEEE Electron Device Lett. 2015, 36, 957–959. [Google Scholar] [CrossRef]
  29. Steinwolf, A. Random vibration testing beyond PSD limitations. Sound Vib. 2006, 40, 12–21. [Google Scholar]
  30. Ali, W.R.; Prasad, M. Design and Fabrication of Piezoelectric MEMS Sensor for Acoustic Measurements. Silicon 2022, 14, 6737–6747. [Google Scholar] [CrossRef]
  31. Ali, W.R.; Prasad, M. Piezoelectric Based MEMS Acoustic Sensor for Wide Frequency Applications. IEEE Sens. J. 2021, 21, 27352–27360. [Google Scholar] [CrossRef]
  32. Christensen, S.T.; Olhoff, N. Shape optimization of a loudspeaker diaphragm with respect to sound directivity properties. Control Cybern. 1998, 27, 177–198. [Google Scholar]
  33. Day, A.; Hansen, C.; Bennett, B. Duct Directivity Index Applications. Acoust. Aust. 2009, 37, 93–97. [Google Scholar]
  34. Ahmadi, A.; Mosallaei, H. Plasmonic nanoloop array antenna. Opt. Lett. 2010, 35, 3706–3708. [Google Scholar] [CrossRef]
  35. Dumur, E.; Satzinger, K.J.; Peairs, G.A.; Chou, M.H.; Bienfait, A.; Chang, H.S.; Conner, C.R.; Grebel, J.; Povey, R.G.; Zhong, Y.P.; et al. Unidirectional distributed acoustic reflection transducers for quantum applications. Appl. Phys. Lett. 2019, 114, 223501. [Google Scholar] [CrossRef]
  36. Zhu, N.; Ziolkowski, R.W. Photoconductive THz Antenna Designs with High Radiation Efficiency, High Directivity, and High Aperture Efficiency. IEEE Trans. Terahertz Sci. Technol. 2013, 3, 721–730. [Google Scholar] [CrossRef]
Figure 1. Cell vibration owing to the piezoelectric effect (a,b).
Electronics 11 02915 g001
Figure 2. Illustration of a symmetrical section of the PMUT 3D model.
Electronics 11 02915 g002
Figure 3. Mesh structure of (a) transducer model (including water domain and PML); (b) 1/4 block clamp structure array element; (c) 1/4 block optimized structure array element.
Electronics 11 02915 g003
Figure 4. The first three modes of bending vibration: (a) the first-order bending vibration mode; (b) the second-order mode; (c) the third-order mode.
Electronics 11 02915 g004
Figure 5. Two-dimensional axisymmetric diagram of the sound field: (a) 2D sound pressure map (Pa); (b) 2D map of the SPL (dB); (c) 2D height map of sound pressure; (d) sound wave radiation profile.
Electronics 11 02915 g005
Figure 6. (a) One-quarter of the modified unit model; (b) radiation pattern of the clamped structure; (c) radiation pattern of the double-slit structure.
Electronics 11 02915 g006
Figure 7. (a) Radiation pattern at an external field radius of 0.5 mm; (b) radiation pattern at an external field radius of 50 mm.
Electronics 11 02915 g007
Figure 8. (a) SPL and stress distributions at the acoustic–structure interface; (b) variation curve of the radiated power with radius at two different frequencies.
Electronics 11 02915 g008
Figure 9. The size of the directivity index of the two structures.
Electronics 11 02915 g009
Table 1. Parameters of the mesh structures.
ParameterClamped Structure/Optimized StructureThe Transducer
Maximum element sizeCref/fmax/611.3 µm
Domain elements78,355/96,019-
Boundary elements16,768/24,106-
Edge elements1142/1606-
Number of boundary layers-1
Number of PML layers-8
Cref: typical wave speed of PML.
Publisher’s Note: MDPI stays neutral with regard to jurisdictional claims in published maps and institutional affiliations.

