Article

Leveraging Deep Features Enhance and Semantic-Preserving Hashing for Image Retrieval

School of Computer and Control Engineering, Yantai University, Yantai 264000, China
*
Author to whom correspondence should be addressed.
Electronics 2022, 11(15), 2391; https://doi.org/10.3390/electronics11152391
Submission received: 29 June 2022 / Revised: 24 July 2022 / Accepted: 26 July 2022 / Published: 30 July 2022
(This article belongs to the Special Issue Pattern Recognition and Machine Learning Applications)

Abstract

:
The hash method can convert high-dimensional data into simple binary code, which has the advantages of fast speed and small storage capacity in large-scale image retrieval and is gradually being favored by an increasing number of people. However, the traditional hash method has two common shortcomings, which affect the accuracy of image retrieval. First, most of the traditional hash methods extract many irrelevant image features, resulting in partial information bias in the binary code produced by the hash method. Furthermore, the binary code made by the traditional hash method cannot maintain the semantic similarity of the image. To find solutions to these two problems, we try a new network architecture that adds a feature enhancement layer to better extract image features, remove redundant features, and express the similarity between images through contrastive loss, thereby constructing compact exact binary code. In summary, we use the relationship between labels and image features to model them, better preserve the semantic relationship and reduce redundant features, and use a contrastive loss to compare the similarity between images, using a balance loss to produce the resulting binary code. The numbers of 0s and 1s are balanced, resulting in a more compact binary code. Extensive experiments on three commonly used datasets—CIFAR-10, NUS-WIDE, and SVHN—display that our approach (DFEH) can express good performance compared with the other most advanced approaches.

1. Introduction

In recent years, with the huge increase in the amount of network data, tens of thousands of pictures have been submitted online every minute. It is very difficult for users to look for the pictures they need according to their various requirements. It is difficult to describe similar images by language and find them—perhaps in an attempt to find pictures that are similar to the content of the pictures, pictures that are semantically similar, or images that are similar in terms of their background. Similarity is chiefly divided into two types: one is visual similarity, and the other is semantic similarity. How to quickly process so much data is very important. Among the methods used, the approximate nearest neighbor search [1,2,3]—that is, searching for the closest and most similar data to the query data—has become a very important research topic. Traditional image retrieval methods manually extract the features of the picture and convert them into real values and accomplish an approximate nearest neighbor search by computing a certain distance between two image representations to obtain the most similar images. At present, the database contains a large amount of data; if the traditional image retrieval method is used, it will consume considerable energy and storage space. To resolve the difficulties of the low efficiency of traditional retrieval means, a hash method [4] is proposed. Hash retrieval technology generates a hash function through calculation, which maps the high-dimensional image data matrix after data processing into binary codes of a certain length without changing their original structure [5,6,7]. It maps the high-dimensional characteristic representation of the graphics to a compact two-dimensional code, realizes data dimensionality reduction, and can carry out measurement operations in low-dimensional space [8]. In this way, the retrieval results are obtained by approximate matching by calculating the difference [9] between the binary codes of the pictures and using this difference as a measure of the similarity of the images. Because binary representation is used instead of real value representation, the storage stress is greatly reduced, and binary representation is easier to query than real value representation, thus improving the efficiency of the search [10]. However, the retrieval efficiency of most hashing approaches today depends heavily on the characteristics they use, which are largely unsupervised and thus more suitable for processing semantically similar images than visually similar images.
In today’s era of data explosion, the traditional method of extracting image features by hand is no longer applicable. In addition, the manually extracted image features are only suitable for limited parameters [11,12], and the depicted image features are relatively rough, which may lead to poor experimental results. New approaches based on deep learning and convolutional neural networks can automatically perform feature extraction and self-learning [13], effectively reducing the task of developing and optimizing new feature extractors. In various projects, the convolutional neural network can be seen as a characteristic collector [14], led by an overall function specifically devised for a single task. The convolutional neural network is a deep neural network model, and its convolutional layer uses several groups of convolution kernels to map the image to realize the dimensionality reduction operation of the image and extract the image features more accurately. During the model training process, the CNN learns through the backpropagation algorithm [15,16]. This backpropagation algorithm was first accomplished based on the learning mechanism of the human brain. By continuously optimizing the relevant parameters through the back-propagation algorithm, the data model can achieve a better fitting state. The birth of more optimization algorithms and the creation of various neural network architectures have brought artificial intelligence to a new frontier.
Most of the current hashing methods are combined with the deep neural network to analyze the semantic structure of the image from various angles, considering how to maintain the semantic structure and better combine the neural network with the extracted image features to capture various aspects [17]. In recent years, the methods of image enhancement [18] and image feature space optimization [19] have also achieved success. Inspired by these methods, we consider whether we can optimize the image features from the perspective of features to remove feature redundancy and achieve deep hashing. In addition, thanks to the rise of contrastive learning [20], we are inspired to obtain similarities between images by contrast. Therefore, we propose a deep network architecture with feature enhancement layer as shown in Figure 1 to learn hash codes better. First, the feature enhancement layer constructs the mapping from labels to image features by establishing the relationship between labels and image features and optimizes the features. Then, the image features are further extracted and fused through the feature extraction layer to obtain the most important image features. The network output is converted to a binary code through a hash layer by applying regularization [21] to better approximate the expected discrete values. The loss function makes similar images attract each other, shortens the distance between them, and makes dissimilar images repel each other, increasing the distance between them. This can make the learned Hamming structure more closely approximate the semantic structure of the images.
Other parts of the paper are arranged as follows. In Section 2, we introduce the related work and briefly illustrate the implementation principles of some hashing methods. In Section 3, we detail the network structure of our approach and introduce our loss function. In Section 4, we describe the relevant environment of our machine and its configuration, detailing how our method compares with other methods on three datasets. Finally, Section 5 summarizes our approach, summarizing our conclusions from our experiments.

2. Related Work

Early image retrieval was based on retrieving the surface visual characteristics of pictures, and its characteristics were the basic rough features of pictures extracted by hand [3]. In image retrieval, the approximate nearest neighbor search method, as a more practical method, has attracted increasing attention due to its high efficiency [22]. The purpose of approximate neighbor search technology is to search a piece of data in the database—the data point that is closest to the querier on a certain index. In the case of large databases or high computational cost of ranging, the computational cost of an accurate nearest neighbor search can be very high. As a representative of the retrieval algorithm, the hash method requires only a small amount of space and a low time complexity, which can greatly improve the efficiency of the approximate neighbor search. Earlier hashing algorithms, such as LSH [23], were based on the principle that two adjacent points in the initial space would still be adjacent in the new data space after being mapped the same way, while neighboring points would not always be adjacent after being mapped. Since increasing the bits of the hash code can help the Hamming distance to be closer to the feature space, the accuracy of LSH depends more on the length of the hash code and requires more memory. MLH [24] learns the hash function by optimizing the hinge loss. KSH [25] studies hash functions by minimizing or maximizing the distance with a kernel function. FashH [26] trains to enhance the decision tree to learn the hash function. SDH [27] optimizes hash functions by classification combined with the learning of binary codes. COSDISH [28] learns hash codes through an iterative algorithm based on column sampling. SPLH [29] learns hash functions sequentially according to the number of bits in the hash code, and each function is used to optimize the error generated by the previous function.
Because a deep convolutional neural network has a great ability to conduct self-learning and characteristic expression, it can be used to describe image content more accurately and precisely. By using DCNN’s powerful learning ability and nonlinear mapping ability, combined with hashing algorithms, researchers have presented many deep hashing approaches, which have obvious advantages compared to traditional hashing methods. Among the classical deep hashing techniques, CNNH [30] uses the similarity matrix factorization technique to learn the hash function, constructs the hash value of the training sample, and then uses the neural network to reversely study the picture characteristics and hash function corresponding to the hash value. However, since it is a two-part frame structure, the learned characteristics cannot be fed back to the former to optimize the resulting binary code. To solve the defect of CNNH, NINH [31] is proposed, which changes the network structure of the two parts so that characteristic learning and hash function learning can promote each other. DSRH [32] learns hash functions by extracting semantic similarity information hidden by multiple class labels. DQN [33] learns the representation of image features and hash codes on the basis of controlling quantization loss. DPSH [34] uses the corresponding information of images and paired tags to study characteristics and hash functions, respectively. DSH [35] draws on the Siamese network architecture and constructs a loss function to learn the hash function of similarity, which improves the discrimination ability of the network. DTSH [36] extends labels on the basis of DPSH and uses triple tag-related information to study the objective function. DHN [37] studies the hash function by optimizing the quantization loss function of image pairs and the cross entropy loss function of image pairs. HashNet [38] presents a new deep learning architecture to learn hash codes from imbalanced similarity-like data. SSDH [39] assumes that the semantic label has hidden attribute control and learns the hash function by optimizing the classification loss. These deep learning-based methods can be classified into unsupervised approaches [7,40], supervised approaches [24,41] and semisupervised approaches [24,42]. Unsupervised approaches use unlabeled datasets as training samples to study hash codes, such as LSH. For the first time, LSH associates an image with a hash and randomly projects the data points in its feature space to produce a binary code. The disadvantage is that only a longer binary code can be generated to improve the retrieval performance. The semisupervised method uses some data with label marks and some data without label marks to study the hash function, such as SSH [43]. SSH uses the supervision information to simulate the hash function to improve the precision of the binary code. By reducing the variance of the tag data point pair, the hash code is as balanced and independent as possible, thereby avoiding overfitting. The supervised hash method uses labeled data to learn the hash function, such as KSH [25], and trains the hash function bit by bit using the equivalent characteristics of the Hamming distance and the scalar product of the code, thereby generating a more effective binary code. Although most hashing methods first relax the code in the process of optimizing the objective function and then quantize the result to produce binary codes, it is not certain that the code obtained after quantization is optimal. To solve this difficulty, novel approaches such as DGH [44] and SDH [27] are proposed, which introduce auxiliary variables to optimize the regularization problem, remove the defects of relaxation, and improve the accuracy.
Algorithms of traditional hashing methods result in an insufficient description of low-level image features and find it difficult to express rich semantic information of images [45]. Most of the hashing methods proposed in recent years are from the perspective of keeping the global semantics of the image unchanged. By using the cross-entropy loss and the quantization loss [46] to optimize the binary encoding, the similarity between the original space and the binary space can be better maintained. Our work differs from other methods in some ways. (1) We consider starting from the local feature direction of the images, hoping to obtain more essential features through the relationship between labels and features, thereby reducing the deviation caused by irrelevant features. (2) By using the contrast loss to measure the similarity between images, similar images are close to each other, and dissimilar images are far away from each other. (3) We obtain a more compact binary code by adding regularization to the network output and adding balance constraints.

3. Proposed Method

We try to produce a tighter binary code by adding network structure and using three kinds of constraints. (a) The distance between binary codes produced by similar pictures is much smaller than the distance between binary codes of different pictures. Similar images attract each other and dissimilar images repel each other, as shown in Figure 2. (b) Images with the same tag attribute should be mapped to similar hash values, and images with no shared tag attributes should be mapped to different hash values. (c) Zeroes and ones are distributed in the binary code as evenly as possible.

3.1. Deep Network Framework

This consists of a feature enhancement layer, three convolutional pooling layers, two fully connected layers, a hash layer, and a loss layer. The feature enhancement layer is responsible for processing image features and marking image features. The convolution pooling layer transfers the extracted features to the fully connected layer by reducing the dimensionality of the picture characteristics. In addition, the fully connected layer is responsible for integrating image features and converting the image into binary code through the hash layer. During training, the loss function in the loss layer continuously optimizes the parameters.

3.1.1. Feature Enhancement Layer

Picture tags are not only convenient for image sorting but also important information for learning hash functions. We consider that since image labels can represent the classification of images and classification is associated with image features, we assume that image labels hide some features of images that can distinguish their categories. Based on this assumption, we assume that the matrix W F R K × C is a mapping from labels to image features, where K represents the dimension of the hash code and C represents the number of categorical labels.

3.1.2. Feature Extractor

Most image retrieval and image classification methods work in a similar way, and they both belong to a way of processing images. The extraction of image features by the two is mostly consistent, and both can determine the classification of the image and determine the characteristics of the image from the given label. Inspired by the Siamese network, we learned to study the hash function by learning the similarity between the two images, not from the direction of image classification, to quantify the output to obtain a good binary code. Because the hash code is binary, 1 in the binary code indicates that the feature exists, and 0 indicates that the feature does not exist.

3.1.3. Hash Layer

In traditional hashing methods, the main task of most hash layers is to encode features for output. Although our hash layer is similar to a traditional hash layer, our hash layer is mainly used for feature mapping and generating more compact binary codes. Traditional hashing methods may not care about the semantic information of image features, but we found that different neurons in the hash layer control whether different features exist, and using these findings, we can better maintain semantic similarity. We set the matrix W H R P K as the weights of the hash layer. P is the number of elements in the output z i f of the previous layer, and k is the number of binary code bits. z i h R K represents the output of the input data x i through the hash layer. Then,
z i h = relu ( ( W H ) z i f + b H )
where b H is the bias of the hash layer, and relu ( ) is represented as
relu ( x ) = x x > 0 0 x 0
Therefore, the hash codes can be expressed as b i = sgn ( z i h ) ; if x 0 , sgn ( x ) = 1 ; otherwise, sgn ( x ) = 1 .

3.1.4. Loss Layer

The loss layer optimizes parameters through a loss function. The similarity between pictures is described by the contrastive loss, the error of the quantization process is reduced by the quantization loss, and the numbers of 0s and 1s in the binary code are balanced by the balanced loss.

3.2. Objective Function

We divide the overall objective function into three parts: contrastive loss, quantization loss, and balanced loss. Let X = { x n } be N pictures and Y = { y n { 0 , 1 } C } be the tag attribute marked with each image, where C is defined as the number of categories of label attributes. Our approach is to learn the mapping from image X to k-bit binary codes: F : X { 0 , 1 } k while maintaining the similarity from the picture structure to the Hamming structure.

3.2.1. Contrastive Loss

The purpose of the loss is to make the difference between the binary codes of similar pictures smaller and the difference between the hash codes of different pictures larger. As the so-called “things cluster together, people are divided into groups”, people with similar characters will attract each other, and different people will repel each other, as shown in Figure 3. Therefore, for a pair of images x 1 , x 2 { x n } N and the corresponding binary code b 1 , b 2 { + 1 , 1 } k , if the two pictures are similar, then Y = 1 ; otherwise, Y = 0 . The loss function of both is defined as
L c ( W , ( x 1 , x 2 , Y ) ) = 1 2 ( 1 Y ) max ( M D ( x 1 , x 2 ) , 0 ) 2 + 1 2 Y D 2 ( x 1 , x 2 )
where W represents the weight of the network structure, and x 1 and x 2 represent two random images in the dataset. where D ( · , · ) indicates the Euclidean distance between the two pictures and M is the boundary value of contrast loss. The first term of Formula (3) maps binary codes of different images. When the distance between them is greater than the m value, the loss between them will be ignored. The latter term is a computation that describes similar images.
We choose to randomly select image pairs from the training images { x n } N . Assuming a total of N p image pairs, the overall contrastive loss of the images is as follows:
L c = i = 1 N p L c ( W , ( x i , 1 , x i , 2 , Y i ) ) s . t . x i , j { x n } N , j { 1 , 2 } , i

3.2.2. Quantization Loss

On the one hand, to improve the quality of binary codes and produce more accurate binary codes, we consider adding constraints to the hash layer. On the other hand, to reduce the quantization error caused by the mapping of feature representations to binary hash codes, we consider increasing the quantization loss in an effort to keep the binary-like values closer to 1 or −1. The quantization loss is described as
L q = i = 1 N | z i h | 0.5 e t t
where e represents a vector with all elements equal to 1 and t { 1 , 2 } .

3.2.3. Balanced Loss

On the other hand, considering the problem of binary code balance, we decide to add a constraint to keep the numbers of 0s and 1s in the binary code balanced, each accounting for 50%. For the input image x i , the corresponding z i h forms a discrete distribution on { 0 , 1 } . Then, our balanced loss is defined as
L b = i = 1 N | mean ( z i h ) 0.5 | t
where t { 1 , 2 } . mean ( · ) is represented as follows:
mean ( z i h ) = 1 K i = 1 k z i h

3.2.4. Total Loss

The total objective function we constructed is
L = L c + θ L q + η L b
where θ and η are the weight parameters for these terms.

3.3. Optimization

Due to the difference between the Hamming distance and Euclidean distance, ignoring the binary constraint results in inaccurate binary code. With the relaxation scheme, the threshold is approximated mainly by a saturated nonlinear function, but this will slow down the convergence of the network. Finally, instead of the binary constraint, we apply regularization to change Formula (3) to
L c o ( W , ( x 1 , x 2 , Y ) ) = 1 2 ( 1 Y ) max ( M x 1 x 2 2 2 , 0 ) 2 + 1 2 Y x 1 x 2 2 2 + λ W 2 2
where · 2 denotes the L2 norm, and λ is the value parameter that controls the intensity of regularization. Here, the L2 norm is used to narrow the output range of the network and control the complexity of the model to reduce the risk of the structural method. Then, Formula (3) can be rewritten as
L c = i = 1 N { 1 2 ( 1 Y i ) max ( M x i , 1 x i , 2 2 2 , 0 ) 2 + 1 2 Y i x i , 1 x i , 2 2 2 + λ W 2 2 }
On the basis of this function, the backward propagation algorithm with gradient descent is used to train the network. When Y = 1 and the function is L c = 1 2 i = 1 N Y D 2 , calculate the gradient L c W —that is, calculate the partial derivative of x 1 and x 2 , respectively:
L c W = L c x 1 = D D x 1 = x 1 x 2 , D > M L c x 2 = D D x 2 = ( x 1 x 2 ) , D < M
When Y = 0 , L c = 1 2 i = 1 N ( 1 Y ) max ( M D , 0 ) 2 , the calculated gradient is
L c W = ( M D ) D W , D < M 0 , D > M
L c W = L c x 1 = ( M D ) D x 1 = ( M D ) x 1 x 2 D L c x 2 = ( M D ) D x 2 = ( M D ) ( x 1 x 2 ) D

3.4. Image Retrieval

Finally, the image to be retrieved is used as input, the corresponding binary code is compared with the binary code of other images, the distance is calculated, and the pictures in the database are sorted according to the size of the Hamming distance. An image with a smaller distance is more similar to the query image, as shown in Figure 4.

4. Experiments

We conducted experiments and evaluations on the model presented by our approach on three standard datasets and compared these with other scholars’ methods to demonstrate the feasibility of our approach. These experiments were implemented through Python’s deep learning framework TensorFlow. The operating system used by our computer was Windows 10, the memory was 16G, and it was equipped with an NVIDIA GeForce RTX 3060 laptop GPU.
In the training process, we used a small part of the gradient descent algorithm for optimization, set the batch size to 200, the momentum to 0.9, the weight decay to 0.001, the learning rate to 0.001, and used a total of 150,000 iterations.

4.1. Datasets Used in the Experiment

(1)
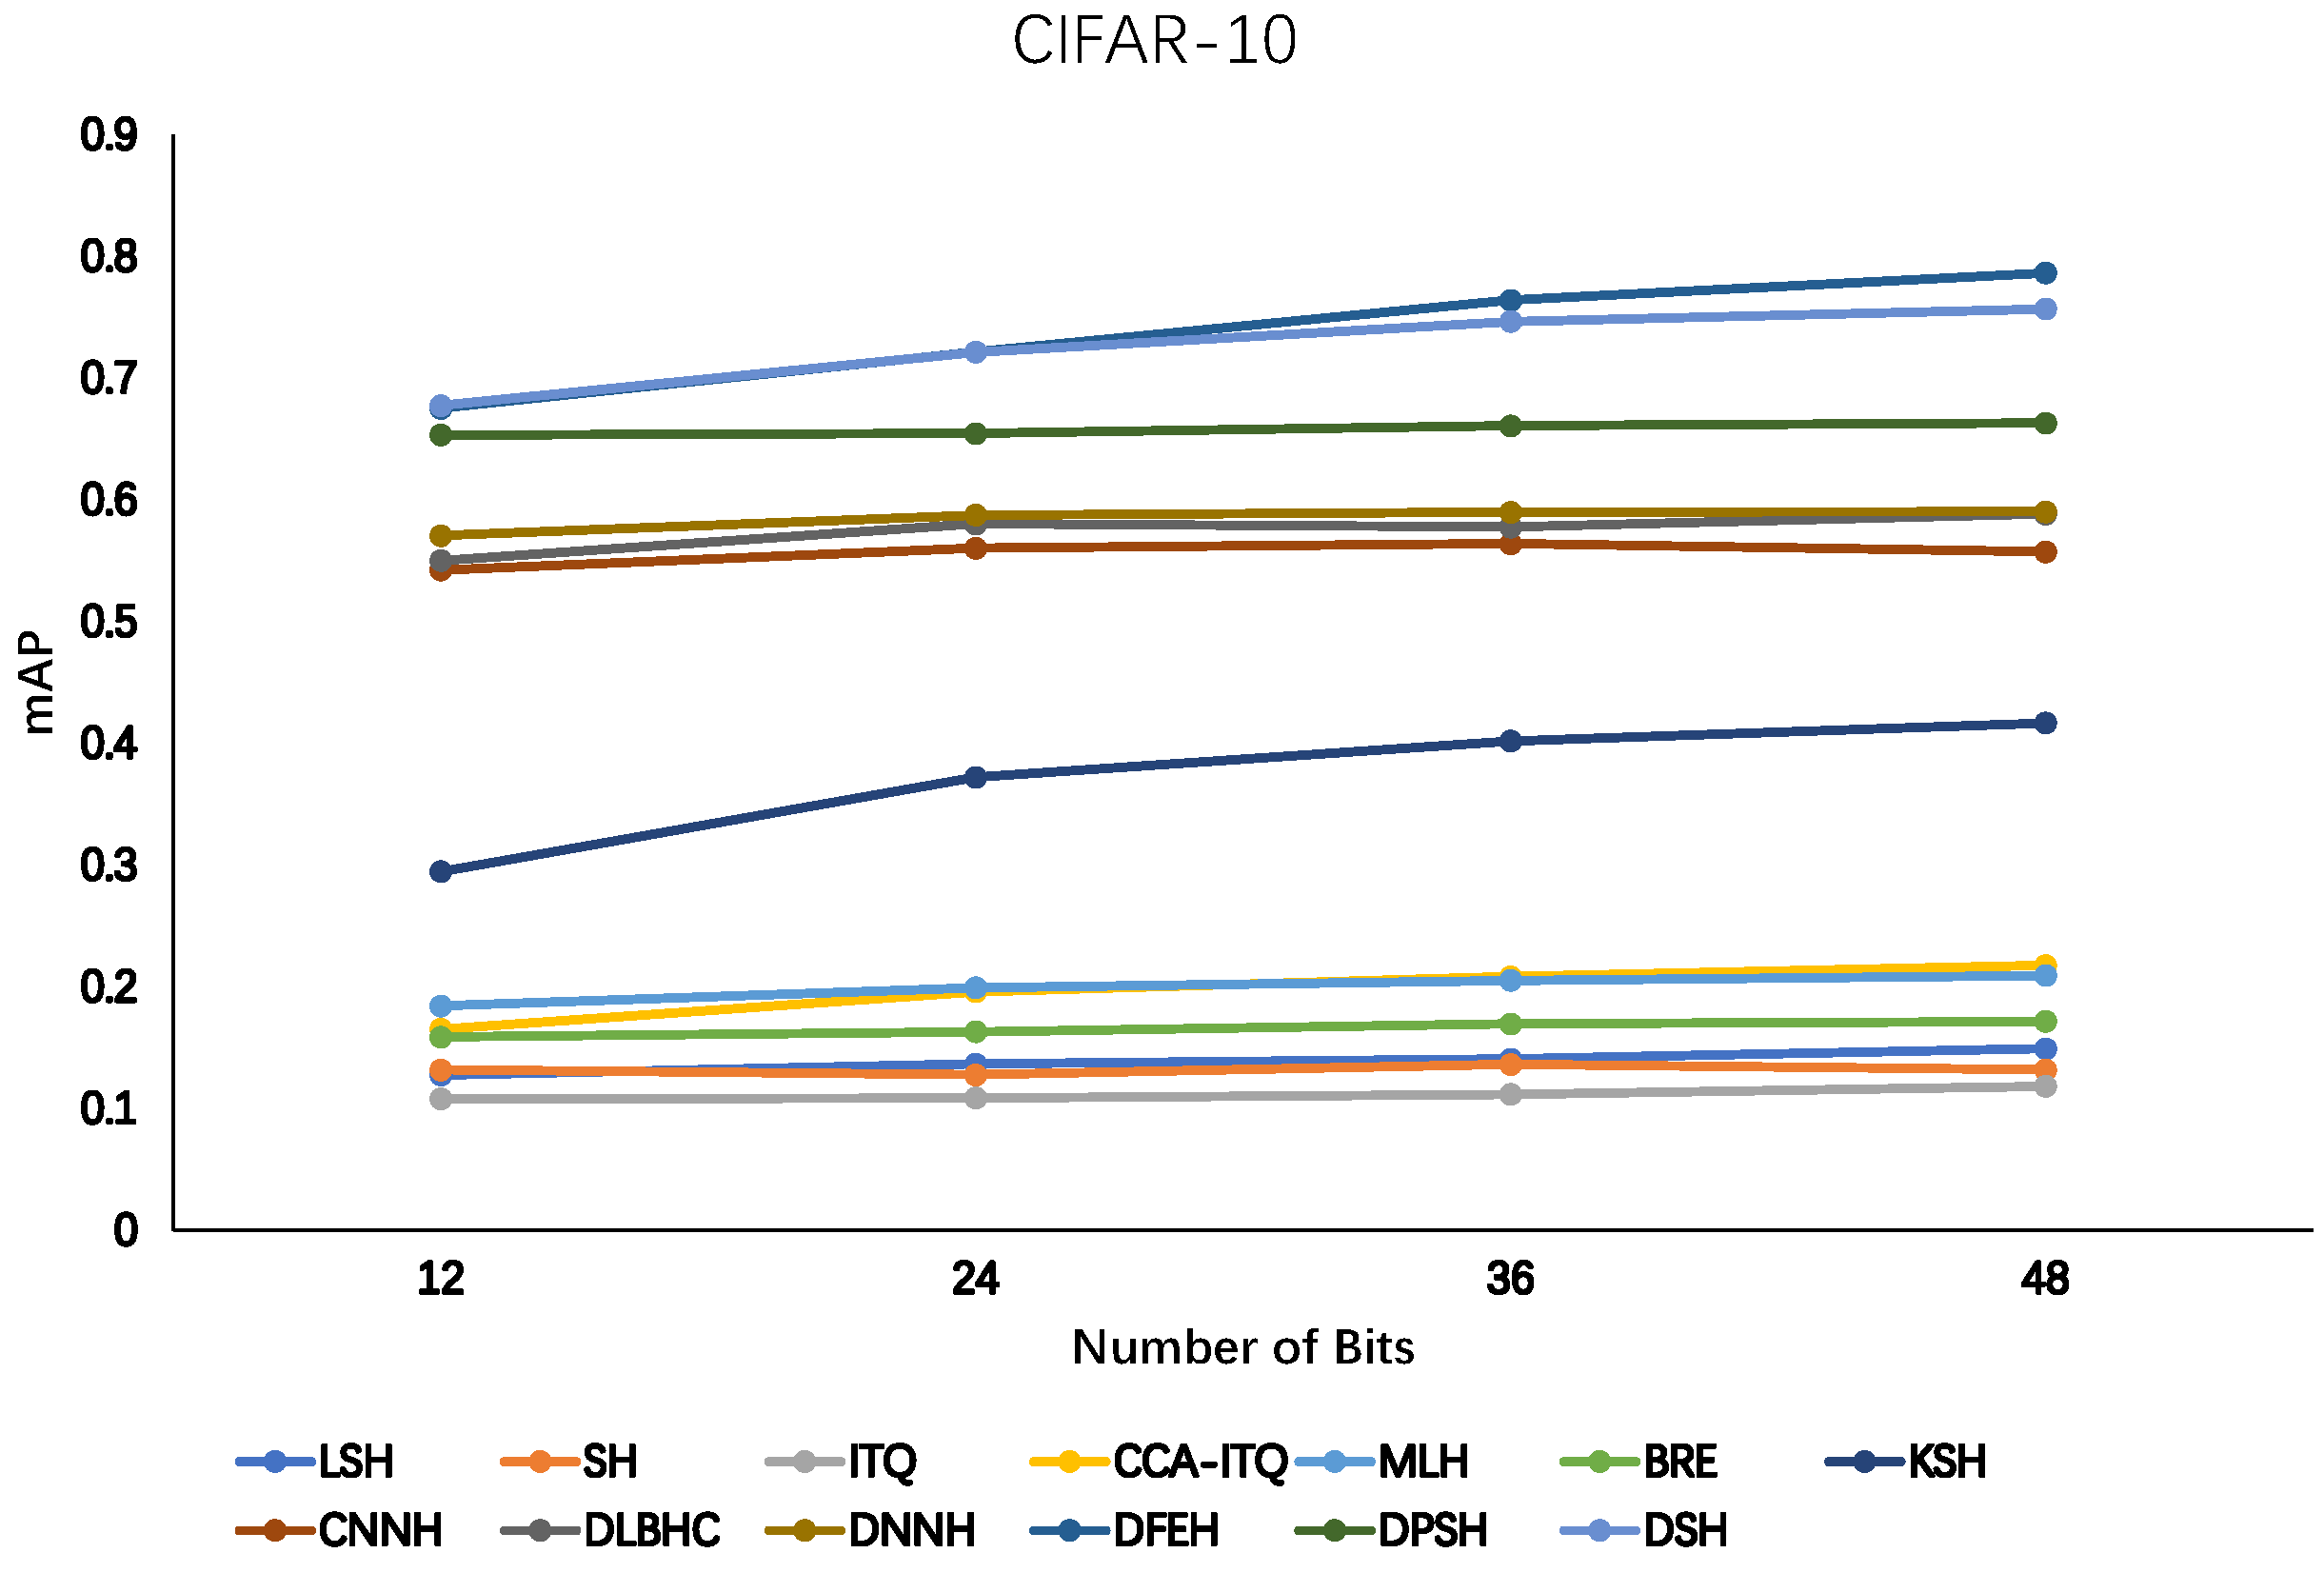
CIFAR-10 [47]. The dataset has 60,000 color images divided into 10 classes in total, each with 6000 pictures. There are 50,000 training batches and 10,000 pictures in each batch. The other 10,000 images are used for testing and form a separate batch.
(2)
NUS-WIDE [48]. The dataset is a multilabel dataset containing 269,648 pictures acquired from Flickr. Each picture receives one or more of the 81 category tags. Our experiments selected the most common 21 categories, including 195,834 images, with 5000 images in each category as the training set, and other pictures as the test dataset.
(3)
SVHN [49]. The SVHN dataset contains 73,257 32 × 32 digital images, each containing a set of “0–9” Arabic numerals. However, the number of samples per class is very different. To solve this problem, we used class-aware sampling during the training phase and randomly selected 20 images from each class in each iteration.
During our experiments, the similarity between images was determined by the image tags, and pictures with the same kind of labels were regarded as similar, and vice versa. In addition, if the images contained multiple kinds of labels, the intersection of their label information was considered to be similar if the intersection was not an empty set; otherwise, they were regarded as dissimilar.

4.2. Evaluation Index

We followed the practice of our predecessors [30,31] and adopted three evaluation metrics to assess the efficiency of our approach, including the mean average precision (mAP) value of the hash code under different bits, the precision-recall curve, and the precision within Hamming radius r. Here, we set r = 2 .
mAP [50] is a performance indicator that reflects the overall performance. Its calculation formula is described as
m A P = 1 N i = 1 N 1 N * j = 1 N * P r e c i s i o n
where N is the quantity of query sets, and N * denotes the number of cases related to positive examples in the retrieval sets. The precision [50] predicts how many positive samples are real, and the recall rate [50] accurately predicts how many positive samples are in the sample. The formulas for precision and recall are defined as
P r e c i s i o n = T P T P + F P
R e c a l l = T P T P + F N
where T P , F P , and F N in the formula represent the positive samples in the correct classification, the positive samples in the incorrect classification, and the negative samples in the incorrect classification, respectively.
The precision within the Hamming radius r represents the Hamming distance between all images and a given query image, given the proportion of the number of images with a Hamming distance less than r in all retrieval results.

4.3. Experimental Results

Our experiments compare the accuracy of our present approach and other hashing methods on three different large datasets. Our experimental results show that adding a neural network layer to the method can significantly improve the accuracy of the method. This shows that the features obtained by using the neural network can not only obtain low-level characteristics but also higher-level semantic characteristics, thereby improving the accuracy of the method.
Table 1 shows the training time of our method on different datasets, which is largely spent on the extraction of high-quality image features. Table 2 and Table 3 respectively show the comparison of our method with traditional methods and recent methods in different hash code lengths. In Figure 5 and Figure 6, we can see the trend of the impact of different hash code lengths on mAP values on different datasets. From Figure 7, we can see the relationship between training loss, test loss and the number of iterations. The loss convergence is fast, because we can extract more useful information from better features. Compared with the traditional hashing method, it is obvious that our method has a small improvement. After all, the traditional hashing method usually uses the features extracted by hand, which has great redundancy, and it is not easy to obtain high-level image features with higher accuracy. Our method uses an optimized CNN network to improve the efficiency of feature extraction. In addition, in Figure 5, we can see that our method has a small improvement compared with some deep hashing approaches, and the accuracy is improved by approximately 1%, which reflects the feasibility of our presented approach.

4.4. Ablation Study

In this module, we study the effect of certain components or variables on the experimental results.

4.4.1. Ablation Study On Regularization

Because adjacent points may be mapped to different binary codes during quantization, we added regularization to reduce the variation from the original image space to Hamming space, thus improving retrieval precision. To prove the availability of regularization, we trained the model with 12 hash code bits and set M = 24 , training the models when λ was 0, 0.1, 0.01, and 0.001, and compared their experimental results.
The experimental results obtained with different λ values are shown in Table 4. Clearly, different regularization weight parameters can lead to different mAP values. Not using regularization and bad weight parameters can lead to bad experimental results. Experiments show that a value of k between 0.01 and 0.001 will produce better results. This part proves that adding regularization still helps to improve the accuracy of our method.

4.4.2. Ablation Study on Loss Function

To obtain a more compact binary code, we add two constraints: one is a quantization constraint to reduce the error of the quantization process, and the other is a balance constraint to ensure that the numbers of 0s and 1s in the binary code are balanced. Next, we analyze the effect of constraints through experiments and verify whether the accuracy of our method can be improved by adding two constraints.
Table 5 shows the indicators under the influence of each part of the loss function. It can be seen from the table that using only one loss function produces the worst effect, and using three losses will achieve better results. It can be found from the table that the impact of loss measurement on our method is greater than balance loss. In this way, we can infer that the two constraints still have a great effect on improving the efficiency of our method.

4.4.3. Ablation Study on Deep Network

In contrast to the usual network architecture, we add feature enhancement layers, hash layers, and loss layers to better compute the performance of each layer. As shown in Figure 8, compared with the initial network framework, the performance of our network on each dataset has been slightly improved, which reflects the feasibility of our network architecture. We attribute the improvement to image feature augmentation, which emphasizes label information to connect with image features and is more able to preserve semantic information when extracting image characteristics.

5. Conclusions

This paper proposes a new network architecture for image retrieval that not only preserves the semantic structure of images but also fully captures high-quality features of images. Our framework structure consists of four parts: a feature enhancement layer, feature extraction layer, hash layer, and loss layer. The framework starts from the perspective of image label features, not from the overall image, and adds a feature enhancement layer that specializes in processing and optimizing the high-quality features of the images, reducing the acquisition of a large number of useless and repeated features and reducing the redundant information brought by feature information. A great deal of time is spent in exchange on high-quality image features, so that the resulting binary code carries more primary feature information but will lack some secondary feature information. By optimizing the contrastive loss function and imposing constraints on the hash code, a more concise and compact binary code can be obtained. The experimental results show that starting from the feature orientation of the image also achieves good performance. In future work, we will further explore the influence of primary and secondary features on image retrieval and explore methods to obtain the best features of images.

Author Contributions

Conceptualization, J.L.; methodology, J.L.; software, X.Z.; validation, X.Z.; formal analysis, X.Z.; investigation, X.Z.; resources, X.Z.; data curation, X.Z.; writing—original draft preparation, X.Z.; writing—review and editing, X.Z.; visualization, X.Z.; supervision, J.L.; project administration, J.L.; funding acquisition, J.L. All authors have read and agreed to the published version of the manuscript.

Funding

This research was funded by the National Natural Science Foundation of China (62072391, 62172351, 61572419) and the Natural Science Foundation of Shandong Province (ZR2020MF148).

Institutional Review Board Statement

Not applicable.

Informed Consent Statement

Not applicable.

Data Availability Statement

Not applicable.

Acknowledgments

We greatly appreciate the reviewers’ feedback on our paper, which will help us to add supplements to the paper and make the paper more complete.

Conflicts of Interest

The authors declare no conflict of interest.

Abbreviations

The following abbreviations are used in this manuscript:
CNNConvolutional Neural Network

References

  1. Shakhnarovich, G.; Darrell, T.; Indyk, P. Nearest-Neighbor Methods in Learning and Vision. IEEE Trans. Neural Netw. 2008, 19, 377. [Google Scholar]
  2. Dubey, A.; Maaten, L.; Yalniz, Z.; Li, Y.; Mahajan, D. Defense Against Adversarial Images Using Web-Scale Nearest-Neighbor Search. In Proceedings of the 2019 IEEE/CVF Conference on Computer Vision and Pattern Recognition (CVPR), Long Beach, CA, USA, 15–20 June 2020. [Google Scholar]
  3. Smeulders, A.W.M.; Worring, M. Content-based image retrieval at the end of the early years. IEEE Trans. Pattern Anal. Mach. Intell. 2000, 22, 1349–1380. [Google Scholar] [CrossRef]
  4. Liu, W.; Wang, J.; Kumar, S.; Chang, S.F. Hashing with Graphs. In Proceedings of the 28th International Conference on Machine Learning, ICML 2011, Bellevue, WA, USA, 28 June–2 July 2011. [Google Scholar]
  5. Datar, M. Locality-sensitive hashing scheme based on p-stable distributions. In Proceedings of the Twentieth Annual Symposium on Computational Geometry, Brooklyn, NY, USA, 8–11 June 2004. [Google Scholar]
  6. Arthur, D.; Oudot, S.Y. Reverse Nearest Neighbors Search in High Dimensions using Locality-Sensitive Hashing. arXiv 2010, arXiv:1011.4955. [Google Scholar]
  7. Weiss, Y.; Torralba, A.; Fergus, R. Spectral Hashing. Int. Conf. Neural Inf. Process. Syst. 2008, 21. [Google Scholar]
  8. Lin, K.; Lu, J.; Chen, C.S.; Jie, Z. Learning Compact Binary Descriptors with Unsupervised Deep Neural Networks. In Proceedings of the 2016 IEEE Conference on Computer Vision and Pattern Recognition (CVPR), Las Vegas, NV, USA, 27–30 June 2016. [Google Scholar]
  9. Movshovitz-Attias, Y.; Toshev, A.; Leung, T.K.; Ioffe, S.; Singh, S. No Fuss Distance Metric Learning using Proxies. In Proceedings of the 2017 IEEE International Conference on Computer Vision (ICCV), Venice, Italy, 22–29 October 2017. [Google Scholar]
  10. Goldberger, J.; Roweis, S.T.; Hinton, G.E.; Salakhutdinov, R.R. Neighbourhood Components Analysis; MIT Press: Cambridge, MA, USA, 2004. [Google Scholar]
  11. Zheng, L.; Yang, Y.; Tian, Q. SIFT Meets CNN: A Decade Survey of Instance Retrieval. IEEE Trans. Pattern Anal. Mach. Intell. 2016, 40, 1224–1244. [Google Scholar] [CrossRef] [Green Version]
  12. Gordo, A.; Almazán, J.; Revaud, J.; Larlus, D. Deep Image Retrieval: Learning Global Representations for Image Search. In Proceedings of the European Conference on Computer Vision, Amsterdam, The Netherlands, 11–14 October 2016. [Google Scholar]
  13. Zhang, R.; Lin, L.; Zhang, R.; Zuo, W.; Zhang, L. Bit-Scalable Deep Hashing with Regularized Similarity Learning for Image Retrieval and Person Re-identification. IEEE Trans. Image Process. 2015, 24, 4766–4779. [Google Scholar] [CrossRef] [Green Version]
  14. Shin, H.C.; Roth, H.R.; Gao, M.; Le, L.; Xu, Z.; Nogues, I.; Yao, J.; Mollura, D.; Summers, R.M. Deep Convolutional Neural Networks for Computer-Aided Detection: CNN Architectures, Dataset Characteristics and Transfer Learning. IEEE Trans. Med Imaging 2016, 35, 1285–1298. [Google Scholar] [CrossRef] [Green Version]
  15. Leonard, J.; Kramer, M.A. Improvement of the backpropagation algorithm for training neural networks. Comput. Chem. Eng. 1990, 14, 337–341. [Google Scholar] [CrossRef]
  16. Toda-Caraballo, I.; Garcia-Mateo, C.; Capdevila, C. Back propagation algorithm. Rev. Metal. 2010, 46, 499–510. [Google Scholar] [CrossRef] [Green Version]
  17. Liu, C.; Ma, J.; Tang, X.; Liu, F.; Zhang, X.; Jiao, L. Deep Hash Learning for Remote Sensing Image Retrieval. IEEE Trans. Geosci. Remote Sens. 2021, 59, 3420–3443. [Google Scholar] [CrossRef]
  18. Xie, Q.; Dai, Z.; Hovy, E.; Luong, T.; Le, Q. Unsupervised data augmentation for consistency training. Adv. Neural Inf. Process. Syst. 2020, 33, 6256–6268. [Google Scholar]
  19. Jose, A.; Ottlik, E.S.; Rohlfing, C.; Ohm, J.R. Optimized feature space learning for generating efficient binary codes for image retrieval. Signal Process. Image Commun. 2022, 100, 116529. [Google Scholar] [CrossRef]
  20. Khosla, P.; Teterwak, P.; Wang, C.; Sarna, A.; Tian, Y.; Isola, P.; Maschinot, A.; Liu, C.; Krishnan, D. Supervised contrastive learning. Adv. Neural Inf. Process. Syst. 2020, 33, 18661–18673. [Google Scholar]
  21. Bickel, P.J.; Li, B.; Tsybakov, A.B.; van de Geer, S.A.; Yu, B.; Valdés, T.; Rivero, C.; Fan, J.; van der Vaart, A. Regularization in statistics. Test 2006, 15, 271–344. [Google Scholar] [CrossRef] [Green Version]
  22. Tschopp, D.; Diggavi, S. Approximate Nearest Neighbor Search through Comparisons. arXiv 2009, arXiv:0909.2194. [Google Scholar]
  23. Andoni, A.; Indyk, P. Near-Optimal Hashing Algorithms for Approximate Nearest Neighbor in High Dimensions. In Proceedings of the 47th Annual IEEE Symposium on Foundations of Computer Science (FOCS 2006), Berkeley, CA, USA, 21–24 October 2006. [Google Scholar]
  24. Norouzi, M.; Fleet, D.J. Minimal loss hashing for compact binary codes. In Proceedings of the 28th International Conference on Machine Learning (ICML-11), Bellevue, WA, USA, 28 June–2 July 2011. [Google Scholar]
  25. Wei, L.; Wang, J.; Ji, R.; Jiang, Y.G.; Chang, S.F. Supervised Hashing with Kernels. In Proceedings of the 2012 IEEE Conference on Computer Vision and Pattern Recognition, Providence, RI, USA, 16–21 June 2012. [Google Scholar]
  26. Lin, G.; Shen, C.; Shi, Q.; Hengel, A.; Suter, D. Fast Supervised Hashing with Decision Trees for High-Dimensional Data. In Proceedings of the IEEE Conference on Computer Vision and Pattern Recognition, Columbus, OH, USA, 23–28 June 2014. [Google Scholar]
  27. Shen, F.; Shen, C.; Liu, W.; Shen, H.T. Supervised Discrete Hashing. In Proceedings of the IEEE Conference on Computer Vision and Pattern Recognition, Boston, MA, USA, 7–12 June 2015; pp. 37–45. [Google Scholar]
  28. Kang, W.; Li, W.; Zhou, Z.H. Column Sampling Based Discrete Supervised Hashing. In Proceedings of the AAAI Conference on Artificial Intelligence, Phoenix, AZ, USA, 12–17 February 2016. [Google Scholar]
  29. Wang, J.; Kumar, S.; Chang, S.F. Sequential Projection Learning for Hashing with Compact Codes. In Proceedings of the International Conference on International Conference on Machine Learning, Haifa, Israel, 21–24 June 2010. [Google Scholar]
  30. Xia, R.; Pan, Y.; Lai, H.; Liu, C.; Yan, S. Supervised hashing for image retrieval via image representation learning. In Proceedings of the Twenty-Eighth AAAI Conference on Artificial Intelligence (AAAI-14), Quebec City, QC, Canada, 27–31 July 2014. [Google Scholar]
  31. Lai, H.; Pan, Y.; Ye, L.; Yan, S. Simultaneous Feature Learning and Hash Coding with Deep Neural Networks. In Proceedings of the IEEE Conference on Computer Vision and Pattern Recognition (CVPR), Boston, MA, USA, 7–12 June 2015; pp. 3270–3278. [Google Scholar]
  32. Zhao, F.; Huang, Y.; Wang, L.; Tan, T. Deep Semantic Ranking Based Hashing for Multi-Label Image Retrieval. In Proceedings of the 2015 IEEE Conference on Computer Vision and Pattern Recognition (CVPR), Boston, MA, USA, 7–12 June 2015. [Google Scholar]
  33. Cao, Y.; Long, M.; Wang, J.; Zhu, H.; Wen, Q. Deep Quantization Network for Efficient Image Retrieval. In Proceedings of the Thirtieth AAAI Conference on Artificial Intelligence (AAAI-16), Phoenix, AZ, USA, 12–17 February 2016. [Google Scholar]
  34. Li, W.J.; Wang, S.; Kang, W.C. Feature Learning based Deep Supervised Hashing with Pairwise Labels. arXiv 2015, arXiv:1511.03855. [Google Scholar]
  35. Liu, H.; Wang, R.; Shan, S.; Chen, X. Deep Supervised Hashing for Fast Image Retrieval. Int. J. Comput. Vis. 2019, 127, 1217–1234. [Google Scholar] [CrossRef]
  36. Wang, X.; Shi, Y.; Kitani, K.M. Deep Supervised Hashing with Triplet Labels. In Proceedings of the Asian Conference on Computer Vision, Taipei, Taiwan, 20–24 November 2017. [Google Scholar]
  37. Zhu, H.; Long, M.; Wang, J.; Cao, Y. Deep Hashing Network for efficient similarity retrieval. In Proceedings of the AAAI Conference on Artificial Intelligence, Phoenix, AZ, USA, 12–17 February 2016. [Google Scholar]
  38. Cao, Z.; Long, M.; Wang, J.; Yu, P.S. HashNet: Deep Learning to Hash by Continuation. In Proceedings of the IEEE International Conference on Computer Vision (ICCV), Venice, Italy, 22–29 October 2017. [Google Scholar]
  39. Yang, H.F.; Lin, K.; Chen, C.S. Supervised Learning of Semantics-Preserving Hash via Deep Convolutional Neural Networks. IEEE Trans. Pattern Anal. Mach. Intell. 2015, 40, 437–451. [Google Scholar] [CrossRef] [Green Version]
  40. Gionis, A. Similarity Search in High Dimensions via Hashing. In Proceedings of the Vldb, Edinburgh, UK, 7–10 September 1999; Volume 99, pp. 518–529. [Google Scholar]
  41. Kulis, B.; Darrell, T. Learning to Hash with Binary Reconstructive Embeddings. In Proceedings of the International Conference on Neural Information Processing Systems, Bangkok, Thailand, 1–5 December 2009. [Google Scholar]
  42. Zhang, C.; Zheng, W.S. Semi-Supervised Multi-View Discrete Hashing for Fast Image Search. IEEE Trans. Image Process. 2017, 26, 2604–2617. [Google Scholar] [CrossRef]
  43. Wang, J.; Kumar, S.; Chang, S.F. Semi-Supervised Hashing for Large-Scale Search. IEEE Trans. Pattern Anal. Mach. Intell. 2012, 34, 2393–2406. [Google Scholar] [CrossRef] [Green Version]
  44. Liu, W.; Mu, C.; Kumar, S.; Chang, S.F. Discrete Graph Hashing. Adv. Neural Inf. Process. Syst. 2014, 4, 3419–3427. [Google Scholar]
  45. Luo, X.; Wang, H.; Wu, D.; Chen, C.; Deng, M.; Huang, J.; Hua, X.S. A Survey on Deep Hashing Methods. ACM Trans. Knowl. Discov. Data, 2022; Just Accepted. [Google Scholar] [CrossRef]
  46. Liu, B.; Cao, Y.; Long, M.; Wang, J.; Wang, J. Deep triplet quantization. In Proceedings of the 26th ACM International Conference on Multimedia, Seoul, Korea, 22–26 October 2018; pp. 755–763. [Google Scholar]
  47. Krizhevsky, A.; Hinton, G. Learning multiple layers of features from tiny images. In Handbook of Systemic Autoimmune Diseases; Elsevier: Amsterdam, The Netherlands, 2009; Volume 1. [Google Scholar]
  48. Chua, T.S.; Tang, J.; Hong, R.; Li, H.; Luo, Z. NUS-WIDE: A real-world web image database from National University of Singapore. In Proceedings of the Acm International Conference on Image & Video Retrieval, Santorini Island, Greece, 8–10 July 2009. [Google Scholar]
  49. Netzer, Y.; Wang, T.; Coates, A.; Bissacco, A.; Ng, A.Y. Reading Digits in Natural Images with Unsupervised Feature Learning. In Proceedings of the Deep Learning and Unsupervised Feature Learning Workshop, Granada, Spain, 16–17 December 2011. [Google Scholar]
  50. Zhang, P.; Su, W. Statistical inference on recall, precision and average precision under random selection. In Proceedings of the 2012 9th International Conference on Fuzzy Systems and Knowledge Discovery, Chongqing, China, 29–31 May 2012; pp. 1348–1352. [Google Scholar] [CrossRef]
  51. Gong, Y.; Lazebnik, S.; Gordo, A.; Perronnin, F. Iterative quantization: A procrustean approach to learning binary codes for large-scale image retrieval. IEEE Trans. Pattern Anal. Mach. Intell. 2012, 35, 2916–2929. [Google Scholar] [CrossRef] [Green Version]
  52. Lin, K.; Yang, H.F.; Hsiao, J.H.; Chen, C.S. Deep learning of binary hash codes for fast image retrieval. In Proceedings of the IEEE Conference on Computer Vision and Pattern Recognition Workshops, Boston, MA, USA, 7–12 June 2015; pp. 27–35. [Google Scholar]
Figure 1. Schematic diagram of the structure of our proposed approach.
Electronics 11 02391 g001
Figure 2. The binary code converted from the two dog pictures should be similar, and there should be a huge difference from the binary code converted from the car picture.
Electronics 11 02391 g002
Figure 3. Contrastive loss. Samples of the same species should be closer together, such as green and blue samples. Different kinds of samples should be kept as far away as possible, and the distance should be greater than M, such as yellow and green samples.
Electronics 11 02391 g003
Figure 4. Process of image detection similarity. As shown in the figure, first, the images are mapped into binary codes through the network architecture, then the binary codes of the query pictures are compared with the binary values of the pictures in the database, and the distance between them is calculated. The two pictures with the smallest distance are the most similar pictures.
Electronics 11 02391 g004
Figure 5. Evaluation scores of our technique and other hashing techniques on the CIFAR-10 dataset.
Electronics 11 02391 g005
Figure 6. Evaluation scores of our approach and other hashing approaches on the NUS-WIDE.
Electronics 11 02391 g006
Figure 7. Comparison of training loss and test loss.
Electronics 11 02391 g007
Figure 8. Comparison of mAP values between different network architectures.
Electronics 11 02391 g008
Table 1. Time (seconds) to train our method with different datasets.
MethodCIFAR-10NUS-WIDESVHN
DFEH2389.2119362.31611,043.457
Table 2. mAP scores of various hashing approaches on CIFAR-10.
Method12 bit24 bit36 bit48 bit
LSH [7]0.13190.13670.14070.1492
SH [7]0.13190.12780.13640.1320
ITQ [51]0.10800.10880.11170.1184
CCA-ITQ [51]0.16530.19600.20850.2176
MLH [24]0.18440.19940.20530.2094
BRE [41]0.15760.16240.16840.1717
KSH [25]0.29560.37320.40190.4167
CNNH [30]0.53260.56130.56310.5563
DLBHC [52]0.55040.58100.57690.5883
DNNH [31]0.57110.58680.58920.5911
DPSH [34]0.65340.65460.66100.6632
DSH [35]0.67760.72130.74650.7568
DFEH0.67530.72160.76410.7864
Table 3. mAP for different hashing techniques for different bits on NUS-WIDE.
Method12 bit24 bit36 bit48 bit
LSH [7]0.33290.33920.34500.3474
SH [7]0.34010.33740.33430.3332
ITQ [51]0.34250.34640.35220.3576
CCA-ITQ [51]0.38740.39770.41460.4188
MLH [24]0.38290.39300.39590.3990
BRE [41]0.35560.35810.35490.3592
KSH [25]0.43310.45920.46950.4692
CNNH [30]0.43150.43580.44510.4332
DLBHC [52]0.46630.47280.49210.4916
DNNH [31]0.54710.53670.52580.5248
DPSH [34]0.56520.57430.58760.5881
DSH [35]0.56010.57830.58140.5877
DFEH0.56740.57880.58630.5921
Table 4. The effect of different λ values on the mAP value.
λ CIFAR-10NUS-WIDESVHN
00.54360.53710.7966
0.10.25430.43760.7841
0.010.68740.57630.8624
0.0010.60470.55760.8362
Table 5. Different experimental results under different constraints.
LossCIFAR-10NUS-WIDESVHN
L c 0.62530.51740.7862
L c + L q 0.66540.55340.8068
L c + L b 0.65460.53640.7934
L c + L q + L b 0.67740.56040.8242
Publisher’s Note: MDPI stays neutral with regard to jurisdictional claims in published maps and institutional affiliations.

