1. Introduction
Human evolution has unfolded in synergy with science and technology evolution. Information and communication technology (ICT) advancements have laid the foundation for innovative solutions in diverse industry domains, including healthcare, agriculture, transportation, and logistics, among others. The Internet of Things (IoT) is a substantive driving force to ICT technological advancement, leading prospective sectors down the road of automation alongside decentralized intelligence [
1]. The IoT evolves incessantly and impacts every facet of our life while resembling a living entity. From household appliances to robots in factories, the IoT connects data, people, things/objects, and processes. Meanwhile, cloud computing (CC) delivers on-demand elastic services with virtually unlimited computation and storage capability [
2]. Despite being unique and independent in their respective evolution, cloud computing and IoT aspects complement one another. Eventually, the two technologies converged in recent years, and the confluence became known as a Cloud–IoT paradigm [
3,
4], offering tremendous prospects for driving new innovative services and applications.
Healthcare-related applications have pushing for innovations in science and technology since information technology applications began to remotely acquire, track and control the status of patients. Thus, IoT drives recent innovations in healthcare and revolutionizes them by acquiring the physiological data of patients through sensor networks and wearable devices [
5]. The Cloud–IoT harnesses the Cloud’s tremendous potential for the storage and processing of an enormous volume of clinical records of patients including sensor data from medical IoT for healthcare analytics.
Analytics ensues the systematic quantitative and qualitative analysis of concerned data for efficient decision making, while predictive analytics stems from advanced analytics aiming to elicit the prognosis of future occurrences using the available data [
6]. The analytics in healthcare is harnessed for clinical decision support, predictive risk assessment, and remote health monitoring, among other crucial tasks. Predicting and lowering risk based on current and past patient data are a big part of medicine. The integration of humongous data from disparate sources comprising electronic health records, medical imaging, screening results, and administrative information warranting swift decisions is effectively tackled by healthcare analytics [
7]. Clinicians must often make decisions with a high degree of uncertainty; however, with the headway of predictive analytics in healthcare, those decisions will be more informed than ever. These cutting-edge predictive analytics approaches help identify trouble early on, avoid complication risks, improve chronic illness management, evade hospital readmission, receive medical research aid, and minimize overhead expenses.
Predictive analytics in healthcare deploys diverse techniques from conventional linear models to advanced algorithms of artificial intelligence (AI) and machine learning (ML) [
8]. Deep learning (DL), a subfield of ML, is sufficiently reliable and robust to automatically handle and learn from a huge amount of complex healthcare data and offers actionable insights and solutions to intricate problems. Its deployment to a wide variety of medical applications has surpassed the results of traditional models. Specifically, the recurrent neural network (RNN) [
9] is competent at managing the long-term dependencies of input data and has grown prominent in the study of temporal events concerning time-sequential applications.
1.1. Motivation
Predictive analytics is proving its worth, not just in the hospital environment, but also at home by remote monitoring and keeping patients from relapsing into the need for acute treatment. Predictive analytics aid in the diagnosis, prognosis, and therapy at every stage of a patient’s treatment [
10]. It also helps in designing the treatment course, providing clinical decision support, decreasing adverse occurrences, and enhancing the overall care quality while lowering healthcare costs. Moreover, the personalized healthcare model shifts from treating patients as numbers to treating them as individuals, customizing treatment to their unique medical history, environment, social risk factors, genetics, and biochemistry, among other things [
11]—rather than depending on demographic statistics that do not apply to everyone. It tenders real-time clinical decision assistance at the point of treatment, allowing for the most efficient delivery of individualized healthcare [
12]. With deadly diseases, spotting them early on and detecting any possible deterioration in the patients’ condition before occurrence can significantly improve the odds of an effective treatment.
The diseases affecting the heart and its related blood vessels are all classified as cardiovascular diseases (CVDs). These include arrhythmia, coronary artery disease, congenital heart disease, valve disease, aortic disease, heart failure, peripheral artery disease, pericardial disease, heart valve disease, cerebrovascular disease, rheumatic heart disease, deep vein thrombosis, cardiomyopathy, myocarditis, atrial fibrillation, ischemic heart disease, and stroke [
13,
14,
15].
The most prominent cause of global mortality is cardiovascular diseases (CVDs), claiming the lives of an estimated 17.9 million individuals and accounting for 32% of all fatalities worldwide [
16]. Heart attacks and strokes cause four out of every five CVD fatalities, which are 85% of all CVD mortalities, with one-third occurring before age 70. Identifying individuals at risk for CVDs and ensuring that they receive proper therapy can help avert untimely deaths. This is where the predictive algorithms powered by AI and ML come into play alongside the Internet of Things, as these are adept at managing massive and diverse data. Pattern classification, as a pattern recognition task, is a crucial supervised learning paradigm for identifying and classifying disease patterns in the medical field [
17]. The researchers working on classification algorithms concerning heart disease strive to achieve the maximum classification accuracy possible as patients’ lives are at stake.
Many individuals are at risk of heart disease due to long-term conditions such as persisting high blood pressure. With the increase in the aging population across the globe, most of them are diagnosed with chronic heart conditions. This warrants the continuous real-time monitoring of individuals at in-home care and the patients in treatment within hospital premises, entailing timely treatment upon the fluctuation of vital signs. The prolonged tracking of health conditions in the elderly helps minimize hospitalization cost and enhance the quality of life, but conventional methods are tedious and tiring. This necessitates efficient facilities to mitigate the overwhelming workload of clinicians and hospital staff while minimizing the cost of health monitoring. The pervasive nature of IoT has incited the proliferation of smart, interconnected devices and wearables with sensors, thereby facilitating remote patient monitoring pertaining to heart disease. The IoT for healthcare monitoring includes smart health watches, wearable blood pressure monitors, and wearable ECG monitors equipped with medical sensors. Thus, the healthcare IoT acquires vital patient data and transmits them to the Cloud for storage and complex deep learning analytics along with prior electronic clinical records for accurate heart risk diagnostics. These IoT devices can swiftly notify the clinicians and caretakers of the patient’s condition. This enables clinicians to better make timely decisions for individuals as well as the population at large by estimating patients’ chance of developing a specific heart disease, their prognosis for the given condition, and the corresponding treatment.
1.2. Contribution
The pivotal outcomes of this research initiative are listed as follows:
The data collected from IoT sensors pertaining to heart disease risk prediction are subject to the data pre-processing tasks of data cleaning and data filtering at the Cloud layer;
The ensuing data are sent to the fuzzy information system (FIS) for the initial classification task;
Finally, the proposed Bi-LSTM model is used to accurately predict the risk of heart disease in patients.
The remaining sections of this article are organized into related work, methodology, experimental setup, performance assessment, experimental results and discussion, comparative analysis, future directions, and conclusions.
1.3. Related Work
In recent times, diverse systems for heart disease prediction have been propounded. For enhancing heart disease risk prediction accuracy, the deployment of several ensemble classifiers displays an accuracy of 85.4% [
18]. A model for diagnosing heart disease diagnosis that combines rough sets-based attribute reduction involving the chaos firefly algorithm with an interval type-2 fuzzy logic system showcases an accuracy of 86% [
19]. A machine learning hybrid model to predict heart disease [
20] by combining random forest (RM) with linear method (LM) approaches exhibits a performance accuracy of 88.7%.
An integrated decision support system for predicting the risk of heart failure, which combines a fuzzy analytic hierarchy process and artificial neural network for feature weighting and classification tasks, respectively, achieves 91.0% accuracy [
21]. A smart system for diagnosing heart disease deploying a χ
2 statistical model and a deep neural network for feature refinement and classification tasks, respectively, is proposed. The model attains an accuracy, specificity, and sensitivity of 91.57%, 93.12%, and 89.78%, respectively [
22].
An adaptive weighted fuzzy rule-based system for assessing the heart disease risk level is presented. This automatic diagnostic system of a fuzzy model based on a genetic algorithm along with a deployed modified dynamic multi-swarm particle optimization approach shows an accuracy of 92.3% [
23]. A heart disease identification model deploying algorithms of univariate and relief feature selection alongside a decision tree for classification achieves an accuracy of 92.8% [
24].
A coronary artery disease prediction model with a neuro-fuzzy medical decision support system is presented. This system involves an artificial neural network and an adaptive neuro-fuzzy inference system, which displays an accuracy, sensitivity, specificity, and precision of 94.15%, 91.44%, 95.59%, and 92.61%, respectively [
25]. A system for automatically predicting heart disease is proposed, which deploys cluster-based Bi-LSTM (bidirectional long short-term memory). When tested with the UCI dataset, this model exhibits an accuracy of 94.78% [
26].
An expert system for diagnosing heart disease by combining fuzzy rules and deep neural networks is presented, showing an overall accuracy of 96.5% [
27]. A method that integrates CNN with deep learning algorithms referred to as CardioHelp is introduced, which uses CNN for early heart failure prediction involving a temporal model. This approach outperforms other state-of-the-art methods, with a 97% accuracy rate [
28].
An IoT-based hybrid system for cardiovascular disease prediction is offered, including sequential forward selection (SFS) as the feature selection technique and a random forest for classification. This system recommends physical as well as dietary plans to patients in function of their age and gender, showing 98% accuracy compared to other heuristic model recommender systems [
29]. A model capable of handling medical data from multiple sensors involving an ensemble classifier—Kernel random forest [
30]—shows 98% accuracy when deployed on a heart disease dataset.
A new IoT framework based on deep convolutional neural networks, which are connected to a wearable sensor that measures the blood pressure and ECG of a patient, is suggested. When compared to logistic regression and existing deep learning neural networks, this technique performs better with 98.2% accuracy [
31]. A smart system predicting the risk of heart disease [
32] from data acquired by wearable sensors and patient medical history, based on the ensemble deep learning model Logitboost along with feature fusion technique, was presented. The system shows 98.5% accuracy in heart disease diagnoses while automatically recommending dietary plans in function of the health condition.
A model for predicting heart disease is presented by combining the method of embedded feature selection involving the LinearSVC algorithm with deep neural networks. This system achieves an accuracy, recall, precision, and F-measure of 98.56%, 99.35%, 97.84%, and 98.3%, respectively, when evaluated with the heart disease dataset [
33].
The aforementioned state-of-the-art works pertaining to heart disease risk diagnosis harnessing the UCI heart disease dataset predominantly avail statistical and machine learning algorithms and methods. The classification accuracy shown by the existing methods has the possibility of further enhancement when deep learning approaches are emphasized. Moreover, utilizing the fuzzy systems alongside recurrent neural network algorithms has the potential to offer better outcomes. The ensuing sections elaborate on the proposed fuzzy-based recurrent neural network model for accurate heart disease risk prediction.
2. Materials and Methods
IoT technology acts as the critical acquisition component for innumerable real-time applications that promote object–individual interaction. The massive amount of data generated by IoT devices poses a significant challenge to the healthcare system pertaining to the processing, storage, and management of data.
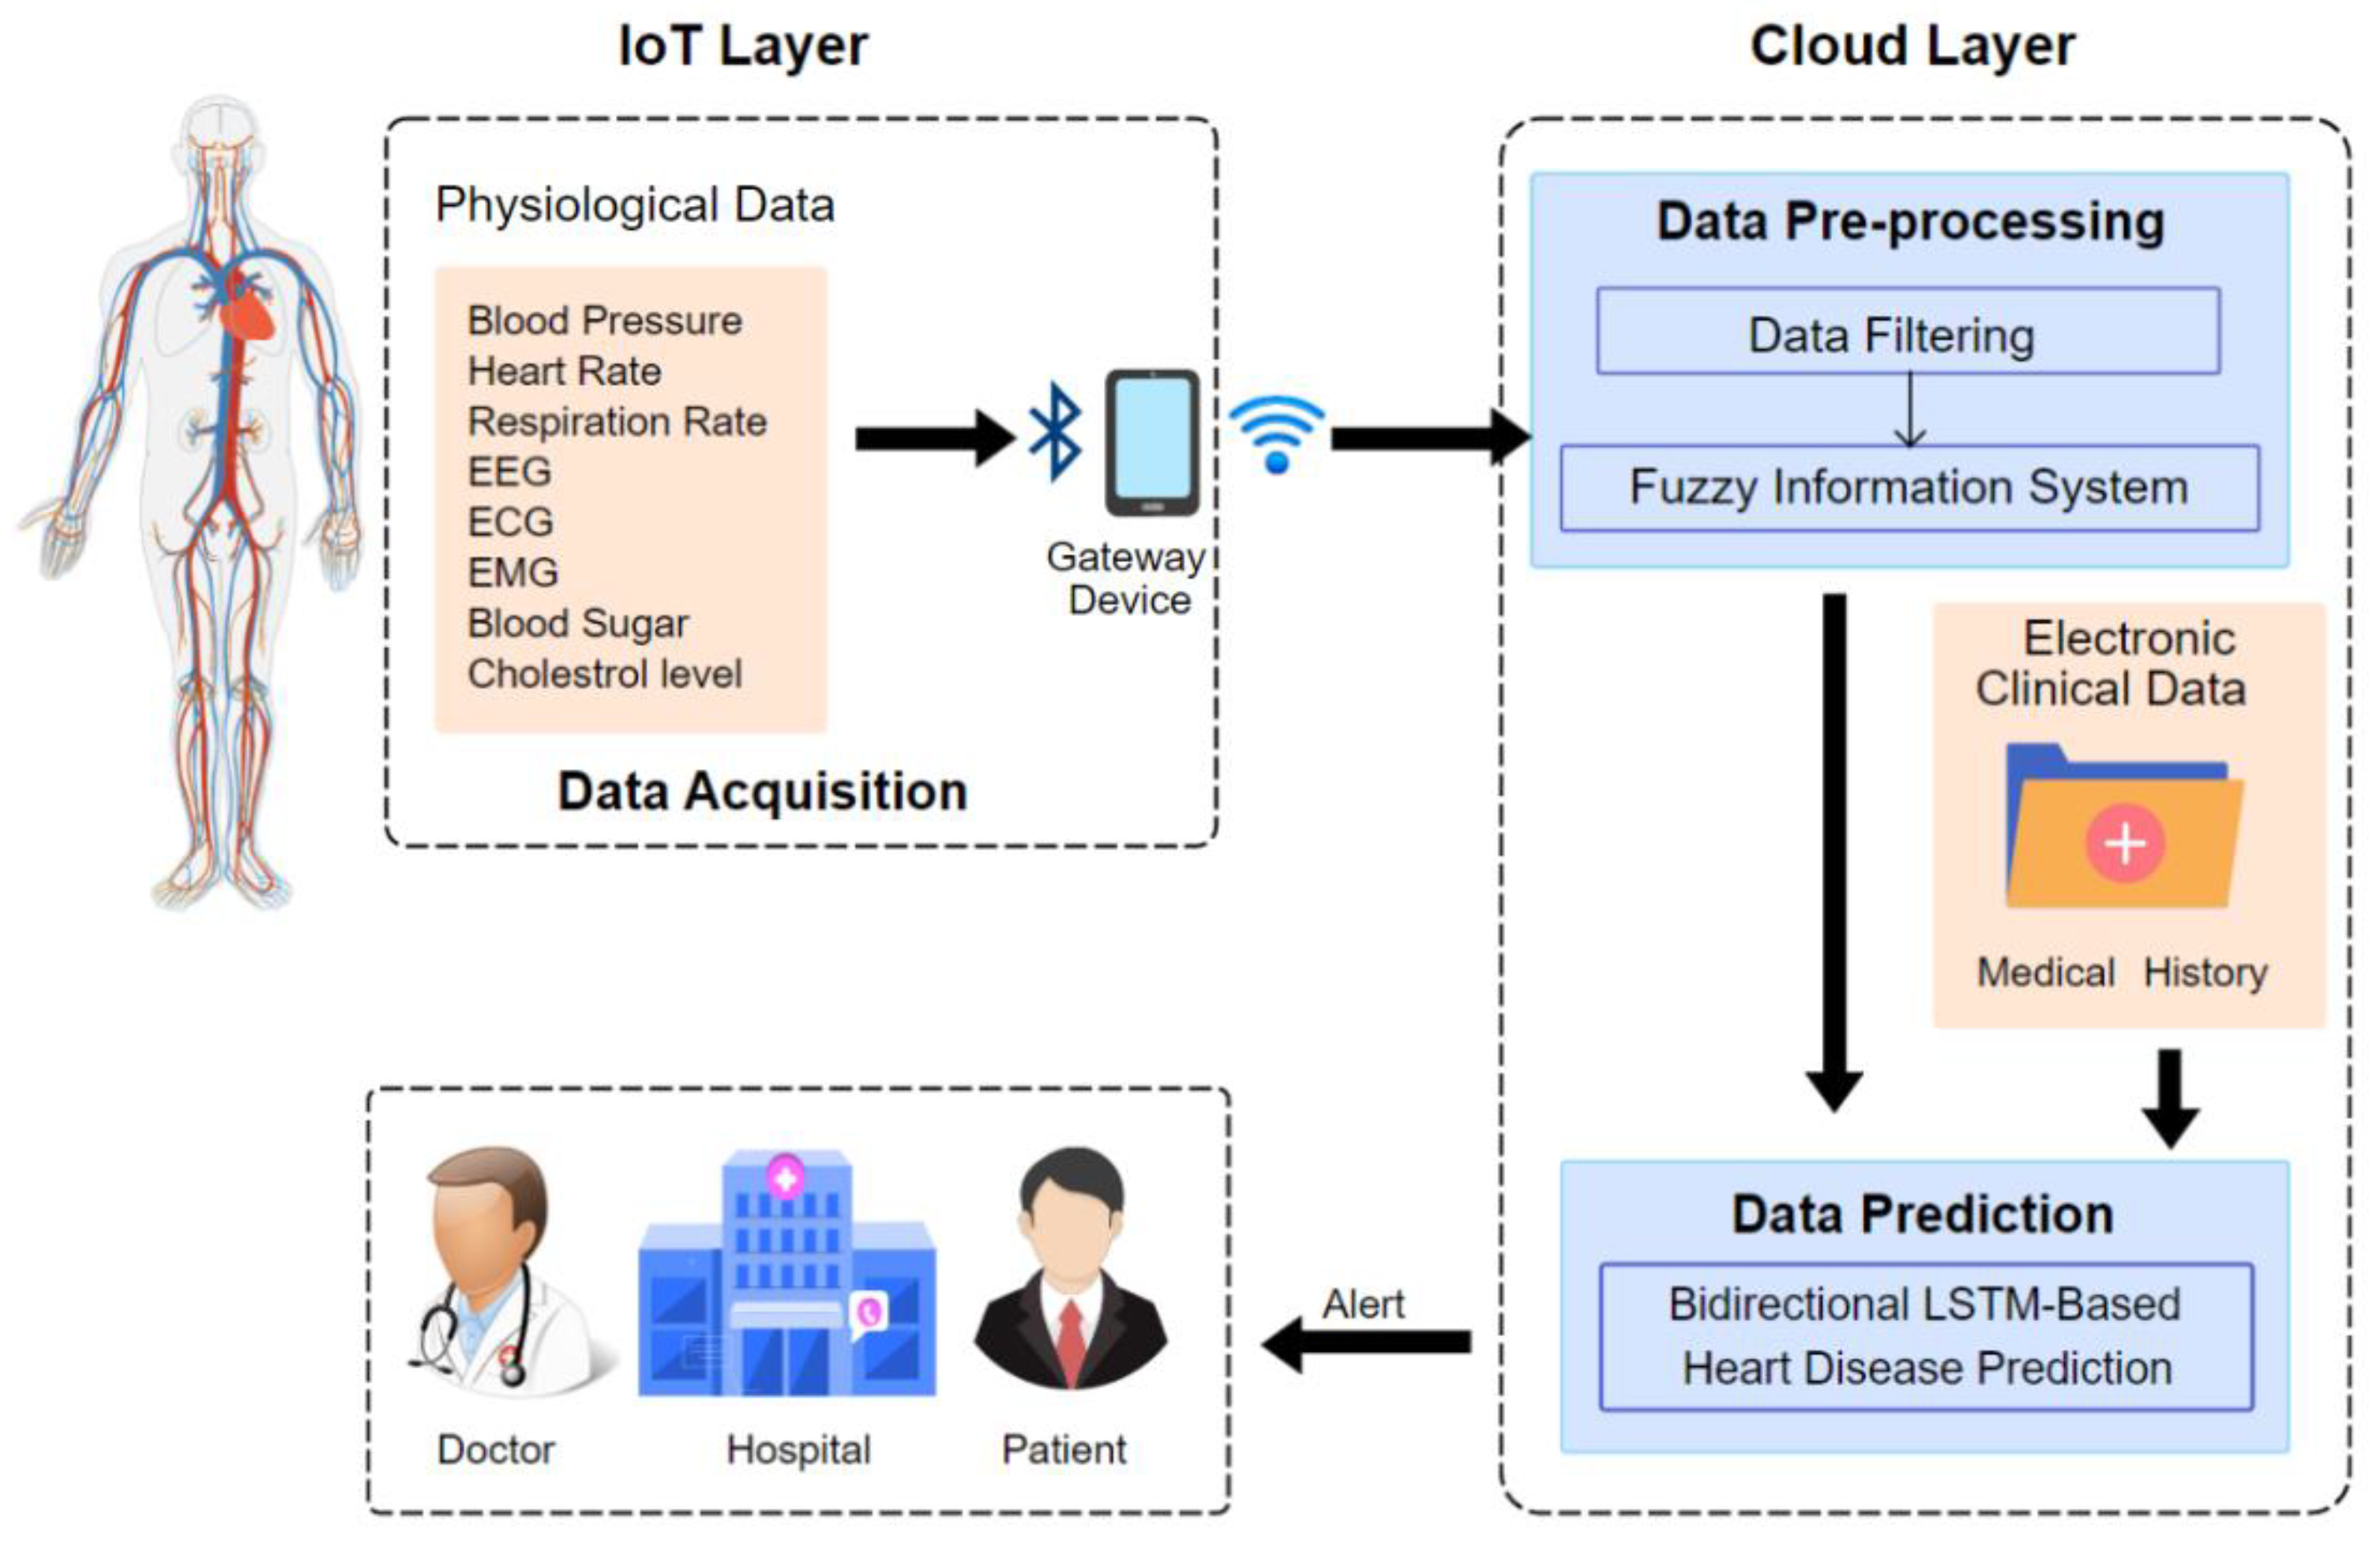
The proposed smart healthcare system for heart disease risk prediction includes modules such as (1) the data acquisition/collection layer; (2) data pre-processing; and (3) the disease prediction layer, which is depicted in
Figure 1.
2.1. Data Acquisition/Collection Layer
The propounded healthcare system acquires data from two primary data sources. The physiological data of patients such as their blood pressure (BP), heart rate, blood sugar/glucose level, respiration rate, blood oxygen, cholesterol level, activity, electrocardiogram (ECG), electromyogram (EMG), and electroencephalogram (EEG) are gathered from the patient’s routine health monitoring. These data are transmitted through Bluetooth/Zigbee to related remote gateway devices and then to the cloud data center, where data pre-processing and disease prediction takes place. The other data source is the electronic clinical data (ECD), which comprise the patient’s medical history (including their history of smoking and diabetes), observation reports, and comprehensive clinical (lab) reports which offer valuable information on disease prediction and are stored in a cloud database.
Dataset
For the experiment, to detect the presence of heart disease from heart patient data, the Cleveland and Hungarian dataset from the UCI machine learning repository are considered. The proposed algorithm was deployed on a heart dataset that includes 14 attributes, as depicted in
Table 1.
2.2. Data Pre-Processing Layer
Data pre-processing has become a requisite for ML algorithm deployment as real-world data are prone to being inconsistent, incomplete, and noisy. Efficient heart disease prediction from the heart disease dataset requires missing data handling, normalization, and feature selection. Data acquired from wearable sensors are impacted due to signal aberrations, such as missing values and noise, causing havoc in the case of heart disease prediction, compromising the prediction accuracy, or yielding an erroneous result. We utilize a well-known technique to filter the data known as Kalman filtering [
32,
34], which effectively eliminates duplicate records, noise, and discrepancies from the data. Owing to its simple form, it requires low computational power [
35]. This unsupervised filtering algorithm is specialized to handle vast real-time sensor data and furnish values closer to that of the actual values from the sensor without noise [
36]. In addition to this, we use two other unsupervised filters in the data filtering stage: removing useless and replace missing values [
32]. With another 90% of maximum variance, the first filter eliminates irrelevant attributes. The second filter substitutes the mean as well as median values of the existing data for any values missing in the structured dataset.
Fuzzy Inference System
The term fuzzy refers to something as inexplicit or vague, and the fuzzy system is inspired by the requisite to model inherently vague real-world events [
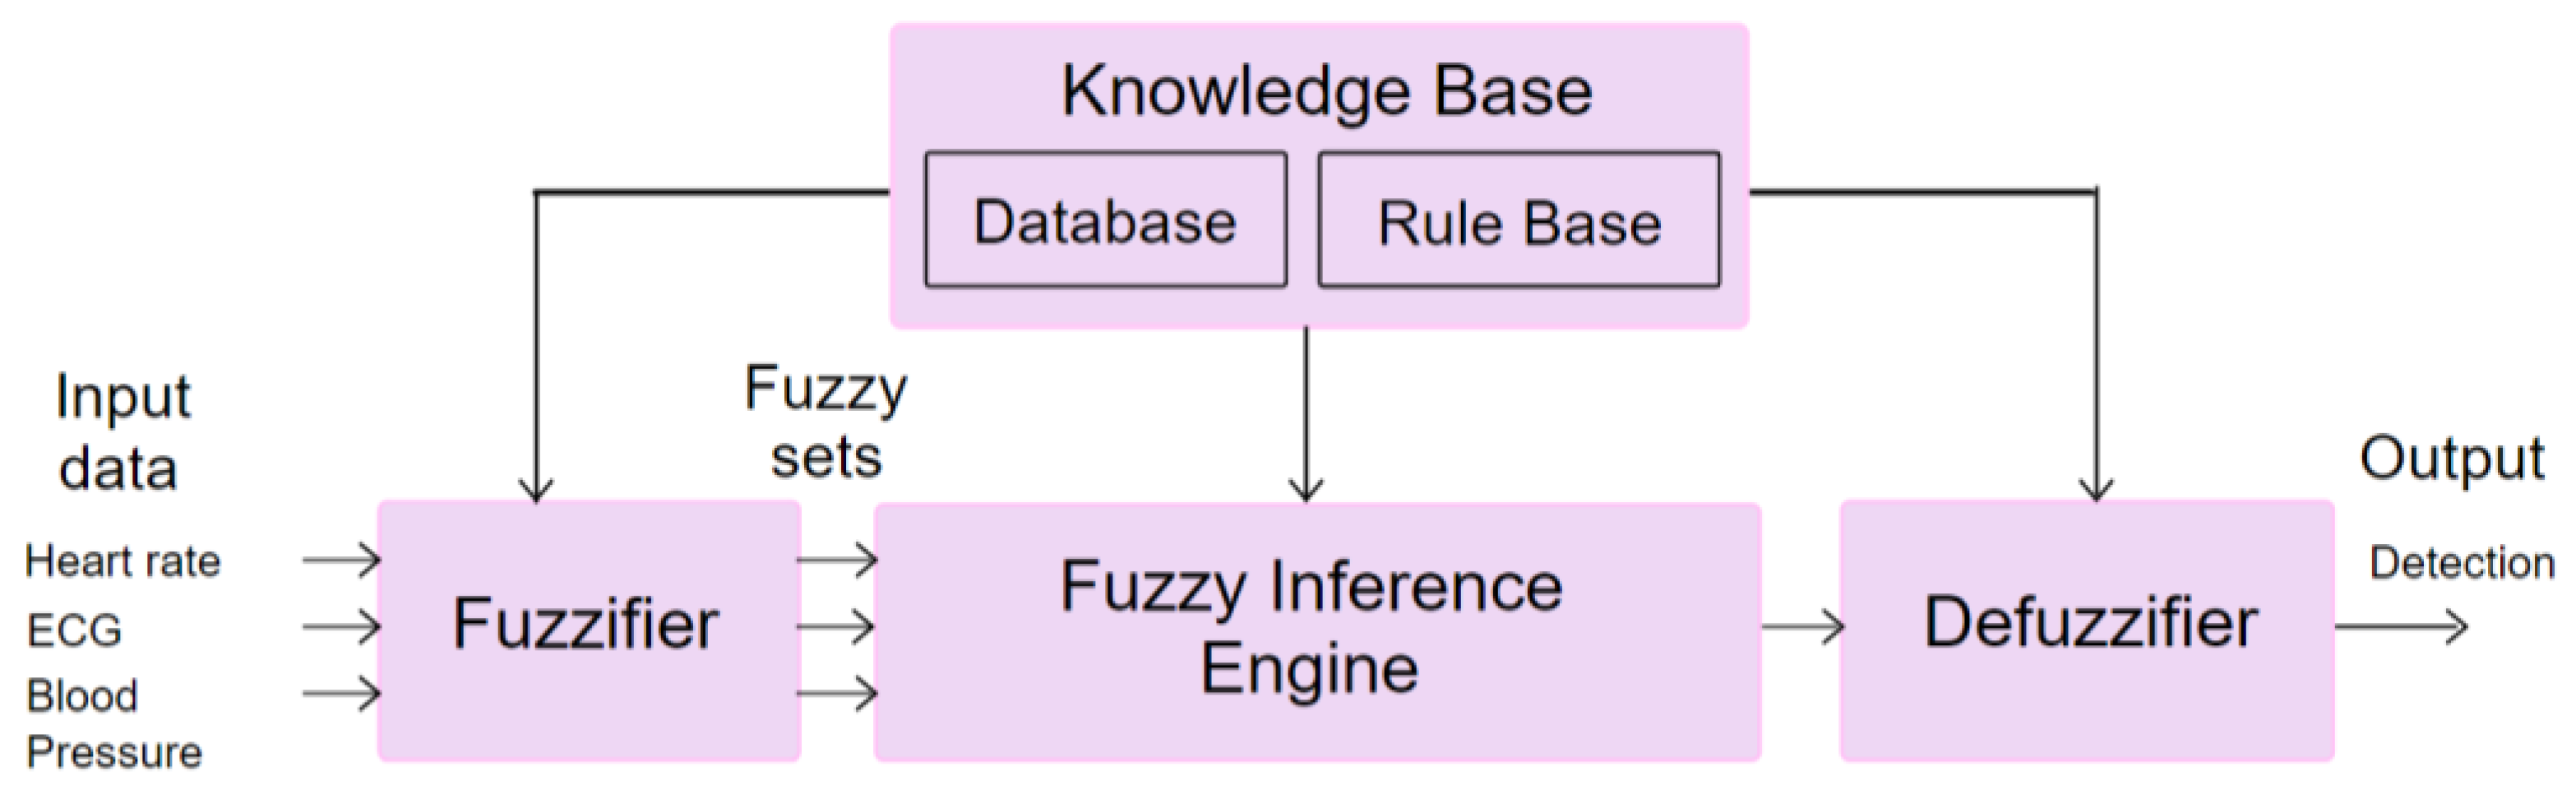
37]. The standard fuzzy system is characterized by four components, namely a fuzzifier, an inference engine, a knowledge base, and a defuzzifier. The inputs to a typical fuzzy system can be crisp data (numeric) and linguistic values (fuzzy sets). In the case of a crisp input, the fuzzifier assigns to it the applicable fuzzy set and this process is known as fuzzification. Then, the inference engine accomplishes mapping of the input variable values to the linguistic values of the output variable through a suitable approximate reasoning method with expert knowledge indicated by a set of fuzzy conditional rules in the knowledge base. The knowledge base entails the application of domain knowledge which can be divided into a database and a rule base. The database comprises linguistic control rules, and the rule base includes domain expert knowledge. In addition to linguistic values, if numeric data output is needed, then defuzzification assigns crisp data to the resulting fuzzy set.
The classification of heart disease risk based on patients’ health data is performed using a fuzzy inference system (FIS), and the algorithm is presented as Algorithm 1.
| Algorithm 1: Classification of patients’ health data using FIS. |
| Step 1. The inputs and the respective member functions μ1 determines the fuzzy system |
Step 2. Ascertain heart disease risk state using μ1 (ECG1), μ1 (MaxHeartRate1),
μ1 (BloodPressure1) as μ1 (normal) or μ1 (low) or μ1 (high) |
| Step 3. If Health risk state = μ1 (high) |
| 3.1 Send alert to GD using SPARK as RTA |
| 3.2 Store Health risk state of the Puid in CS |
| Step 4. Otherwise send Health risk state of the Puid to CS |
| Step 5. End the process |
The inputs for maximum heart rate, ECG, and blood pressure, are created and member function are fed, which are fuzzified into fuzzy sets using a fuzzy value range.
Figure 2 presents the working of FIS for heart disease risk prediction.
The fuzzy sets thus created are given as input to the FIS for classifying patients based on their health data.
Table 2 depicts the linguistic variables and their corresponding fuzzy set of the FIS.
Table 3 shows the member function and range for the blood pressure variable.
The input variable value is mapped into the output variable’s linguistic values through a suitable approximate reasoning method given as fuzzy conditional rules in the knowledge base. The results are classified in function of these fuzzy rules in the rule base along with corresponding member functions. The notification is sent regarding high-risk patients, and the overall patient risk status is stored in the cloud for future analysis. The data of patients classified as high risk for heart disease are subjected to further analysis in the ensuing prediction layer.
2.3. Data Prediction Layer
Sequence prediction challenges have existed for a long time and are often regarded as one of the most challenging problems in the data science sector to tackle.
2.3.1. RNN
Deep learning algorithms were extensively researched and widely deployed in recent years for extracting information from several types of data. Neural networks can learn representations and uncover previously unknown structures. Numerous deep learning architectures, namely the conventional neural network, deep neural network, and recurrent neural network take into account diverse aspects of input data [
38]. In most cases, CNN and DNN are inept in coping with the input’s temporal information. RNNs prevail in domains dealing with sequential input, such as text, audio, or video.
A cyclic connection is a common component of the RNN design which allows the updating of its current state depending on the current input and previous states [
39]. The RNNs include the hidden or recurrent layers, which consist of recurrent cells. The states of the recurrent cells are impacted by the current input that has feedback connections and past states. Different RNNs can be formed by organizing recurrent layers into different architectures. Thus, the recurrent cell, as well as the network architecture, distinguish RNNs. The capability of RNNs is influenced by varying cells and their inner connections. In some situations, these networks, such as complete RNNs and selective RNNs, made up of conventional recurrent units (sigma cells and tanh cells), have showcased phenomenal success. However, the RNNs with standard recurrent cells are inadept at managing long-term dependencies as it is daunting to identify the interconnecting information with a considerable gap between the related input data.
2.3.2. LSTM
Long short-term memory (LSTM) has been proposed to contend with “long-term dependency” as the outcome of exhaustive research on RNNs, aimed at sequence learning. Long-range interdependence and nonlinear dynamics can be captured using LSTMs [
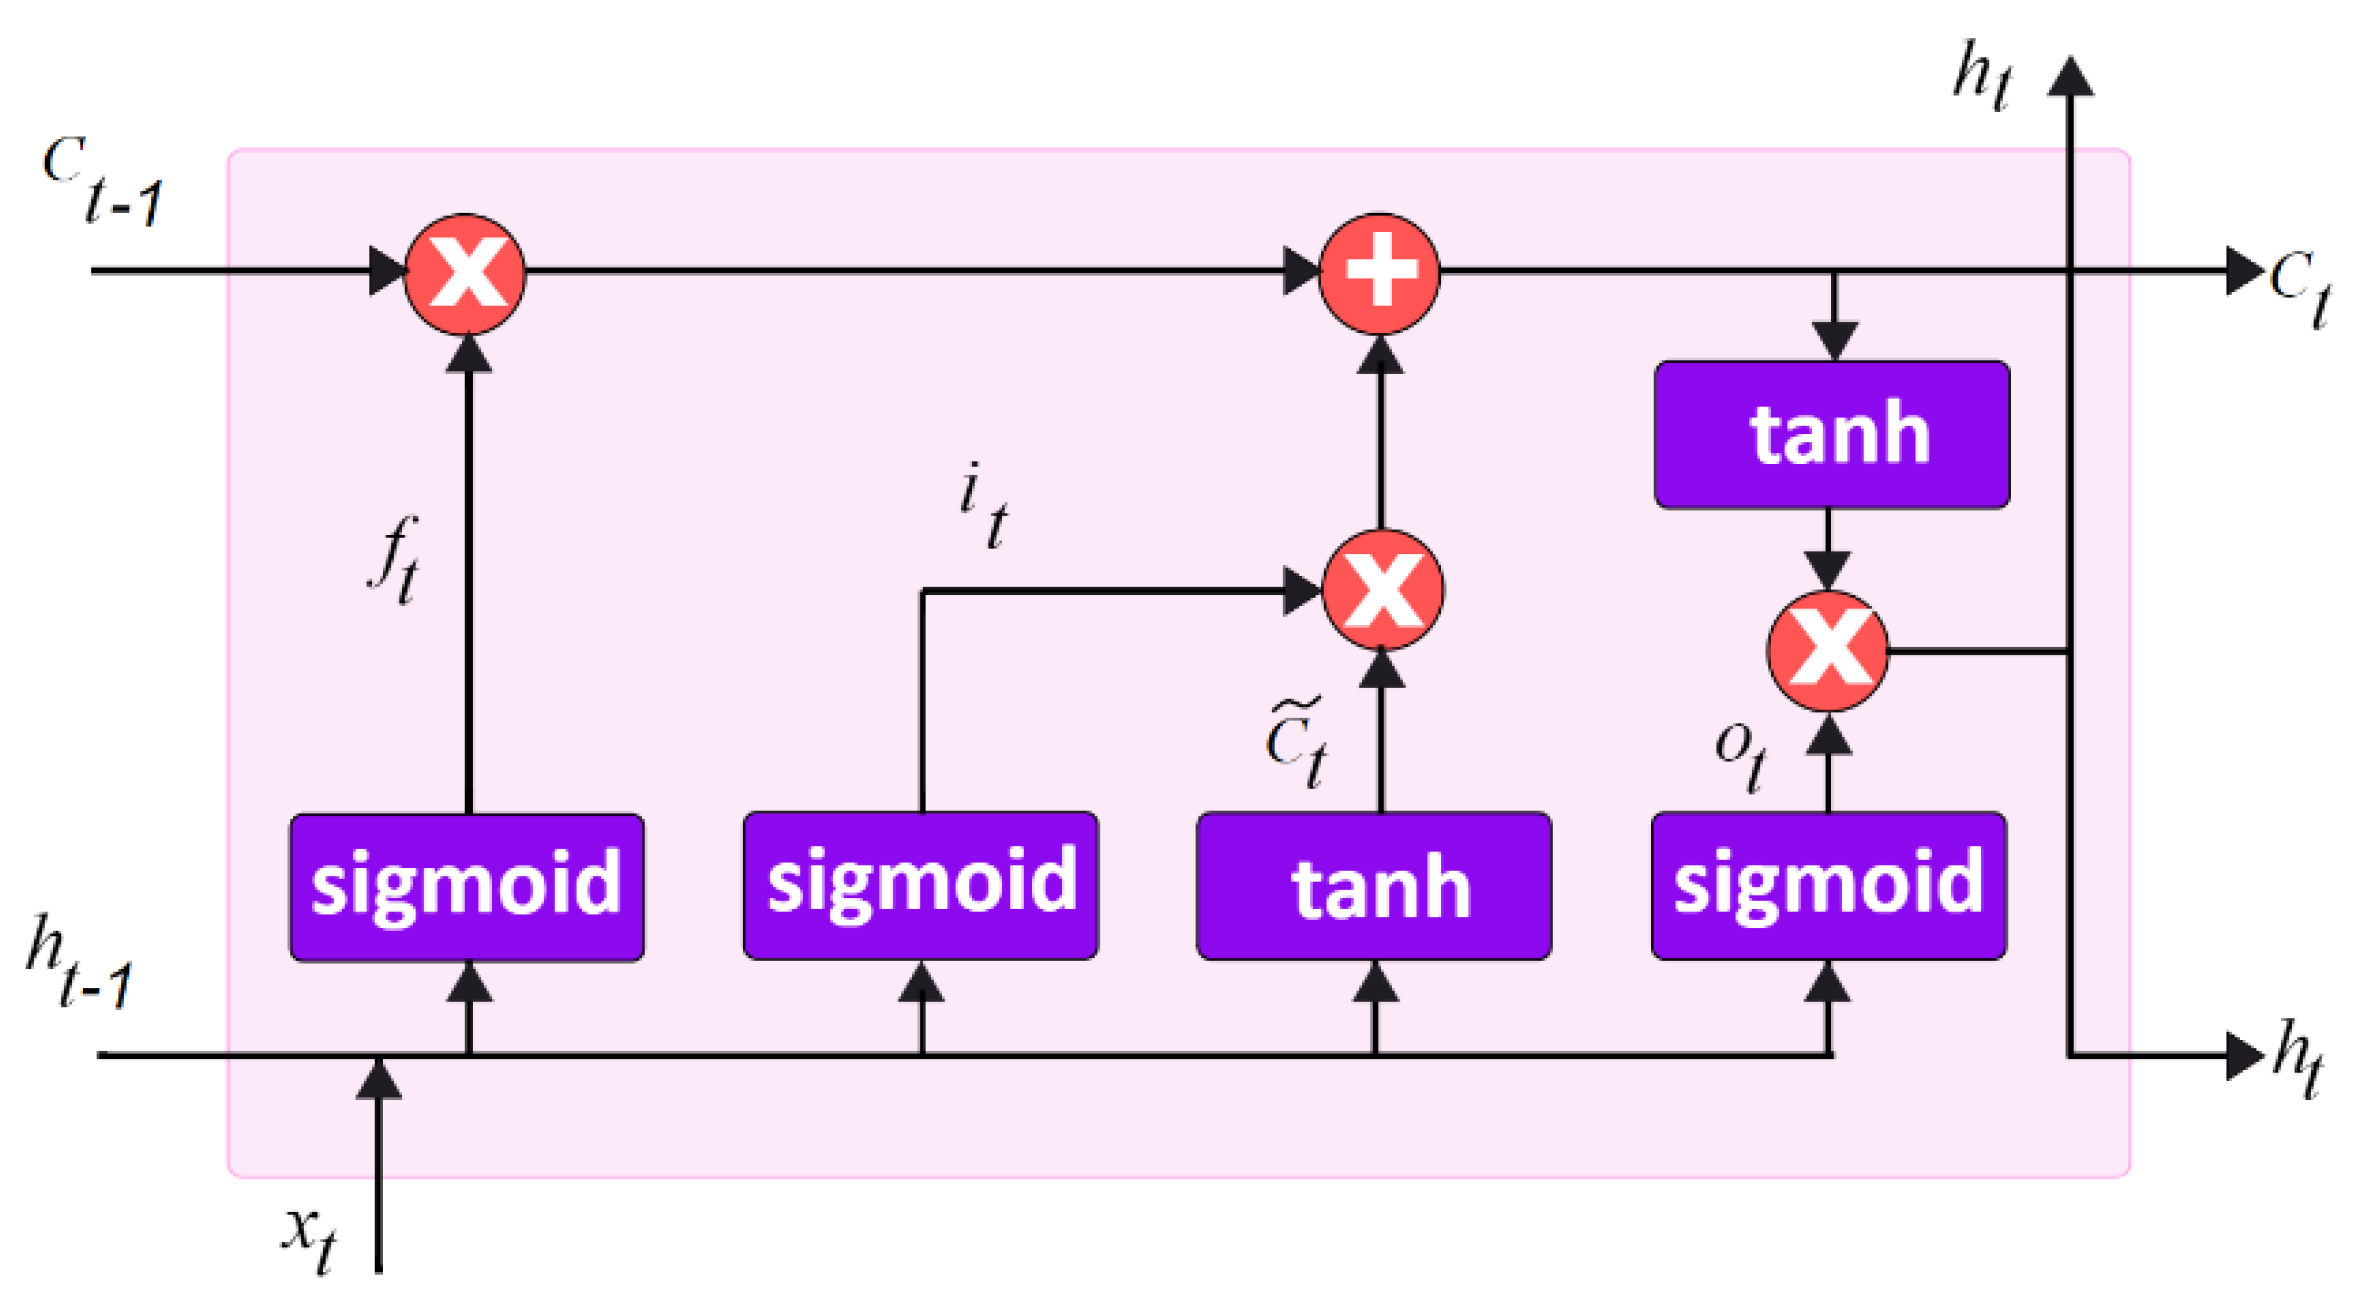
40] as it functions as the refined version of RNN, with the hidden layer unit of the memory cells in the place of recurrent units.
Figure 3 illustrates the generic LSTM model.
The memory cells enable retaining and output information, thereby facilitating the learning of long-term temporal correlations. This includes self-connections that retain the network temporal state and are regulated by three gates: input gate, output gate, and the forget gate. Gating is a process that determines the function of each memory cell in LSTMs. When the gate is activated, the LSTM updates its cell state. The input and output gates govern the flow of memory cell inputs and outputs into the remainder of the network. A forget gate was also introduced to the memory cell, which passes the high-weighted output information from one neuron to the next. The information retained in memory is determined by the input unit’s high activation level; if it is high, the memory cell stores the information. Furthermore, a highly activated input unit will transfer information to the following neuron. Alternatively, high-weighted input data are stored in memory cells. The LSTM units’ activation is similarly determined to RNNs. LSTM network involves mapping between input and output sequence, i.e.,
and
.
where
f,
i,
o, and
c are the forget gate, input gate, output gate, and cell activation vectors, respectively, while
W(
f,
i,
o,
c) and
b(
f,
i,
o,
c) correspond to their weight matrices and bias vectors, respectively, and h represents hidden value. The term
refers to the input of the memory cell at time
t while
and
denote the current and previous memory cell units.
2.3.3. Proposed Bi-LSTM Model
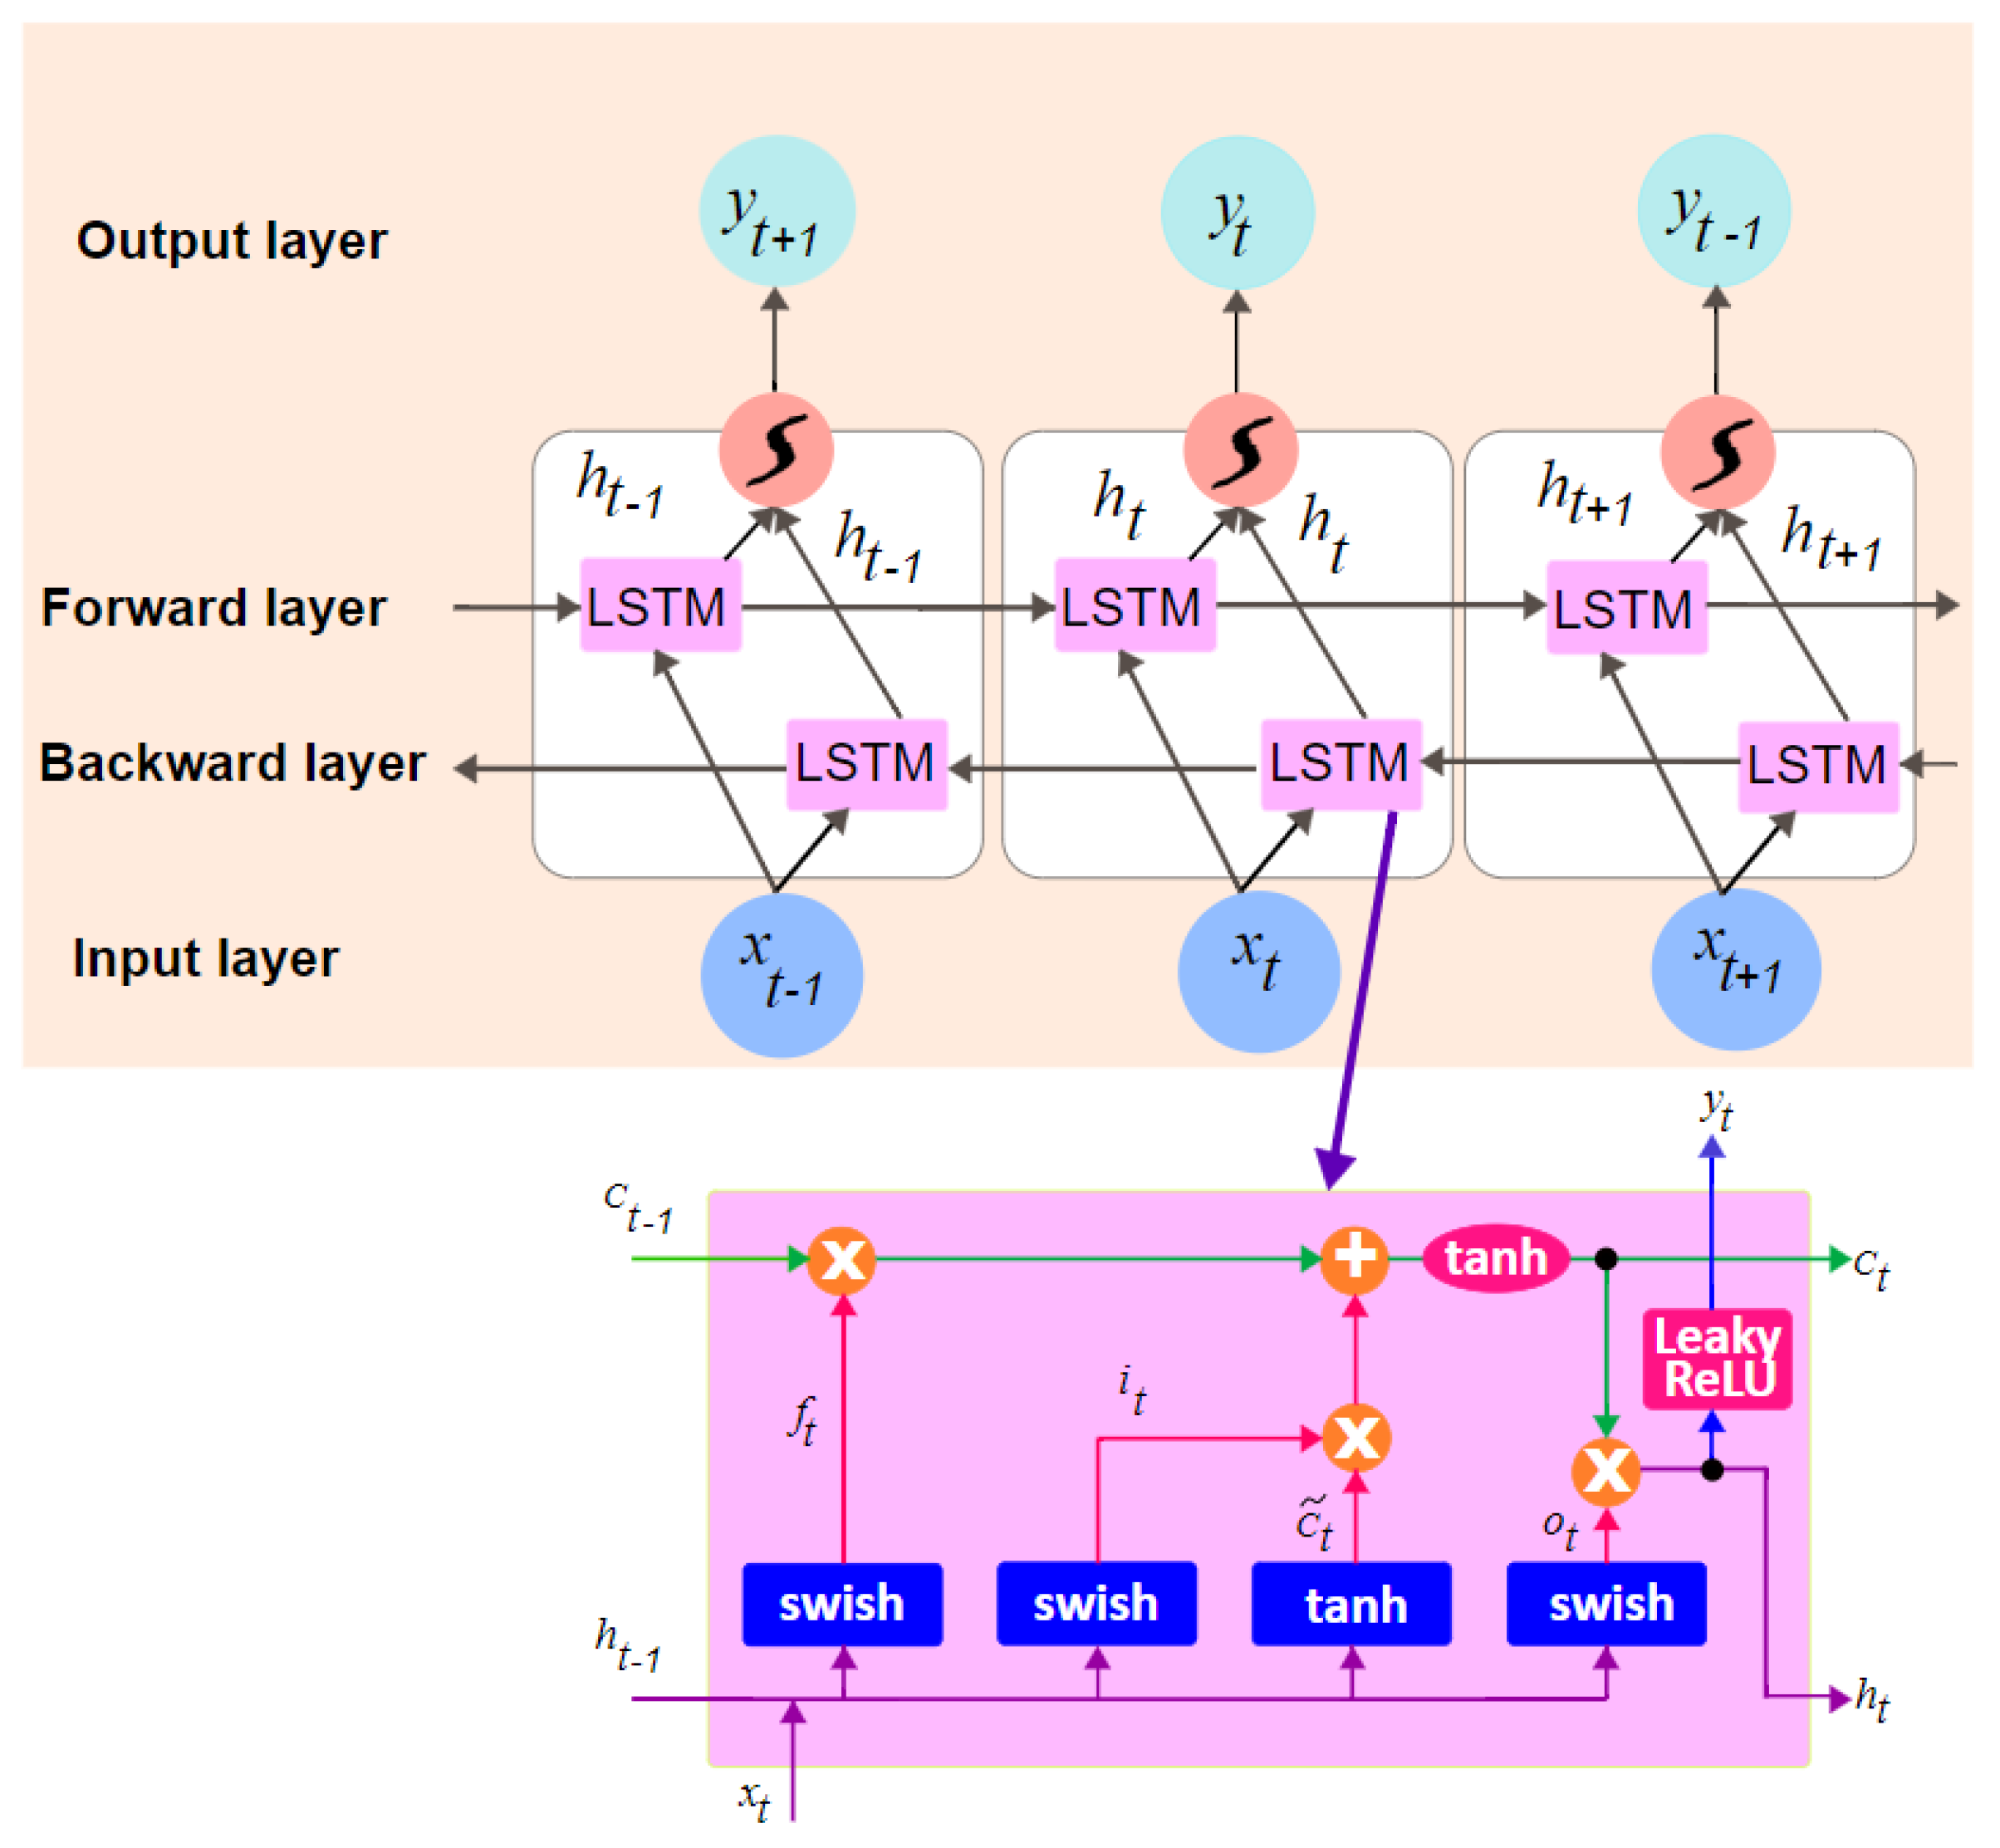
The constraint of the LSTM cell is that it can act on prior content but not on the future one. Bidirectional recurrent neural networks consisting of two distinct LSTM hidden layers with comparable output in opposing directions were put forth. Previous and future information is used in the output layer using this approach. In Bi-LSTM, an input sequence is computed in the forward direction as ) and in the backward direction as ). The final output of this cell is created by both and
and the final output sequence is .
In deep networks, the chosen activation function profoundly influences the training dynamics along with the task performance. The activation function proposed by the Google Brain Team [
41], Swish, stated as
f(
x) =
x.sigmoid(β
x), was chosen for the prediction model.
To address the cell divergence issue of the generic model, a tanh activation function is included in the cell propagation, and a leaky rectified linear unit (Leaky ReLU) is inserted after output gating. These collectively show the reduced prediction oscillation and eliminated negative outputs.
Figure 4 shows the LSTM cell structure and Bi-LSTM of the proposed model.
where
f,
i,
o, and
c are the forget gate, input gate, output gate, and cell activation vectors, respectively, while
W(
f,
i,
o,
c) and
b(
f,
i,
o,
c) correspond to their weight matrices and bias vectors, respectively, and h represents hidden value. The term
refers to the input of the memory cell at time
t while
,
, and
denote the current and previous memory cell units as well as the final output, respectively.
3. Experimental Setup
This research endeavoured to evaluate sequential prediction models on the heart disease dataset with deep learning models entailing the generic LSTM model and the FIS combined with LSTM (FLSTM) alongside the proposed model. The system harnesses the Cleveland and Hungarian heart disease datasets, accessed from the University of California, Irvine (UCI) online ML and data mining repository [
42]. The original Cleveland and Hungarian heart disease datasets comprise 303 and 294 records, respectively, with 14 features. These records were increased to 100,000 records using Mockaroo, the dataset generator tool, to check the robustness of the proposed deep learning model. Thus, the system is ascertained using 100,000 records segmented into 70% for training tasks and 30% for testing tasks. The proposed neural network model has four layers, among which two layers are hidden, and the dense layer has seven units. The number of nodes is automatically selected based on accuracy criteria, and the dropout value is 18% with a random weight initialization from 0.1 to 0.2. The decay rate is at 0.96, and the learning rate is 0.16. The value of momentum is 0.82, the number of epochs is set to be variable, and the batch size is 128. The IoT data acquired from wireless body sensor networks (WBSNs) are sent to a cloud server for pre-processing and classification tasks. The experiment was perpetrated on the i2k2 Cloud platform alongside the TensorFlow ML package involving Apache Spark and Cassandra for server and storage infrastructure, respectively.
4. Performance Assessment
This section delves into the pursuit of the proposed system, and the findings are delineated.
After the initial data pre-processing tasks involving data cleaning and data filtering, the ensuing data were examined with three distinct models, with one model being the generic LSTM for disease prediction. The second model combines the fuzzy information system (FIS) and the LSTM denoted by FLSTM, where FIS is used to initially classify the heart disease risk status of patients, but for prediction, the LSTM model is utilized. The third model, which the proposed work, combines the FIS with Bi-LSTM for heart disease prediction denoted by FBiLSTM. These three models are assessed in accordance with the performance indices of accuracy, precision, sensitivity, specificity, and function measure concerning the patient heart disease risk status.
Evaluation Indices
The efficiency of models dealt with is determined using the performance metrics of accuracy, precision, specificity, recall, and F1 score. Accuracy measures the prediction ability of the presented deep learning model by comparing the desired output and the actual output. The classifier model’s capability to predict the presence or absence of heart disease in a patient is gauged by a true positive (TP) and true negative (TN). The false prediction made by the models is identified by the false positive (FP) and false negative (FN). The precision determines the proportion of actual positive observations to all positive instances. Recall computes the proportion of overall positive instances, while specificity computes the proportion of overall negative instances. The function measure determines the mean of recall and precision.
5. Experimental Results and Discussion
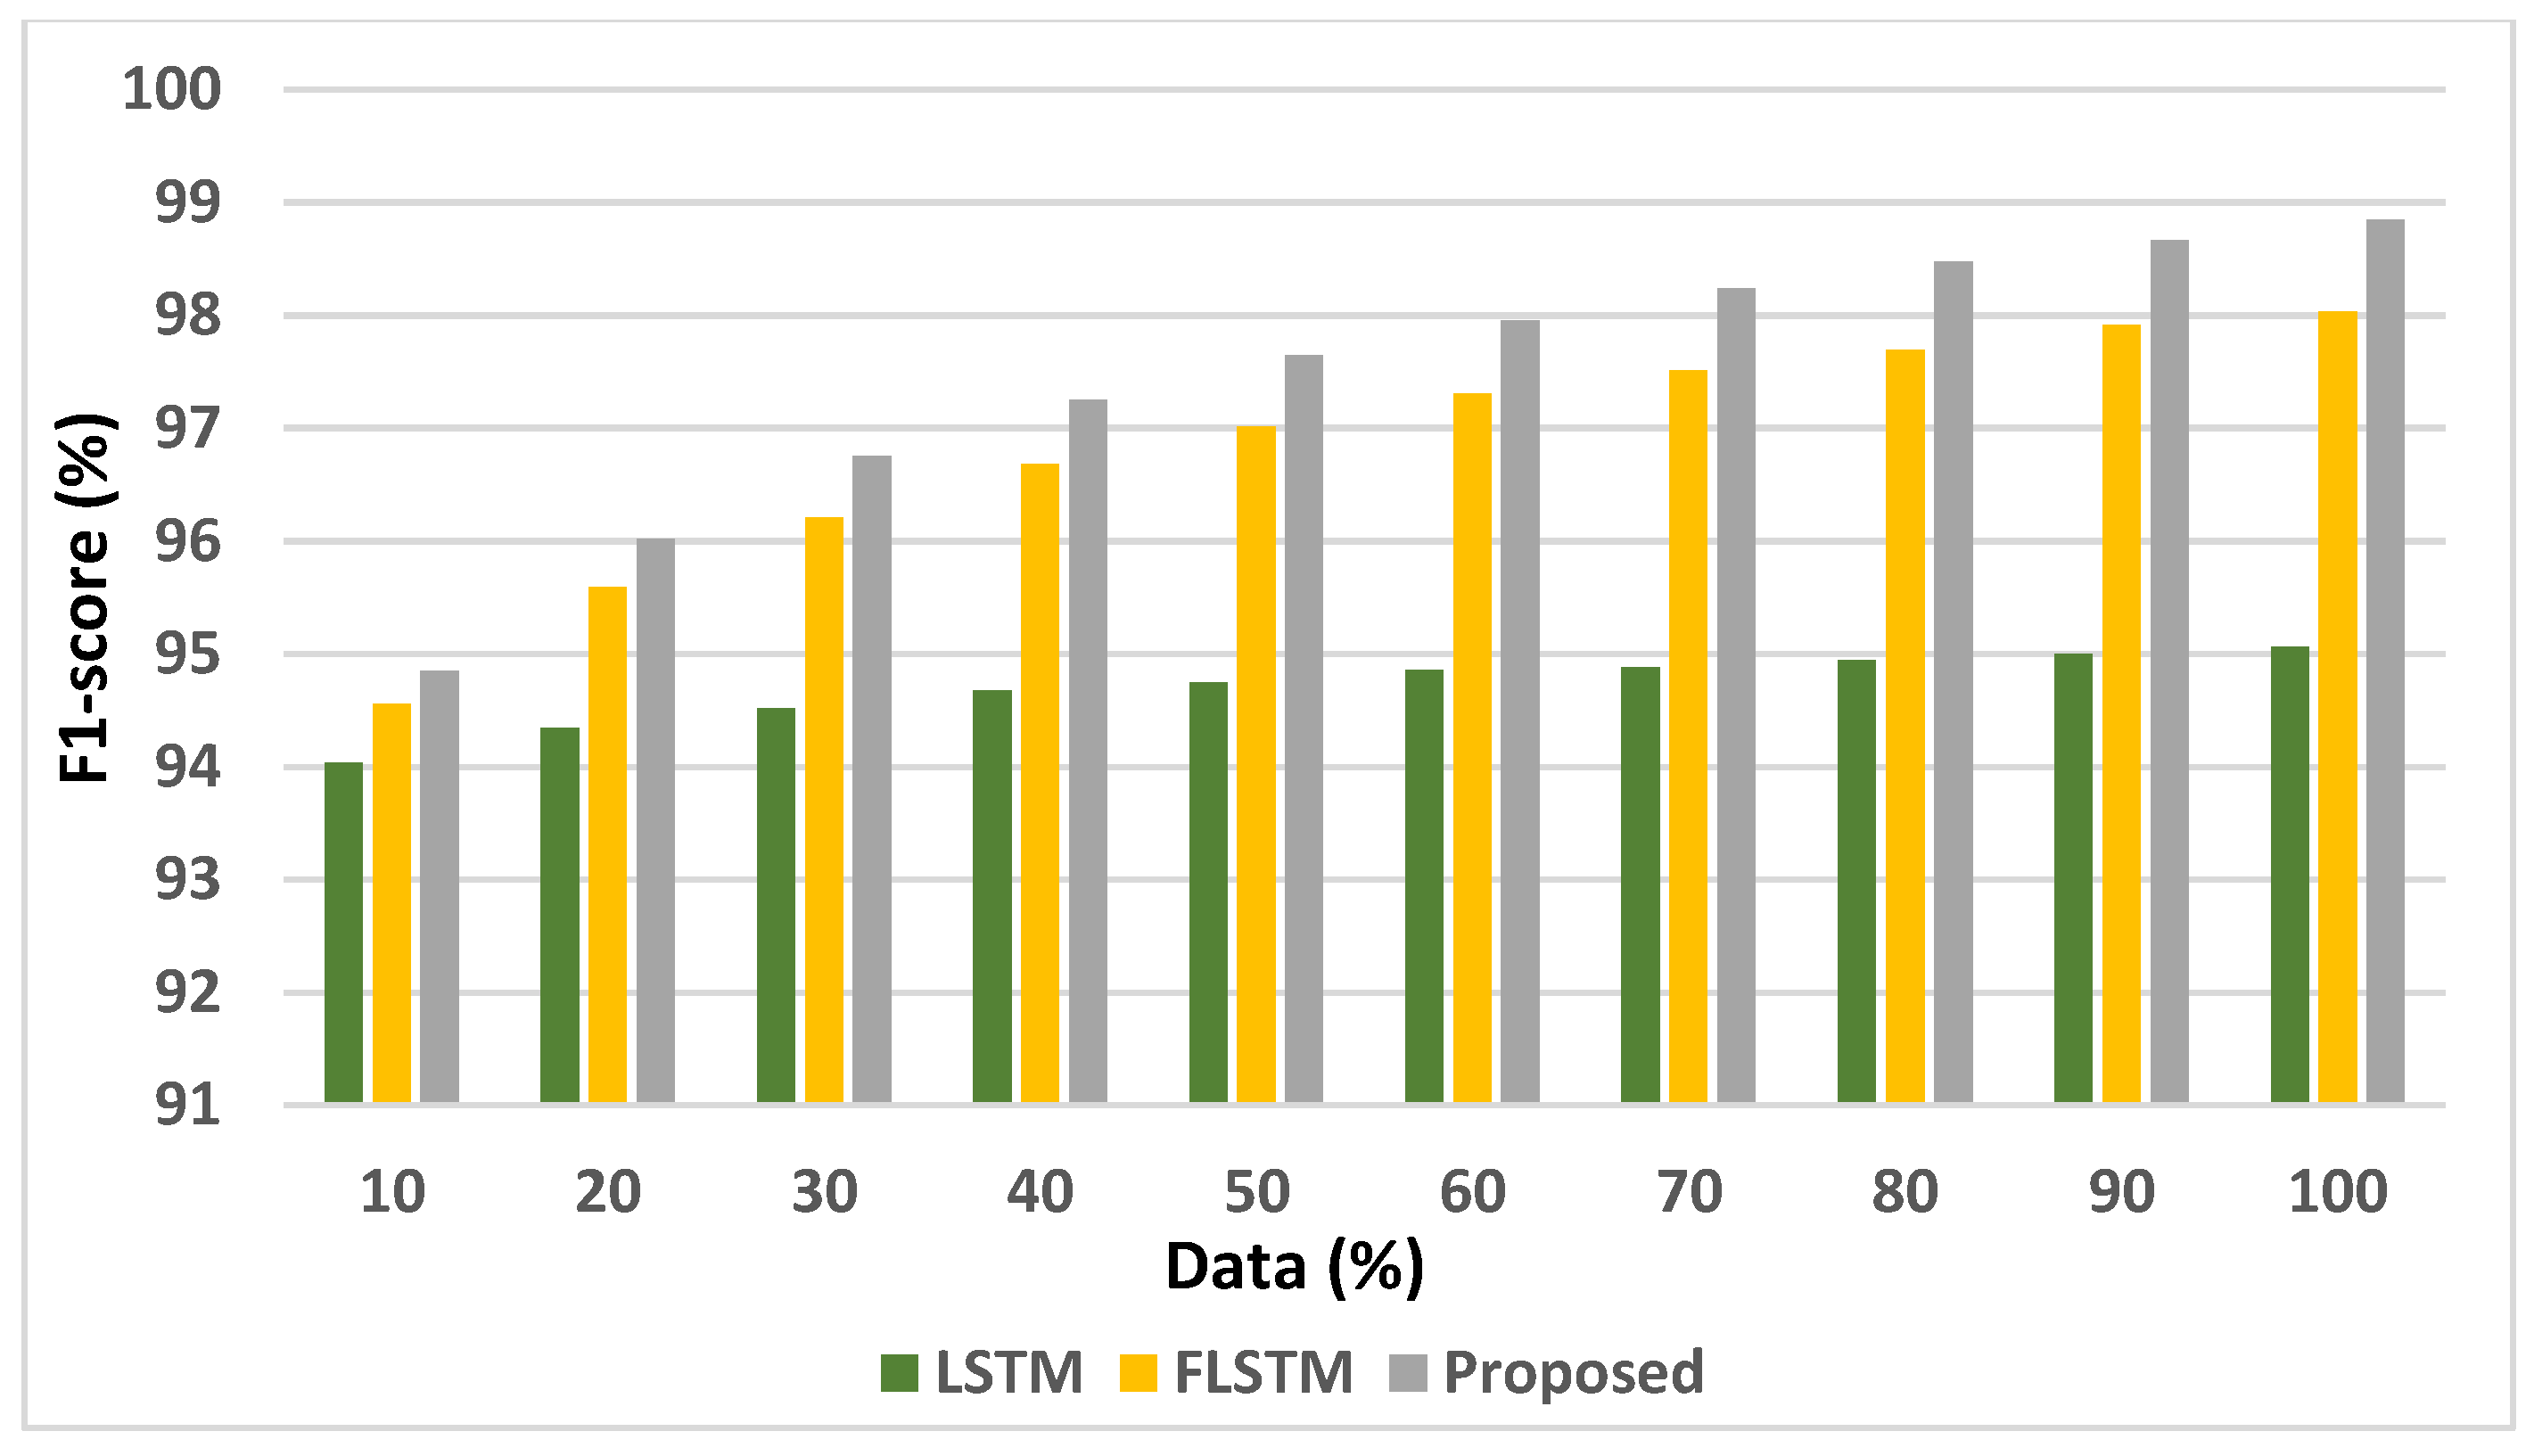
The experimentation is perpetrated to evaluate the suggested system with varying numbers of instances ranging from 10% to 100% on the models of generic LSTM, FIS combined with LSTM (FLSTM), and the proposed method.
Table 4 and
Table 5 represent the performance in terms of the evaluation indices of accuracy, precision, recall/sensitivity, specificity, and F1-score of the LSTM, FLSTM, and proposed models.
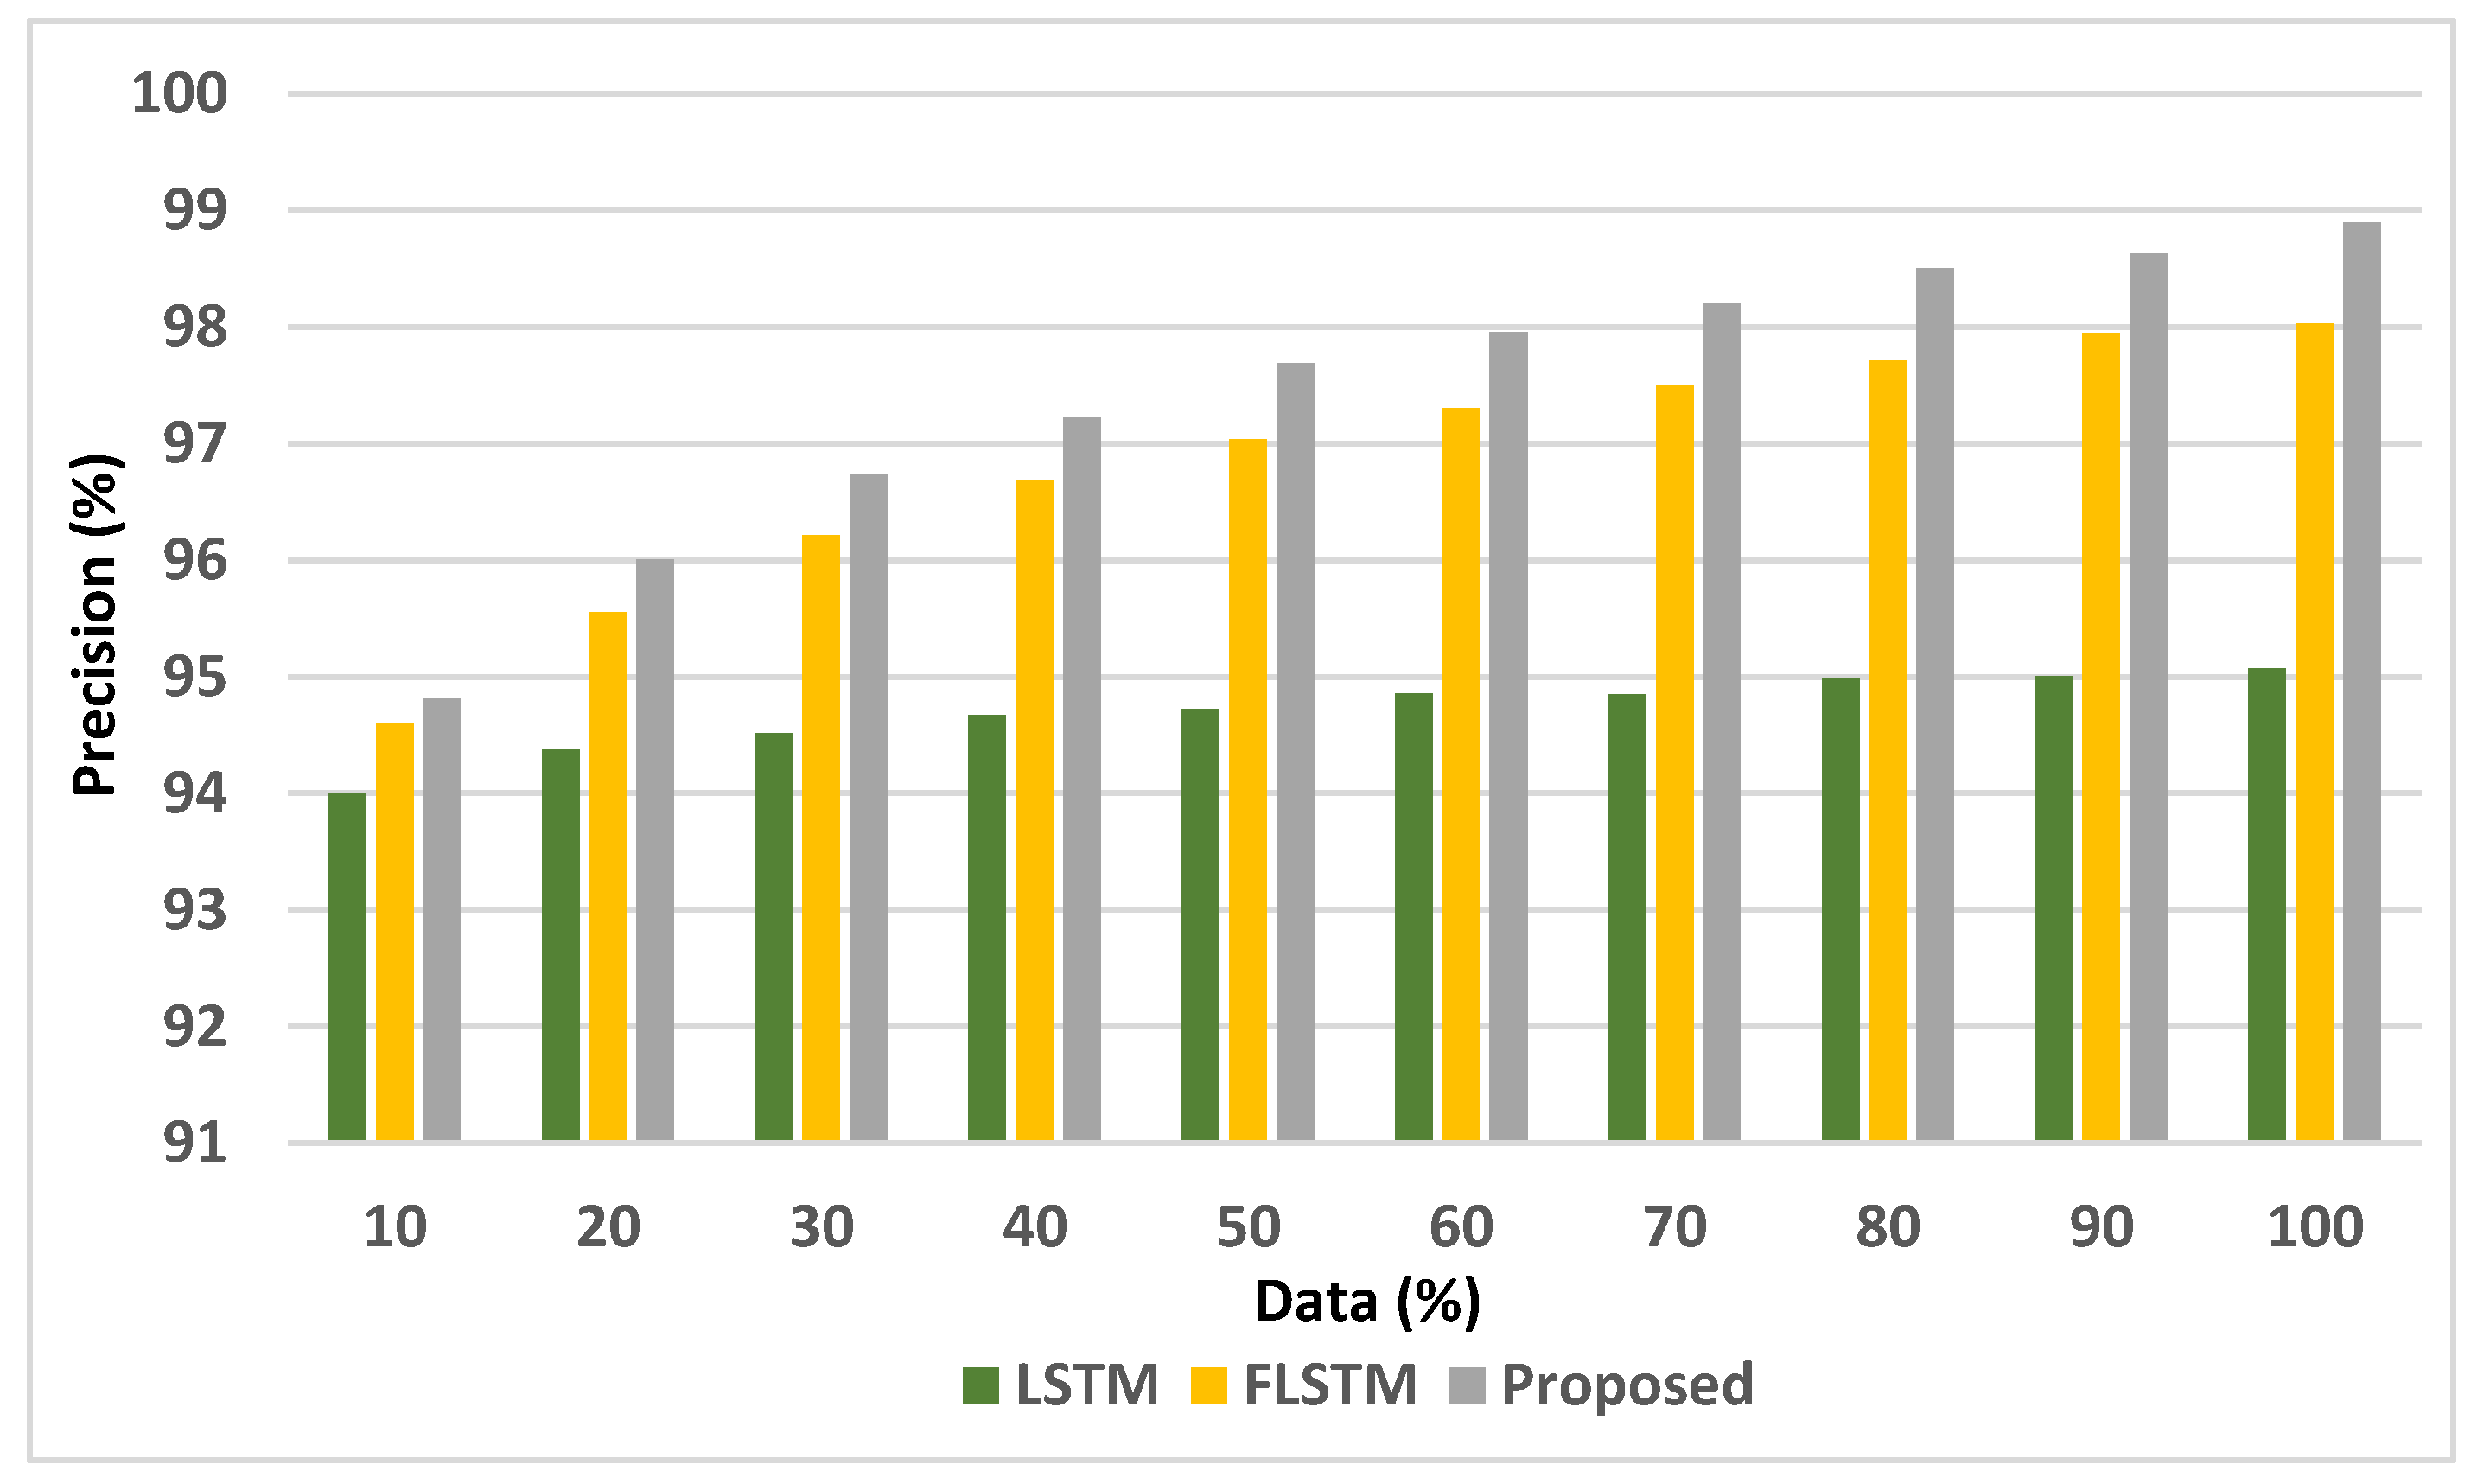
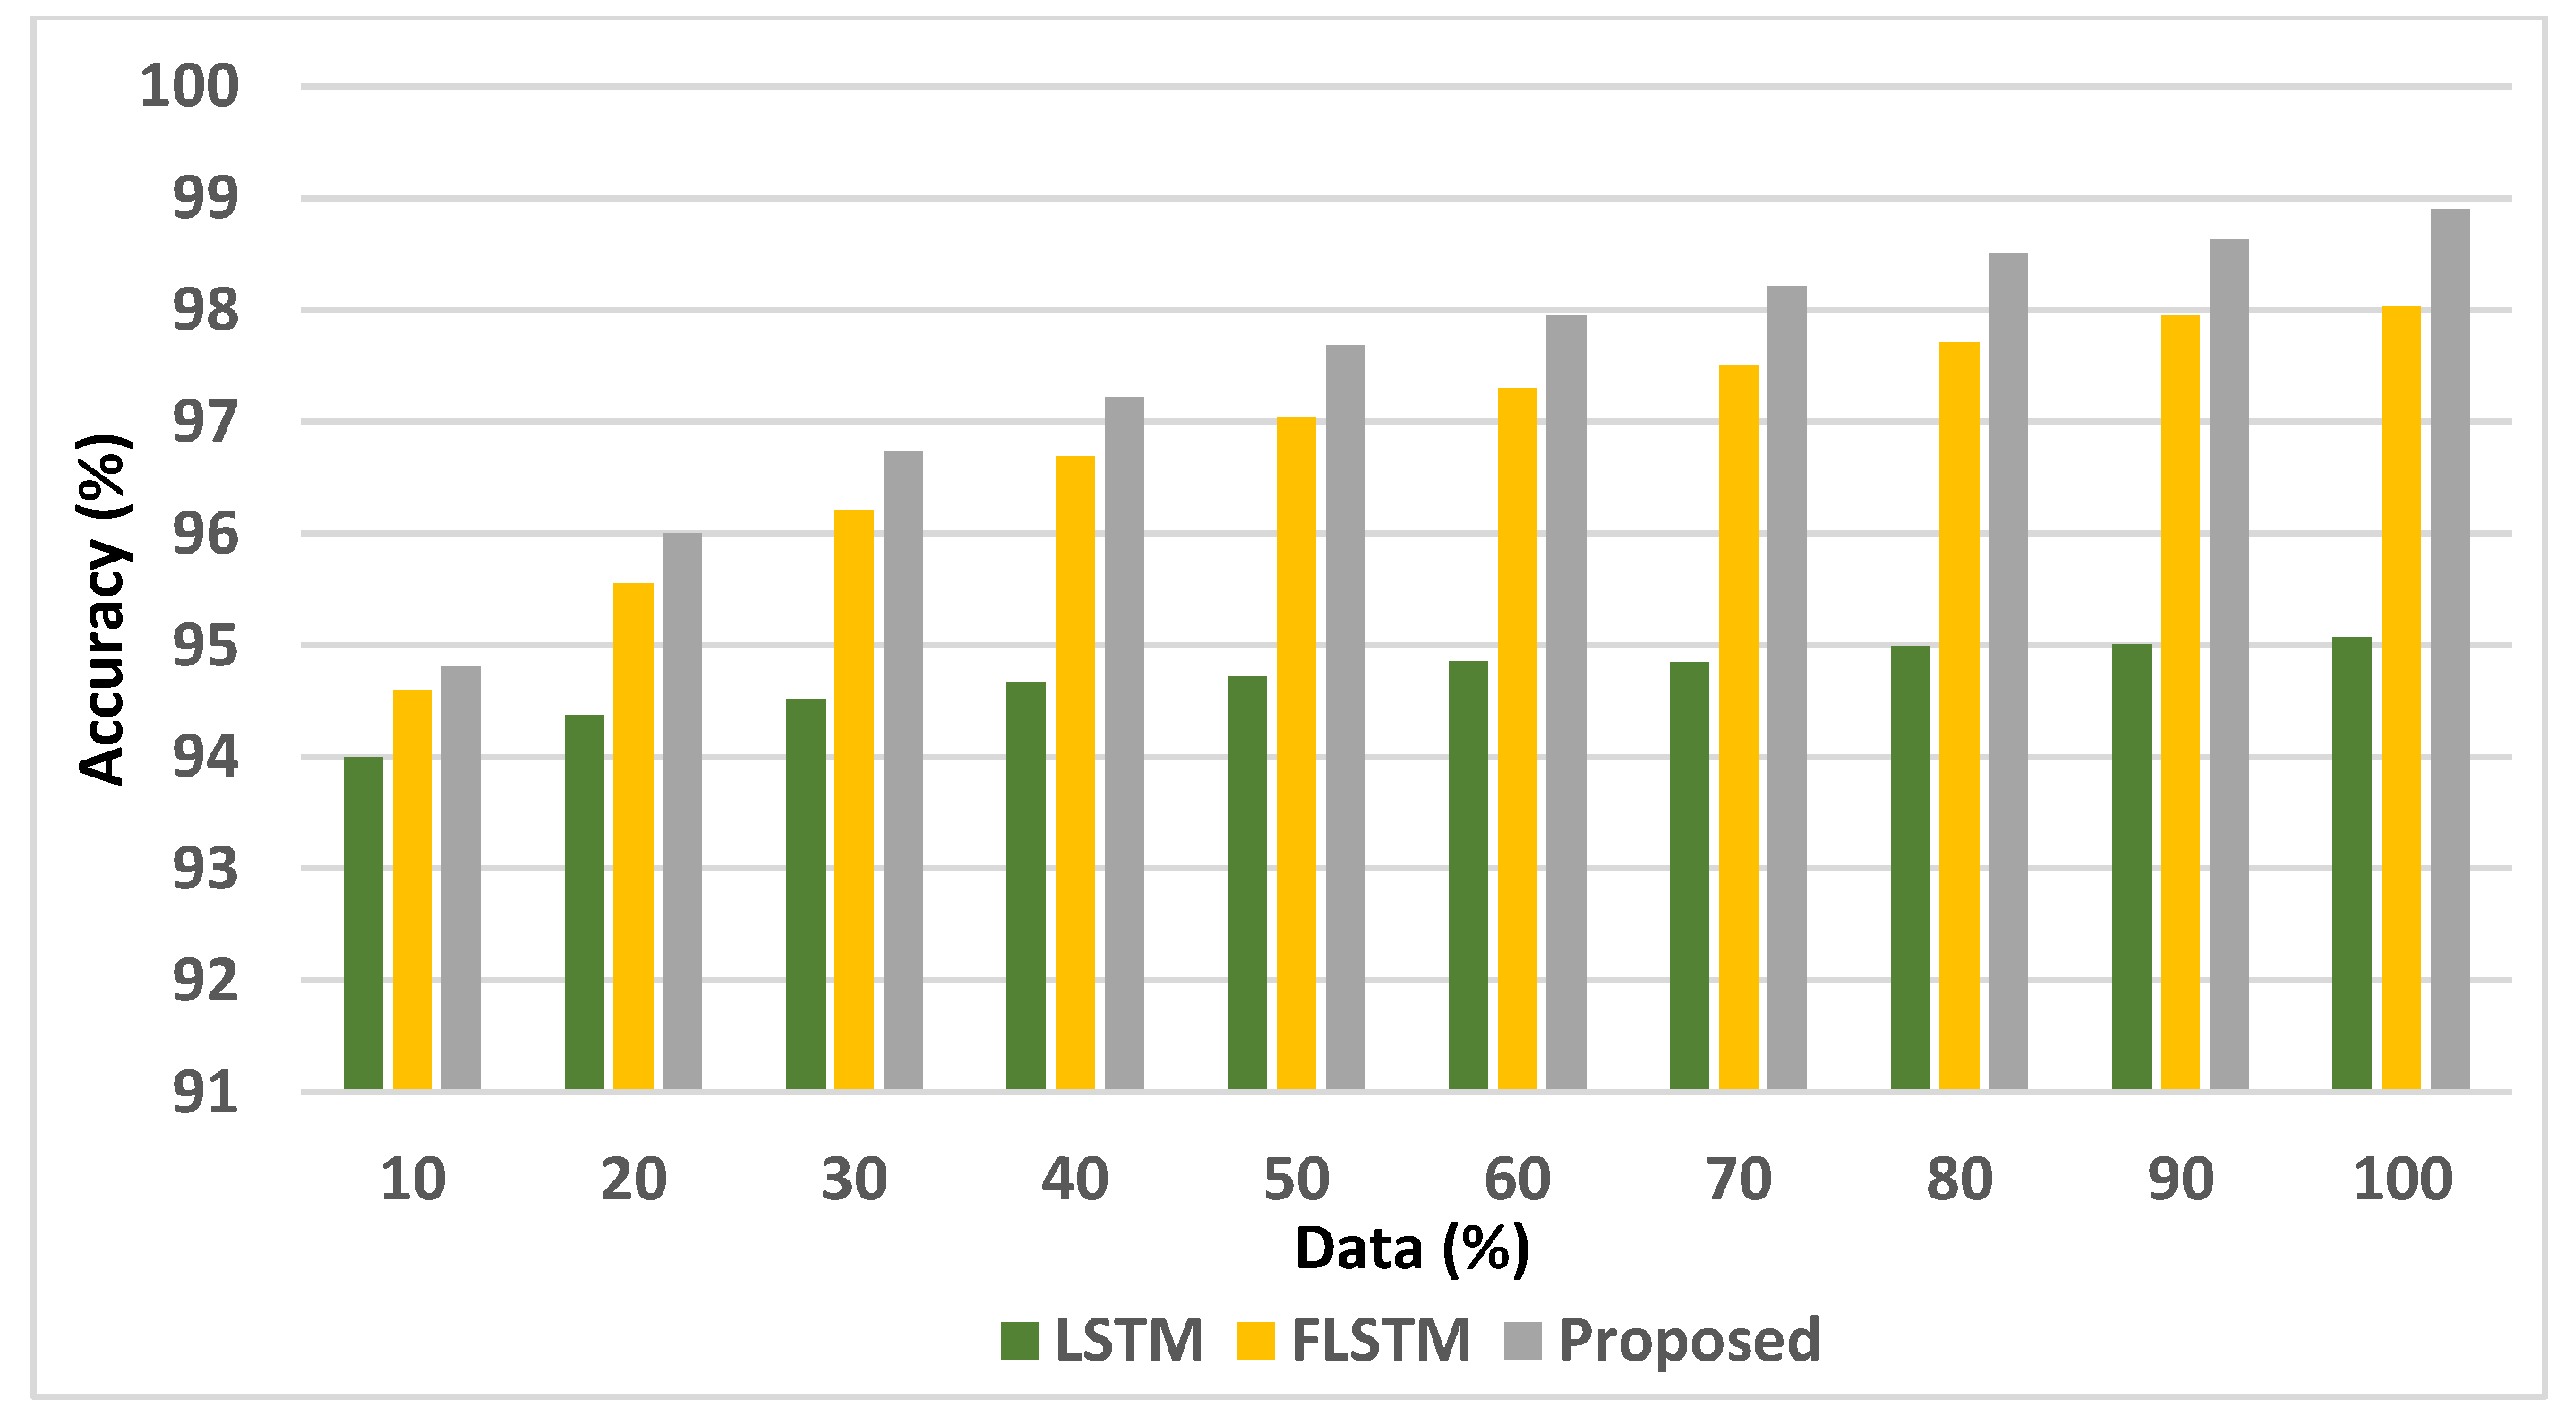
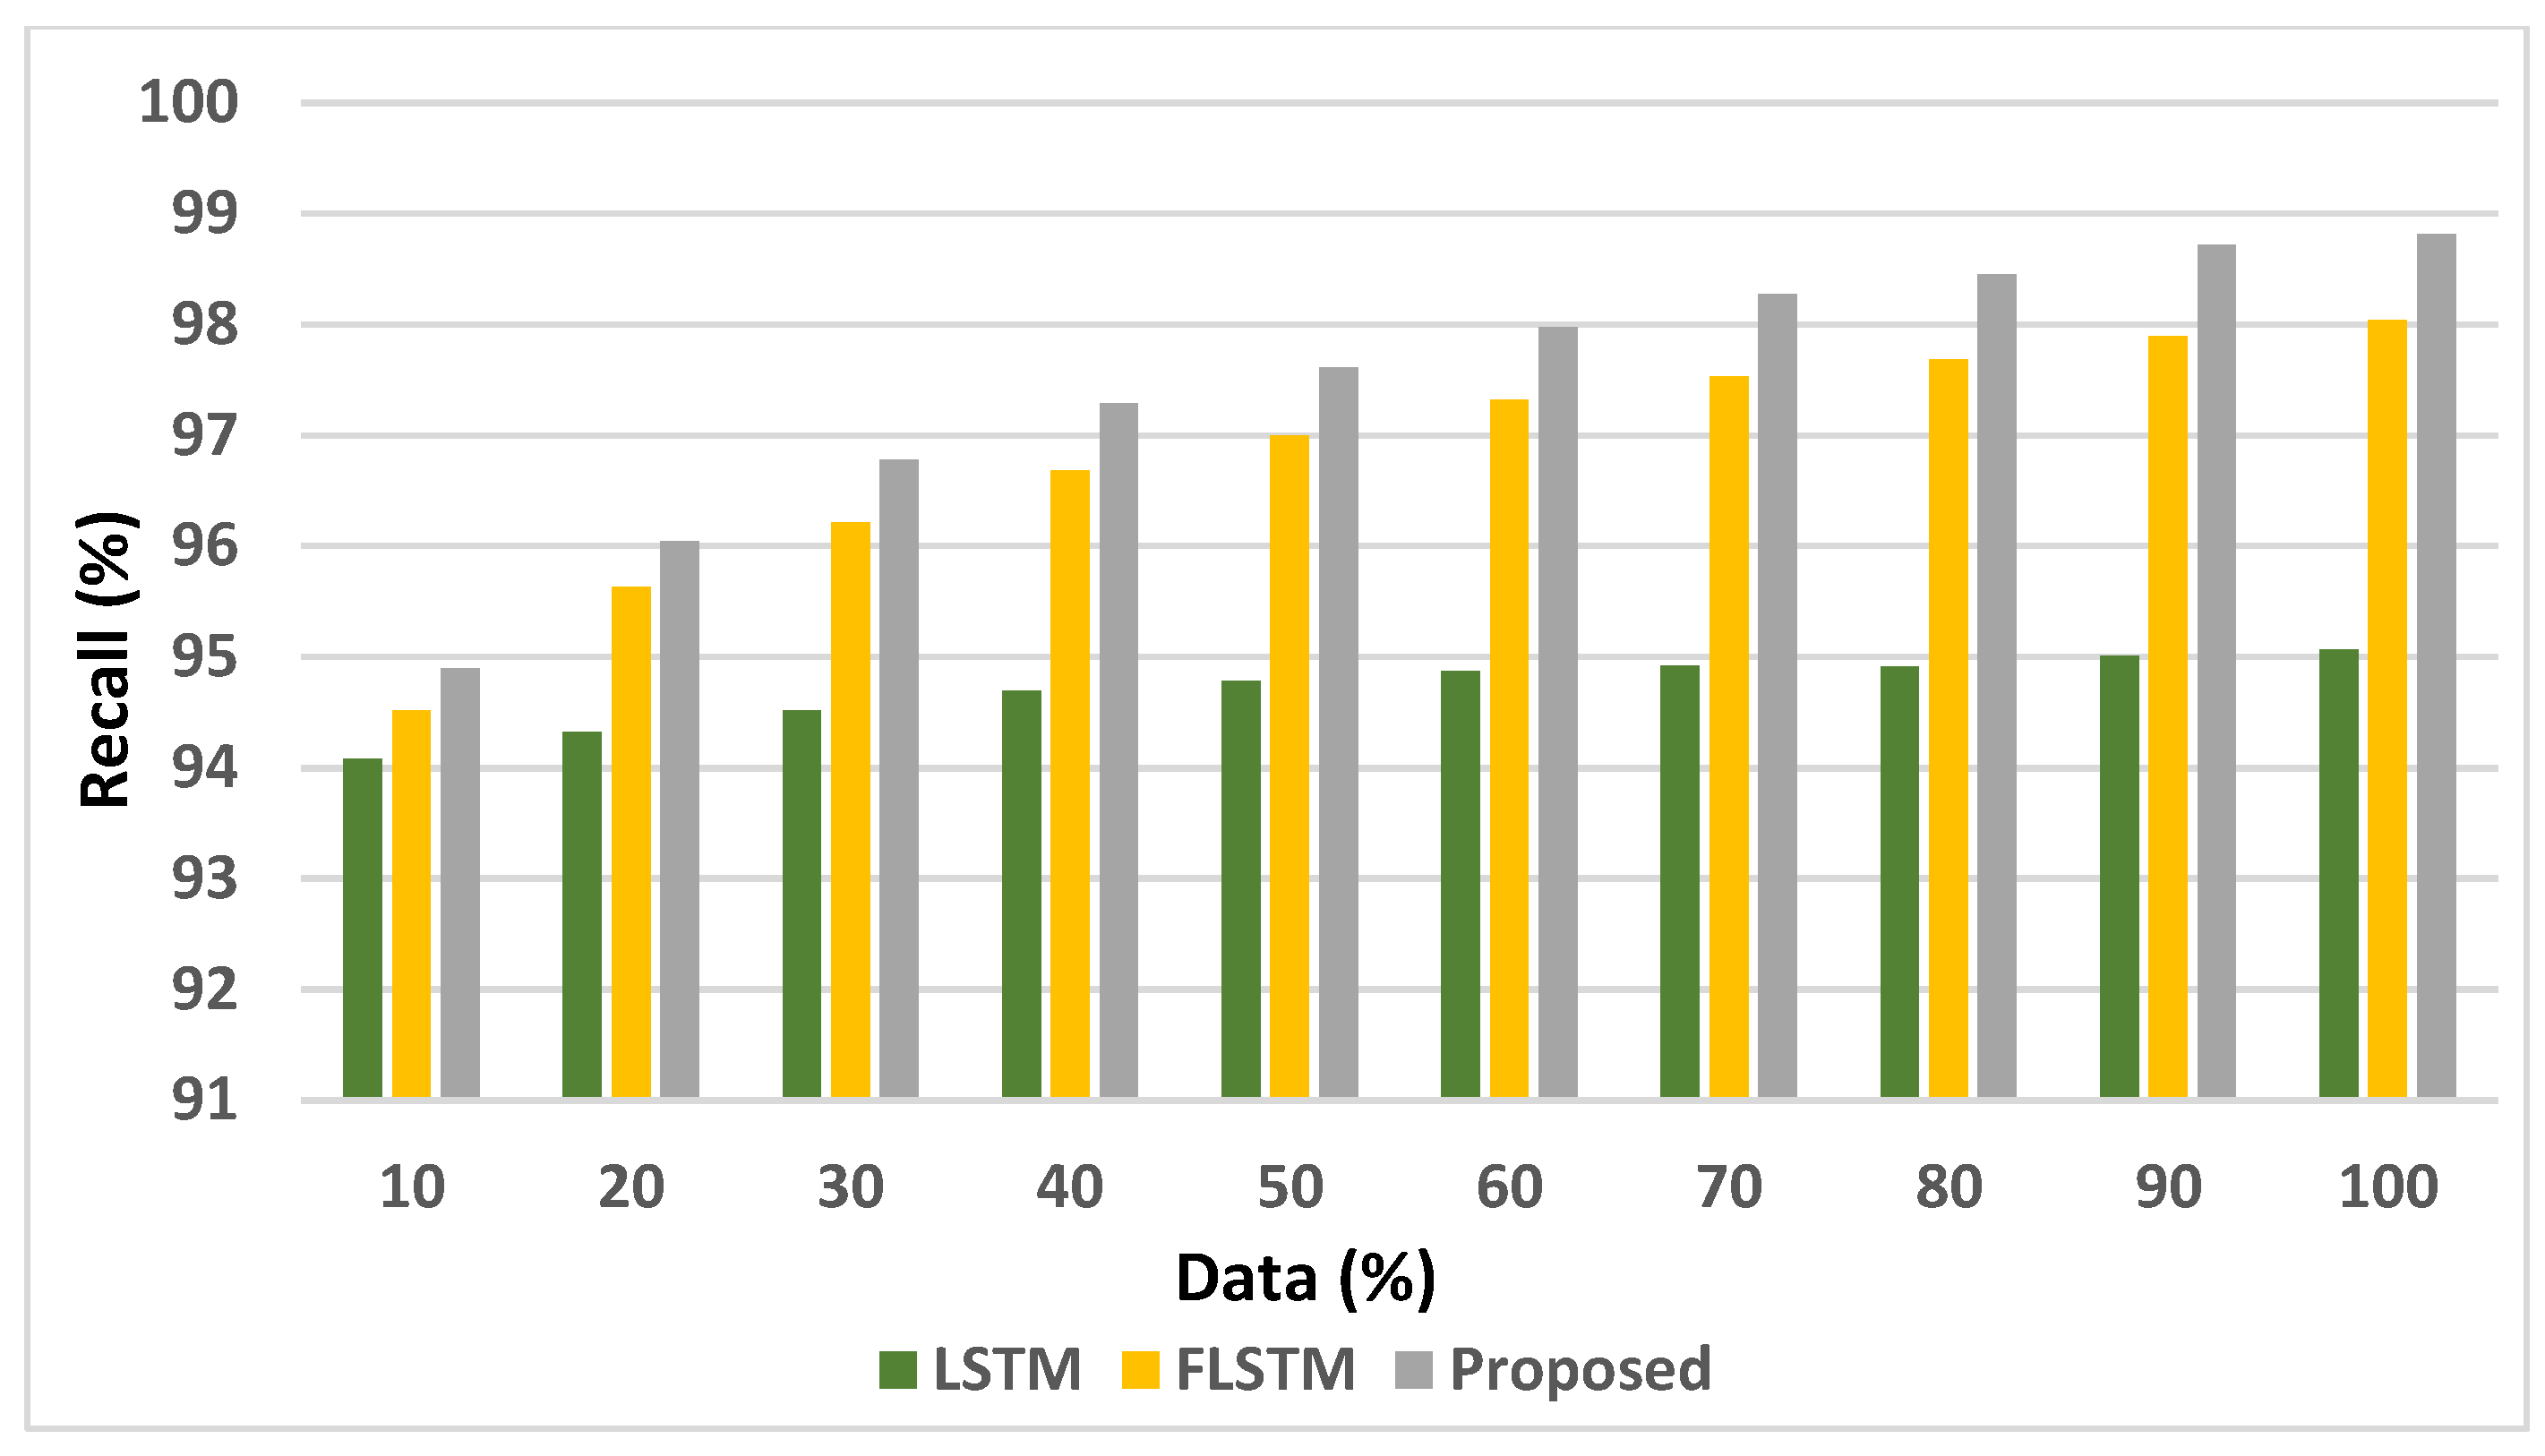
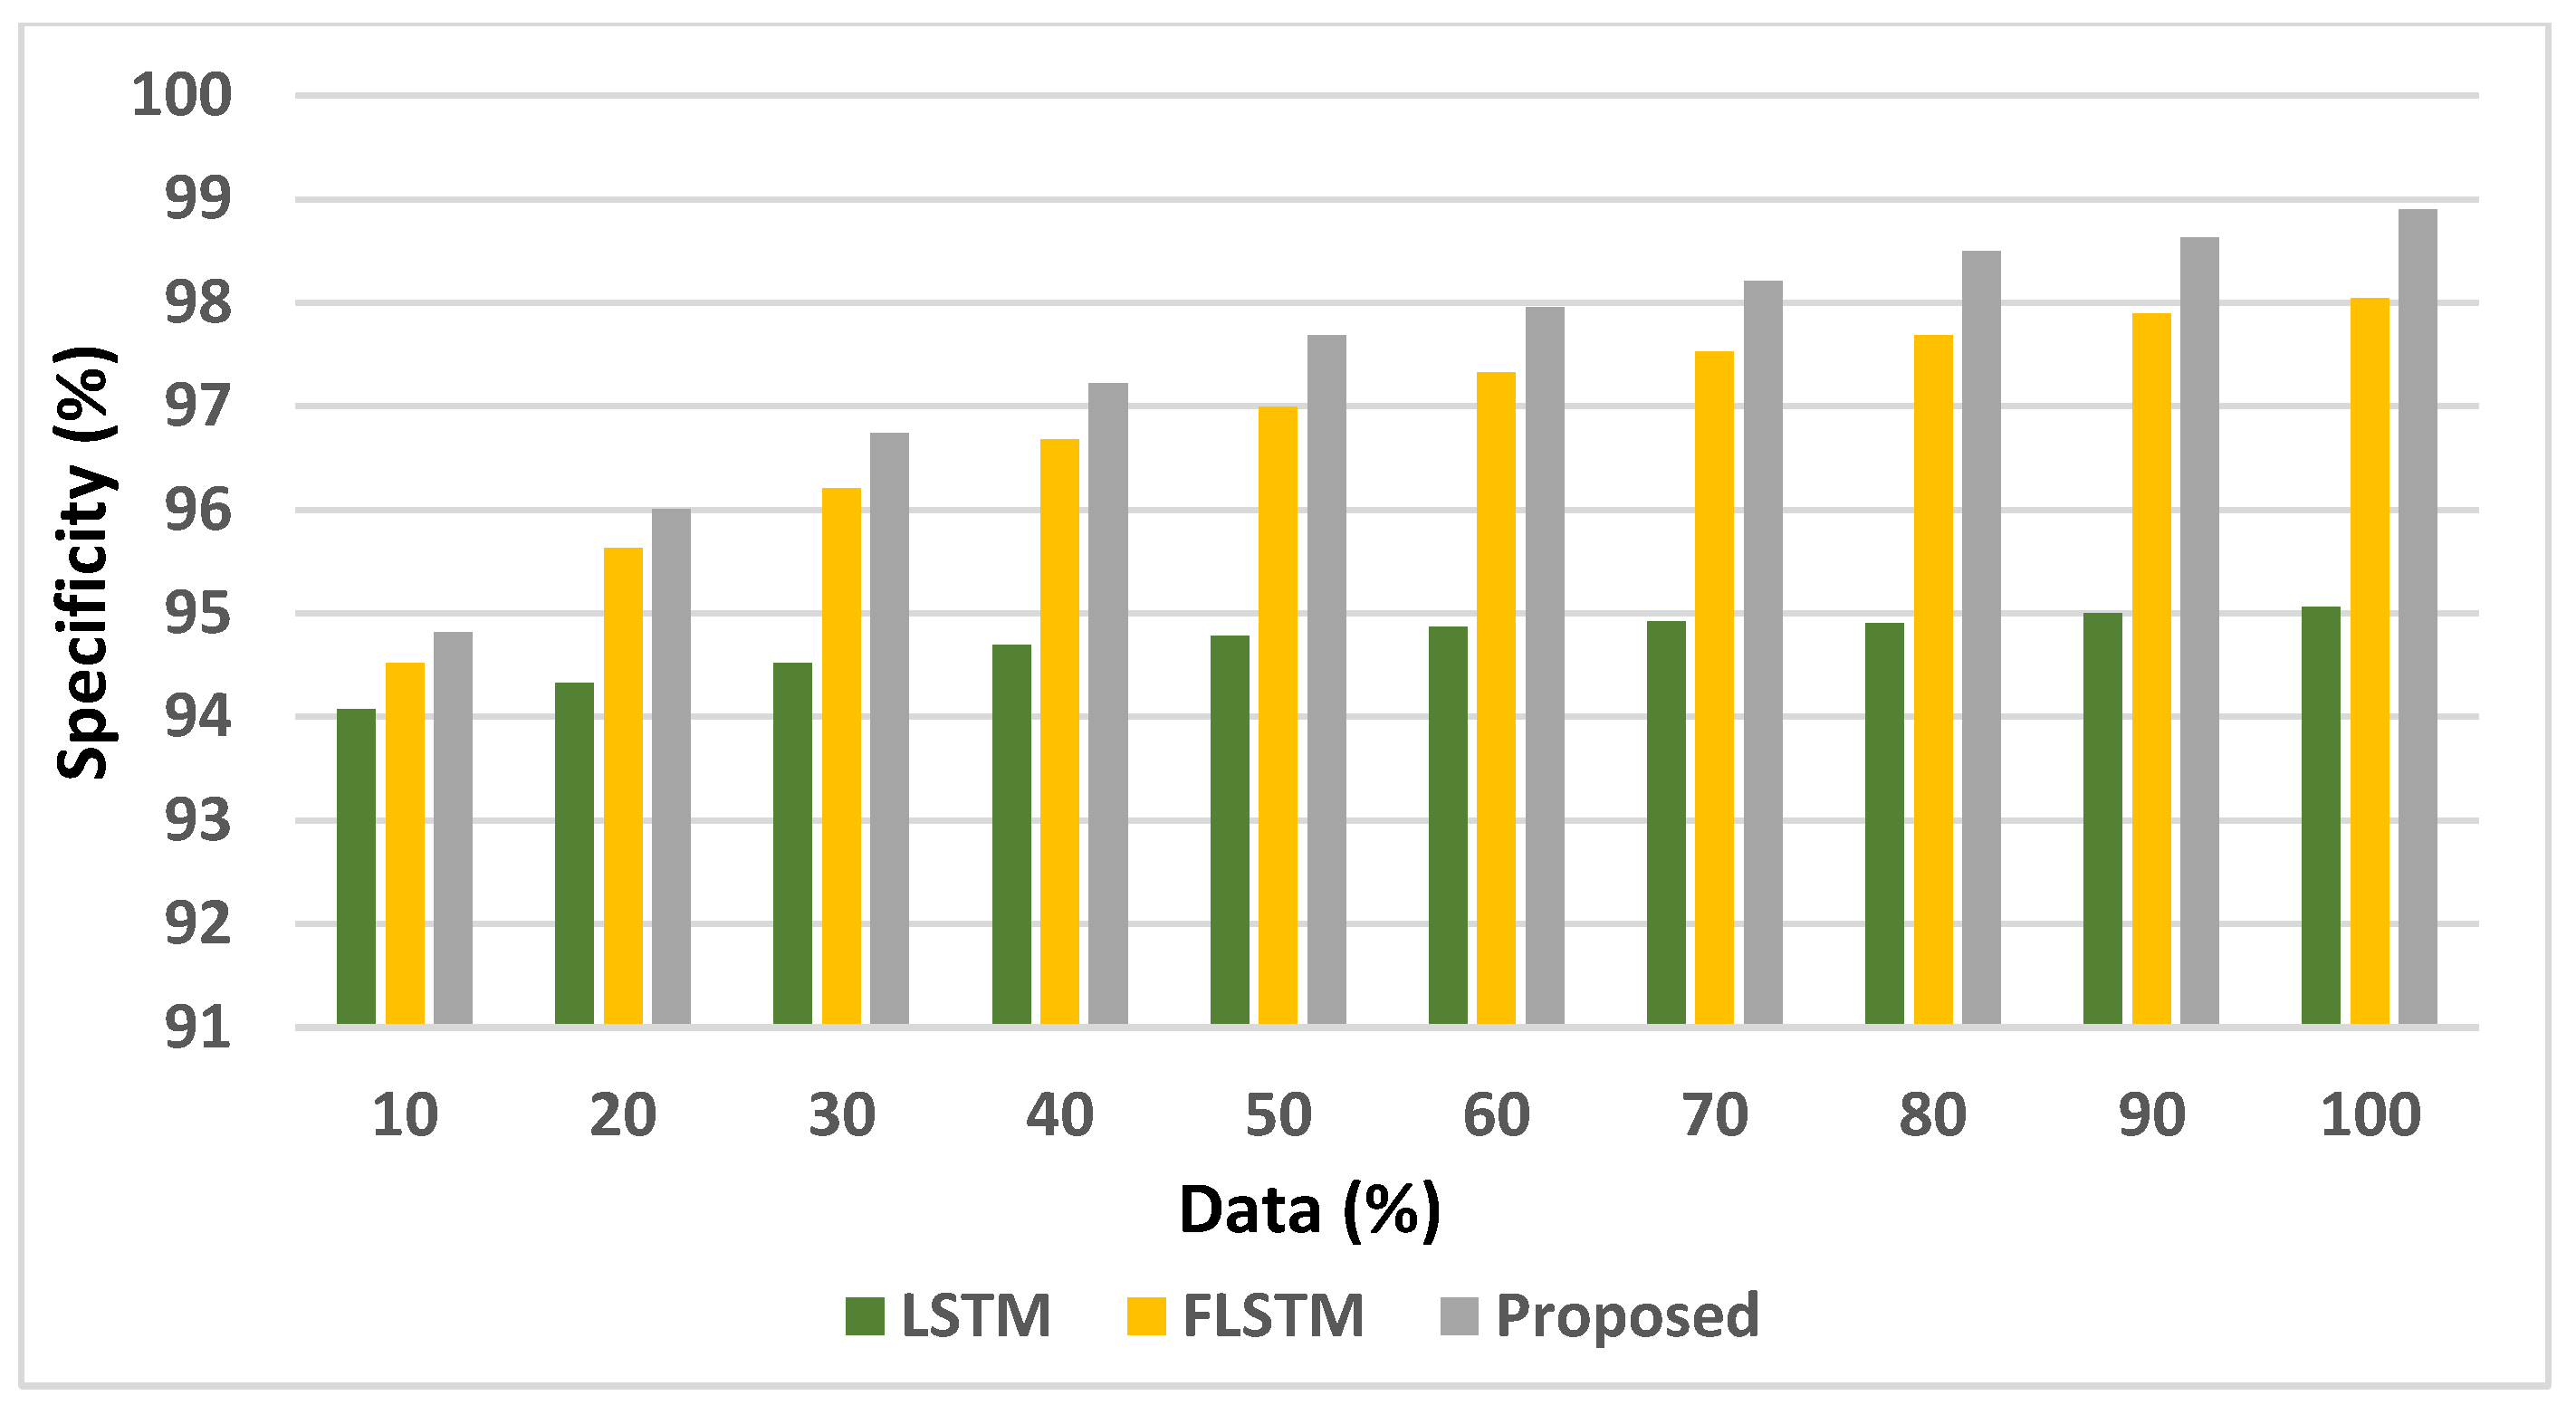
Figure 5,
Figure 6,
Figure 7,
Figure 8 and
Figure 9 depicts the analysis of the accuracy, precision, recall, specificity, and F1-score displayed by LSTM, FLSTM, and the proposed models. The records are increased from 10% to 100% for the experiment of the three considered models.
The results of analysing accuracy, precision, sensitivity, specificity, and F1-Score of the proposed model, LSTM, and FLSTM models unveil that the suggested model outperforms the performance of the other two models.
The overall performances of the proposed model, LSTM, and FLSTM models are compared in
Table 6.
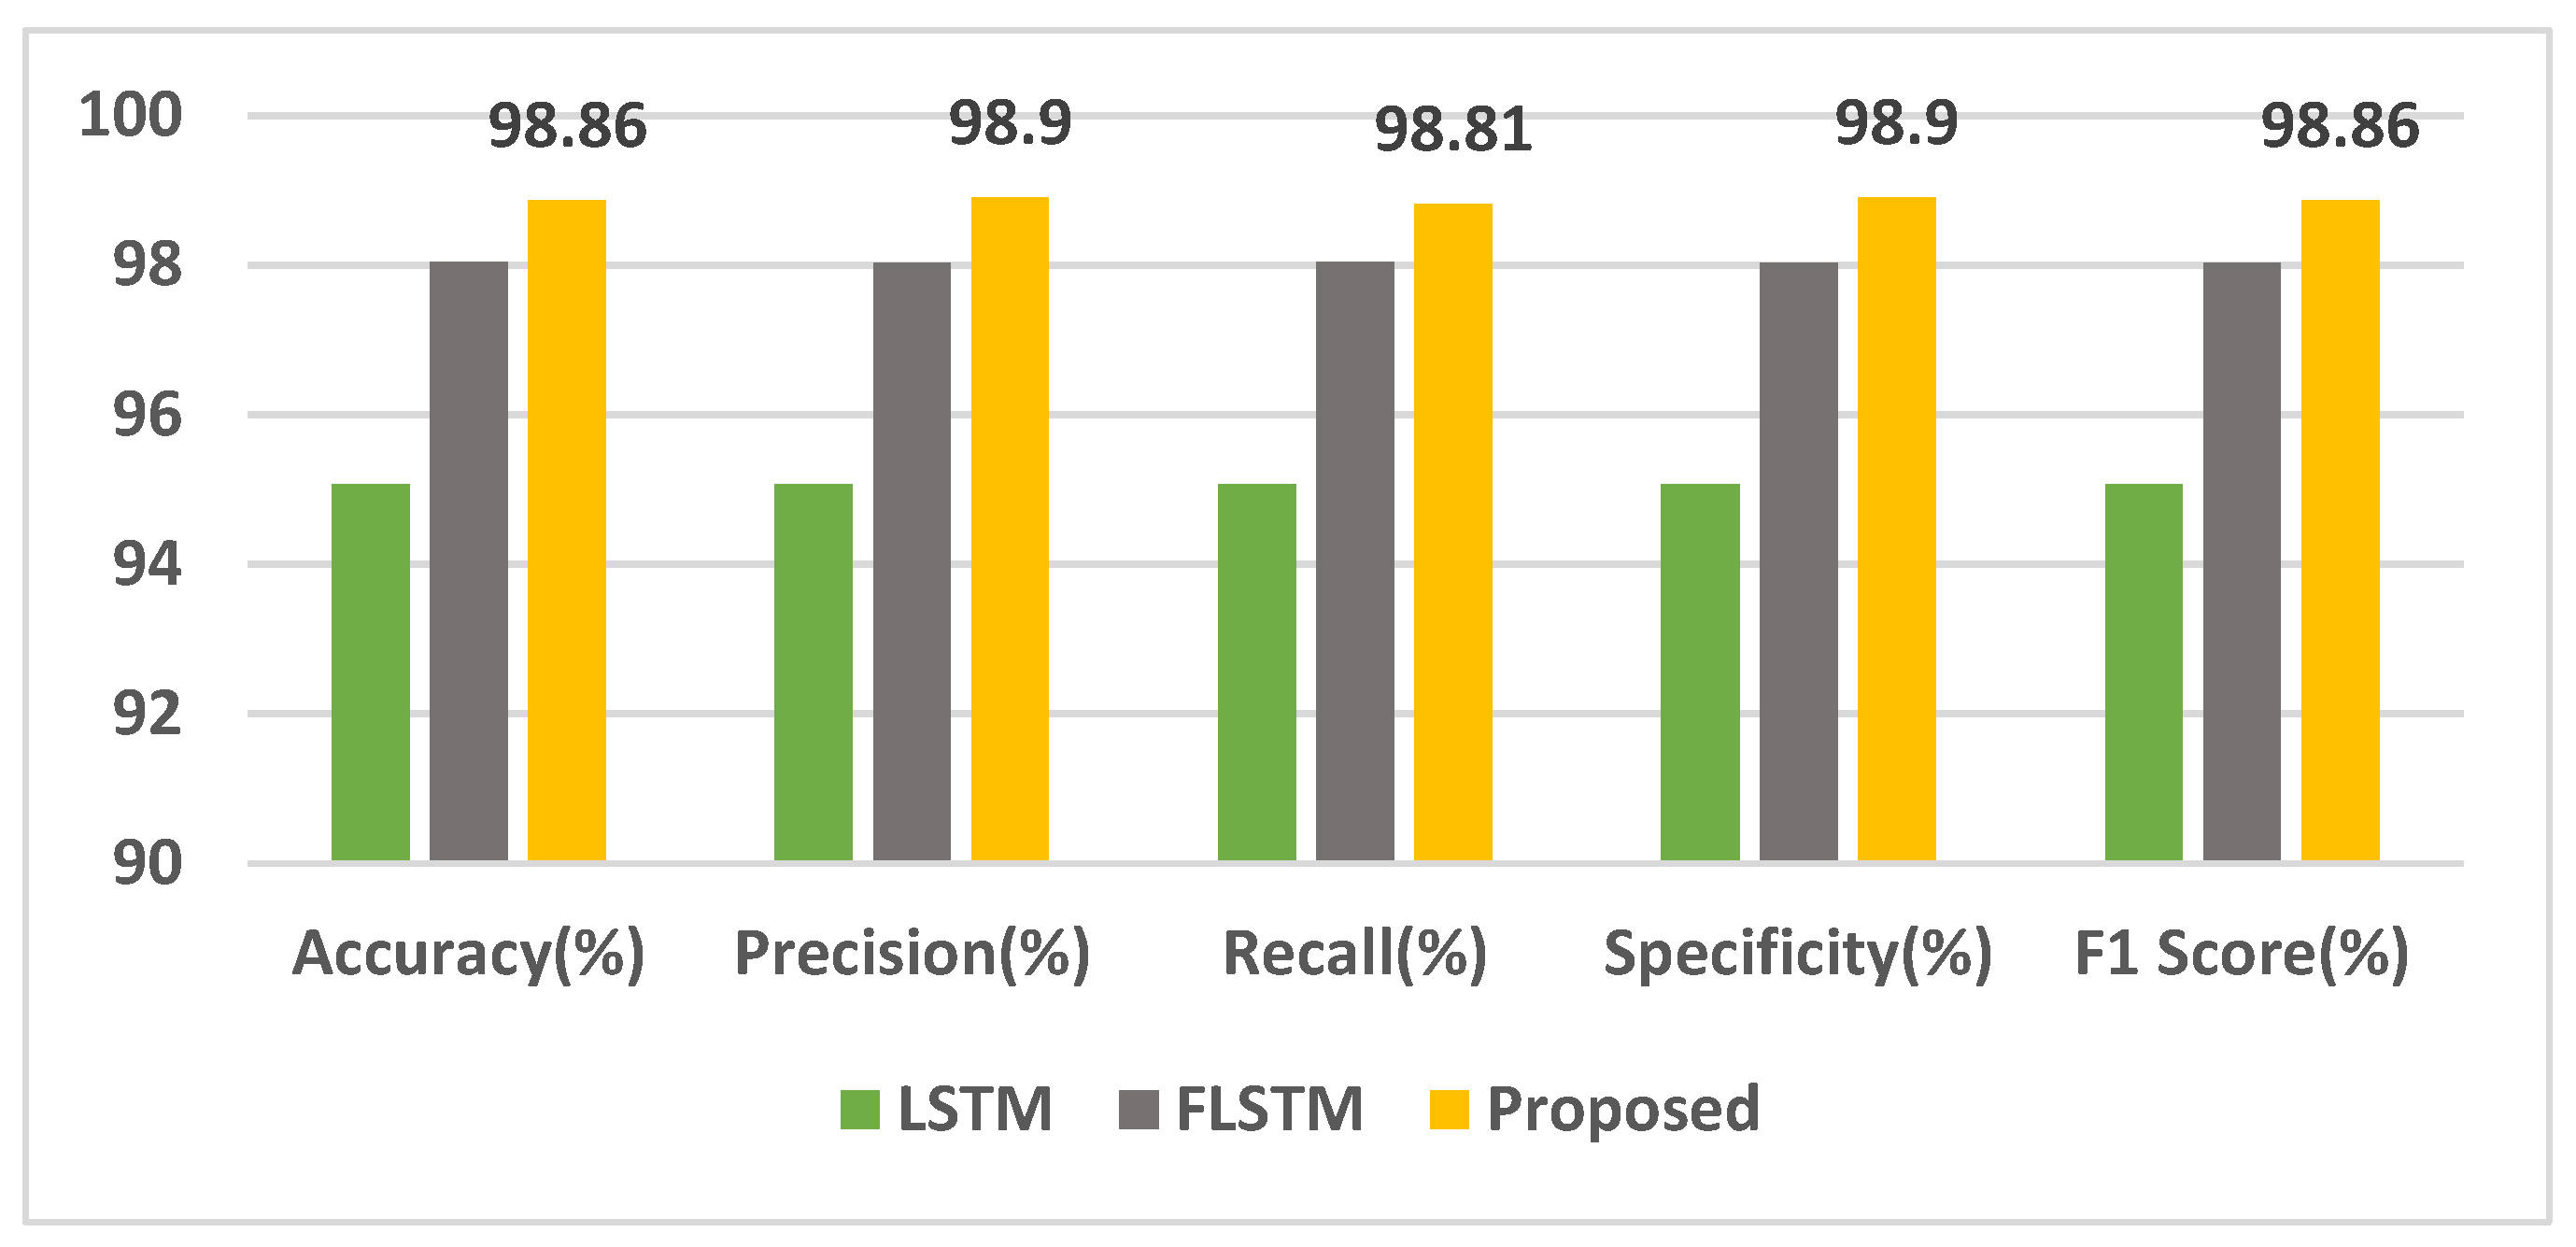
Figure 10 depicts the performance results of the proposed model.
Taking into account several performance criteria, it is reasonable to infer that the proffered FIS with the Bi-LSTM model outperforms the other models with exceptional outcomes.
The recurrent neural networks are capable of handling sequential data but inefficient at handling long-term dependency when there is a considerable gap among the related input data. To overcome the issues of standard RNN, LSTM was put forth. LSTM retains information from the previous input, using the hidden unit of a memory cell. Unidirectional LSTM retains information from the past. However, in bidirectional LSTM, two distinct LSTM hidden layers with comparable output in opposing directions enable it to act on prior and future content. The experiments were performed with models of generic LSTM, a fuzzy inference system (FIS) combined with LSTM and proposed BiLSTM models for heart disease risk prediction using UCI heart disease dataset with 100,000 records. The accuracy of the generic LSTM model is 95.07%, which the FLSTM (FIS combined with LSTM) surpasses with 98.04% accuracy. The proposed system with FIS combined with bi-LSTM outperforms the two previous models with 98.86% accuracy. The suggested system also shows improved results in terms of precision, recall, specificity, and F1-score when compared to the other two models. The generic LSTM model uses sigmoid and tanh activation functions, and deep neural networks are found to be greatly influenced by the chosen activation function. In the proposed system, each of the two LSTM cells is modelled with swish, tanh, and Leaky ReLU activation functions, and hyperparameter tuning resulted in enhanced results.
6. Comparative Analysis
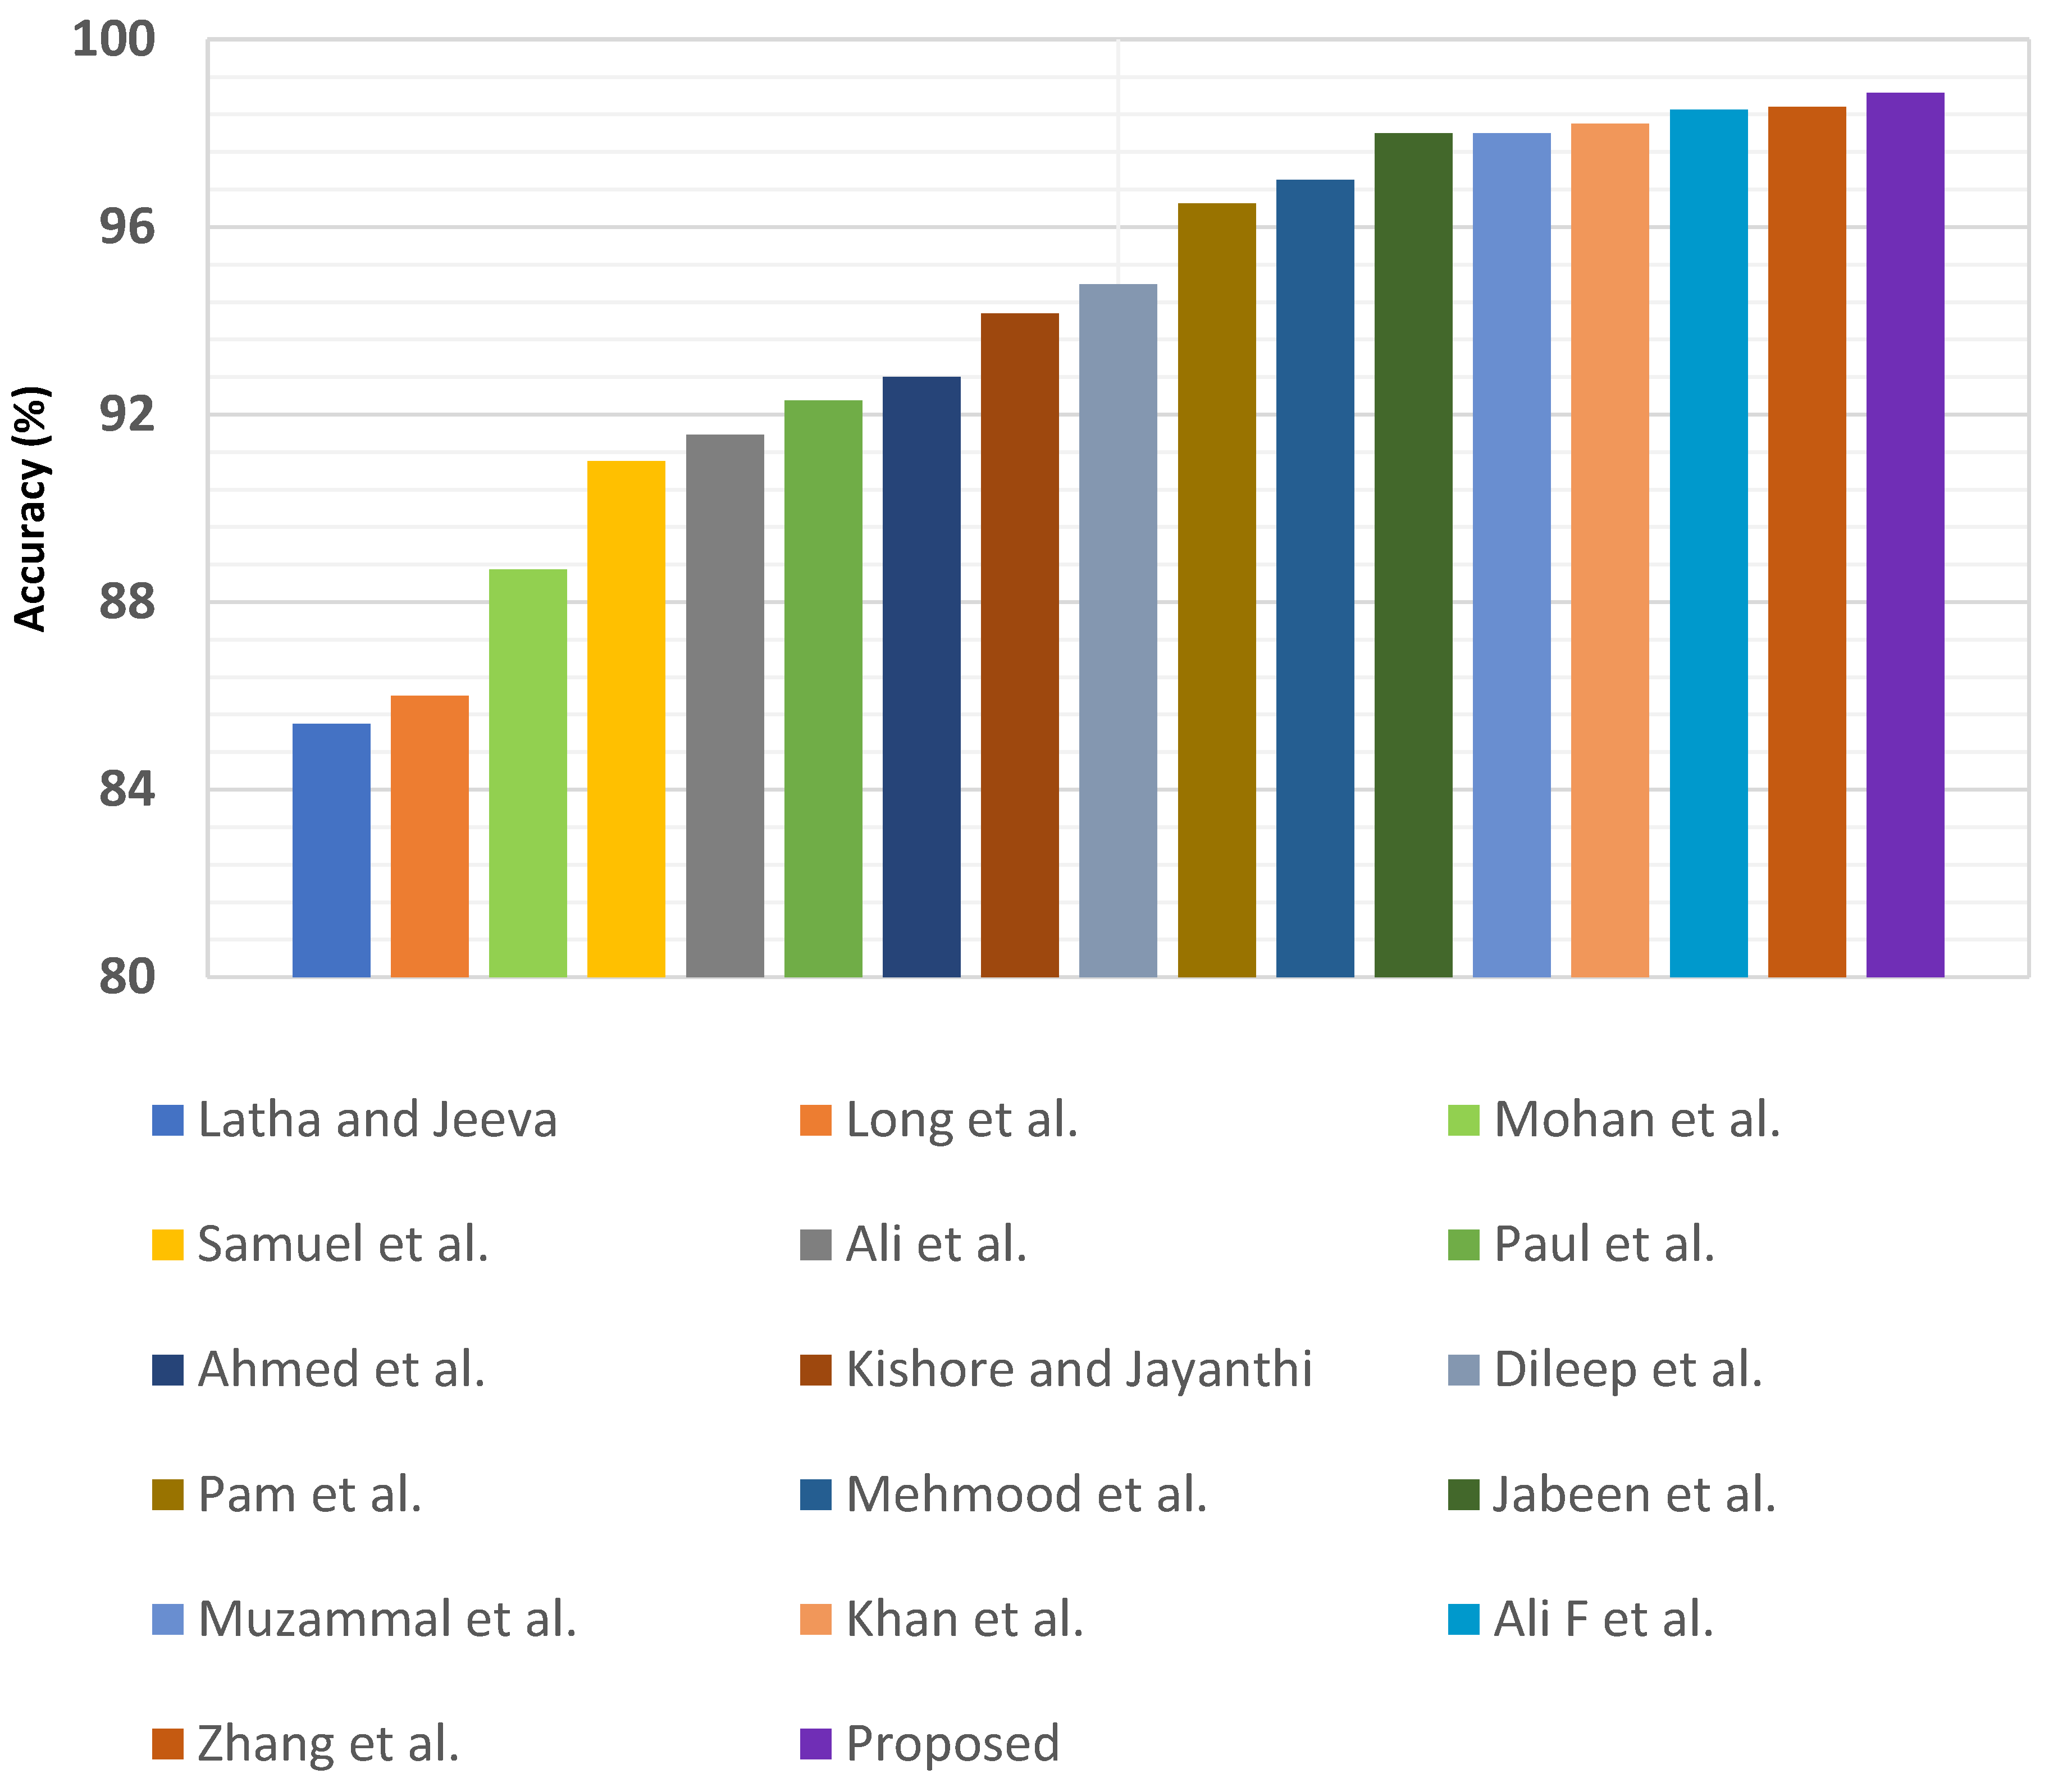
The proposed work is assessed in terms of prediction accuracy with cutting-edge approaches that harness heart disease datasets. The comparison study analysing the proposed model’s accuracy results with the existing literature models is listed in
Table 7, in the order of increasing accuracy.
Figure 11 portrays the comparison of the performance results of the proposed model with the existing systems.
The results of the comparison with the related state-of-the-art heart disease predictive systems reveal that the proposed system’s performance surpasses that of the existing systems.
Major IoT-driven tasks for real-time smart systems involving healthcare warrant rapid processing as such applications are delay and context-sensitive. The escalation in the number of IoT devices and the upsurge in the data generated by the smart devices has resulted in immense data traffic resulting in extensive bandwidth utilization and service difficulties. As the Cloud–IoT model suffers from limitations such as latency, connectivity, and bandwidth utilization, the cloud computing model seems inadequate to manage these challenges solely due to its centralized model [
43,
44,
45,
46,
47]. These shortcomings set the stage for decentralized models of edge computing (EC) and fog computing (FC), wherein computation and storage can be handled at the edge nodes closer to the data source. These newer computing technologies complement the Cloud and serve as an extension to it while enabling artificial intelligence tasks at the edge nodes. This hierarchical edge–fog–cloud model considerably reduces the delay constraints by efficiently handling the humongous data acquired by the IoT devices while mitigating latency. Thus, the proposed cloud-based prediction system can be deployed at the fog/edge layers in the future to overcome the Cloud’s intrinsic constraints, such as increased latency and bandwidth use, while managing the surge in IoT data.
7. Conclusions
In this research initiative, an IoT–Cloud-based smart healthcare system for heart disease risk prediction is proposed, and the fuzzy inference system (FIS) and the recurrent neural network’s bidirectional LSTM are harnessed for the predictive task. The proposed system’s accuracy, precision, sensitivity, specificity, and F1-score are 98.85%, 98.9%, 98.8%, 98.89%, and 98.85%, respectively, outperforming other state-of-the-art heart disease prediction models. This is just one facet of the healthcare research being done performed with predictive analytics, with a huge potential of deep learning models yet to uncover. The model can be enhanced to automatically elicit a personalized diet and exercise recommendations to individuals as per their health condition and heart specialist advice. The proposed smart heart disease prediction system utilizes IoT devices for data acquisition, and other predominant tasks are reserved for the Cloud. In the future, this work can be extended to include fog/edge computing, wherein time-critical analytical tasks can be accomplished at the fog/edge layers to overcome the inherent limitations of the Cloud, such as increased latency and bandwidth utilization while handling IoT data upsurge [
48,
49,
50,
51]. The efficacy of the healthcare domain can be revolutionized with precise and timely disease predictions alongside rapid responses and agile decision-making by clinicians, which will improve the overall quality-of-service when fog/edge computing is involved.
Author Contributions
Conceptualization, A.A.N., D.R., and K.S.; methodology, A.A.N., D.R., and K.S.; software, A.A.N.; validation, P.M.D.R.V., K.S., and D.G.R.; formal analysis, A.A.N.; investigation, A.A.N.; resources, K.S. and D.G.R.; data curation, A.A.N.; writing—original draft preparation, A.A.N.; writing—review and editing, A.A.N., D.R., P.M.D.R.V., K.S., and D.G.R.; visualization, A.A.N. and K.S.; supervision, D.R.; project administration, D.G.R.; funding acquisition, D.G.R. All authors have read and agreed to the published version of the manuscript.
Funding
No funding was received for this study.
Data Availability Statement
The original contributions generated for this study are included in the article; further inquiries can be directed to the corresponding author.
Conflicts of Interest
The authors declare no conflict of interest.
Abbreviations
| GD | Gateway device |
| CS | Cloud server |
| μ1 | Membership function |
| RTA | Real-time Analyzer |
| Puid | Unique identification number of patient |
References
- Bhatia, M.; Sood, S.K. Game Theoretic Decision Making in IoT-Assisted Activity Monitoring of Defence Personnel. Multimed. Tools Appl. 2017, 76, 21911–21935. [Google Scholar] [CrossRef]
- Firouzi, F.; Farahani, B.; Marinšek, A. The Convergence and Interplay of Edge, Fog, And Cloud in the AI-Driven Internet of Things (IoT). Inf. Syst. 2022, 107, 101840. [Google Scholar] [CrossRef]
- Biswas, A.R.; Giaffreda, R. IoT and Cloud Convergence: Opportunities and Challenges. In 2014 IEEE World Forum on Internet of Things (WF-IoT); IEEE: Manhattan, NY, USA, 2014. [Google Scholar]
- Botta, A.; de Donato, W.; Persico, V.; Pescapé, A. Integration of Cloud Computing and Internet of Things: A Survey. Future Gener. Comput. Syst. 2016, 56, 684–700. [Google Scholar] [CrossRef]
- Santos, G.L.; Takako Endo, P.; Ferreira da Silva Lisboa Tigre, M.F.; Ferreira da Silva, L.G.; Sadok, D.; Kelner, J.; Lynn, T. Analyzing the Availability and Performance of an E-Health System Integrated with Edge, Fog and Cloud Infrastructures. J. Cloud Comput. Adv. Syst. Appl. 2018, 7, 16. [Google Scholar] [CrossRef] [Green Version]
- Suresh, S. Big Data and Predictive Analytics. Pediatr. Clin. N. Am. 2016, 63, 357–366. [Google Scholar] [CrossRef] [PubMed]
- Simpao, A.F.; Ahumada, L.M.; Gálvez, J.A.; Rehman, M.A. A Review of Analytics and Clinical Informatics in Health Care. J. Med. Syst. 2014, 38, 45. [Google Scholar] [CrossRef]
- Miotto, R.; Wang, F.; Wang, S.; Jiang, X.; Dudley, J.T. Deep Learning for Healthcare: Review, Opportunities and Challenges. Brief. Bioinform. 2018, 19, 1236–1246. [Google Scholar] [CrossRef] [PubMed]
- Pandey, S.; Janghel, R. Recent Deep Learning Techniques, Challenges and Its Applications for Medical Healthcare System: A Review. Neural Process. Lett. 2019, 50, 1907–1935. [Google Scholar] [CrossRef]
- Muniasamy, A.; Tabassam, S.; Hussain, M.; Sultana, H.; Muniasamy, V.; Bhatnagar, R. Deep Learning for Predictive Analytics in Healthcare. In Advances in Intelligent Systems and Computing; Springer: Cham, Switzerland, 2019; pp. 32–42. [Google Scholar] [CrossRef]
- Smys, S. Survey on accuracy of predictive big data analytics in healthcare. J. Inf. Technol. Digit. World 2019, 01, 77–86. [Google Scholar] [CrossRef]
- Amin, P.; Anikireddypally, N.; Khurana, S.; Vadakkemadathil, S.; Wu, W. Personalized Health Monitoring Using Predictive Analytics. In Proceedings of the 2019 IEEE Fifth International Conference on Big Data Computing Service and Applications (BigDataService), Newark, CA, USA, 4–9 April 2019. [Google Scholar]
- Joseph, P.; Leong, D.; McKee, M.; Anand, S.S.; Schwalm, J.-D.; Teo, K.; Mente, A.; Yusuf, S. Reducing the Global Burden of Cardiovascular Disease, Part 1: The Epidemiology and Risk Factors: The Epidemiology and Risk Factors. Circ. Res. 2017, 121, 677–694. [Google Scholar] [CrossRef]
- Fuchs, F.D.; Whelton, P.K. High Blood Pressure and Cardiovascular Disease. Hypertension 2020, 75, 285–292. [Google Scholar] [CrossRef] [PubMed]
- Sapp, P.A.; Riley, T.M.; Tindall, A.M.; Sullivan, V.K.; Johnston, E.A.; Petersen, K.S.; Kris-Etherton, P.M. Nutrition and Atherosclerotic Cardiovascular Disease. In Present Knowledge in Nutrition; Elsevier: Amsterdam, The Netherlands, 2020; pp. 393–411. [Google Scholar]
- Cardiovascular Diseases. Available online: https://www.who.int/health-topics/cardiovascular-diseases#tab=tab_1 (accessed on 14 June 2022).
- Moreno-Ibarra, M.; Villuendas-Rey, Y.; Lytras, M.; Yáñez-Márquez, C.; Salgado-Ramírez, J. Classification of Diseases Using Machine Learning Algorithms: A Comparative Study. Mathematics 2021, 9, 1817. [Google Scholar] [CrossRef]
- Latha, C.; Jeeva, S. Improving the Accuracy of Prediction of Heart Disease Risk Based on Ensemble Classification Techniques. Inform. Med. Unlocked 2019, 16, 100203. [Google Scholar] [CrossRef]
- Long, N.; Meesad, P.; Unger, H. A Highly Accurate Firefly Based Algorithm for Heart Disease Prediction. Expert Syst. Appl. 2015, 42, 8221–8231. [Google Scholar] [CrossRef]
- Mohan, S.; Thirumalai, C.; Srivastava, G. Effective Heart Disease Prediction Using Hybrid Machine Learning Techniques. IEEE Access 2019, 7, 81542–81554. [Google Scholar] [CrossRef]
- Samuel, O.W.; Asogbon, G.M.; Sangaiah, A.K.; Fang, P.; Li, G. An Integrated Decision Support System Based on ANN and Fuzzy_AHP for Heart Failure Risk Prediction. Expert Syst. Appl. 2017, 68, 163–172. [Google Scholar] [CrossRef]
- Ali, L.; Rahman, A.; Khan, A.; Zhou, M.; Javeed, A.; Khan, J.A. An Automated Diagnostic System for Heart Disease Prediction Based on χ2 Statistical Model and Optimally Configured Deep Neural Network. IEEE Access 2019, 7, 34938–34945. [Google Scholar] [CrossRef]
- Paul, A.K.; Shill, P.C.; Rabin, M.R.I.; Murase, K. Adaptive Weighted Fuzzy Rule-Based System for the Risk Level Assessment of Heart Disease. Appl. Intell. 2018, 48, 1739–1756. [Google Scholar] [CrossRef]
- Ahmed, H.; Younis, E.M.G.; Hendawi, A.; Ali, A.A. Heart Disease Identification from Patients’ Social Posts, Machine Learning Solution on Spark. Future Gener. Comput. Syst. 2020, 111, 714–722. [Google Scholar] [CrossRef]
- Kishore, A.H.N.; Jayanthi, V.E. Neuro-Fuzzy Based Medical Decision Support System for Coronary Artery Disease Diagnosis and Risk Level Prediction. J. Comput. Theor. Nanosci. 2018, 15, 1027–1037. [Google Scholar] [CrossRef]
- Dileep, P.; Rao, K.N.; Bodapati, P.; Gokuruboyina, S.; Peddi, R.; Grover, A.; Sheetal, A. An Automatic Heart Disease Prediction Using Cluster-Based Bi-Directional LSTM (C-BiLSTM) Algorithm. Neural Comput. Appl. 2022, 1–14. [Google Scholar] [CrossRef]
- Van Pham, H.; Son, L.H.; Tuan, L.M. A Proposal of Expert System Using Deep Learning Neural Networks and Fuzzy Rules for Diagnosing Heart Disease. In Frontiers in Intelligent Computing: Theory and Applications; Springer: Singapore, 2020; pp. 189–198. [Google Scholar] [CrossRef]
- Mehmood, A.; Iqbal, M.; Mehmood, Z.; Irtaza, A.; Nawaz, M.; Nazir, T.; Masood, M. Prediction of Heart Disease Using Deep Convolutional Neural Networks. Arab. J. Sci. Eng. 2021, 46, 3409–3422. [Google Scholar] [CrossRef]
- Jabeen, F.; Maqsood, M.; Ghazanfar, M.A.; Aadil, F.; Khan, S.; Khan, M.F.; Mehmood, I. An IoT Based Efficient Hybrid Recommender System for Cardiovascular Disease. Peer Peer Netw. Appl. 2019, 12, 1263–1276. [Google Scholar] [CrossRef]
- Muzammal, M.; Talat, R.; Sodhro, A.H.; Pirbhulal, S. A Multi-Sensor Data Fusion Enabled Ensemble Approach for Medical Data from Body Sensor Networks. Inf. Fusion 2020, 53, 155–164. [Google Scholar] [CrossRef]
- Khan, M.A. An IoT Framework for Heart Disease Prediction Based on MDCNN Classifier. IEEE Access 2020, 8, 34717–34727. [Google Scholar] [CrossRef]
- Ali, F.; El-Sappagh, S.; Islam, S.M.R.; Kwak, D.; Ali, A.; Imran, M.; Kwak, K.-S. A Smart Healthcare Monitoring System for Heart Disease Prediction Based on Ensemble Deep Learning and Feature Fusion. Inf. Fusion 2020, 63, 208–222. [Google Scholar] [CrossRef]
- Zhang, D.; Chen, Y.; Chen, Y.; Ye, S.; Cai, W.; Jiang, J.; Xu, Y.; Zheng, G.; Chen, M. Heart Disease Prediction Based on the Embedded Feature Selection Method and Deep Neural Network. J. Healthc. Eng. 2021, 2021, 6260022. [Google Scholar] [CrossRef]
- Shukla, S.; Hassan, M.F.; Khan, M.K.; Jung, L.T.; Awang, A. An Analytical Model to Minimize the Latency in Healthcare Internet-of-Things in Fog Computing Environment. PLoS ONE 2019, 14, e0224934. [Google Scholar] [CrossRef] [Green Version]
- Kim, Y.; Bang, H. Introduction to Kalman Filter and Its Applications. In Introduction and Implementations of the Kalman Filter; IntechOpen: London, UK, 2019. [Google Scholar]
- Park, S.; Gil, M.-S.; Im, H.; Moon, Y.-S. Measurement Noise Recommendation for Efficient Kalman Filtering over a Large Amount of Sensor Data. Sensors 2019, 19, 1168. [Google Scholar] [CrossRef] [Green Version]
- Czabanski, R.; Jezewski, M.; Leski, J. Introduction to Fuzzy Systems. In Theory and Applications of Ordered Fuzzy Numbers; Springer International Publishing: Cham, Switzerland, 2017; pp. 23–43. [Google Scholar]
- Yu, Y.; Si, X.; Hu, C.; Zhang, J. A Review of Recurrent Neural Networks: LSTM Cells and Network Architectures. Neural Comput. 2019, 31, 1235–1270. [Google Scholar] [CrossRef] [PubMed]
- Lipton, Z.C.; Kale, D.C.; Elkan, C.; Wetzel, R. Learning to Diagnose with LSTM Recurrent Neural Networks. arXiv 2015, arXiv:1511.03677. [Google Scholar]
- Hochreiter, S.; Schmidhuber, J. Long Short-Term Memory. Neural Comput. 1997, 9, 1735–1780. [Google Scholar] [CrossRef] [PubMed]
- Ramachandran, P.; Zoph, B.; Le, Q.V. Searching for Activation Functions. arXiv 2017, arXiv:1710.05941. [Google Scholar]
- UCI Machine Learning Repository. Uci.edu. Available online: http://archive.ics.uci.edu/ml (accessed on 14 June 2022).
- Srinivasan, K.; Sharma, A.; Ankur, A. Group Sparse Based Super-Resolution of Magnetic Resonance Images for Superior Lesion Diagnosis. In Proceedings of the 1st International Conference on Medical and Health Informatics, Taichung, Taiwan, 20–22 May 2017; ACM: New York, NY, USA, 2017. [Google Scholar]
- Mamdiwar, S.D.; Shakruwala, Z.; Chadha, U.; Srinivasan, K.; Chang, C.-Y. Recent Advances on IoT-Assisted Wearable Sensor Systems for Healthcare Monitoring. Biosensors 2021, 11, 372. [Google Scholar] [CrossRef]
- Srinivasan, K.; Gowthaman, T.; Nema, A. Application of Structural Group Sparsity Recovery Model for Brain MRI. In Tenth International Conference on Digital Image Processing (ICDIP 2018), Shanghai, China, 11–14 May 2018; Jiang, X., Hwang, J.-N., Eds.; SPIE: Bellingham, DC, USA, 2018. [Google Scholar]
- Jayalakshmi, M.; Garg, L.; Maharajan, K.; Jayakumar, K.; Srinivasan, K.; Kashif Bashir, A.; Ramesh, K. Fuzzy Logic-Based Health Monitoring System for COVID’19 Patients. Comput. Mater. Contin. 2021, 67, 2431–2447. [Google Scholar] [CrossRef]
- Ahsan, M.M.; Siddique, Z. Machine Learning-Based Heart Disease Diagnosis: A Systematic Literature Review. Artif. Intell. Med. 2022, 128, 102289. [Google Scholar] [CrossRef] [PubMed]
- Bhattacharya, D.; Sharma, D.; Kim, W.; Ijaz, M.F.; Singh, P.K. Ensem-HAR: An Ensemble Deep Learning Model for Smartphone Sensor-Based Human Activity Recognition for Measurement of Elderly Health Monitoring. Biosensors 2022, 12, 393. [Google Scholar] [CrossRef]
- Pradhan, N.R.; Singh, A.P.; Verma, S.; Kaur, N.; Roy, D.S.; Shafi, J.; Wozniak, M.; Ijaz, M.F. A Novel Blockchain-Based Healthcare System Design and Performance Benchmarking on a Multi-Hosted Testbed. Sensors 2022, 22, 3449. [Google Scholar] [CrossRef]
- Vulli, A.; Srinivasu, P.N.; Sashank, M.S.K.; Shafi, J.; Choi, J.; Ijaz, M.F. Fine-Tuned DenseNet-169 for Breast Cancer Metastasis Prediction Using FastAI and 1-Cycle Policy. Sensors 2022, 22, 2988. [Google Scholar] [CrossRef]
- Oyeleye, M.; Chen, T.; Titarenko, S.; Antoniou, G. A Predictive Analysis of Heart Rates Using Machine Learning Techniques. Int. J. Environ. Res. Public Health 2022, 19, 2417. [Google Scholar] [CrossRef]
| Publisher’s Note: MDPI stays neutral with regard to jurisdictional claims in published maps and institutional affiliations. |
© 2022 by the authors. Licensee MDPI, Basel, Switzerland. This article is an open access article distributed under the terms and conditions of the Creative Commons Attribution (CC BY) license (https://creativecommons.org/licenses/by/4.0/).


 ,
, 


