Article

Analysis of the Impact of Particulate Matter on Net Load and Behind-the-Meter PV Decoupling

1
Department of Electrical Engineering, Myongji University, Yongin 17046, Korea
2
Qualcomm Institute, University of California, San Diego, CA 92093, USA
*
Author to whom correspondence should be addressed.
Electronics 2022, 11(14), 2261; https://doi.org/10.3390/electronics11142261
Submission received: 16 June 2022 / Revised: 9 July 2022 / Accepted: 11 July 2022 / Published: 20 July 2022

Abstract

:
With the increasing penetration of the photovoltaic (PV) generator, uncertainty surrounding the power system has increased simultaneously. The uncertainty of PV generation output has an impact on the load demand forecast due to the presence of behind-the-meter (BtM) PV generation. As it is hard to assess the amount of BtM PV generation, the load demand pattern can be distorted depending on the solar irradiation level. In several literature works, the influence of the load demand pattern from BtM PV generation is modeled using environmental data sets such as the level of solar irradiation, temperature, and past load demand data. The particulate matter is a severe meteorological event in several countries that can reduce the level of solar irradiation on the surface. The accuracy of the forecast model for PV generation and load demand can be exacerbated if the impact of the particulate matter is not properly considered. In this paper, the impact of particulate matter to load demand patterns is analyzed for the power system with high penetration of BtM PV generation. Actual meteorological data are gathered for the analysis and correlations between parameters are built using Gaussian process regression.

1. Introduction

The increase in photovoltaic (PV) generators in the power system changes the load and generation pattern significantly. The power system operator needs to manage the increase in PV generation during the daytime by decreasing the generator output. PV generation relies on solar irradiation on the surface of the solar cell panel and solar irradiation is heavily influenced by the atmospheric condition, such as cloud cover (CL), moisture level, and particulate matter in the air. Particulate matter is defined as a mixture of solid particles and liquid droplets found in the air. Particulate matter is generally considered to be the particles that range in size from a few nanometers to tens of micrometers [1]. The source of particulate matter is pollutants emitted from power plants, industries, and automobiles. Once airborne, it can travel several hundred kilometers and can cover large areas. Due to industrialization and an increase in the number of automobiles in developing countries, the intensity of particulate matter kept increasing for the last decades, not only in the developing countries themselves, but also in the countries adjacent to the developing countries [2]. Wildfire and dust storms are other major sources of particulate matter, and the frequency of those events is increasing due to global warming [3].
PV generation is hard to predict and creates lots of noise compared to conventional generators. Due to the intermittency and uncertainty of PV generation, operation of the power system with a large PV generator requires a huge amount of reserve generators that leads to an increase in the total generation cost. Thus, grid operators use forecast information to decrease the required volume of reserve generators and reduce the generation cost. The accuracy of forecasting generation and load demand may have a critical impact on the operation cost and the stability of the power system with the large penetration level of renewable generators [4]. The prevalence of forecast errors is directly related to the amount of reserve required in the system [5].
Forecasting the uncertainty of PV generation is essential for the stable operation of the power system. PV generation is directly influenced by the solar irradiation on the surface. Thus, one can calculate the ideal solar irradiance on the surface by using the information on the rotation of the earth and its location in the orbit around the sun. There are differences between the calculation and the actual amount of solar irradiation on the surface due to several interference matters. Clouds in the atmosphere block the solar irradiation directly and significantly reduce the PV generation. Thus, cloud forecast is important for PV generation forecast. Dust and particulate matter are other factors that influence PV generation in several countries with low air quality. Dust and particulate matter reduce the efficiency of the PV module by reducing solar irradiation as they are attached on the surface or flown over the area of the PV module [6]. In [7,8], the authors show a clear correlation between particulate matter and solar irradiation. This implies that particulate matter can impact PV generation. Particulate matter also causes soiling loss on PV panels as it accumulates on solar panels over time [9]. Thus, the impact of particulate matter on PV generation needs to be analyzed in many aspects.
Load demand is another important factor for power system operation. Its behavior is dependent on human behavior and is influenced by various environmental parameters. The most critical factor that affects load demand is temperature since there is a substantial amount of electrical power demand used for air conditioning and heating. Power systems with high PV penetration experience a temporal reduction in their load demand during daytime due to the behind-the-meter (BtM) PV generators [10]. BtM PV can be identified indirectly through the change in load demand during the daytime. Several works addressed the issue of the distortion of load demand due to BtM PV generation. In [11], the author decoupled load demand and BtM PV generation to increase the accuracy of the load demand forecast. The author estimates the baseline load demand by training an artificial neural network (ANN) model with actual load demand data. In [12,13], baseline load demand is directly decoupled from the load demand pattern using a pair of load demand patterns that have significant solar irradiation differences.
There is a clear correlation between BtM PV generation and load demand. Hence, the intensity of particulate matter affects PV generation in several regions. However, there are no papers that illustrate the relationship between particulate matter and load demand as shown in Table 1. In this paper, the impact of the intensity of particulate matter on the accuracy of the load demand forecast is analyzed based on data collected by the meteorological station in Jeju Island. The contributions of this paper are as follows:
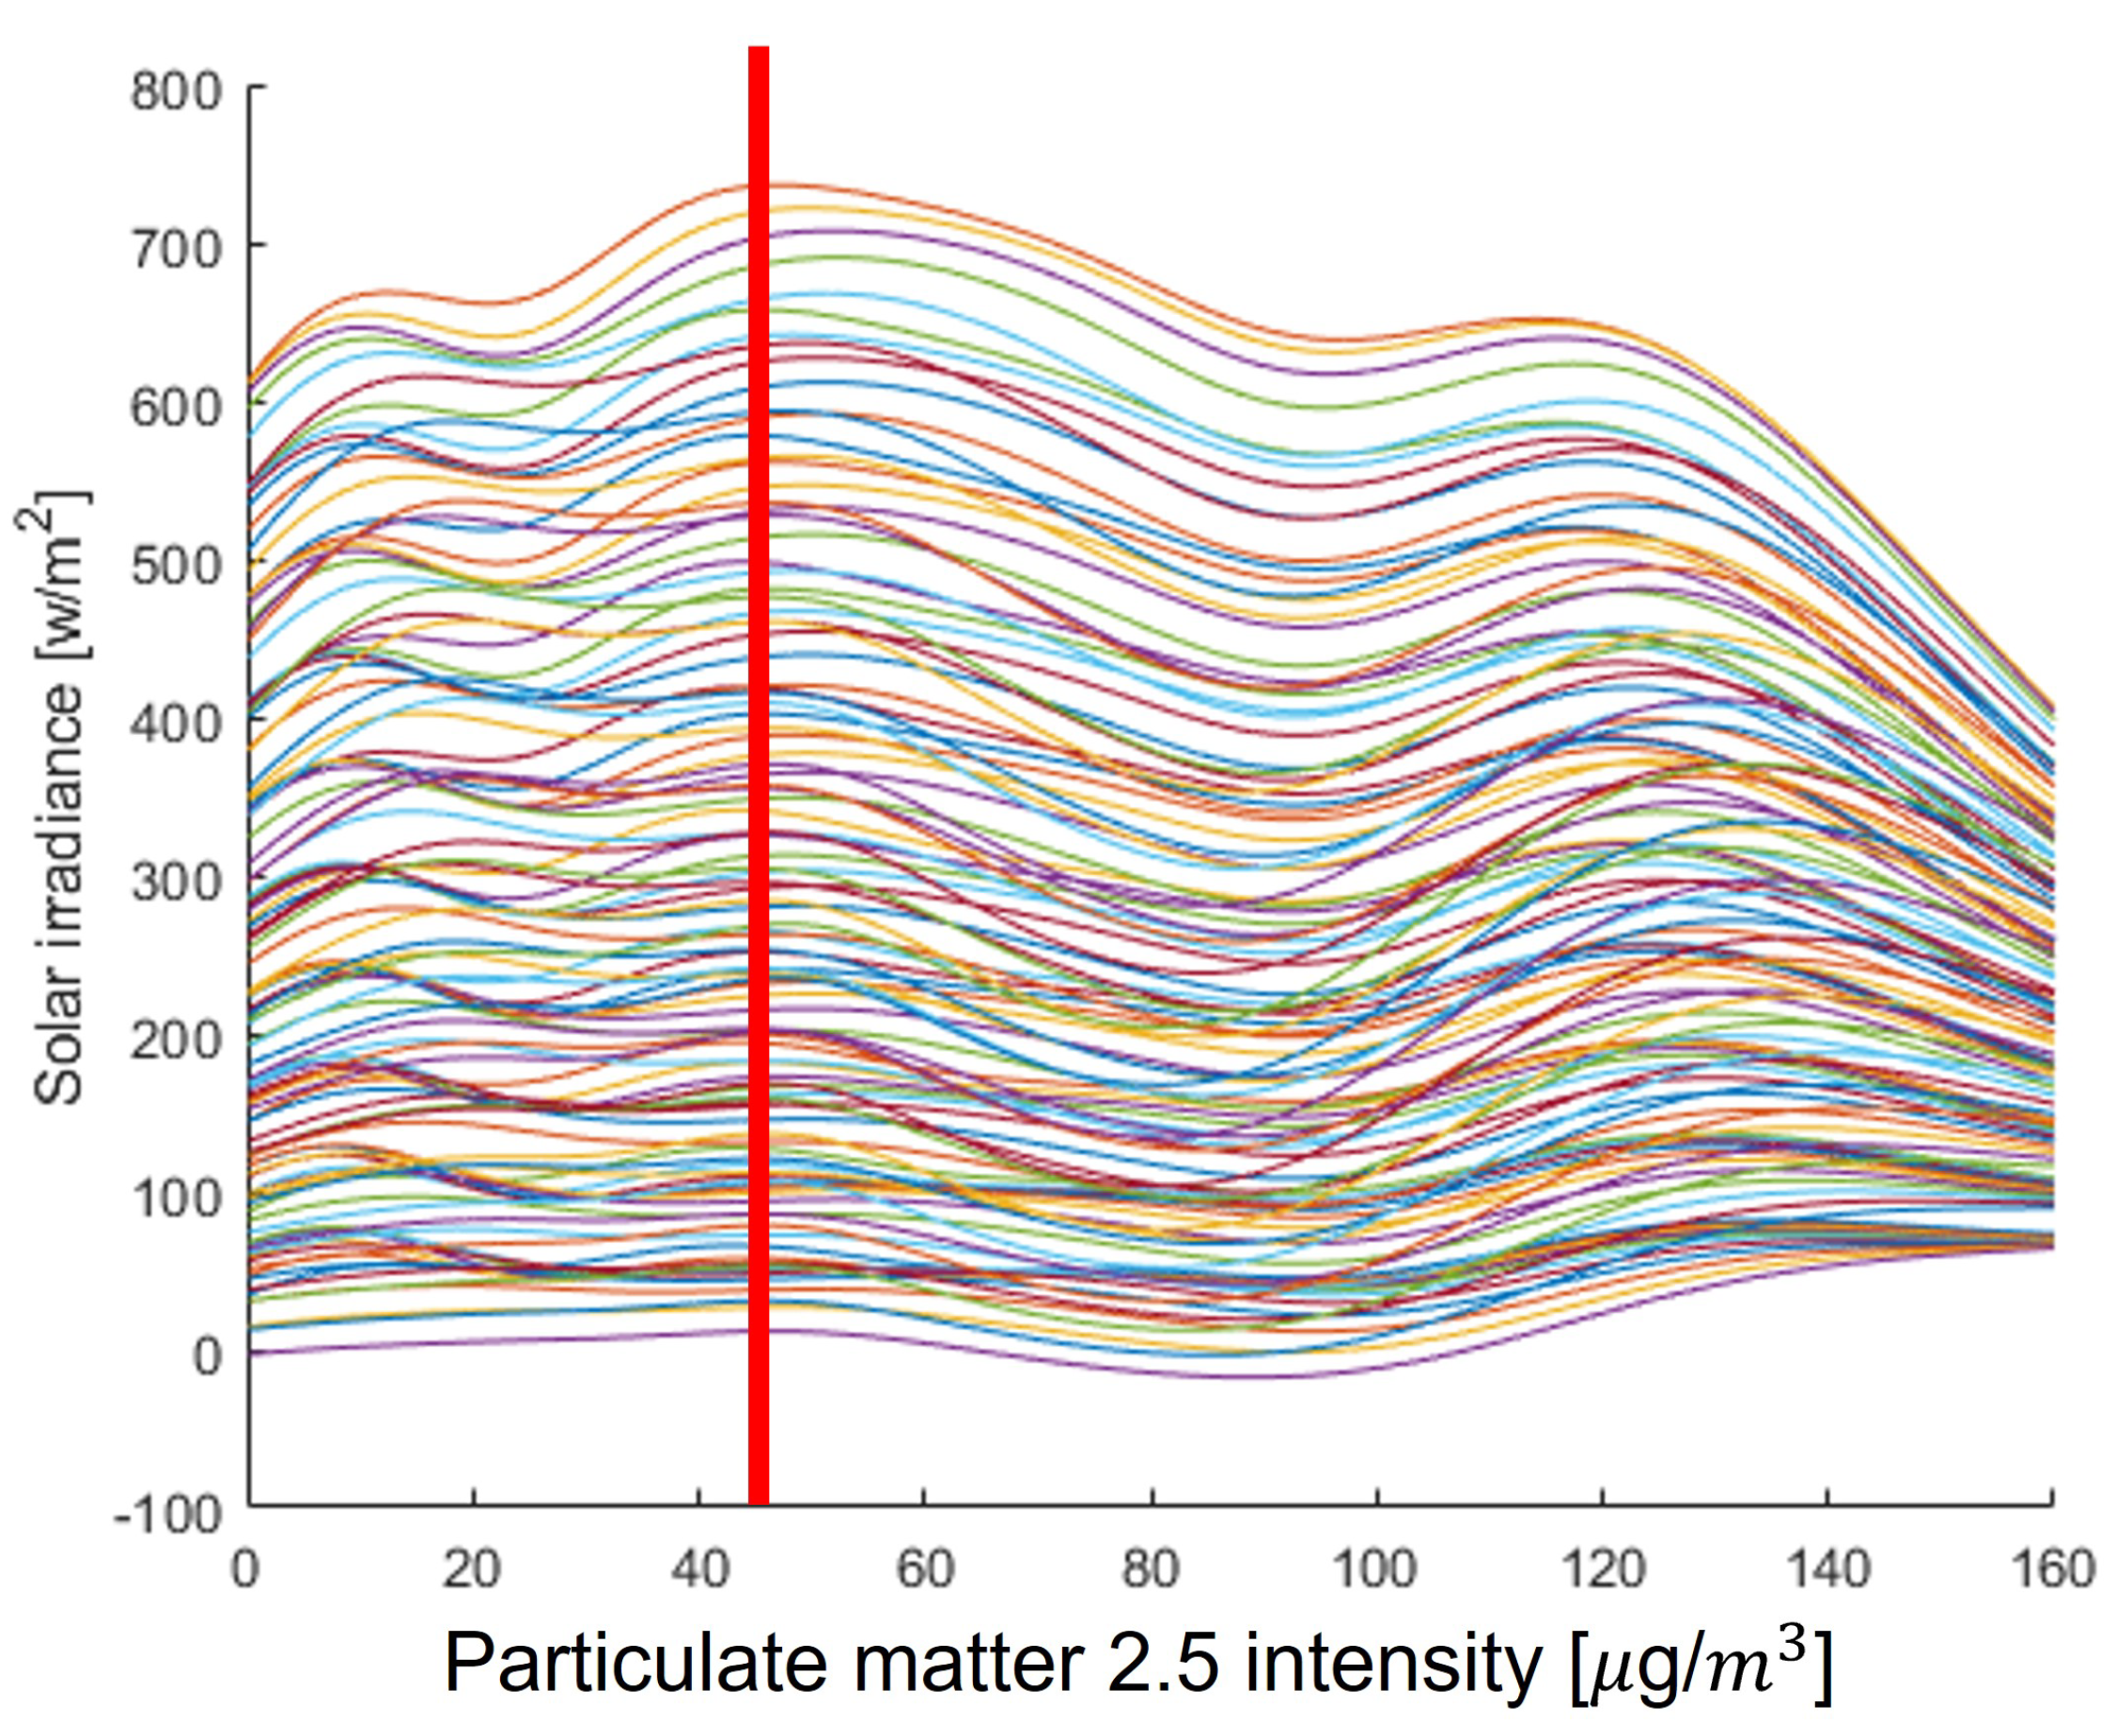
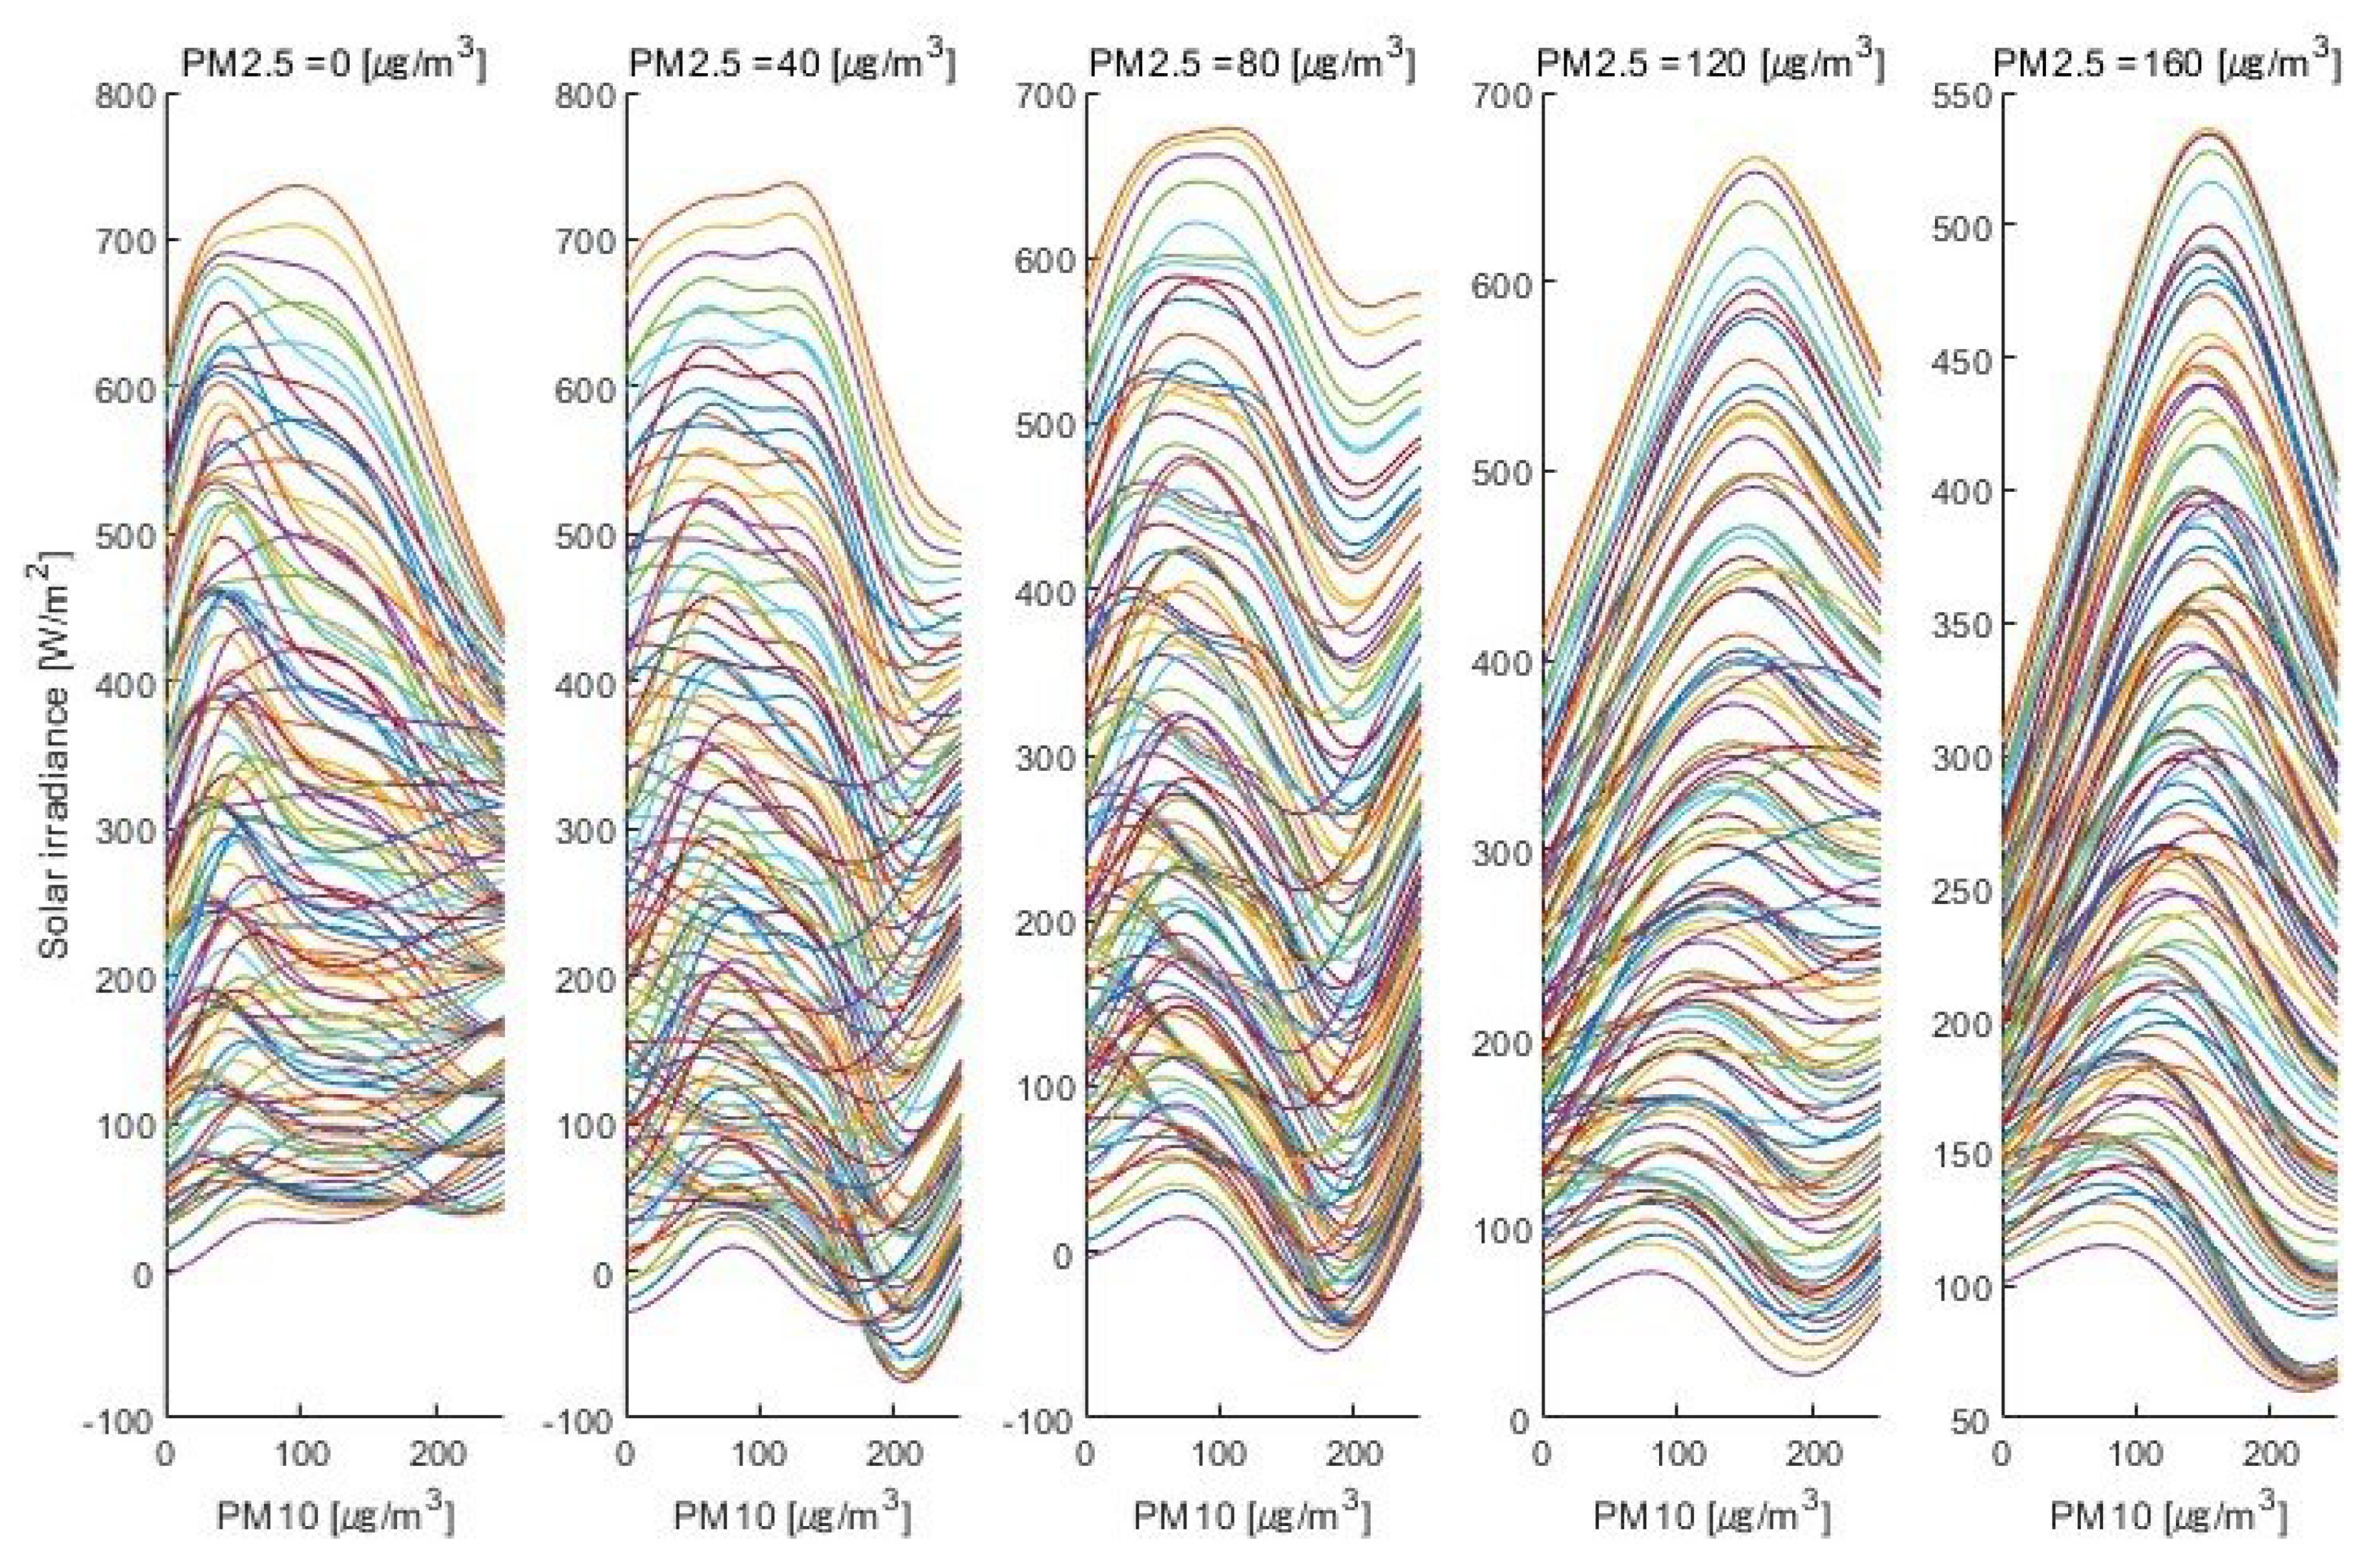
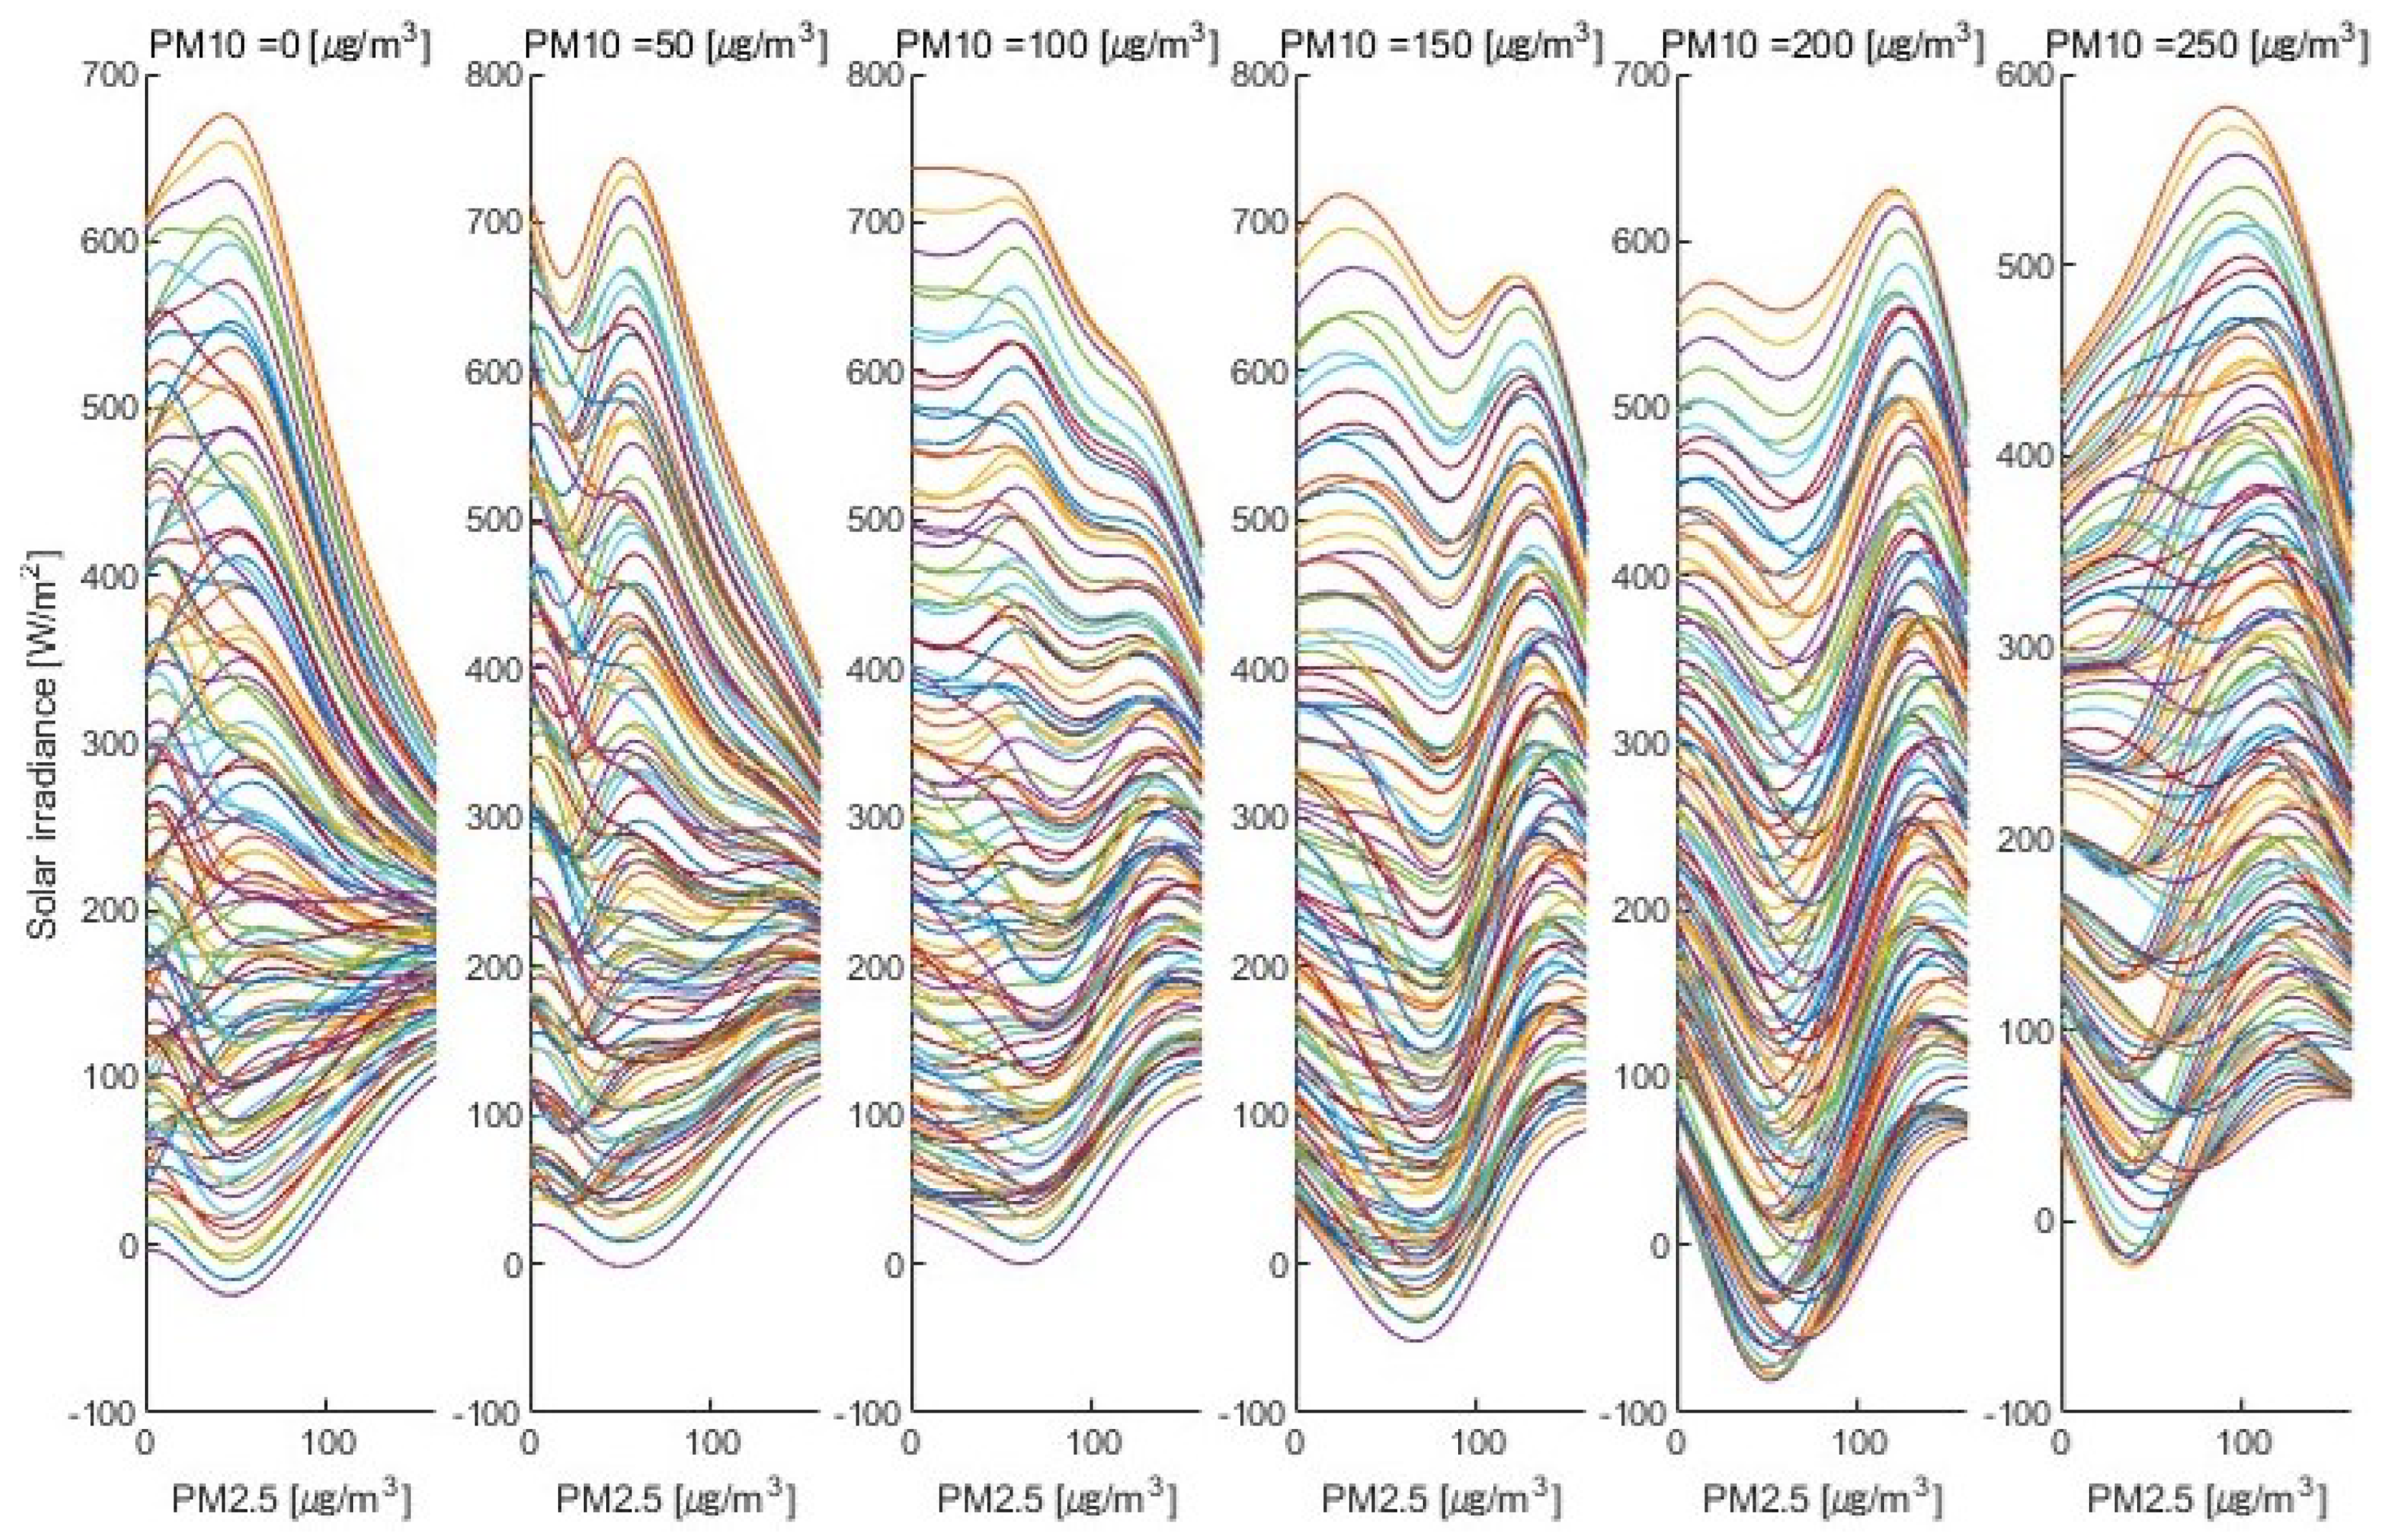
  • Analyze the impact of the intensity of particulate matter on the load demand and PV generation;
  • Build the PV forecast model considering the intensity of the particulate matter;
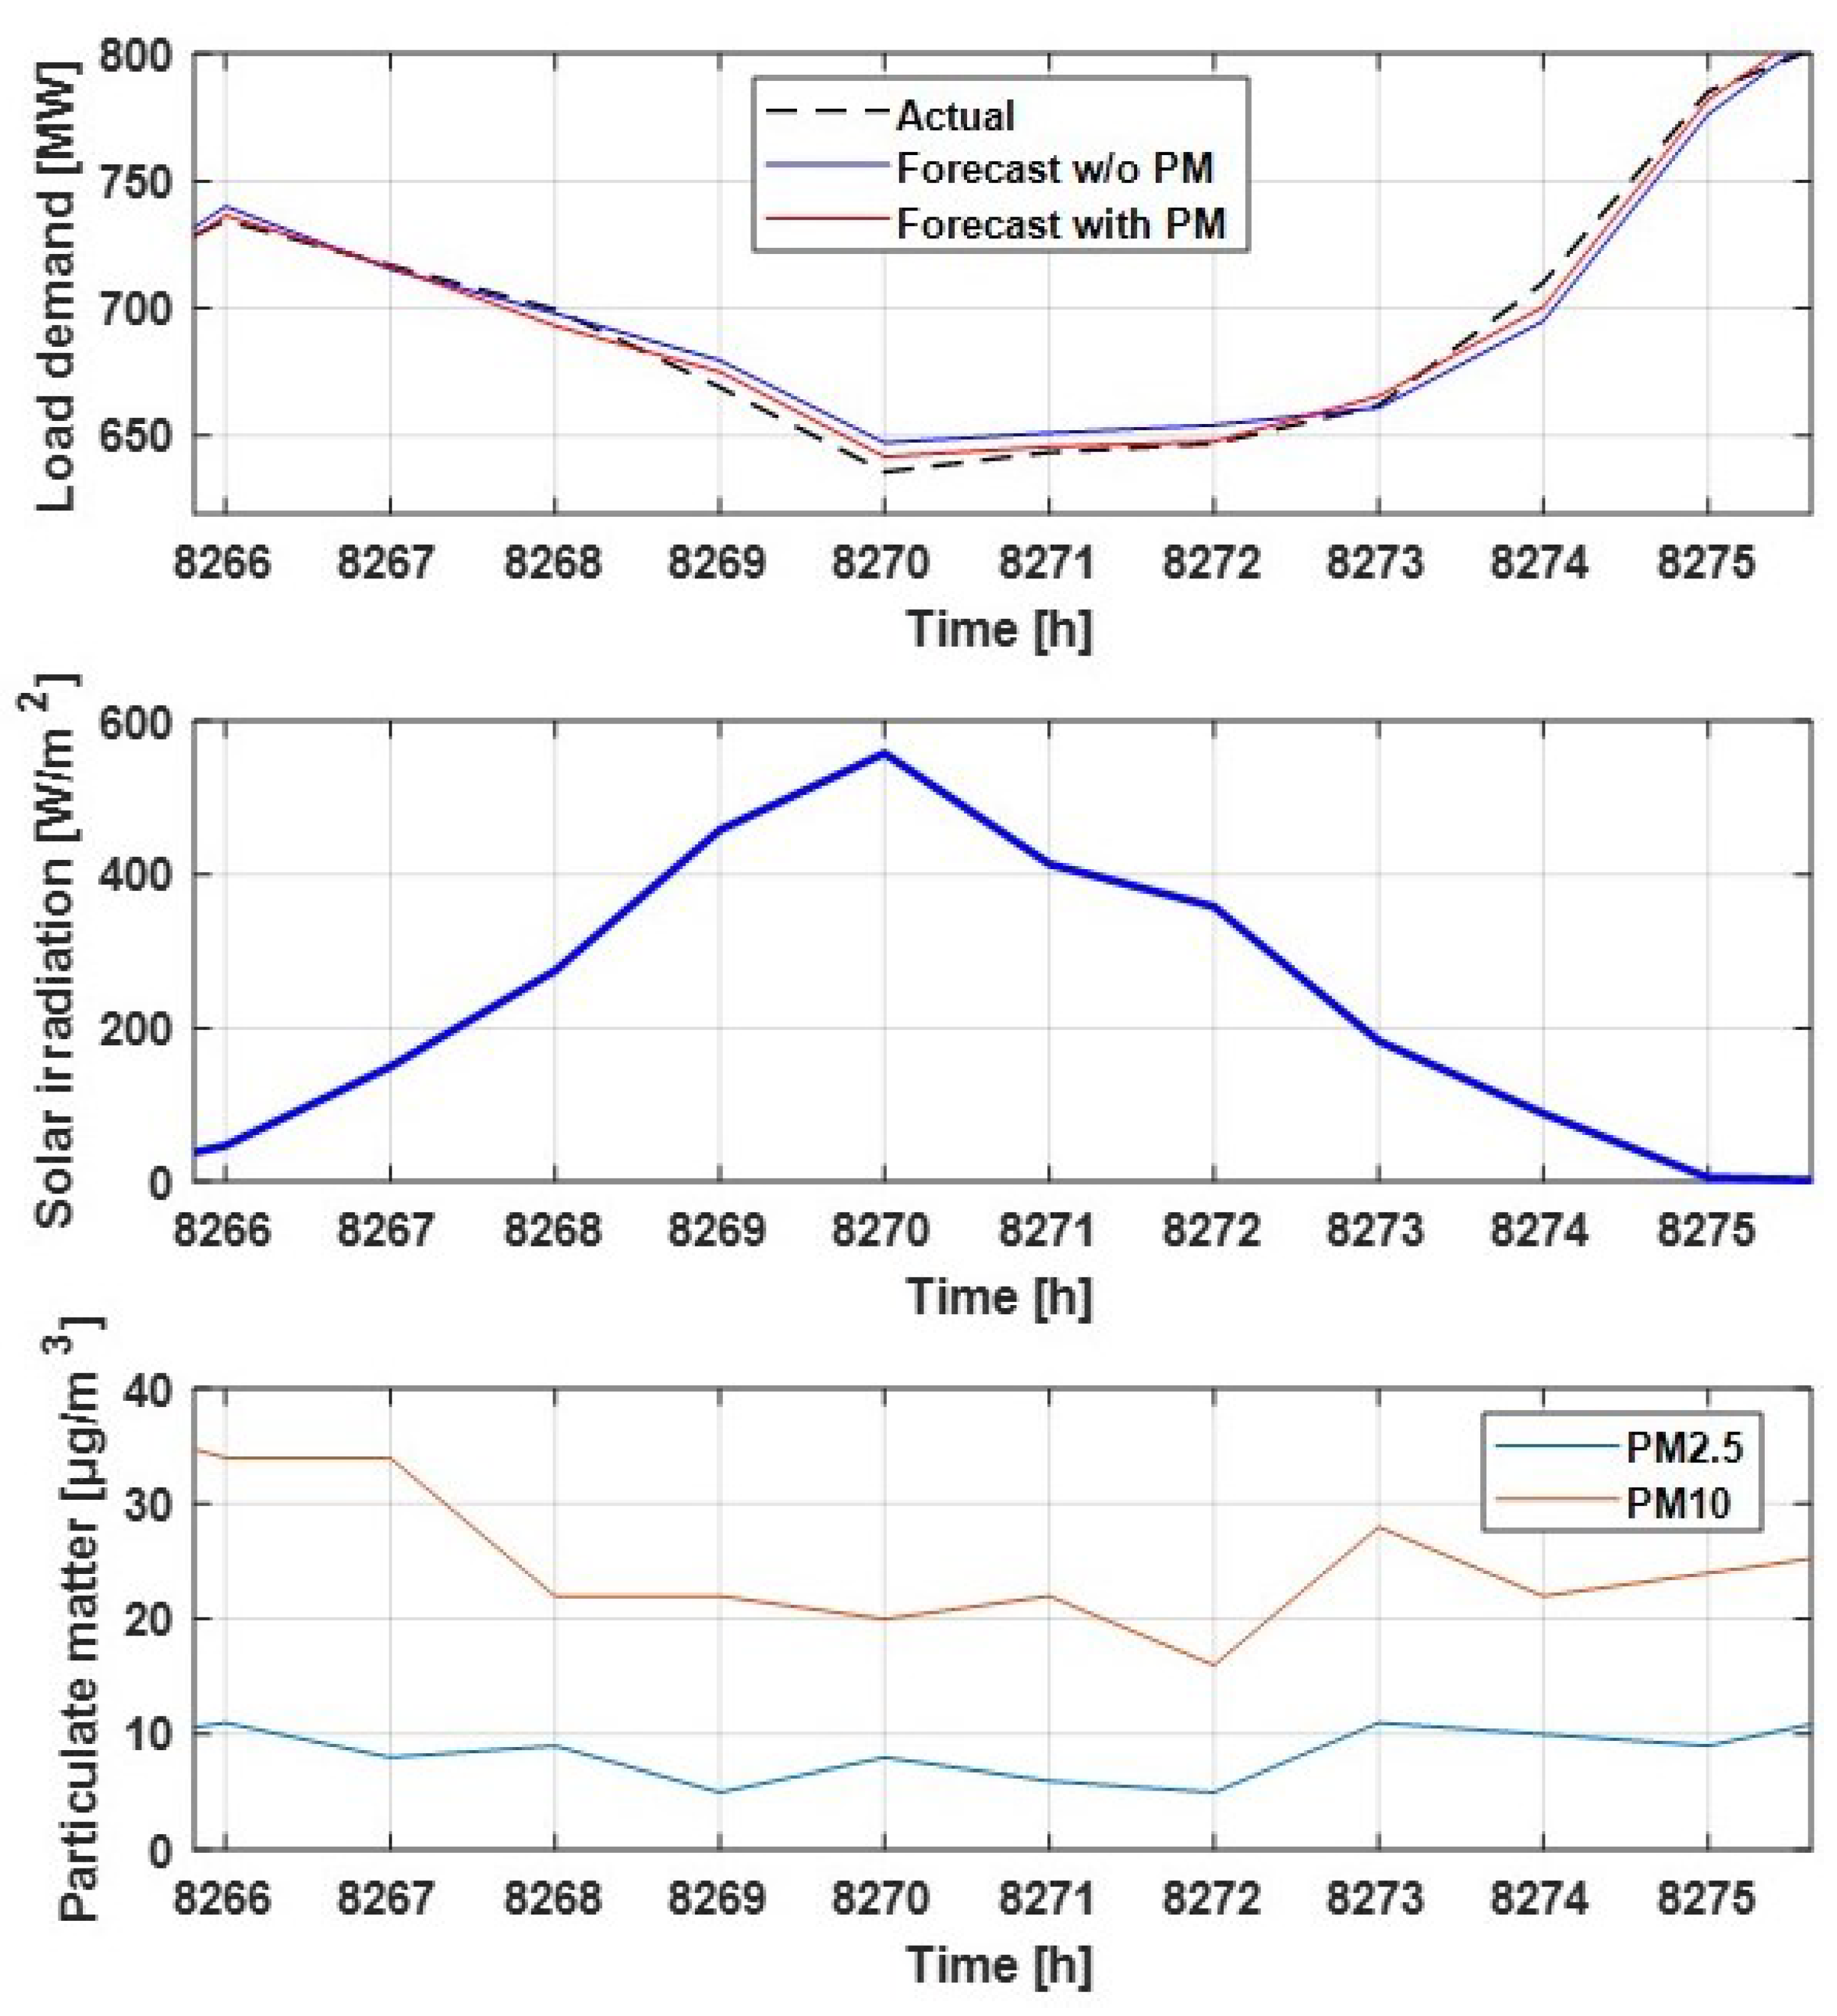
  • Build the load demand forecast model considering BtM PV generation.

2. Load Demand Forecast Considering BtM PV Generation and Particulate Matter

2.1. Load Demand Forecast with BtM PV Generation

Load pattern is relatively easy to predict as it shows similar patterns day by day. It continuously increases during the day and decreases during the night. A peak time is around 2 to 3 pm as most people use electricity. Thus, the future value of load demand can be estimated from the past load demand data collected from the day with similar conditions such as temperature or calendar date. These conditions are important parameters for load demand estimation.
There has been abundant literature surrounding load demand estimation. The auto-regressive integrated moving average (ARIMA) is a simple but accurate method to estimate the load demand’s time series model. Since load demand has a pattern in which the shape is repeated every 24 h, an ARIMA model with 24 lags can be used for the forecast. For more accurate estimation, several heuristic parameters are included in ARIMA models, such as meteorological values [14]. In [15], the author used customized parameters to reflect the variable change in heat and cooling load demand in terms of temperature.
Recent studies proposed machine learning-based non-linear models with several hidden layers for estimation. An artificial neural network (ANN) is a suitable model that can integrate multiple parameters for the load demand forecast [16]. There are more suitable machine learning models used to estimate consecutive inputs such as long- and short-term memory (LSTM) and the non-linear auto-regressive neural network (NAR) [17]. The NAR model works like linear time series models, such as ARIMA; however, it can reflect non-linear characteristics depending on the conditions of input parameters [18].
Load demand with a high level of BtM PV penetration has a distorted pattern depending on the level of solar irradiation. These phenomena influence the accuracy of the forecast model directly. Load demand can be reduced when the level of solar irradiation is high during the daytime due to the generation via BtM PV. Thus, the influence of BtM PV generation can be measured by comparing similar load demand patterns that have different solar irradiation levels. As shown in several literature studies [12], decoupling of BtM PV generation can increase the accuracy of the load demand forecast. As shown in [11], the ANN approach to time series prediction of load demand can model the non-linear influence of BtM PV generation on the load demand forecast without directly decoupling them from the original load demand pattern. Among several neural network approaches, NAR with exogenous (NARX) input models is often much better at learning long time dependencies than conventional recurrent neural networks [18]. The NARX model can be used to estimate load demand and solar generation patterns with additional parameters (exogeneous inputs), such as the intensity of particulate matters [19].
Thus, an accurate forecast on solar irradiation levels and a proper estimation of the capacity of the BtM PV generator can increase the accuracy of the load demand forecast. PV generation forecast starts with the solar irradiation level. The amount of PV generation can be calculated directly by the level of solar irradiation and temperature. Solar cell performance decreases with increasing temperature [20]. The temperature forecast requires huge amounts of data calculation in relation to the dynamic behavior of atmosphere. Numerical weather prediction (NWP) models are used to calculate and simulate the mechanisms of atmospheric dynamics all over the globe [21]. Although it has coarse grid resolution, minor errors on the forecast value of temperature have less impact on the accuracy of the PV generation forecast. The range of change in the solar irradiation level throughout the day is more extreme compared to those of the temperature.

2.2. Pv Forecast Considering Particulate Matter

The levels of solar irradiation can present a direct relationship with the movement of the sun. The relative movement of the sun and specific location on the surface of earth can be calculated theoretically. The extraterrestrial solar irradiation level refers to the amount of solar irradiation received at the outer atmosphere of the earth, calculated as [22]:
G 0 = G S C ( 1 + 0.033 cos 360 n 365 ) × ( cos ϕ cos ρ cos ω + sin ϕ sin ρ )
where G S C is the solar constant. n is the day of the year range 1 to 365. ϕ is the latitude of the given location. ω is the hour angle defined by local time (hour) and longitude as:
ω = ( t 12 ) × 15 + ( λ 120 )
where t is the local time and λ is the longitude. The solar declination ρ is the angle between the earth–sun line and the earth’s equatorial plane.
ρ = 23.45 sin 360 × 284 + n 365
The extraterrestrial solar equation can be calculated using Equations (1)–(3), a deterministic variable. Solar irradiation on the ground level can be reduced significantly by clouds. The level of thickness and the extent of the cloud can be categorized into 10 levels (0 is a clear sky and 10 is a fully covered cloudy sky). CL data and extraterrestrial solar irradiation levels can be combined to estimate the ground solar irradiation levels. ANN is a suitable model used to build non-linear relations between predictors and estimators. Particulate matter can be considered along with CL data. The impact of particulate matter on solar irradiation levels is significant when the sky is clear.
Figure 1 shows the NARX estimation model with several hidden layers for solar irradiation level estimation. For the model in Figure 1, the output value y ( t ) can be estimated using the past outputs y ( t 1 ) , y ( t 2 ) , , y ( t d y ) and the estimated values of exogenous observations x 1 ( t ) , x 2 ( t ) , , x n ( t ) are used as inputs. This model can be written in the form [18]:
y ( t ) = Φ { β 0 + h = 1 N β h Φ h [ γ h 0 + l = 1 n i l = 1 d u l γ i l h x l ( t i l h ) + j = 0 d y γ j h y ( t j ) ] }
where Φ is the logistic sigmoid activation function, β 0 is the bias value of output, and β h is the output layer weights. γ h 0 is the input bias and γ i l h , γ j h are weights of each input layers. d u l is the number of input lags for exogenous values and d y is the number of input lags for output values. There are 48 input lags and every data has an hourly time step. Several exogenous inputs can be used for better estimation; in this case, CL data, extraterrestrial solar irradiation levels, and particulate matter data are used. There are two types of particulate matter data based on the size of the particle. PM10 represents the intensity of particulate matter in cubic space ( m 3 ) and each particulate matter is smaller than 10 μ m, while PM2.5 represents particulate matter smaller than 2.5 μ m. The CL data can be categorized into upper and lower levels based on the height where the cloud is formed. The upper cloud data show the amount of CL in the area higher than 7000 m, while the lower cloud data are used for the CL below 7000 m. Thus, there are five exogenous inputs for the NARX model for solar irradiation estimation. The extraterrestrial solar irradiation is a deterministic variable and can be calculated for any given time and location. For the forecast of the solar irradiation level, forecast data of CL and extraterrestrial irradiation are required. In this paper, the forecast data from the global data assimilation and prediction system (GDAPS) are used for cloud and particulate matter data. GDAPS is based on the NWP model and is capable of predicting data up to 60 h in advance.

2.3. Load Demand Forecast Model

Load demand data with BtM PV generation have distorted patterns depending on the presence of solar irradiation during the day. The distortion can be identified by comparing the shape of the load demand pattern with different solar irradiation levels [12]. The amount of BtM generation can be directly decoupled from load demand data. The baseline load demand data have reduced distortion via BtM PV generation and forecast accuracy will increase when baseline data are used for prediction purposes. If the solar irradiation level is known, distortion via BtM PV generation can be reflected by non-linear models without extra steps to decouple baseline load demand data [13].
Figure 2 shows the overall data flow for the load demand forecast. For load demand forecast, 168 input delays are used to fully utilize the past data for a whole week. Load demand clearly reduced during weekends compared to the demand during weekdays. A single day of the week is used as a categorical variable in Figure 1 model. Temperature and humidity are important parameters for load demand forecast as they decide the level of heating and cooling load demand over the network. Solar irradiation data are also used as an input for the NARX forecast model to reflect distortion via BtM PV generation. After each NARX model is trained, it is transformed into a closed-loop model, as shown in Figure 1. The solar irradiation level is estimated using past irradiation data along with other exogenous inputs. The result of solar irradiation estimation is used as an input for load demand forecast. By using past load demand data and estimated values of temperature and humidity, load demand is estimated and the result more accurately reflects distortion via BtM PV generation.

3. Case Study

Based on the proposed forecast model, the impact of particulate matter on the accuracy of the load demand forecast is verified with data collected from the actual power system and meteorological station in Jeju Island, Korea. Figure 3 shows the temperature, humidity, CL, and load demand data collected from January 2019 to December 2021. Jeju Island has four specific types of weather conditions (spring, summer, fall, and winter) that are clearly different from season to season. Thus, temperature distribution is wide and load demand is also influenced by the change in season and weather conditions. In Figure 4, histograms of PM2.5 and PM10 data are depicted. Jeju Island is not the most severe region for particulate matter intensity, yet a high level of particulate matter can be recorded once in a while, especially during the spring and fall seasons.
Figure 5 shows the result of a linear regression between extraterrestrial solar irradiation and actual solar irradiation levels on the surface. A group of blue dots is recorded when particulate matter intensity was higher than 100 μ g / m 3 . A group of red dots appear when the particulate matter intensity is less than 30 μ g / m 3 . Both groups have a very low CL index. The red and blue line represents the result of the linear regression of each data. A reduction in solar irradiation can be found between two groups when similar extraterrestrial solar irradiation levels are given. It can also be found in Figure 5 that particulate matter has less impact as extraterrestrial irradiation increases. Furthermore, extraterrestrial solar irradiation is calculated based on the movement of the sun, and extraterrestrial solar irradiation is usually higher during the summer season. In Korea, particulate matter is frequent and strong during the spring and fall seasons; thus, a reduction in solar irradiation in light of particulate matter is more significant during these seasons.
In Figure 6, a more direct relationship between particulate matter and solar irradiation can be found using neural network regression analysis. In total, 26,280 h of data are used for training the Gaussian process regression (GPR) model for analysis. Figure 6 shows the change in the level of solar irradiation measured on the ground as the intensity of 2.5 particulate matter changes. Each line represents the case with a different combination of prediction variables, such as temperature, load demand, CL, and so on. Each lines are drawn by the GPR model. As shown in the graph, the solar irradiation level decreases as the intensity of particulate matter increases. Since the intensity of particulate matter rarely goes down below 20 μ g / m 3 , there is an ambiguous linear relation between solar irradiation and a low level of particulate matter data. There is an inverse proportional relationship between particulate matter intensity and solar irradiance when the intensity of particulate matter is larger than 45 μ g / m 3 (red vertical line in Figure 6). This non-linearity suggests that non-linear regression modeling is required, such as the NARX model that is used in this paper.
Detailed analysis based on changing the level of each particulate matter’s intensity is shown in Figure 7 and Figure 8. Figure 7 shows the change in the level of solar irradiation measured on the ground as the intensity of PM10 increases. Each line represents the case with a different combination of prediction variables, such as temperature, load demand, CL, and so on. Each graph in the figure has a different level of PM2.5 intensity. The panel on the leftmost site shows the result of regression analysis when the intensity of PM2.5 is 0, while the panel on the rightmost side shows the result when the intensity of PM2.5 is 160. Each of these results shows a decrease in solar irradiance as the intensity of particles increases. It should be noted that there is an inverse or ambiguous linear relationship between PM10 intensity and solar radiation when the particle intensity is low. It should be noted that there are reverse or ambiguous linear relations between PM10 intensity and solar irradiation when the particulate matter intensity is low. This region keeps widening when PM2.5 intensity increases. The correlation between the intensity of PM10 and PM2.5 was found to be very high, which indicates that there is a high chance of finding the high intensity of PM2.5 in the air if the high intensity of PM10 is measured. Thus, those ambiguous linear relations found in the graph rarely occur.
The result of the solar irradiation forecast is shown in the upper panel of Figure 9. The lower panel of the figure shows the record of particulate matter intensity measured at the same time. As seen from the graph, the forecast model without consideration of particulate matter intensity has slightly bigger values, while the actual solar irradiation was found to be slightly lower. The forecast model that uses particulate matter data has better accuracy than the model that does not use it.
In Figure 10, the result of the load demand forecast is shown in the uppermost panel. The panel in the middle of the figure shows the record of solar irradiation at the same time and the lowermost panel shows the record of particulate matter intensity. As shown in the first panel, the shape of the load demand forecast with particulate matter input is more closely located to the actual load demand data than the forecast without particulate matter input. The accuracy of each model is quantified as a mean square error (MSE), as shown in Table 2. The MSE value of the forecast model becomes smaller when the particulate matter is considered.

4. Discussion

The influence of particulate matter on solar irradiation can be identified throughout the analysis in this paper. It can be found easily by comparing the data set collected from the meteorological station. The presence of particulate matter affects the accuracy of the solar irradiation forecast or the PV generation forecast. Since the load demand affects by the solar irradiation level due to the presence of a BtM PV generator, the accuracy of the solar irradiation forecast inevitably affects the accuracy of the load demand forecast.
The influence of the intensity of particulate matter is considered in a recurrent neural network model with exogenous inputs. It has been shown that the neural network approach is appropriate to model the influence of particulate matter on PV generation. Several empirical studies have shown that the neural network approach for the estimation of load demand is suitable to model the influence of BtM PV generation without decoupling them from the original load demand pattern.
In the case study, the performance of the load demand forecast model was enhanced when a more accurate PV estimation model was used by considering the intensity of particulate matter. There was a limitation in this study as the high intensity of particulate matter is recorded in specific seasons (spring and fall). If the framework of the proposed analysis was confined to specific seasons and the analysis was conducted in place with higher intensity of particulate matter, the linear relationship between the particulate matter and load demand can be analyzed in detail.
As there was a clear correlation between the intensity of particulate matter and PV generation, further research should be conducted on the estimation of the stochastic forecast error in terms of the intensity of particulate matter. The results of the analysis in this paper also suggest that further studies are required for the power system with severe particulate matter problems.

Author Contributions

Conceptualization, Y.Y.; Methodology, Y.Y.; writing—original draft, Y.Y.; writing—review and editing, S.C.; supervision, S.C.; funding acquisition, Y.Y.; All authors have read and agreed to the published version of the manuscript.

Funding

This work was supported by 2022 Research Fund of Myongji University.

Conflicts of Interest

The authors declare no conflict of interest.

References

  1. Steinfeld, J.I. Atmospheric chemistry and physics: From air pollution to climate change. Environ. Sci. Policy Sustain. Dev. 1998, 40, 26. [Google Scholar] [CrossRef]
  2. Kim, H.C.; Kim, S.; Kim, B.U.; Jin, C.S.; Hong, S.; Park, R.; Son, S.W.; Bae, C.; Bae, M.; Song, C.K.; et al. Recent increase of surface particulate matter concentrations in the Seoul Metropolitan Area, Korea. Sci. Rep. 2017, 7, 4710. [Google Scholar] [CrossRef] [PubMed] [Green Version]
  3. Westerling, A.L.; Hidalgo, H.G.; Cayan, D.R.; Swetnam, T.W. Warming and earlier spring increase western US forest wildfire activity. Science 2006, 313, 940–943. [Google Scholar] [CrossRef] [PubMed] [Green Version]
  4. Chen, Y.; Deng, C.; Yao, W.; Liang, N.; Xia, P.; Cao, P.; Dong, Y.; Zhang, Y.A.; Liu, Z.; Li, D.; et al. Impacts of stochastic forecast errors of renewable energy generation and load demands on microgrid operation. Renew. Energy 2019, 133, 442–461. [Google Scholar] [CrossRef]
  5. Zhang, N.; Kang, C.; Xia, Q.; Liang, J. Modeling conditional forecast error for wind power in generation scheduling. IEEE Trans. Power Syst. 2013, 29, 1316–1324. [Google Scholar] [CrossRef]
  6. Said, S.A.; Walwil, H.M. Fundamental studies on dust fouling effects on PV module performance. Sol. Energy 2014, 107, 328–337. [Google Scholar] [CrossRef]
  7. Son, J.; Jeong, S.; Park, H.; Park, C.E. The effect of particulate matter on solar photovoltaic power generation over the Republic of Korea. Environ. Res. Lett. 2020, 15, 084004. [Google Scholar] [CrossRef]
  8. Dogan, T.R.; Beşli, N.; Aktacir, M.A.; Dinç, M.N.; İlkhan, M.A.; Öztürk, F.; Yıldız, M. Seasonal effects of atmospheric particulate matter on performance of different types of photovoltaic modules in sanliurfa, Turkey. Atmos. Pollut. Res. 2020, 11, 2173–2181. [Google Scholar] [CrossRef]
  9. Micheli, L.; Muller, M.; Kurtz, S. Determining the effects of environment and atmospheric parameters on PV field performance. In Proceedings of the 2016 IEEE 43rd Photovoltaic Specialists Conference (PVSC), Portland, OR, USA, 5–10 June 2016; pp. 1724–1729. [Google Scholar]
  10. Haque, M.M.; Wolfs, P. A review of high PV penetrations in LV distribution networks: Present status, impacts and mitigation measures. Renew. Sustain. Energy Rev. 2016, 62, 1195–1208. [Google Scholar] [CrossRef]
  11. Wang, Y.; Zhang, N.; Chen, Q.; Kirschen, D.S.; Li, P.; Xia, Q. Data-driven probabilistic net load forecasting with high penetration of behind-the-meter PV. IEEE Trans. Power Syst. 2017, 33, 3255–3264. [Google Scholar] [CrossRef]
  12. Li, K.; Wang, F.; Mi, Z.; Fotuhi-Firuzabad, M.; Duić, N.; Wang, T. Capacity and output power estimation approach of individual behind-the-meter distributed photovoltaic system for demand response baseline estimation. Appl. Energy 2019, 253, 113595. [Google Scholar] [CrossRef]
  13. Xuan, Z.; Gao, X.; Li, K.; Wang, F.; Ge, X.; Hou, Y. PV-load decoupling based demand response baseline load estimation approach for residential customer with distributed PV system. IEEE Trans. Ind. Appl. 2020, 56, 6128–6137. [Google Scholar] [CrossRef]
  14. Vagropoulos, S.I.; Chouliaras, G.; Kardakos, E.G.; Simoglou, C.K.; Bakirtzis, A.G. Comparison of SARIMAX, SARIMA, modified SARIMA and ANN-based models for short-term PV generation forecasting. In Proceedings of the 2016 IEEE International Energy Conference (ENERGYCON), Leuven, Belgium, 4–8 April 2016; pp. 1–6. [Google Scholar]
  15. Espinoza, M.; Joye, C.; Belmans, R.; De Moor, B. Short-term load forecasting, profile identification, and customer segmentation: A methodology based on periodic time series. IEEE Trans. Power Syst. 2005, 20, 1622–1630. [Google Scholar] [CrossRef]
  16. Cai, M.; Pipattanasomporn, M.; Rahman, S. Day-ahead building-level load forecasts using deep learning vs. traditional time-series techniques. Appl. Energy 2019, 236, 1078–1088. [Google Scholar] [CrossRef]
  17. Tian, C.; Ma, J.; Zhang, C.; Zhan, P. A deep neural network model for short-term load forecast based on long short-term memory network and convolutional neural network. Energies 2018, 11, 3493. [Google Scholar] [CrossRef] [Green Version]
  18. Diaconescu, E. The use of NARX neural networks to predict chaotic time series. Wseas Trans. Comput. Res. 2008, 3, 182–191. [Google Scholar]
  19. Abbas, F.; Feng, D.; Habib, S.; Rahman, U.; Rasool, A.; Yan, Z. Short term residential load forecasting: An improved optimal nonlinear auto regressive (NARX) method with exponential weight decay function. Electronics 2018, 7, 432. [Google Scholar] [CrossRef] [Green Version]
  20. Dubey, S.; Sarvaiya, J.N.; Seshadri, B. Temperature dependent photovoltaic (PV) efficiency and its effect on PV production in the world—A review. Energy Procedia 2013, 33, 311–321. [Google Scholar] [CrossRef] [Green Version]
  21. Cho, D.; Yoo, C.; Im, J.; Cha, D.H. Comparative assessment of various machine learning-based bias correction methods for numerical weather prediction model forecasts of extreme air temperatures in urban areas. Earth Space Sci. 2020, 7, e2019EA000740. [Google Scholar] [CrossRef] [Green Version]
  22. Lilienthal, P.; Lambert, T.; Gilman, P. Computer modeling of renewable power systems. In Encyclopedia of Energy; Elsevier: Amsterdam, The Netherlands, 2004. [Google Scholar]
Figure 1. Non-linear auto-regressive neural network model for solar irradiation and load demand forecast.
Electronics 11 02261 g001
Figure 2. Load demand forecast considering BtM PV generation and particulate matter impact.
Electronics 11 02261 g002
Figure 3. Atmospheric data and load demand data collected from Jeju Island (January 2019–December 2021).
Electronics 11 02261 g003
Figure 4. Histogram of PM2.5 and PM10 data collected from Jeju Island (January 2019–December 2021).
Electronics 11 02261 g004
Figure 5. Scatter plot of extraterrestrial solar irradiation to actual solar irradiation in terms of the intensity of particulate matter.
Electronics 11 02261 g005
Figure 6. Neural network analysis on the influence of particulate matter to the level of solar irradiation measured on the ground.
Electronics 11 02261 g006
Figure 7. Neural network analysis on the influence of particulate matter (PM10) to the level of solar irradiation measured on the ground.
Electronics 11 02261 g007
Figure 8. Neural network analysis on the influence of particulate matter (PM2.5) to the level of solar irradiation measured on the ground.
Electronics 11 02261 g008
Figure 9. Comparison between the result of solar irradiation forecast with and without (w/o) considering particulate matter.
Electronics 11 02261 g009
Figure 10. Comparison between the results of the load demand forecast with and without (w/o) considering particulate matter.
Electronics 11 02261 g010
Table 1. Comparison of load demand forecast methods with BtM PV generation.
ObjectivesMethodContributions
Direct decoupling method [12]Estimate BtM PV capacitySupport vector regressionEstimation of the BtM PV capacity in analytical solution
Data-driven neural network [11]Forecast the baseline load demandANN with recurrent inputsNon-parametric prediction of baseline load demand
Neural network with PMForecast the baseline load demandANN with recurrent inputsNon-parametric prediction of baseline load demand considering PM intensity
Table 2. Accuracy of the load demand forecast of each model with and without considering particulate matter.
Forecast with PMForecast without PM
MSE2.07 × 10 3 2.3004 × 10 3
Publisher’s Note: MDPI stays neutral with regard to jurisdictional claims in published maps and institutional affiliations.

