Article

An Intelligent Breast Ultrasound System for Diagnosis and 3D Visualization

1
Department of Ultrasound, The Second Medical Center, Chinese PLA General Hospital, Beijing 100853, China
2
Medical Big Data Research Center, Chinese PLA General Hospital, Beijing 100853, China
3
School of Computer and Communication Engineering, University of Science and Technology Beijing, Beijing 100083, China
4
Shunde Graduate School, University of Science and Technology Beijing, Foshan 100024, China
*
Authors to whom correspondence should be addressed.
These authors contributed equally to this work.
Electronics 2022, 11(14), 2116; https://doi.org/10.3390/electronics11142116
Submission received: 10 June 2022 / Revised: 25 June 2022 / Accepted: 27 June 2022 / Published: 6 July 2022

Abstract

:
Background: Ultrasonography is the main examination method for breast diseases. Ultrasound imaging is currently relied upon by doctors to form statements of characteristics and locations of lesions, which severely limits the completeness and effectiveness of ultrasound image information. Moreover, analyzing ultrasonography requires experienced ultrasound doctors, which are not common in hospitals. Thus, this work proposes a 3D-based breast ultrasound system, which can automatically diagnose ultrasound images of the breasts and generate a representative 3D breast lesion model through typical ultrasonography. Methods: In this system, we use a weighted ensemble method to combine three different neural networks and explore different combinations of the neural networks. On this basis, a breast locator was designed to measure and transform the spatial position of lesions. The breast ultrasound software generates a 3D visualization report through the selection and geometric transformation of the nodular model. Results: The ensemble neural network improved in all metrics compared with the classical neural network (DenseNet, AlexNet, GoogLeNet, etc.). It proved that the ensemble neural network proposed in this work can be used for intelligent diagnosis of breast ultrasound images. For 3D visualization, magnetic resonance imaging (MRI) scans were performed to achieve their 3D reconstructions. By comparing two types of visualized results (MRI and our 3D model), we determined that models generated by the 3D-based breast ultrasound system have similar nodule characteristics and spatial relationships with the MRI. Conclusions: In summary, this system implements automatic diagnosis of ultrasound images and presents lesions through 3D models, which can obtain complete and accurate ultrasound image information. Thus, it has clinical potential.

1. Introduction

As female sex organs, breasts have both internal function and external beauty, which are pivotal to women [1,2,3,4,5]. Usually, breasts are continuously undergoing developmental changes, and the structure of their glands is complex. Thus, treatment of breast nodules is always confusing for doctors [6,7,8]. At present, doctors mainly rely on the observation of breast images to find the developmental law of lesions. This can not only correctly recognize diseases and treat them reasonably, but also improve the understanding of breast nodule growth.
Ultrasonography has the characteristics of a real-time observation, low cost and high diagnostic level, and it has become the most important method of breast examination [9,10,11,12,13]. Hospitals generate many ultrasound images of the breast every day, which requires experienced ultrasound doctors to analyze the ultrasound images. However, most breast ultrasound images are tumor-free, so ultrasound doctors spend a lot of time every day analyzing tumor-free ultrasound images, which is a waste of ultrasound doctor resources. At the same time, the ultrasound image results of tumor patients mainly depend on the doctor’s statement of the image characteristics, which depends largely on the doctor’s professional level and expression ability. In addition, the subjective will of the patient is often the main factor in determining the treatment plan. Therefore, how to diagnose ultrasound images efficiently and quickly, and how to more accurately express the lesion structure, are urgent problems to be solved. It is of great scientific significance for patients to understand the results of breast ultrasound and explore the potential for breast disease [14] more intuitively.
Researchers have proposed several medical image nodule diagnosis algorithms based on convolutional neural networks, such as DenseNet [15], GoogLeNet [16], and ResNet [17] used in this paper. Due to the low resolution of the breast ultrasound image and the diversity of shape and texture features of lesions, a single network model is not generally effective for benign and malignant diagnosis of lesions, and has the disadvantage of poor generalization.
In addition, 3D models of breasts obtained by reconstruction allow patients to have more intuitive understanding and communication with doctors. The current methods for obtaining 3D breast structure include computed tomography (CT) and MRI imaging. Due to space limitations of the scanning machine, patients can only adopt a lying-down position when acquiring CT and MRI, which is different from the reclining posture on the operating table, resulting in greater deformation of the breast. Therefore, reconstructed 3D models cannot correctly realize surgical navigation. Although there are already some methods that enable doctors to collect 3D ultrasound data of patients, they require cumbersome positioning and take a long time [18].
In this work, we proposed a breast ultrasound system, which can simultaneously diagnose and visualize breast ultrasound nodules. The remainder of this paper is organized as follows: In Section 2, we introduce the method of neural network ensemble and 3D breast model generation. In Section 3, the experimental results and discussion of the ensemble network and 3D breast nodule model are presented. Section 4 provides a conclusion about the investigated methods, challenges, and future directions for the employment of the system in clinical applications.

2. Methods

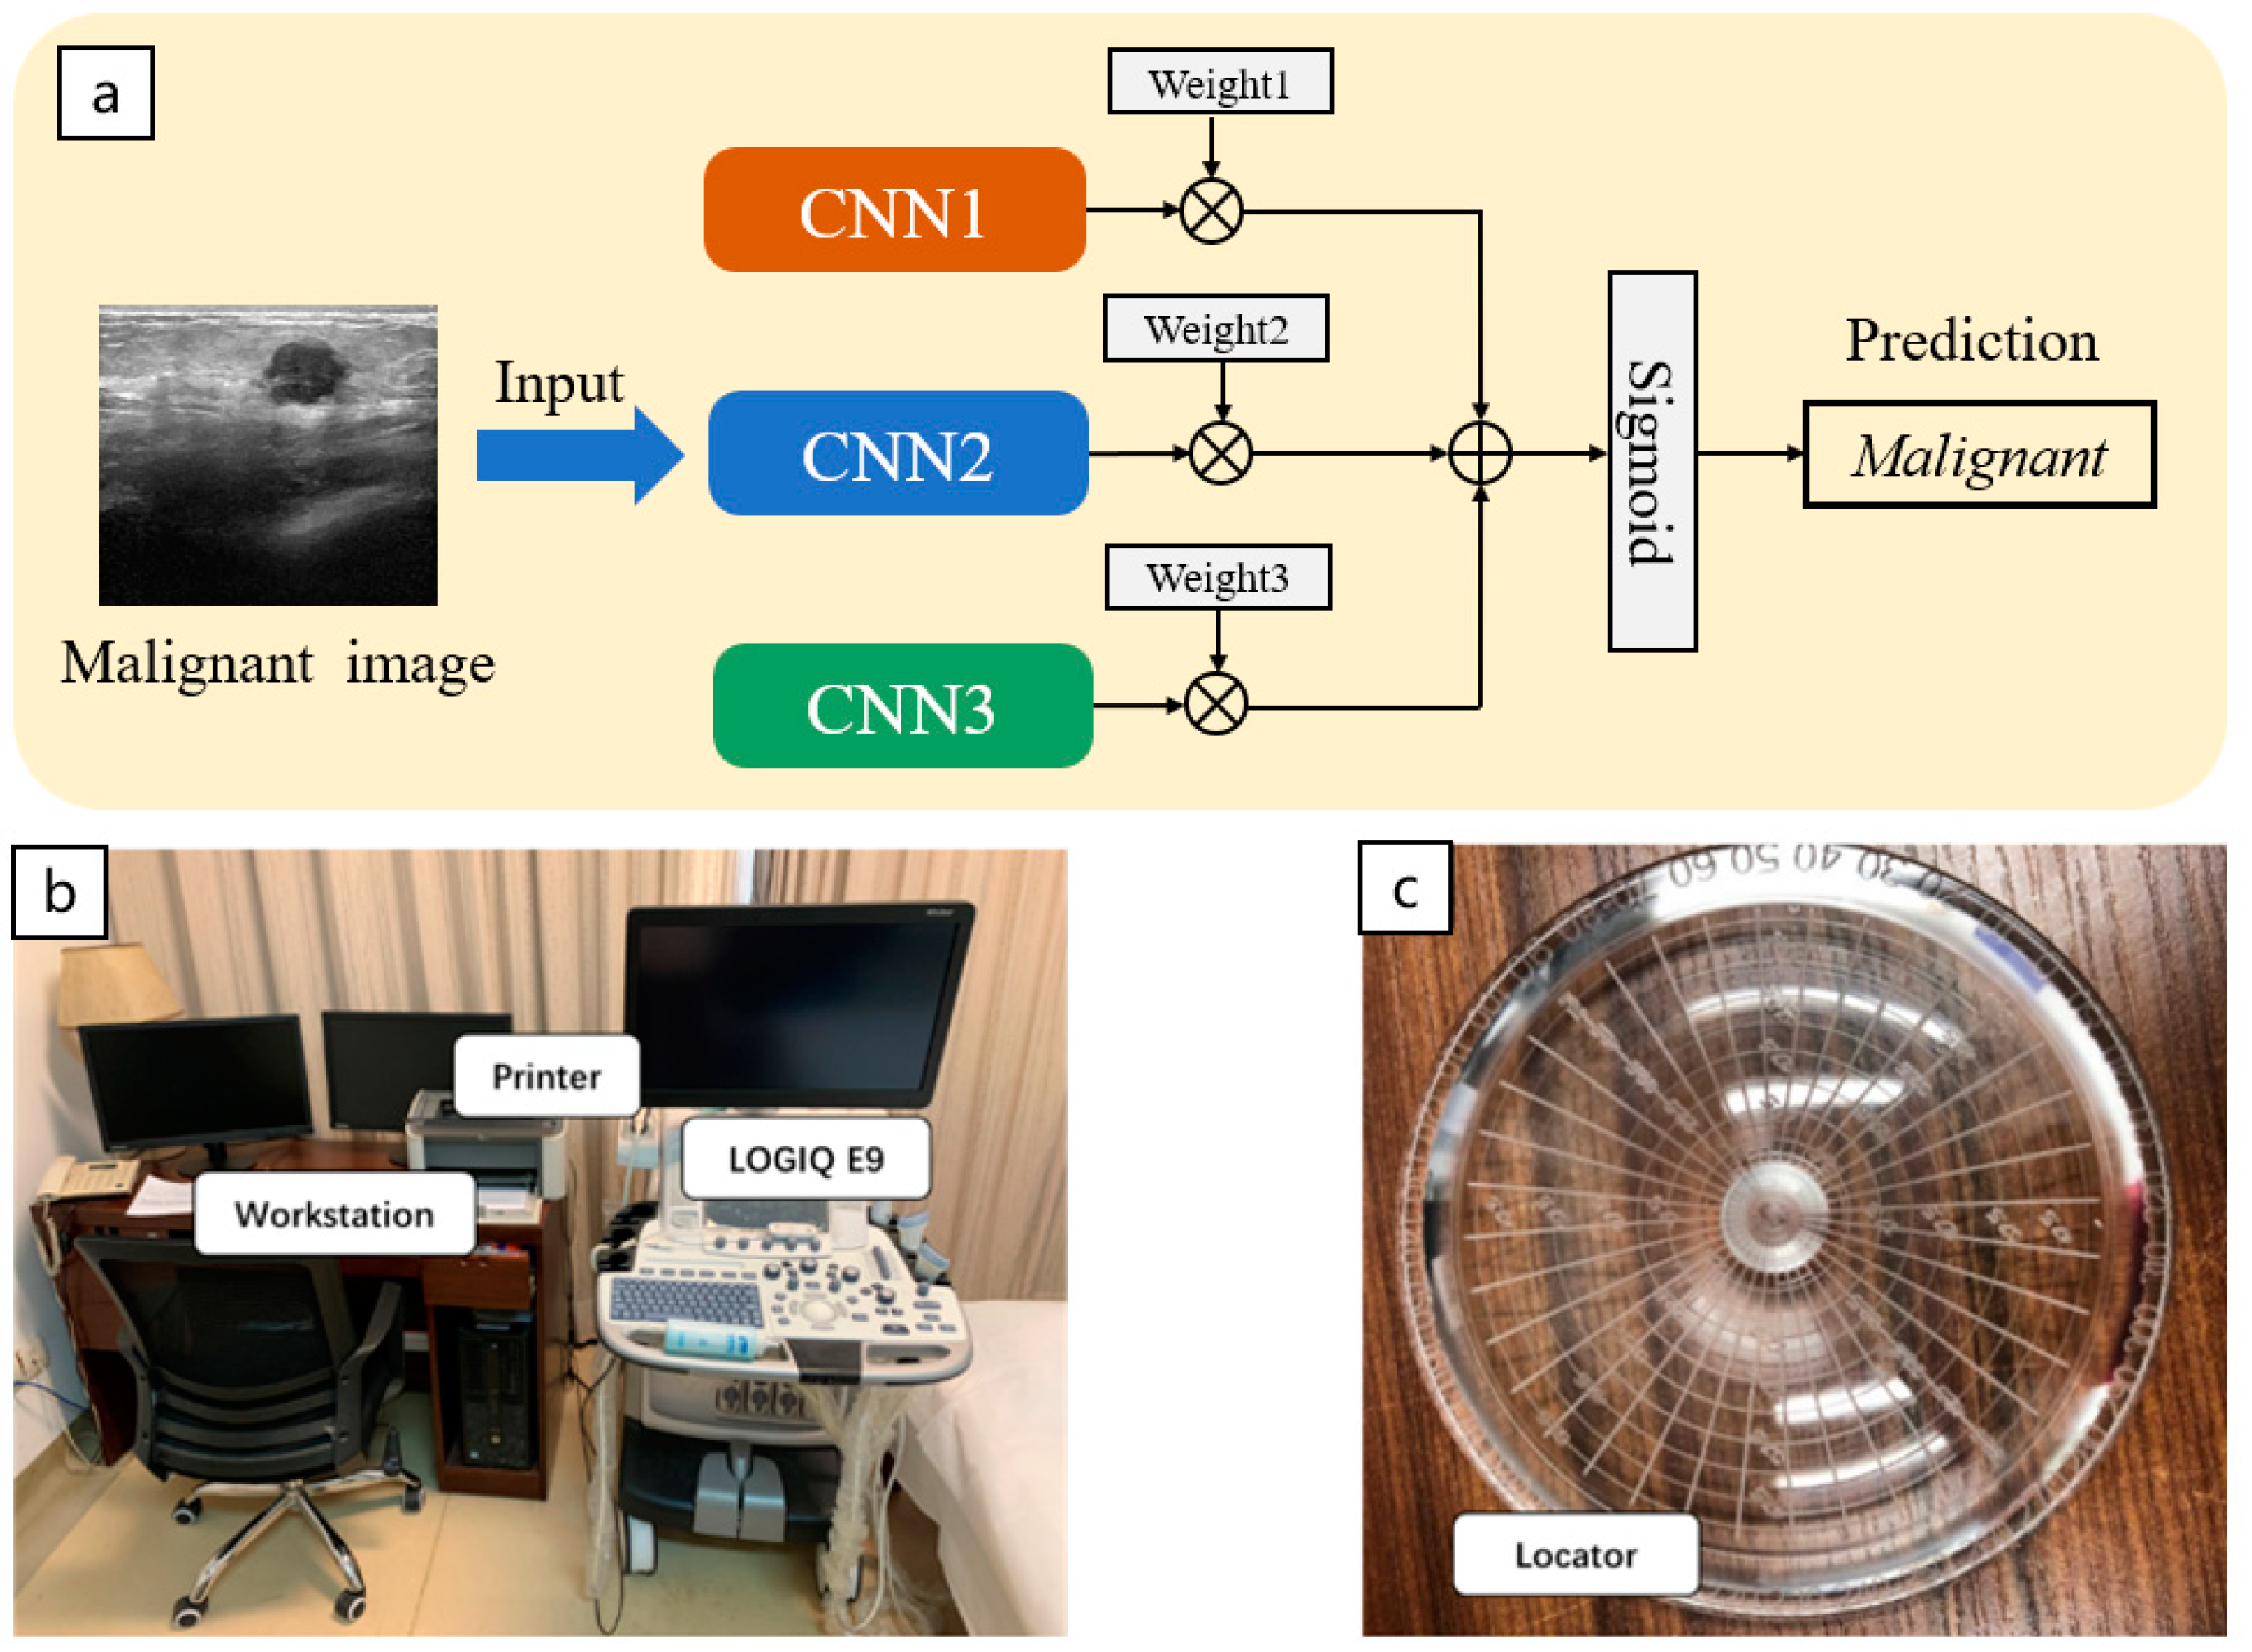
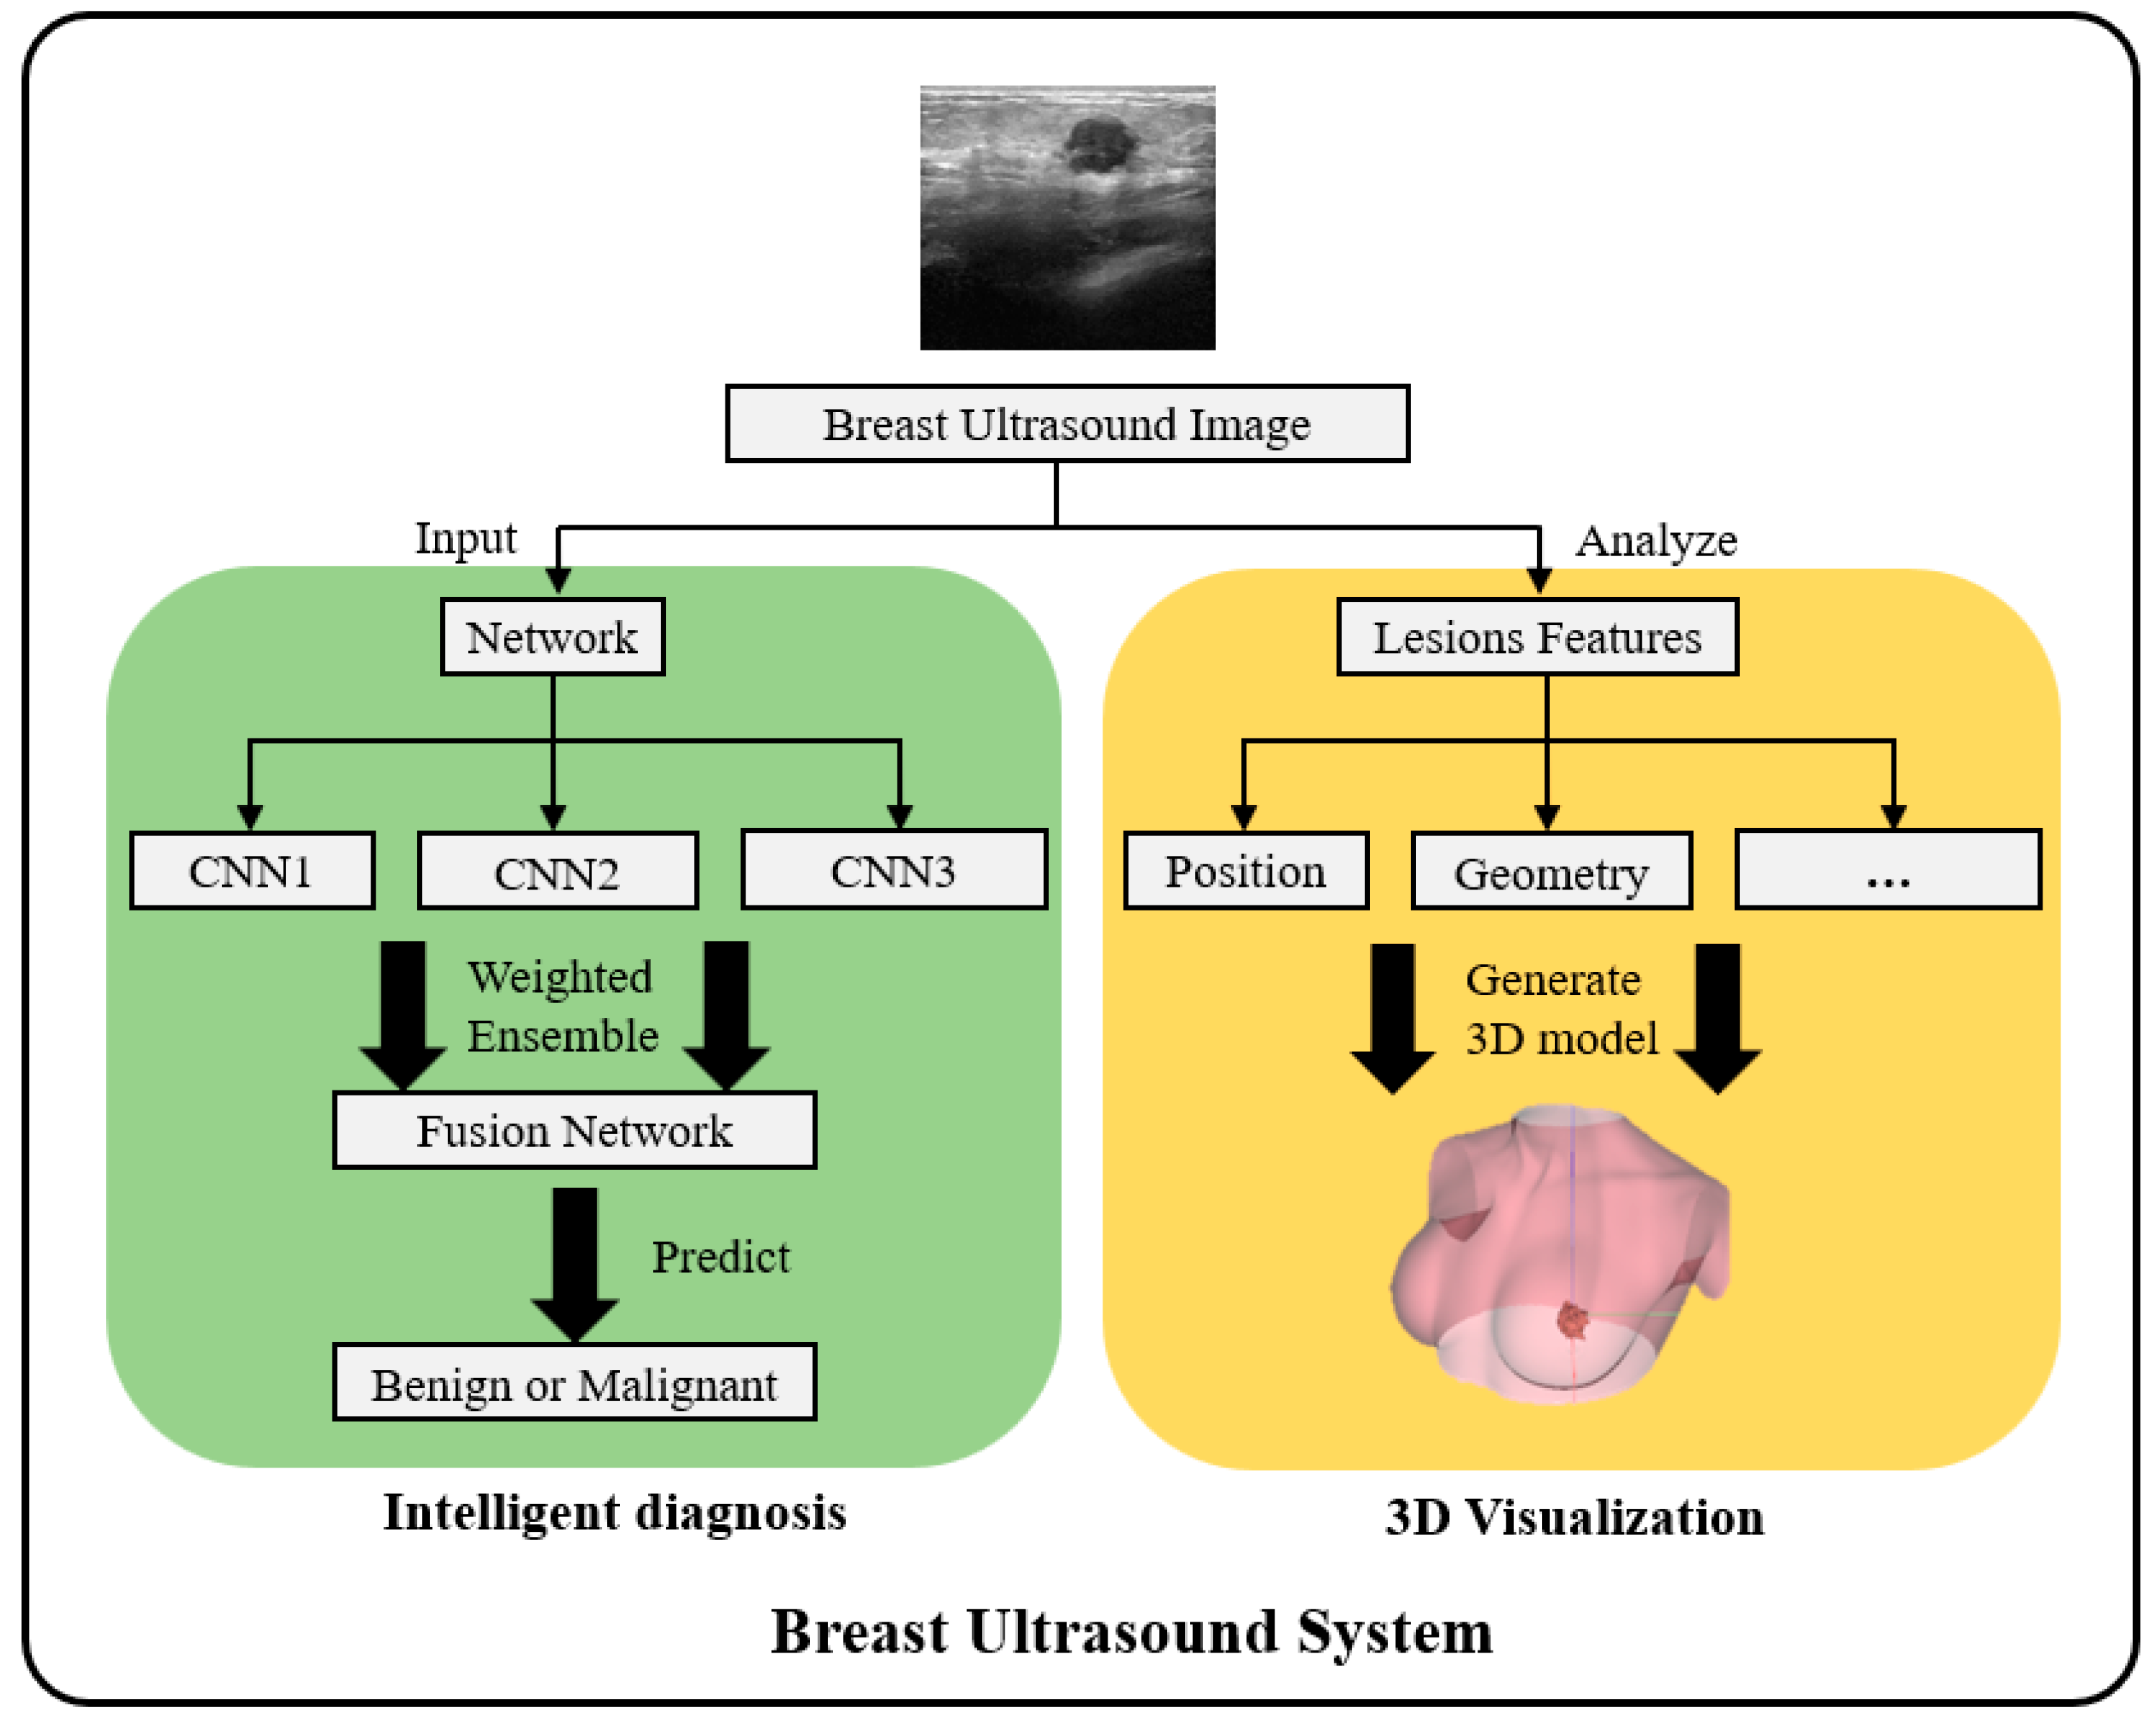
2.1. 3D-Based Breast Ultrasound System

The breast ultrasound system consists of two parts, as shown in Figure 1. The first part is the intelligent diagnosis of breast ultrasound image by ensemble neural network. The ensemble method of neural network is shown in Figure 1a. The second part is the 3D visualization of breast locator, which is designed based on the structural characteristics of female breasts to realize the positioning of female breast nodules. It includes ultrasound scanning equipment, workstation (Figure 1b), and locator (Figure 1c and Figure 2). GE LOGIQ E9 Ultrasound Machine is adopted as ultrasound scanning equipment provided by Ultrasound Supply. The workstation environment is Microsoft Workstation, Python 3.6. Operating software is 3D-based Breast Ultrasound Software, which is mainly developed based on The Visualization Toolkit (VTK) official application programming interface (version 7.1.1). Locator is designed based on the structural characteristics of female breasts to realize the positioning of female breast nodules.
The flowchart of breast ultrasound system proposed in this work is shown in Figure 3, which is divided into intelligent diagnosis and 3D visualization. In the intelligent diagnosis part, the breast ultrasound images are input into a pre-trained network, and the prediction results of the ensemble neural network are obtained by weighted ensemble, to realize the automatic benign and malignant diagnosis of breast ultrasound images and save medical resources. In the 3D visualization part, the ultrasound doctor firstly analyzes the ultrasound image and obtains the spatial position and geometric characteristics of breast nodules. After the analysis, the corresponding parameters are input into the 3D visualization software, and the software automatically generates the 3D breast nodule model.

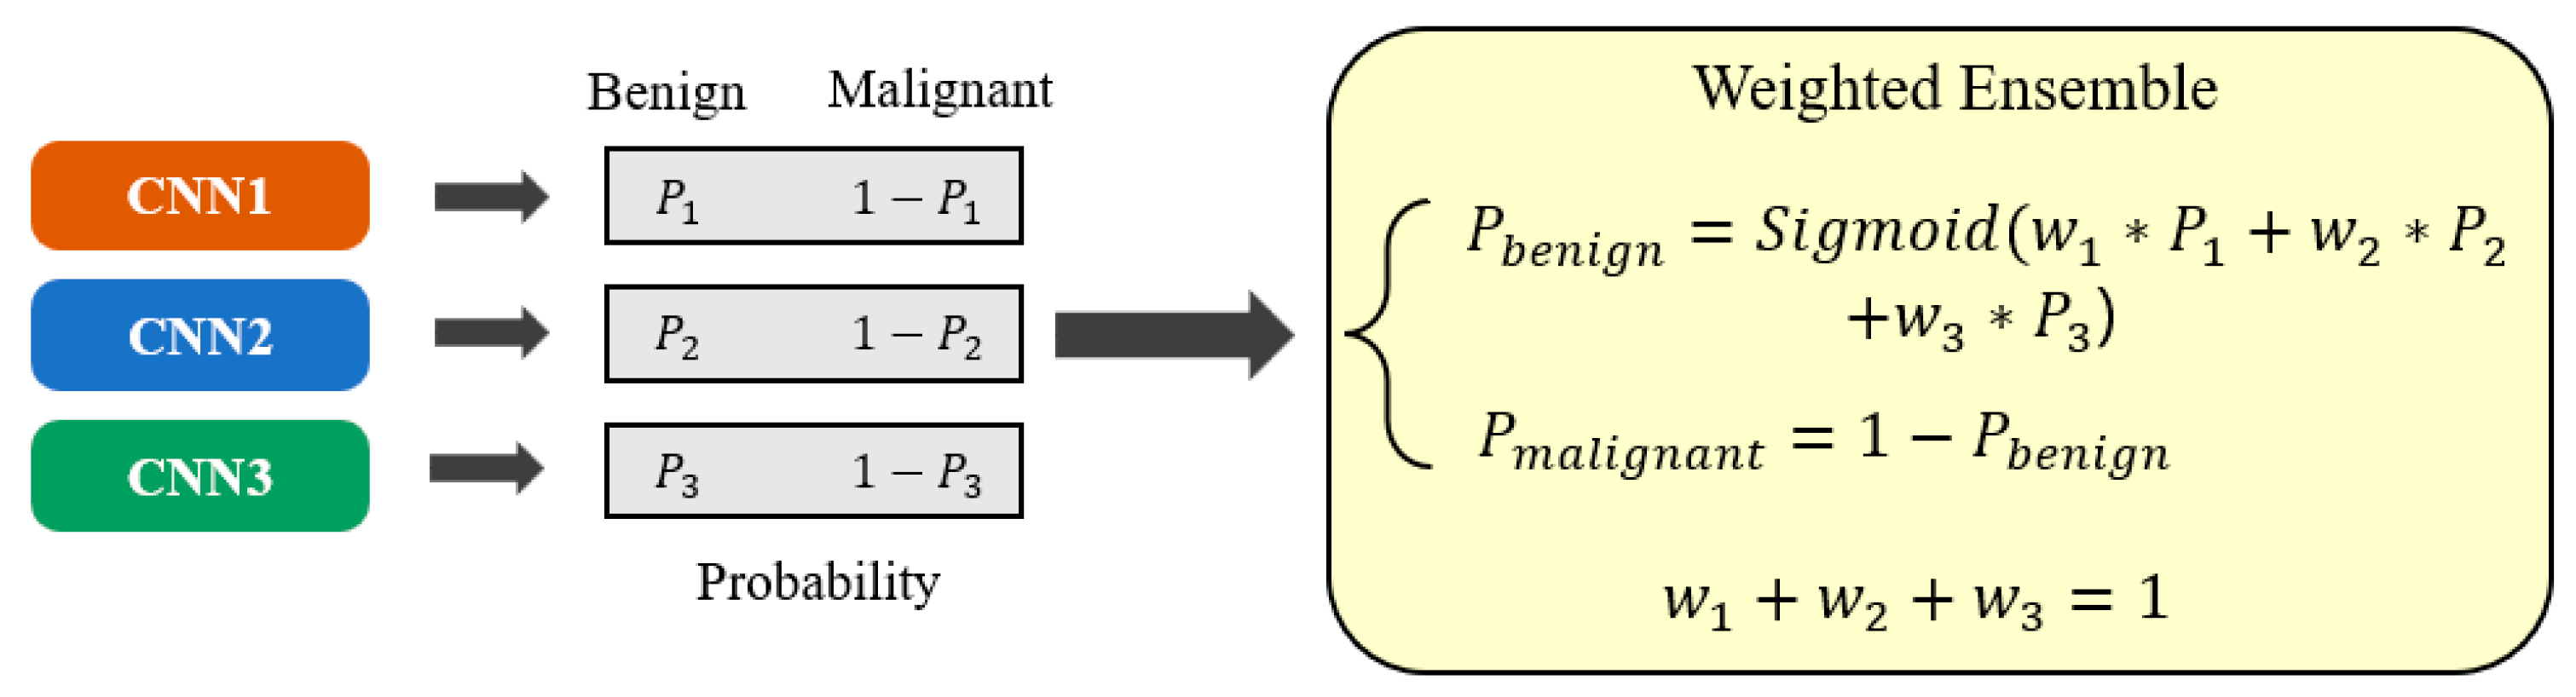
2.2. Ensemble Neural Network
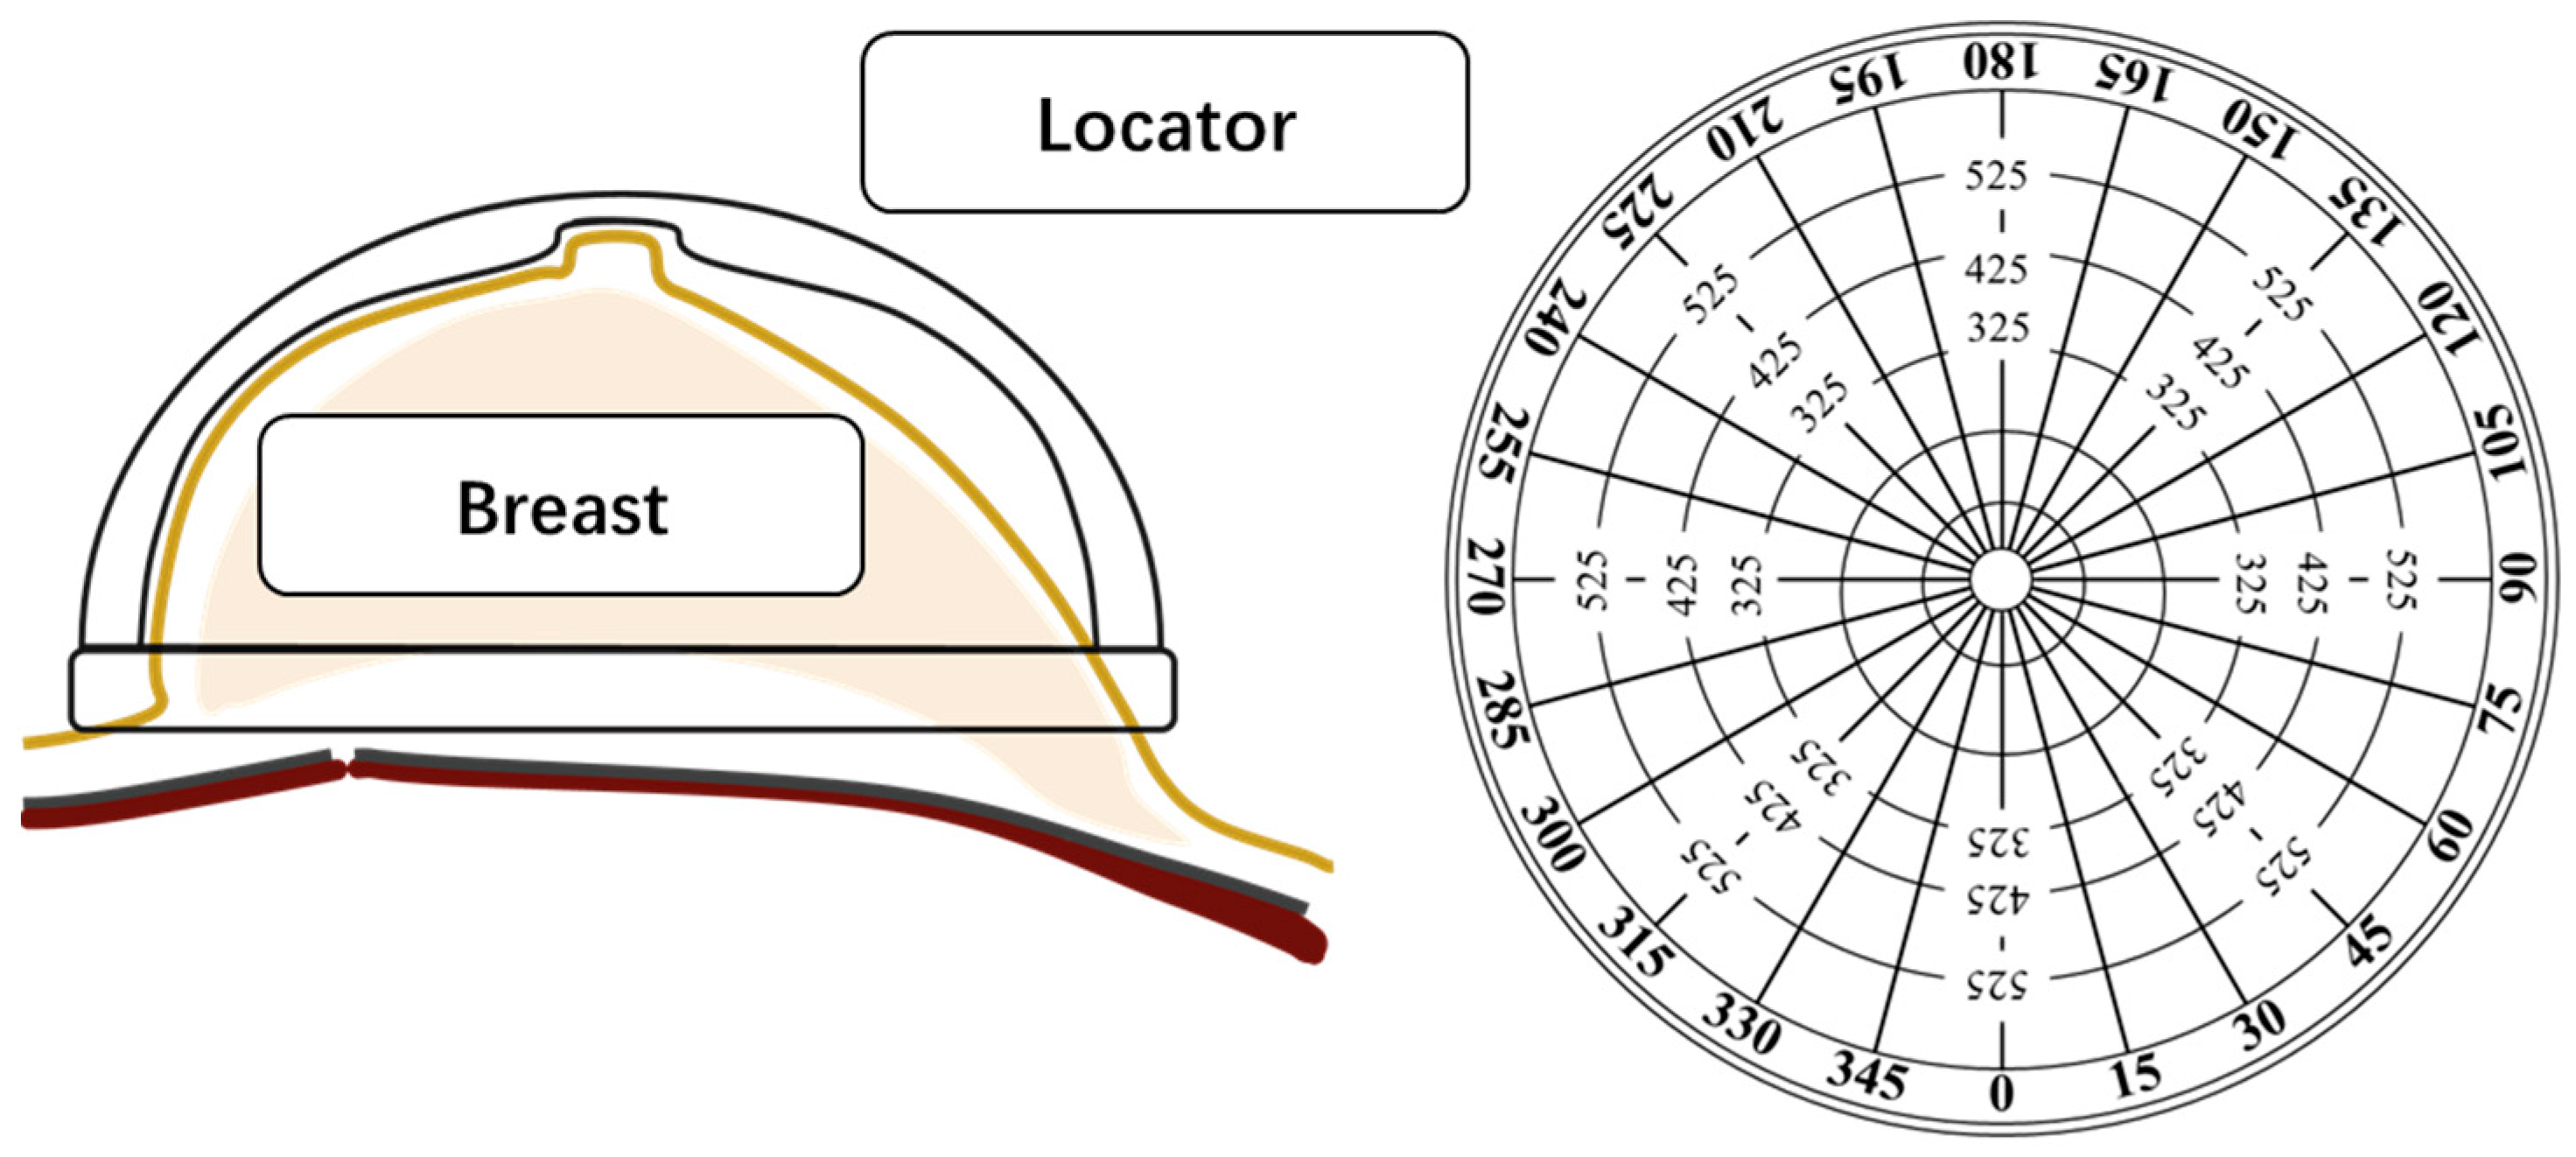
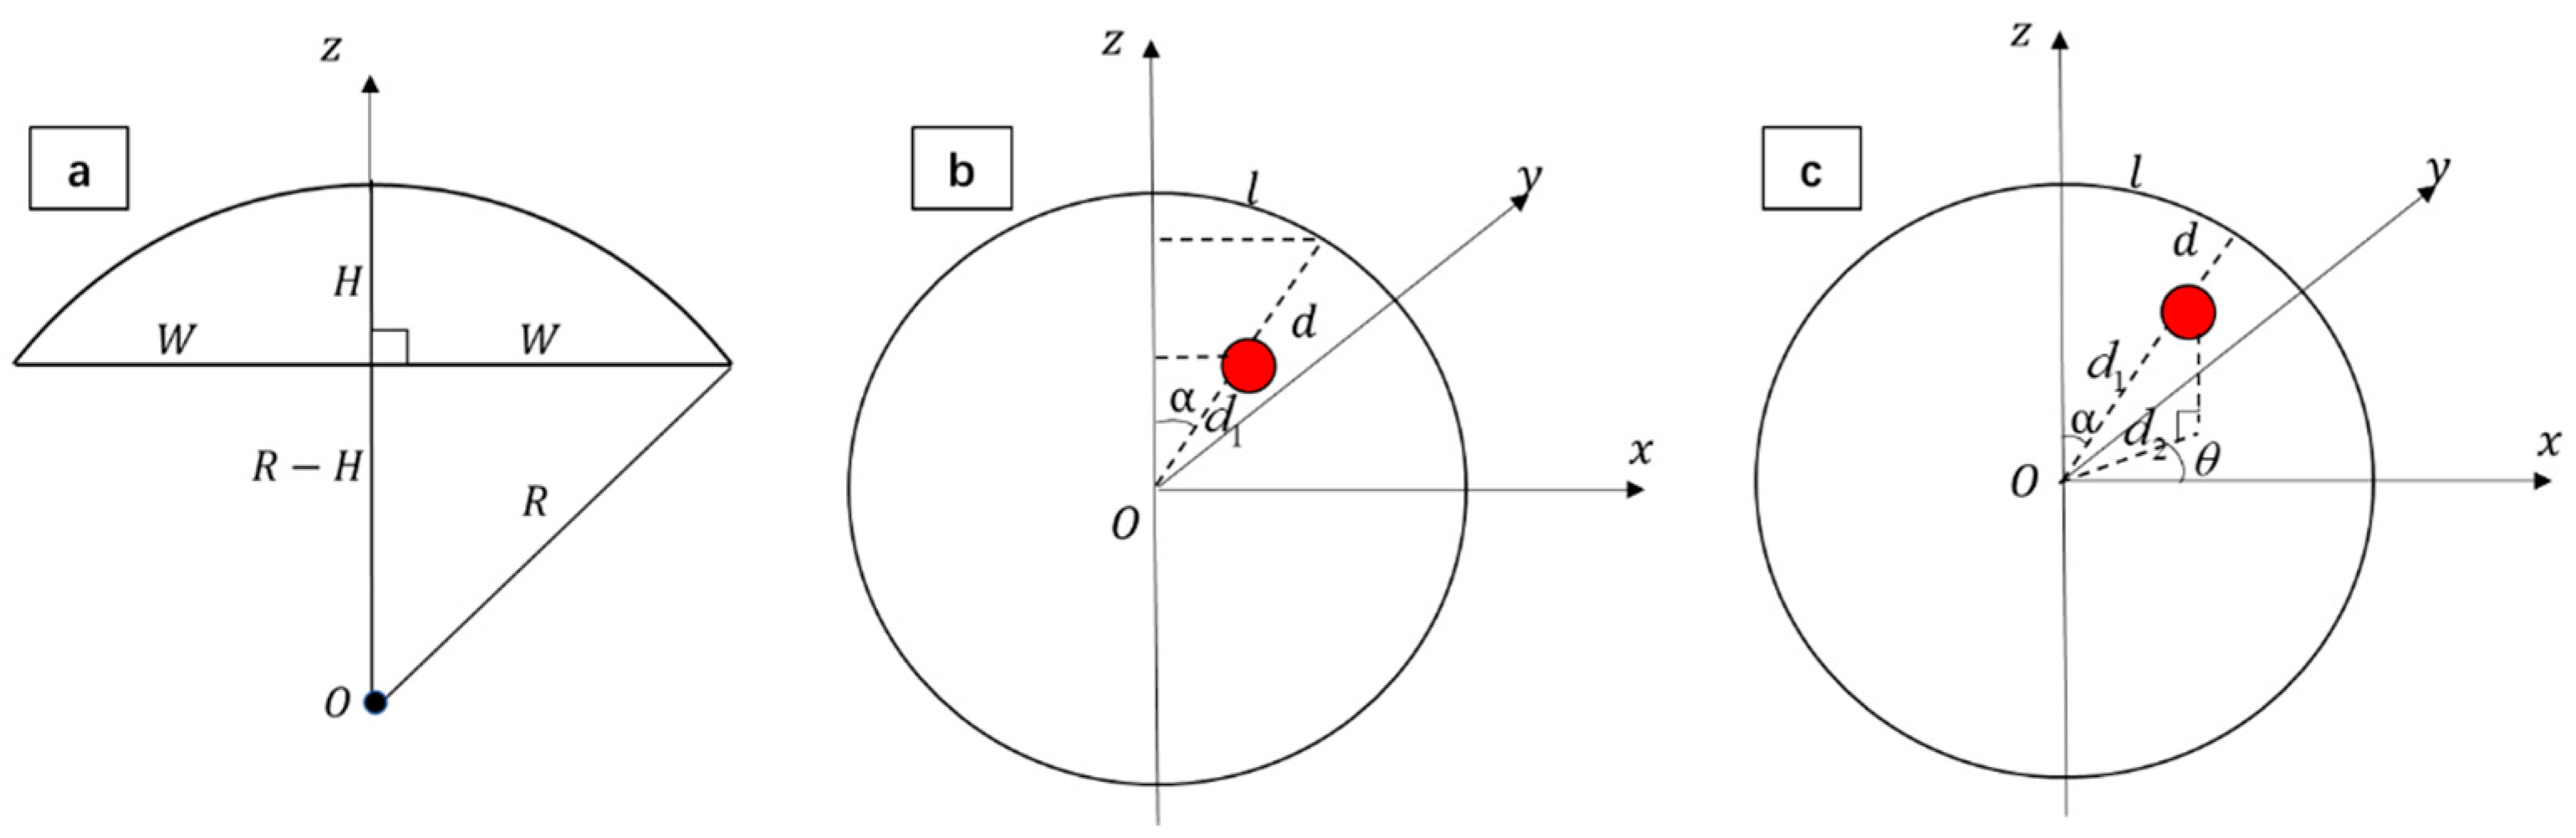
Neural networks usually require a large amount of data to train the network. However, the amount of ultrasound image data in the breast is generally low. To achieve good performance in a small dataset, we select three networks from widely recognized network: DenseNet [15], GoogLeNet [16], ResNet [17], VGG16 [19], ResNeXt [20], AlexNet [21], MobileNet [22], and NasNet [23]. Then, we combine them via the weighted ensemble method. In our work, we use a public breast ultrasound image dataset [24] (647 in total) to train these three neural networks and test the performance of a single neural network and ensemble neural network.
The dataset is divided into 80% training set and 20% testing set. After training the three neural networks, the trained model is obtained. To take advantage of different models, we use a weighted ensemble strategy (Figure 4) to combine their results. It is assumed that the benign probability values of the neural network outputs are P1, P2 and P3, respectively. By multiplying these three results by their respective weights (W1, W2 and W3) and summing them up, the sum result is then mapped to the range 0–1 by Sigmoid function to make sure the ensemble result is a probability distribution. The benign and malignant probability value of the ensemble neural network is shown in the following formula:
  P b e n i g n = Sigmoid ( W 1   ×   P 1   +   W 2   ×   P 2   +   W 3   ×   P 3 )
  P m a l i g n a n t = 1     P b e n i g n  
In our work, W1 = W2 = W3 = 0.33. The parameters above are evaluated by experienced breast ultrasound doctors according to the performance of a single neural network.

2.3. Locator

Locator is mainly worn on the patient’s breast. Its schematic is displayed in Figure 2. It is designed as a spherical structure that matches the shape of a human breast. The center of the inner side of the locator is equipped with a round hole-shaped groove that matches the position of the nipple, and the outer side is marked with a plurality of first- and second-measurement lines for measuring the breast of the wearer. The first-measurement lines with 15 degrees unit distance are used to obtain the angle of the breast, and the second-measurement lines with 0.1 mm unit distance measure the length of the breast. Each first-measurement line, respectively, extends from the center to the edge of the spherical structure. They are equal in length, and each is marked with an angle. Each second-measurement line is an annular line with the center of the spherical structure as the circle center. Second-measurement lines are parallel to each other, and each one is marked with a distance. Thus, locator can realize the structured measurement of patient’s breast, including measuring the height of the breast axis and the diameter of the breast base.
Conversion method of spatial information is as follows: Firstly, a straight line to connect origin and nodule center is made. Arc length from intersection of the straight line and skin to center of the nipple is defined as l , measured by locator’s second-measurement lines. Angle of nodule center on horizontal plane is θ , measured by the first-measurement lines of locator. It ranges from 0 to 360 degrees, increasing in counterclockwise direction. In addition, vertical distance between nodule center and skin is defined as d , which can be measured by an ultrasound scanner. Then, sphere center of locator is taken as origin, and surface of locator is sphere. Thus, a coordinate system is established and its z-axis is from the center of the sphere to the nipple. Horizontal direction from right to left side of the chest is uniformly defined as x-axis, which satisfies the left-hand coordinate system. θ = 0 is satisfied on x-axis. Therefore, the ball radius is radius of curvature of nipple horizontal section.
Assuming that breast height is H and width is 2 W , ( R H ) 2 + W 2 = R 2 is satisfied and R = H 2 + W 2 2 H is obtained (Figure 5a). H and W can be measured by doctors.
To obtain z-axis coordinates of the nodule position, α and d 1 are defined as shown in Figure 5b, where red area represents the nodule, which satisfies α = l R . Because of d 1 = R d , the nodule z coordinate can be expressed as:
z = d 1 × c o s α = ( R d ) × c o s ( l R )
Calculation of the x-axis and y-axis coordinates is as follows: projection length on the XOY plane of the line from the nipple center to the origin is defined as d 2 (Figure 5c), which satisfies:
d 2 = d 1 × c o s ( 90 ° α ) = ( R d ) × s i n α = ( R d ) × s i n ( l R )
Therefore, x and y coordinates of the nodule are:
{   x = d 2 c o s θ = ( R d ) s i n ( l R ) c o s θ   y = d 2 s i n θ = ( R d ) s i n ( l R ) s i n θ
Since z   >   0 and the range of θ are 0 360 degrees, positive and negative changes of x and y coordinates are consistent with Equation (3). Therefore, ( x , y , z ) of the breast nodule in the 3D coordinate system can be converted through actual measurement parameters.

2.4. Model Preparation and Report Generation

Preparation of the models is mainly based on signs of breast ultrasonography. Referring to ultrasound images, four basic nodule models of smooth, burr, horned, and lobed cases are established. Dealing with nodules of different sizes, horizontal and vertical length, and height of nodules measured by ultrasound scanner correspond to the size in x-, y-, and z-axis. Thus, through size transformation of models, they are contracted or expanded. For a smoothing effect, noise and subdivision are performed on the basic geometric model. Some textures realize calcification (microcalcification, arc-shaped calcification, etc.) and blood flow (poor blood supply, rich blood supply) through basic geometric combinations. In addition, the setting of outer cover establishes a fuzzy high-echo halo feature. Some models need to be provided with materials. Cinema 4D model materials are applied to control color and transparency. According to input information, size transformation and morphological combination of models are carried out. Finally, three typical body types are established.
Generating module is composed of three parts, including 3D space positioning information of lesions, internal information of 3D lesions, and external information of 3D lesions. The 3D space positioning information marks the center position of the nodules, internal information shows textures and characteristics of nodules, and external information expresses the relative position of nodules in the breast. Thus, a 3D ultrasound diagnosis report is generated, which has the patients’ name and number, 3D models of the nodules, and diagnosis information. The 3D model is adjusted to appropriate angle, viewed through manual interaction of visualization module, and obtained through real-time screenshots. Finally, it is output according to the current report format commonly applied in hospitals and printed by the writing function.

3. Experiment Results and Discussion

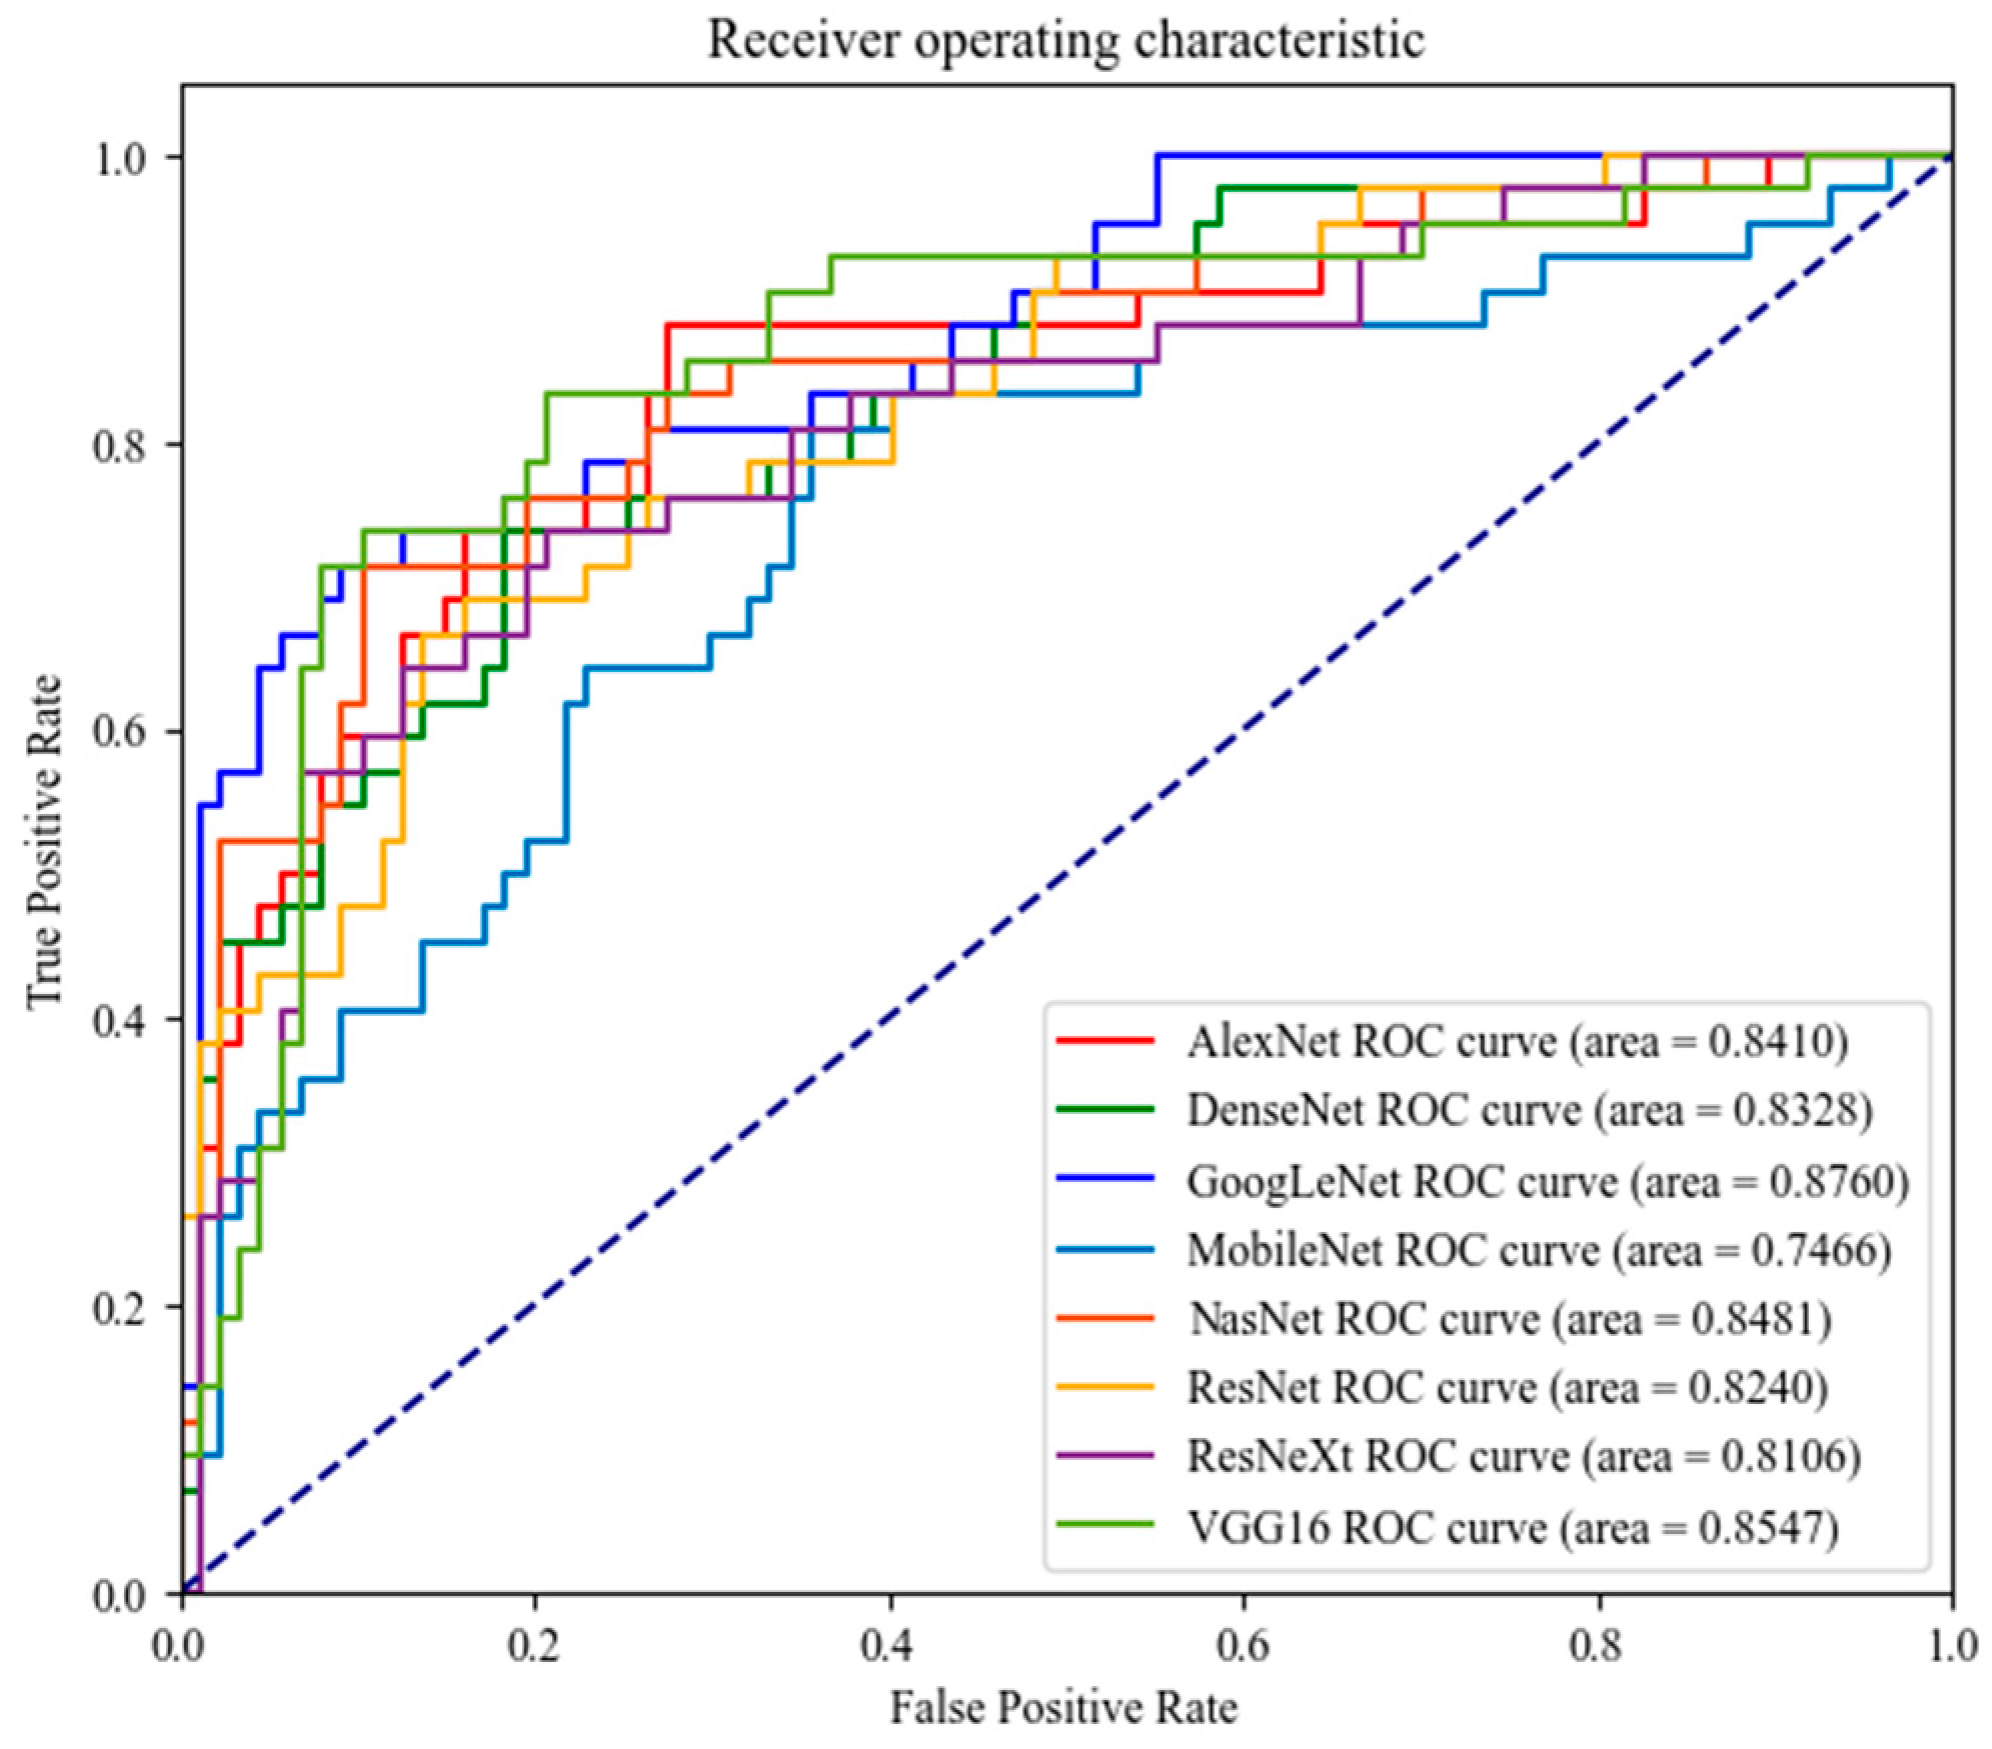
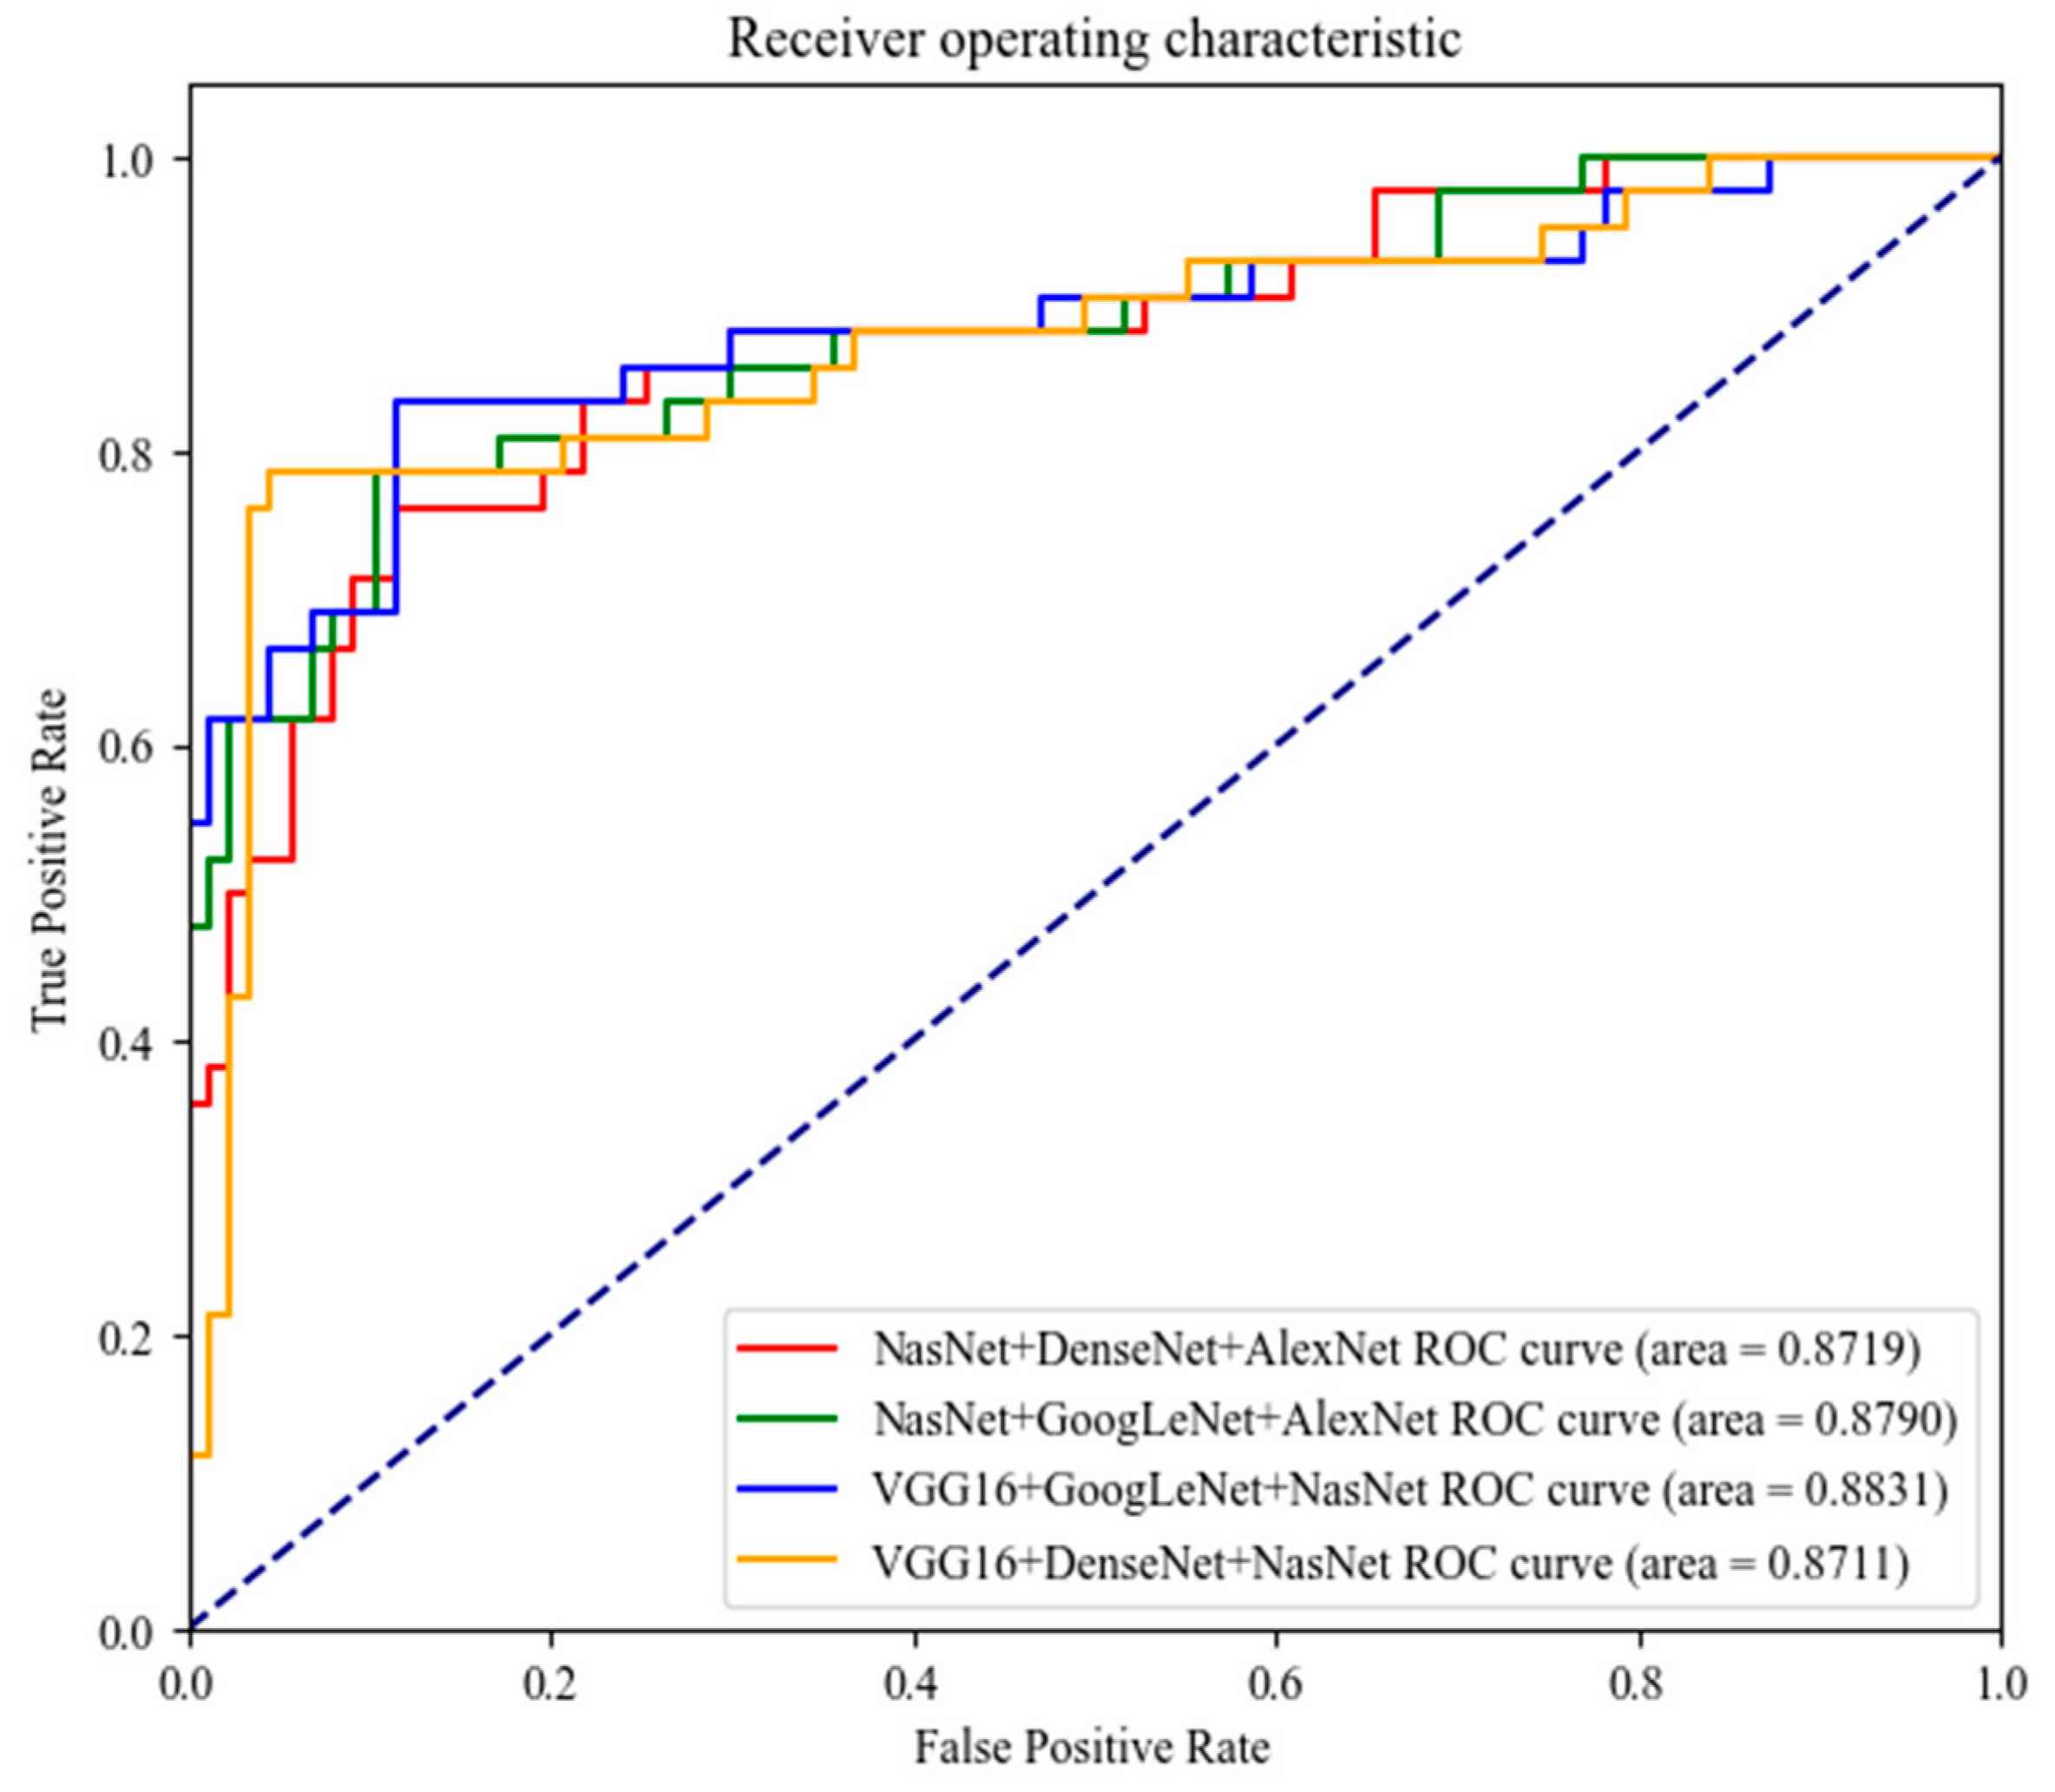
3.1. Ensemble Network

To evaluate the performance of the network, we use the accuracy, recall, F1 score and the AUC (area under curve) of ROC (receiver operating characteristic curve) metrics [25,26]. Results of different neural networks and ensemble networks are shown in Table 1. We first train all individual neural networks and calculate the metrics, then select the model with higher F1 score and combine the models through weighted ensemble strategy. Finally, we determine four groups of neural network combinations. They are (NasNet, AlexNet, DenseNet), (NasNet, GoogLeNet, AlexNet), (VGG16, GoogLeNet, NasNet), (VGG16, NasNet, DenseNet). By using the weighted ensemble strategy, the ensemble neural network is obviously improved compared with that of a single network. The performance and metrics of these networks have listed in the Table 1, Figure 6 and Figure 7.
Among combination groups, the (VGG16, NasNet, DenseNet) group achieved the best result, with acc of 0.8992 and F1 score of 0.8312. Compared with the best single neural network, VGG16, accuracy increased by 6.2%, and F1 score increased by 9.7%. All of the above indicate that the ensemble network obtained by the weighted ensemble method has better performance and is more suitable for benign and malignant diagnosis of breast ultrasound images.

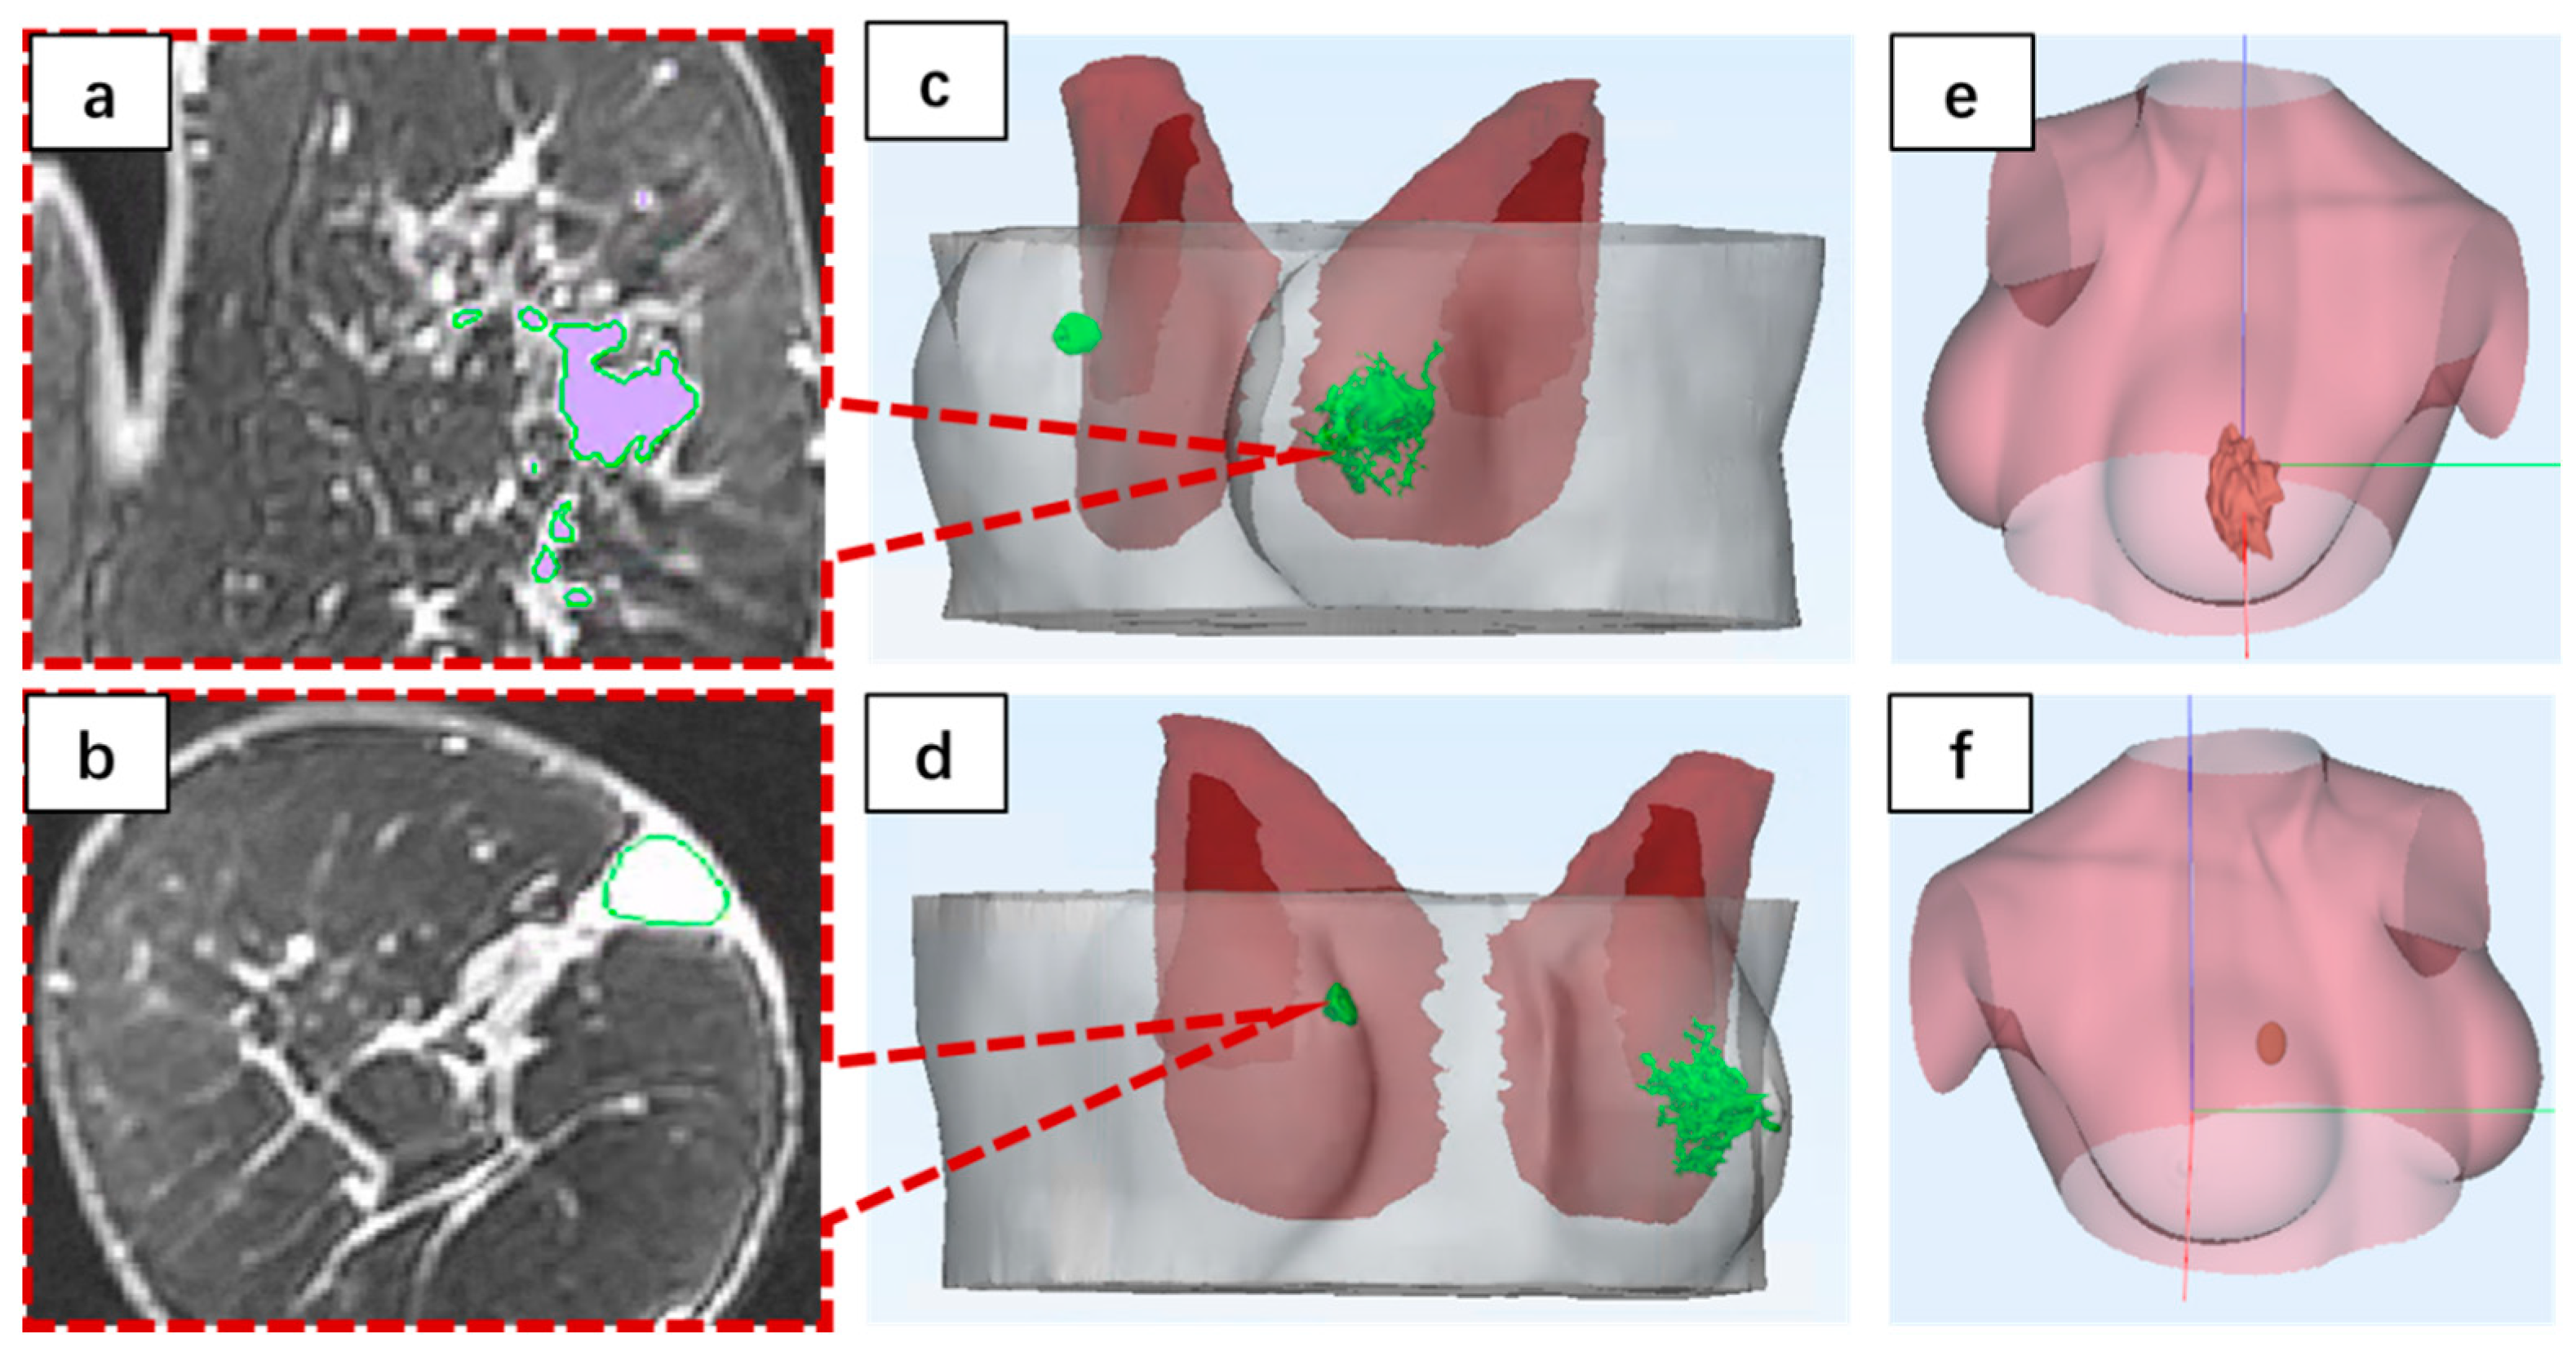
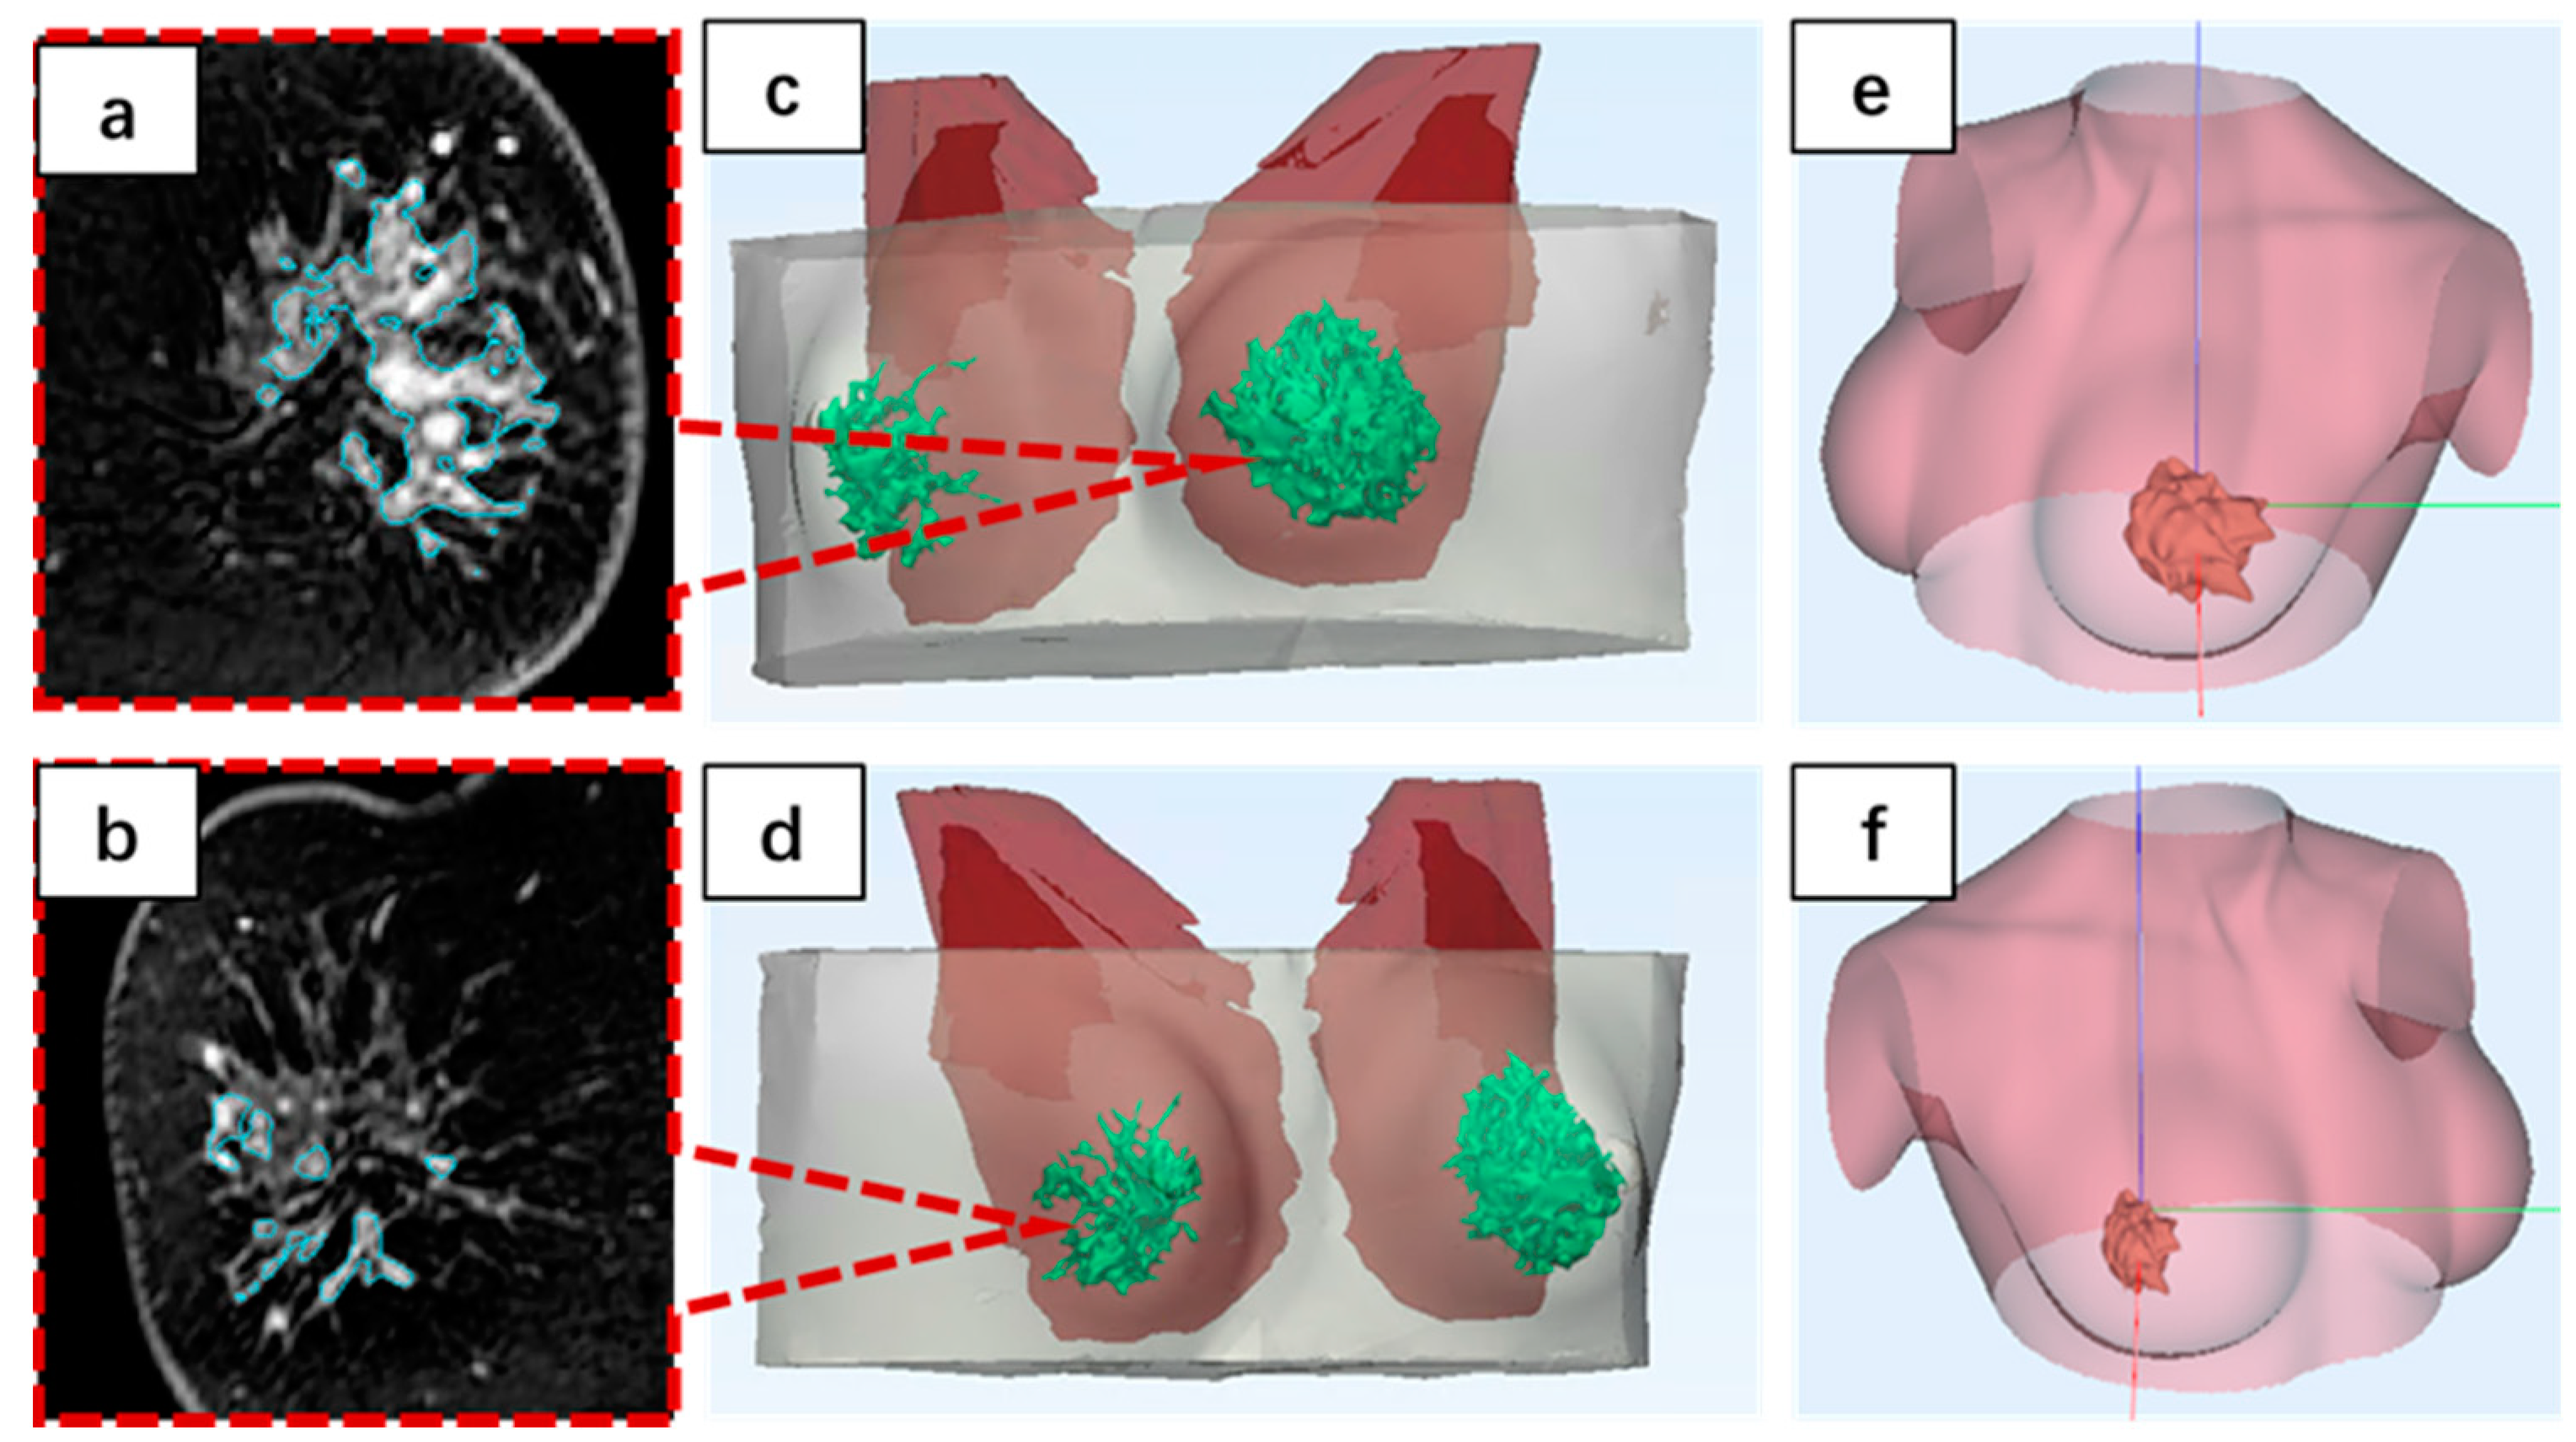
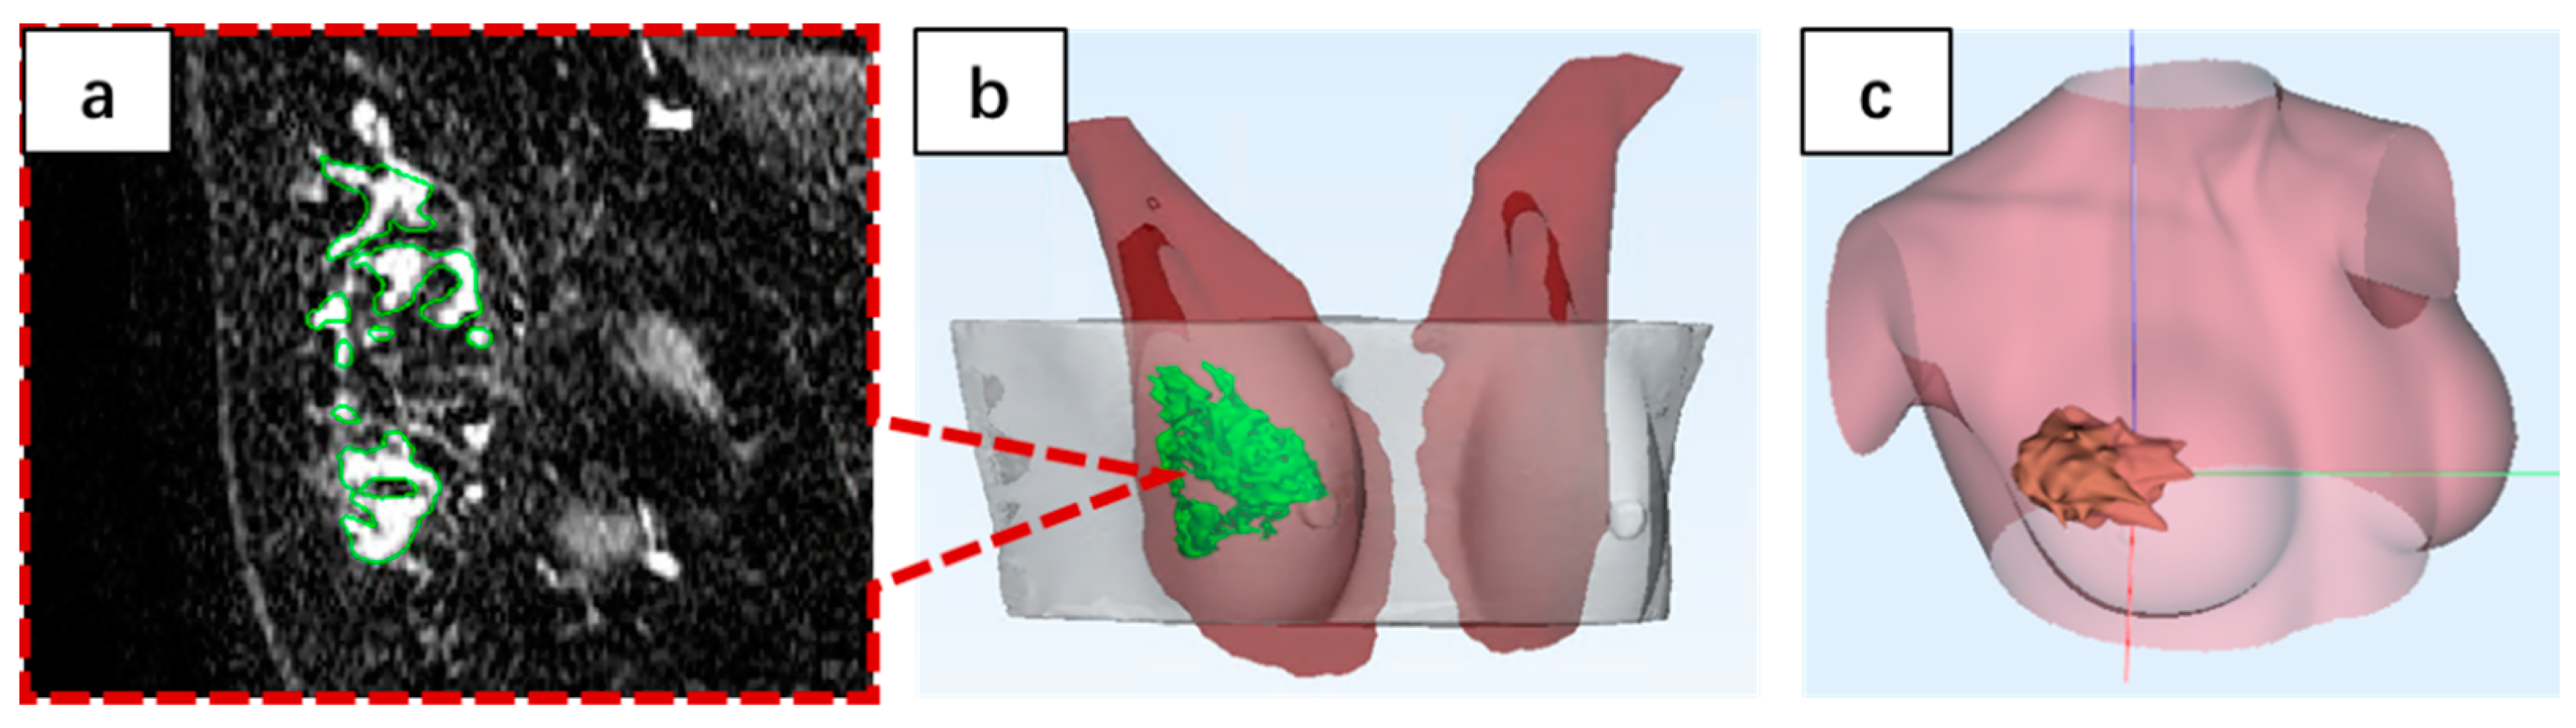
3.2. Breast Lesion 3D Visualization

Two senior sonographers (both with over 25 years of experience) conducted experiments on three subjects. First, lesion space information of three patients was obtained through the locator. Then, 3D-based Breast Ultrasound Software realized the generation of models and reports. Information representation of the three patients is shown in Table 2. In addition, three subjects underwent MRI scans at the same time, and the acquired MRI volume data were analyzed by the operating imaging physician in Mimics Research 19.0 to complete segmentation of the skin layer, lesion, and pectoralis major in sequence.
To unify the structure, all models used green nodules. Pectoralis major muscle tissues were shown as dark red with a certain degree of transparency, and white with high transparency were used as skin tissue. In the ultrasound reports of the first group, the most typical patient feature was that the size of the left thoracic nodule was 46 × 35 × 63 mm (Figure 8a), which was about 58.8 times larger than that of the right thoracic nodule (Figure 8b). Therefore, there were obvious differences in individual size between the two lesions, which are clearly shown in the green nodules in Figure 8c,d. Using the 3D-based breast ultrasound system, a basic burr nodule model was established on the left side of the chest, and the size was transformed according to the horizontal length and size. Basic geometry was added to show the state of rich blood supply (Figure 8e). On the right side of the chest, a smooth basic nodule model was established, and the size was transformed according to length and size (Figure 8f). Finally, all positionings were completed by the spatial information. Comparing the reconstruction results from MRI and models generated by the 3D-based breast ultrasound system, shape, size, and spatial location basically matched, meeting the clinical requirements of the doctor–patient information guidance.
Figure 9a,b reveal MRI imaging parts of the second patient, which are different from the first patient. Through a 3D model reconstructed by the MRI, it can be observed that nodules on the left and right sides of the chest are large and have obvious burr characteristics (Figure 9c,d). In the 3D-based breast ultrasound system, the left and right sides of the chest were both imported with the burr nodule model, and transformation was computed from the actual size. A basic geometric model to the left thoracic nodule was added to simulate the state of a rich blood supply (Figure 9e). In the end, the generated model basically matched the size and the spatial location of the reconstructed model’s structural features (Figure 9e,f).
Figure 10a introduces parts of the MRI imaging of the third group of cases. Based on the reconstruction structure, only the right side of the chest contained medium-sized nodules, showing burrs and a rich blood supply (Figure 10b). The 3D-based breast ultrasound system imported the burr nodule model and added basic geometric structure as blood structure. Finally, it was stretched according to scale. The generated model was basically the same as the reconstructed result (Figure 10c). It is worth mentioning that muscle fiber length characteristics of the third group of cases are obvious. However, the model generated in the 3D-based breast ultrasound system cannot reflect this feature. This is because the 3D-based breast ultrasound system only contains a small, medium, and large chest that can be contracted in proportion, so it cannot reflect the patient’s weight, chest width, and chest length. This will bring an error to the relative position of nodules and thoraxes.

3.3. Discussion

In breast nodule diagnosis, compared with the neural network models used in this paper (DenseNet, GooGleNet and AlexNet), the model generated by the weighted ensemble method improved in accuracy, recall and F1 score metrics to varying degrees. Among the experiments, the combination of VGG16, NasNet and DenseNet, with accuracy of 0.8992, recall of 0.7619 and F1 score of 0.8312, obtained the best score and verified that the ensemble neural network generated by the weighted ensemble method can effectively improve the performance of the neural network and better diagnose breast ultrasound images.
In breast nodule visualization, the size and location of nodules generated by the 3D breast ultrasound system basically matched the reconstructed structure. This is because the ultrasound probe and locator can accurately measure the size and position of the nodule. The error mainly comes from three aspects: (1) the measurement error of the ultrasonic breast nodule size may be due to human error; (2) when locating breast nodules on ultrasound, the selection of reference points (usually the area near the center of the nodules) may lead to localization errors; (3) structural errors, including calcification, blood supply and hyperechoic halo, may occur when the simulated edge shapes of basic nodules are different. It is worth mentioning that the 3D visualization of the breast ultrasound system aims to provide instructive 3D ultrasound reports to help doctors construct surgical navigation and facilitate communication with patients. Therefore, the 3D visualization of the breast ultrasound system does not need to establish a high-precision model system. However, how to more accurately simulate the patient’s body shape, simulate more accurate characterization methods, and enrich the basic model of nodules are still problems worth exploring. This not only deals with common nodule representations, but also generates a guiding model structure for complex situations. This also provides a direction for the next generation of 3D-based breast ultrasound systems.

4. Conclusions

This paper proposes an intelligent diagnosis and 3D visualization system based on ultrasonic breast images. The main work includes: first, through training widely recognized classical networks, the ultrasonic image experts evaluate the network performance and give the weight for the following ensemble. The ensemble neural network is obtained by the weight. Second, based on the texture characteristics of ultrasonic images, the basic model and geometric combination rules of breast nodules were used to construct a three-dimensional model of typical breast nodules. Third, a locater-based method for locating breast nodules was proposed to achieve spatial calibration of nodular information in ultrasound images. Fourthly, the performance of the network was evaluated on the test set with 129 samples on three separate networks and on the ensemble neural network. Lastly, to verify the 3D visualization performance of the system, three groups of clinical patients were tested. After comparison, the model generated based on the 3D breast ultrasound system was basically consistent with the reconstructed 3D nodular structure. Therefore, the 3D-based breast ultrasound system proposed in this paper can realize automatic diagnosis of breast ultrasound images, meet certain clinical needs, and solve the serious problems existing in doctor–patient communication and preoperative breast navigation. It has clinical benefits.

Author Contributions

Conceptualization, Y.L. and R.X.; investigation, C.C. and J.L.; resources, Y.C. and K.H.; writing—original draft preparation Y.L. and C.C.; writing—review and editing, Y.C. and R.X.; supervision, R.X.; project administration, R.X.; funding acquisition, R.X. All authors have read and agreed to the published version of the manuscript.

Funding

The research was funded by National Natural Science Foundation of China (62176268), Non-profit Central Research Institute Fund of Chinese Academy of Medical Sciences (2020-JKCS-008), Major Science and Technology Project of Zhejiang Province Health Commission (WKJ-ZJ-2112), and Scientific and Technological Innovation Foundation of Shunde Graduate School of USTB (BK19BF004).

Institutional Review Board Statement

The studies involving human participants were reviewed and approved by the ethic committee of the PLA General Hospital. Each patient obtained informed consent before examination.

Informed Consent Statement

Informed consent was obtained from all subjects involved in the study.

Data Availability Statement

Not applicable.

Conflicts of Interest

The authors declare no conflict of interest.

References

  1. Cheng, H.-D.; Shan, J.; Ju, W.; Guo, Y.; Zhang, L. Automated breast cancer detection and classification using ultrasound images: A survey. Pattern Recognit. 2010, 43, 299–317. [Google Scholar] [CrossRef] [Green Version]
  2. Raafat, S.S.; Ezzat, S.Z.; Khachaba, Y.A.; Aboul-Nasr, L.A. Autologous mastopexy and autoaugmention of the breast. Plast. Reconstr. Surg. Glob. Open 2020, 8, e3126. [Google Scholar] [CrossRef] [PubMed]
  3. Jeng, C.-J.; Hou, M.-F.; Liu, H.-Y.; Wang, L.-R.; Chen, J.-J. Construction of an integrated sexual function questionnaire for women with breast cancer. Taiwan. J. Obstet. Gynecol. 2020, 59, 534–540. [Google Scholar] [CrossRef] [PubMed]
  4. Nguyen, Q.T.; Tsien, R.Y. Fluorescence-guided surgery with live molecular navigation—A new cutting edge. Nat. Rev. Cancer 2013, 13, 653–662. [Google Scholar] [CrossRef] [PubMed]
  5. Tu, C.-C.; Hsu, P.-K. Global development and current evidence of uniportal thoracoscopic surgery. J. Thorac. Dis. 2016, 8, S308. [Google Scholar] [PubMed]
  6. Bezerra, L.; Ribeiro, R.; Lyra, P.; Lima, R. An empirical correlation to estimate thermal properties of the breast and of the breast nodule using thermographic images and optimization techniques. Int. J. Heat Mass Transf. 2020, 149, 119215. [Google Scholar] [CrossRef]
  7. Zhang, Z.; Zhang, X.; Lin, X.; Dong, L.; Zhang, S.; Zhang, X.; Sun, D.; Yuan, K. Ultrasonic diagnosis of breast nodules using modified faster R-CNN. Ultrason. Imaging 2019, 41, 353–367. [Google Scholar] [CrossRef] [PubMed]
  8. Patel, S.; Jong, T.; Haden, A. Pruritic Nodules on the Breast. Cutis 2019, 103, E3–E5. [Google Scholar] [PubMed]
  9. Froelich, M.F.; Kaiser, C.G. Cost-effectiveness of MR-mammography as a solitary imaging technique in women with dense breasts: An economic evaluation of the prospective TK-Study. Eur. Radiol. 2021, 31, 967–974. [Google Scholar] [CrossRef]
  10. Legrand, J.; Kirchgesner, T.; Sokolova, T.; Berg, B.V.; Durez, P. Early clinical response and long-term radiographic progression in recent-onset rheumatoid arthritis: Clinical remission within six months remains the treatment target. Jt. Bone Spine 2019, 86, 594–599. [Google Scholar] [CrossRef] [PubMed]
  11. Van Zelst, J.C.; Platel, B.; Karssemeijer, N.; Mann, R.M. Multiplanar reconstructions of 3D automated breast ultrasound improve lesion differentiation by radiologists. Acad. Radiol. 2015, 22, 1489–1496. [Google Scholar] [CrossRef] [PubMed]
  12. Cui, S.; Chen, M.; Liu, C. DsUnet: A new network structure for detection and segmentation of ultrasound breast lesions. J. Med. Imaging Health Inform. 2020, 10, 661–666. [Google Scholar] [CrossRef]
  13. Graziano, L.; Barbosa, P.N.V.P.; Travesso, D.J.; de Lima Tourinho, T.; Tyng, C.J.; Bitencourt, A.G.V. CT-guided biopsy of breast lesions: When should it be considered? Breast J. 2019, 25, 1050–1052. [Google Scholar] [CrossRef]
  14. Rashmi, R.; Prasad, K.; Udupa, C.B.K.; Shwetha, V. A comparative evaluation of texture features for semantic segmentation of breast histopathological images. IEEE Access 2020, 8, 64331–64346. [Google Scholar] [CrossRef]
  15. Huang, G.; Liu, Z.; Van Der Maaten, L.; Weinberger, K.Q. Densely connected convolutional networks. In Proceedings of the IEEE Conference on Computer Vision and Pattern Recognition, Honolulu, HI, USA, 21–26 July 2017; pp. 4700–4708. [Google Scholar]
  16. Szegedy, C.; Liu, W.; Jia, Y.; Sermanet, P.; Reed, S.; Anguelov, D.; Erhan, D.; Vanhoucke, V.; Rabinovich, A. Going deeper with convolutions. In Proceedings of the IEEE Conference on Computer Vision and Pattern Recognition, Boston, MA, USA, 7–12 June 2015; pp. 1–9. [Google Scholar]
  17. He, K.; Zhang, X.; Ren, S.; Sun, J. Deep residual learning for image recognition. In Proceedings of the IEEE Conference on Computer Vision and Pattern Recognition, Las Vegas, NV, USA, 27–30 June 2016; pp. 770–778. [Google Scholar]
  18. Lu, Y.; Li, J.; Zhao, X.; Li, J.; Feng, J.; Fan, E. Breast cancer research and treatment reconstruction of unilateral breast structure using three-dimensional ultrasound imaging to assess breast neoplasm. Breast Cancer Res. Treat. 2019, 176, 87–94. [Google Scholar] [CrossRef] [Green Version]
  19. Simonyan, K.; Zisserman, A. Very deep convolutional networks for large-scale image recognition. arXiv 2014, arXiv:1409.1556. [Google Scholar]
  20. Xie, S.; Girshick, R.; Dollár, P.; Tu, Z.; He, K. Aggregated residual transformations for deep neural networks. In Proceedings of the IEEE Conference on Computer Vision and Pattern Recognition, Honolulu, HI, USA, 21–26 July 2017; pp. 1492–1500. [Google Scholar]
  21. Krizhevsky, A.; Sutskever, I.; Hinton, G.E. Imagenet classification with deep convolutional neural networks. In Advances in Neural Information Processing Systems; MIT Press: Cambridge, MA, USA, 2012; Volume 25. [Google Scholar]
  22. Howard, A.G.; Zhu, M.; Chen, B.; Kalenichenko, D.; Wang, W.; Weyand, T.; Andreetto, M.; Adam, H. Mobilenets: Efficient convolutional neural networks for mobile vision applications. arXiv 2017, arXiv:1704.04861. [Google Scholar]
  23. Zoph, B.; Vasudevan, V.; Shlens, J.; Le, Q.V. Learning transferable architectures for scalable image recognition. In Proceedings of the IEEE Conference on Computer Vision and Pattern Recognition, Salt Lake City, UT, USA, 18–23 June 2018; pp. 8697–8710. [Google Scholar]
  24. Al-Dhabyani, W.; Gomaa, M.; Khaled, H.; Fahmy, A. Dataset of breast ultrasound images. Data Brief 2020, 28, 104863. [Google Scholar] [CrossRef] [PubMed]
  25. Chen, C.; Zhou, K.; Zha, M.; Qu, X.; Guo, X.; Chen, H.; Wang, Z.; Xiao, R. An effective deep neural network for lung lesions segmentation from COVID-19 CT images. IEEE Trans. Ind. Inform. 2021, 17, 6528–6538. [Google Scholar] [CrossRef]
  26. Chen, C.; Xiao, R.; Zhang, T.; Lu, Y.; Guo, X.; Wang, J.; Chen, H.; Wang, Z. Pathological lung segmentation in chest CT images based on improved random walker. Comput. Methods Programs Biomed. 2021, 200, 105864. [Google Scholar] [CrossRef] [PubMed]
Figure 1. 3D-based breast ultrasound system. (a) Weighted ensemble network architecture. (b) Ultrasound scanning equipment workstation. (c) Locator proposed in this work.
Electronics 11 02116 g001
Figure 2. Locator and its schematic.
Electronics 11 02116 g002
Figure 3. Flowchart showing the breast ultrasound system for intelligent diagnosis and 3D visualization.
Electronics 11 02116 g003
Figure 4. Weighted ensemble strategy we proposed in this work. Choosing three pre-trained models, the ensemble result is obtained via the strategy.
Electronics 11 02116 g004
Figure 5. Spatial transformation of the locator. (a) Calculate the radius of the breast sphere. (b) Obtain the nodule z-axis coordinates (c) Obtain the nodule x-axis and y-axis coordinates.
Electronics 11 02116 g005
Figure 6. ROC of classical neural networks on a testing dataset.
Electronics 11 02116 g006
Figure 7. ROC of different ensemble neural networks on a testing dataset.
Electronics 11 02116 g007
Figure 8. Result of Subject 1. (a,b) Representation of the MRI imaging parts of the left and right breast of Subject 1. (c,d) Reconstruction structure based on the MRI. (e,f) Generative models of 3D-based breast ultrasound system.
Electronics 11 02116 g008
Figure 9. Result of Subject 2. (a,b) MRI imaging parts of the left and right breast of Subject 2. (c,d) Reconstruction structure based on the MRI. (e,f) Generative models of the 3D-based breast ultrasound system.
Electronics 11 02116 g009
Figure 10. Result of Subject 3. (a) Parts of the MRI imaging of the right breast of Subject 3. (b) Reconstruction structure based on the MRI. (c) Generative model of the 3D-based breast ultrasound system.
Electronics 11 02116 g010
Table 1. Results of different neural and ensemble networks on a testing set.
Neural NetworkAccuracyRecallF1 ScoreAUC
DenseNet0.77520.59520.63290.8328
GoogLeNet0.82940.73810.73810.8760
AlexNet0.79840.71430.69770.8410
ResNet0.75970.52380.58670.8240
MobileNet0.72870.45240.52050.7466
NasNet0.80620.61900.67530.8481
ResNeXt0.78290.59520.64100.8106
VGG160.83720.69050.73420.8547
(NasNet, AlexNet, DenseNet)0.82950.66670.71790.8719
(NasNet, GoogLeNet, AlexNet)0.84500.73810.75610.8790
(VGG16, GoogLeNet, NasNet)0.85270.69050.75320.8831
(VGG16, NasNet, DenseNet)0.89920.76190.83120.8711
The bold numbers indicate that the network performs best on this metric.
Table 2. Characterization information of three ultrasound volume data.
DataCharacterization Information Description
Subject 1Medium breast shape; upper right half, 5 × 15 × 23 mm, smooth, lengthwise, clear and complete, and position (51 mm, 80°, 10 mm). Upper left half, 46 × 35 × 63 mm, burr, horizontal length, rich blood supply, position (0 mm, 0°, 30 mm).
Subject 2Medium breast shape, upper right side, 42 × 31 × 44 mm, burr, horizontal and long, clear and complete border, lack of blood supply, position (0 mm, 0°, 27 mm). The upper left half, 50 × 58 × 60 mm, burr, rich blood supply, clear and complete border, position (0 mm, 0°, 35 mm).
Subject 3Medium breast shape, upper right side, 41 × 30 × 39 mm, burr, lengthwise, clear and complete, rich blood supply, location (26 mm, 340°, 20 mm).
Publisher’s Note: MDPI stays neutral with regard to jurisdictional claims in published maps and institutional affiliations.

