Article

Validating Syntactic Correctness Using Unsupervised Clustering Algorithms

1
School of Computer Science and Information Engineering, The Catholic University of Korea, Bucheon-si 14662, Korea
2
Division of Electronics Engineering, Ajou University, Suwon 16499, Korea
3
Deltaindex, Inc., Yuseong-gu, Daejeon 34027, Korea
*
Author to whom correspondence should be addressed.
Electronics 2022, 11(14), 2113; https://doi.org/10.3390/electronics11142113
Submission received: 16 June 2022 / Revised: 1 July 2022 / Accepted: 4 July 2022 / Published: 6 July 2022

Abstract

:
When developing a complex system in an open platform setting, users need to compose and maintain a systematic requirement specification. This paper proposes a solution to guarantee a syntactically accurate requirement specification that minimizes the ambiguity caused by ungrammatical sentences. Our system has a set of standard jargon and templates that are used as a guideline to write grammatically correct sentences. Given a database of standard technical Korean (STK) templates, the system that we have designed and implemented divides a new sentence into a specific cluster. If the system finds an identical template in a cluster, it confirms the new sentence as a sound one. Otherwise, the system uses unsupervised clustering algorithms to return the template that most closely resembles the syntax of the inputted sentence. We tested our proposed system in the field of open platform development for a railway train. In the experiment, our system learned to partition templates into clusters while reducing null attributes of an instance using the autoencoding procedure. Given a set of clusters, the system was able to successfully recommend templates that were syntactically similar to the structure of the inputted sentence. Since the degree of similarity for 500 instances was 97.00 % on average, we conclude that our robust system can provide an appropriate template that users can use to modify their syntactically incorrect sentences.

1. Introduction

When users wish to successfully develop a highly complex system in an open platform setting, it is necessary for them to utilize a set of standard technical jargon [1,2,3] and templates to write an accurate requirement specification. This paper describes a framework in which a system can automatically recommend the template closest to a specific input sentence. After users write a set of requirement specifications, they receive a confirmation on whether or not the specifications are accurate. If the sentences are syntactically wrong, a template that is most similar to the given sentence is provided as a guideline that users can refer to in order to modify the original sentence.
Our approach to recommending the most similar template is motivated by the fact that a set of sentences could be naturally classified into several groups according to their sentence form. In this paper, thus, the unsupervised clustering models [4,5,6] are suitable for partitioning the sentences into several groups. To search for a syntactically similar sentence, each sentence is transformed into a sequence of morphemes by using a morphological analyzer. A variety of templates represented as the sequence of morphemes is then fed into the unsupervised clustering algorithms as training instances and are divided into a set of natural groups. The system that we have proposed and implemented can ensure that a new sentence belongs to one of the groups. If it finds an identical template in a specific cluster, it confirms that the syntax of the new sentence is valid. Otherwise, based on the computation of the degree of similarity between the template and the new sentence, our system automatically returns the template that is syntactically closest to the new sentence. In this process, since having a fixed size of an instance is required for the input of clustering algorithms, the empty attributes should be stuffed into the properties of the instance. Including more meaningful attributes while removing meaningless null attributes, the autoencoding model [7] is utilized for the encoded instance in a shorter sequence of morphemes.
To validate the automated checker that we have developed, a set of experiments was conducted with various requirement specifications in the large-scale project of an open platform development for a railway train. First, we wish to show how the unsupervised clustering algorithms can divide these sentences into clusters without specifying the exact number of groups. Additionally, the autoencoding model reduces the size of an instance and enables our system to maintain a smaller number of clusters. Thus, our system can efficiently and rapidly find an appropriate template given an inputted sentence, while minimizing the system overhead. Second, after identifying the number of clusters, the degree of similarity between new sentences inputted by users and the templates recommended by our system is defined by a Euclidean distance and also by a cosine similarity, and measured in the experiment. As a result, regardless of whether or not a new sentence exists in the database of templates, it is shown that our robust system confirms the syntactic correctness of the new sentence, and further provides the most appropriate template as a reference. In our project of an open platform development for a railway train, users can practically improve the cohesiveness of requirement specifications by using the automated checker. Ultimately, we hope that our system contributes to the setup of a well-established development environment and to the reduction of system development costs.
The following section describes our work in the context of related research. Section 3 explains how to design and implement an automated checker that reviews the syntax of sentences by describing its event flow and architecture. The automated checker consists of a database server, including standard technical Korean (STK) and templates, and the graphical user interface (GUI) of our application program running on a Web server. Using our system, in Section 4, we empirically validate our framework and present the experimental results; we show how to maintain the clusters of templates and recommend the template that is most syntactically similar to the input sentence. The final section summarizes our results and discusses further research topics.

2. Related Work

In the field of computational linguistics, a controlled, simplified, and technical language [1] is particularly useful for certain text types, e.g., software and system specifications, technical reports and documentation, and help systems, to clarify their representation, to formulate standard terminology, and to improve communication among users. A great deal of organizations use a controlled natural language (CNL) [2,3]. For example, some of them are listed as follows: Avaya—Avaya Controlled English, The Boeing Company—Simplified Technical English, General Motors Company—Controlled Automotive Service Language, IBM—Easy English, and Sun Microsystems, Inc.—Sun Controlled English. When users specify software and system requirements, our framework utilizes CNL in Korean.
Furthermore, this paper focuses on templates that help to preserve a syntactically correct sentence in these specifications. After correctly written templates composed of CNL are given as a reference, users are able to write accurate requirement specifications based on these templates while reducing ambiguity. The style guides, in general, provide instructions on how to write a clear document, and these instructions are frequently accessed in various publications [8,9]. With our approach, rather than using style guides, we use templates that provide syntactic suggestions to improve the cohesiveness of the requirement specification. To guide users when revising incorrect statements, our approach provides templates that are syntactically closest to the input sentences.
This paper deals with an object in a data set, which is the sequence of morphemes representing a well-written template. The templates are possibly grouped into classes, according to their similarities. In other words, a group of templates is considered as a cluster [5]. Clustering models have been broadly used in many applications, e.g., web mining [10], biomedical research [11,12], image segmentation [13,14], anomaly detection [15], and marketing and finance [16,17]. Our approach proposed in this paper is based on an unsupervised clustering scheme [18]. The appropriate number of clusters in a data set should be identified to distinguish a finite set of categories among objects. As a solution to find this number, the most popular approach is to adopt a specific clustering algorithm using different numbers of clusters, and then determine whether or not the generated clusters are suitably partitioned [6]. In our application domain, since all applicable numbers of clusters with a dynamic group of templates could not be considered and automatically analyzed, applying the popular cluster validation to our domain is not feasible.
For the approach presented in this paper, the number of clusters k is determined as the average of the number of natural clusters generated by unsupervised clustering algorithms, i.e., the Expectation-Maximization (EM) algorithm [19,20] and the Density-Based Spatial Clustering of Applications with Noise (DBSCAN) algorithm [21]. First, the EM algorithm sets the initial parameters by assigning random values to the classes of instances. Then, the EM algorithm repeats between the steps of computing the cluster probabilities known as the ‘expectation’ step (E step) and maximizing the likelihood of the distribution parameters given the data available, which is known as the ‘maximization’ step (M step). After iterating the E step and the M step multiple times, the EM algorithm converges. In this paper, the EM algorithm alternates between calculating probabilities for the assignment of each sentence to each cluster (E step) and updating the cluster means and covariances based on the set of sentences belonging to that cluster (M step). As a result, the EM algorithm generates distinct clusters, where each cluster consists of related sentences. For each point (or instance), the DBSCAN algorithm first scans all of the points within the epsilon ( ϵ ) radius. If a point has more neighboring points than the minimum number of samples (minPts), it can be identified as a core point. In the next step, the DBSCAN connects all of the core points while ignoring all non-core points. Furthermore, it assigns each non-core point to a reachable cluster in case any core point is located within the ϵ radius; otherwise, it labels the non-core point as noise. If there is a core point, core and non-core points that are within the ϵ radius come together to form a single cluster, while excluding noise points. Thus, without setting the exact number of clusters a priori, the DBSCAN algorithm can find an arbitrary number of non-linearly separable clusters from a set of points.
When the number of clusters k is chosen, the iterative distance-based k-means clustering algorithm [22,23,24,25] minimizes the total squared distance (D) from all points to their cluster centers:
D = i = 1 k x j S i | x j u i | 2
where k is the number of clusters, S i is the clusters for i = 1 , 2 , , k , and u i is the mean point of the points x j S i . The k-means clustering algorithm repeats the whole procedure several times with different initial centers and chooses the best final result, which is the smallest D value. After estimating the possible number of clusters k from the average of the number of clusters generated by the EM and the DBSCAN, the k-means clustering algorithm recommends the most similar template for a given sentence. Out of various clustering algorithms, the k-means clustering algorithm uniquely provides not only the distance but also the angle between a pair of instances within a cluster, where both values can be utilized to calculate the degree of similarity for the recommendation. In the following sections, we focus on how to cluster the templates, how to determine the number of clusters, and how to recommend a template that is similar to an inputted sentence, among a collection of templates generated.

3. Automated Checker for the Statements of Requirement Specifications

This section presents the design and implementation of the automated checker used to review requirement specifications. Our system consists of a database server and a Web server, which are connected through the RESTful API (REpresentational State Transfer Application Programming Interface).

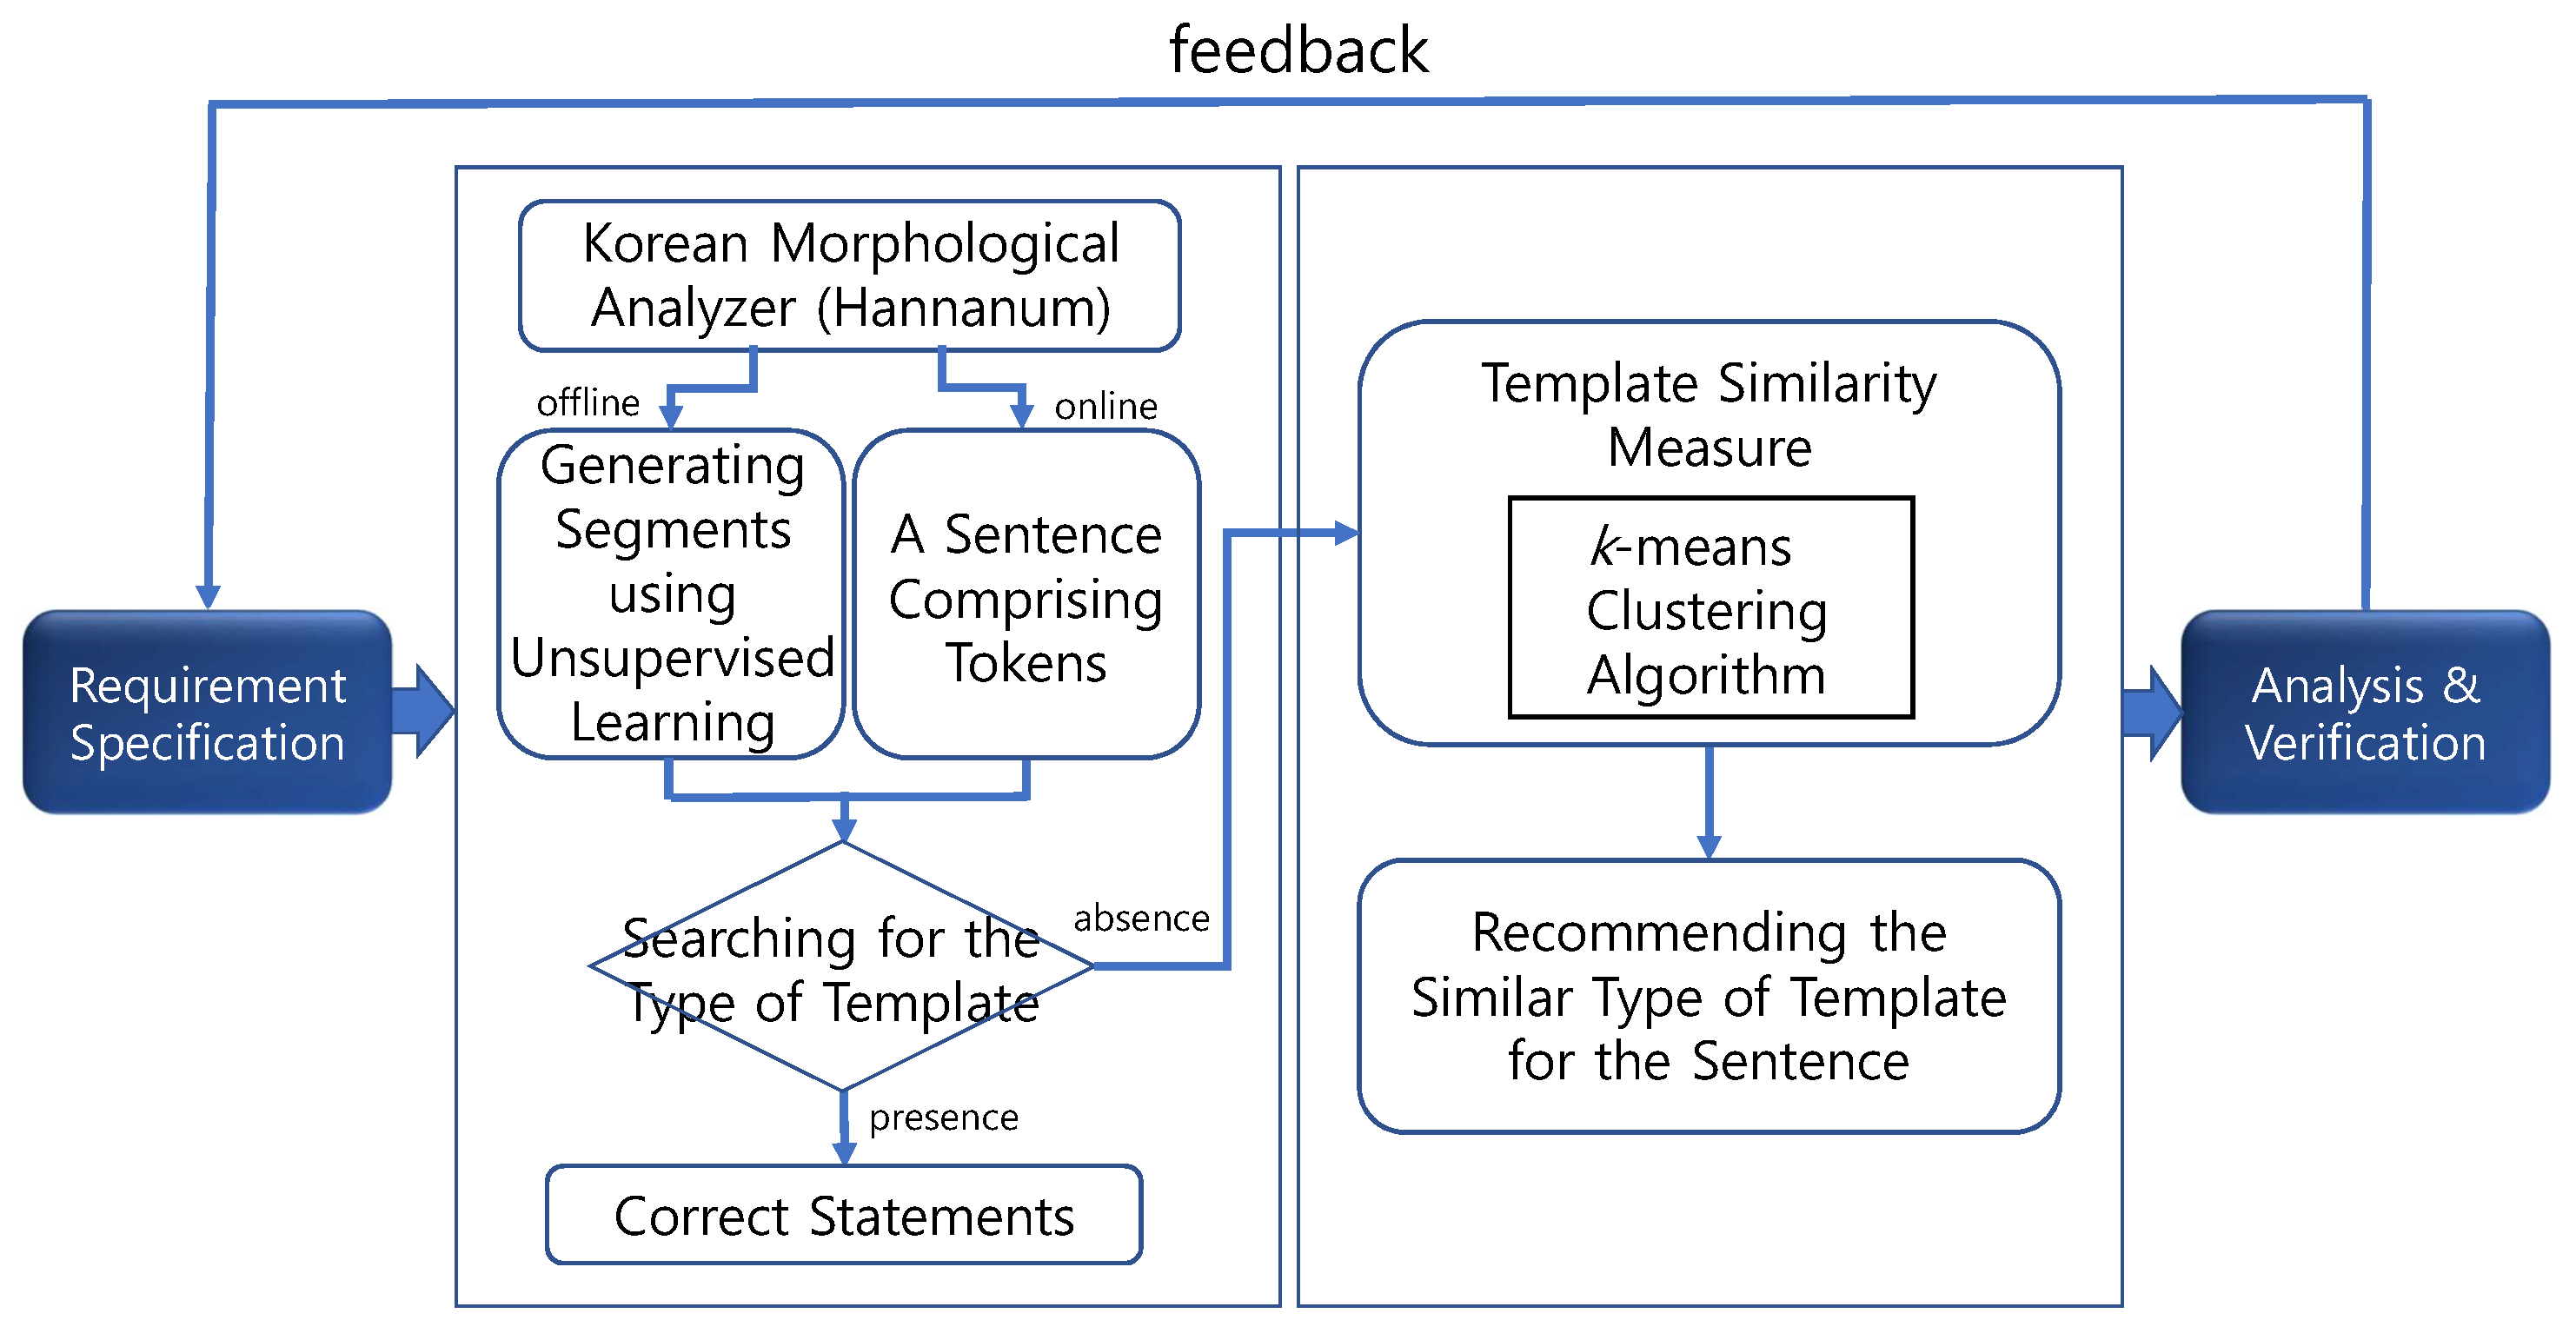
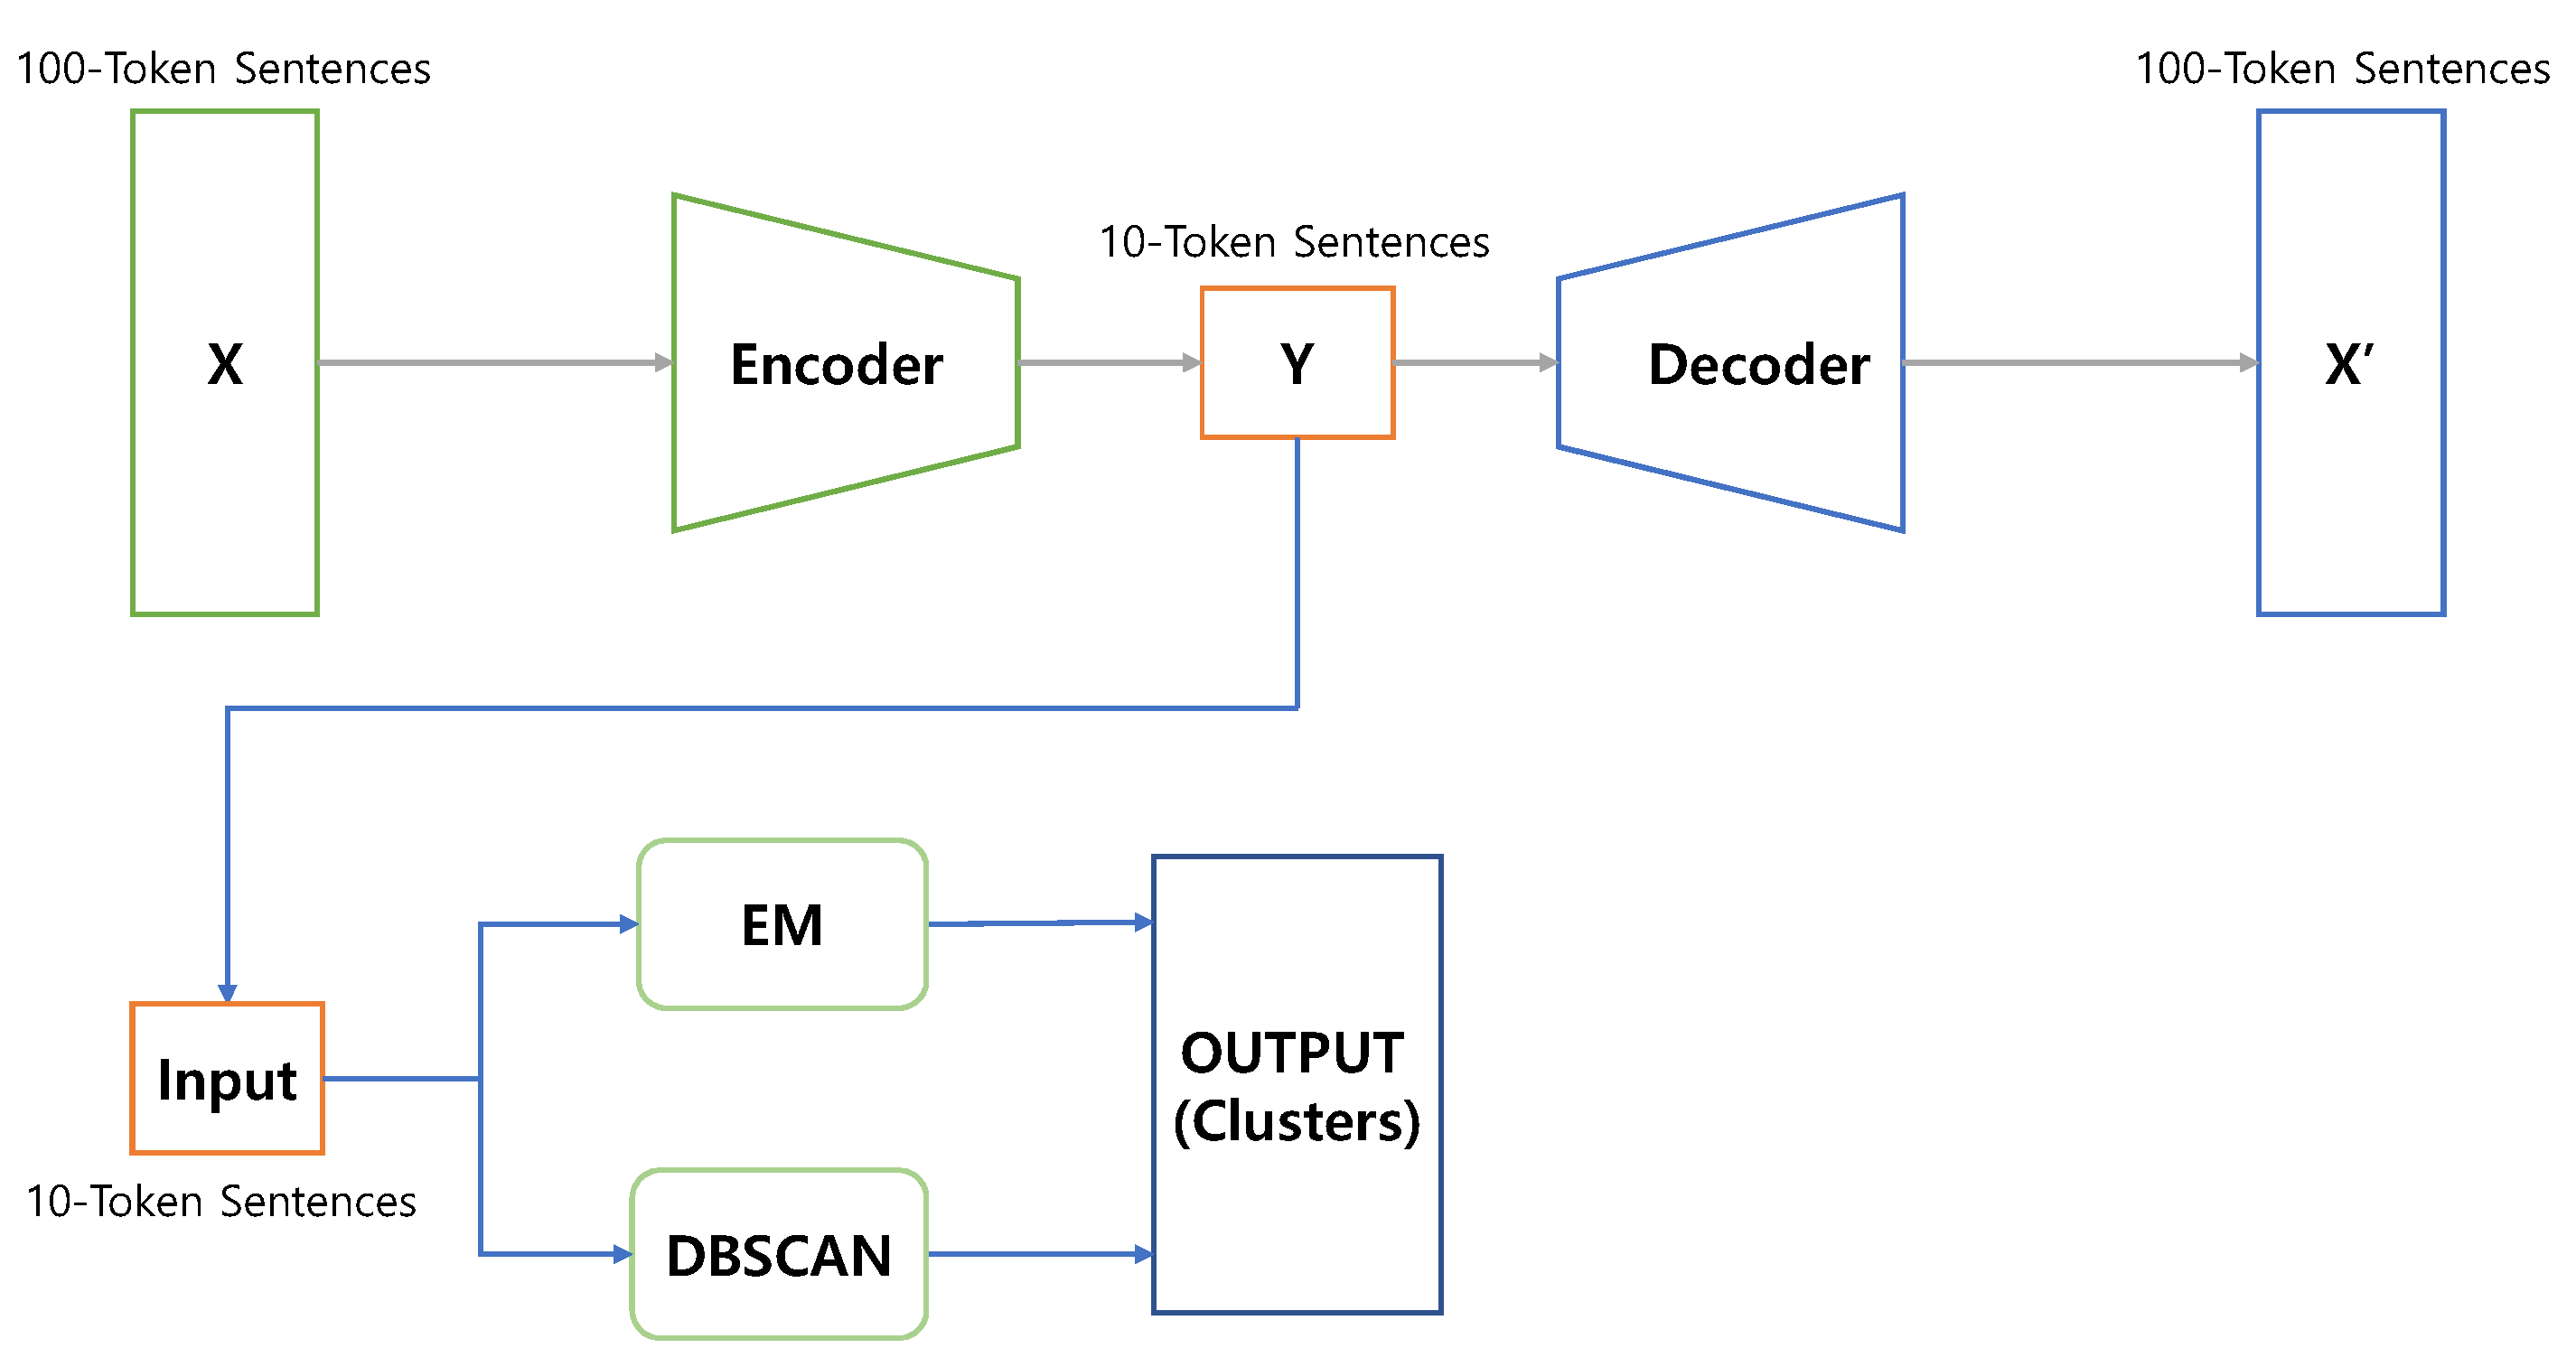
3.1. Design of Automated Checker Using Unsupervised Clustering Techniques

The overall validation process used to prove the correctness of a requirement specification is depicted in Figure 1. When offline, the unsupervised clustering techniques are utilized as a tool to classify a tapestry of sentences into groups (called “clusters”). When online, in the event that a specific input sentence does not belong to one of the templates, the k-means clustering algorithm [22,23,24,25] should recommend a template that closely resembles the syntax of the input sentence.
The validation process in our framework focuses on the syntactic correctness of the statements, which relates to the order of morphemes. In other words, the process will test whether or not the sequence of morphemes is in an accurate order, while comparing them with standard templates that consist of jargon in a particular domain. The sentences used to describe a requirement specification are streamed into the Korean Morphological Analyzer, i.e., Hannanum [26], which outputs a sequence of morphemes. By using unsupervised clustering algorithms, when offline, the sound requirement specifications are categorized into a set of partitions as standard templates. In this paper, the Expectation-Maximization (EM) algorithm [19,20] and Density-Based Spatial Clustering of Applications with Noise (DBSCAN) algorithm [21] are utilized as the unsupervised clustering techniques. The EM and DBSCAN algorithms divide the templates into a set of natural clusters in their own algorithmic way. Then, the k-means clustering algorithm classifies the templates into the k clusters, where the k takes the average of two numbers of natural clusters generated by the EM and DBSCAN algorithms.
After the templates have been compiled and segmented, a new sentence will be inputted to describe the requirement specification. When the sentence is identified with one of the templates, the sentence is confirmed to be a sound and correct specification, as shown in the left-hand part of Figure 1. If the input sentence does not exist in the templates, the k-means clustering algorithm recommends the most similar type of template among the objects that belong to the same cluster, based on the degree of similarity between the input sentence and the template, as shown in the right-hand part of Figure 1. The user could also update a specific requirement specification as syntactically incorrect, while referring to the recommended template.

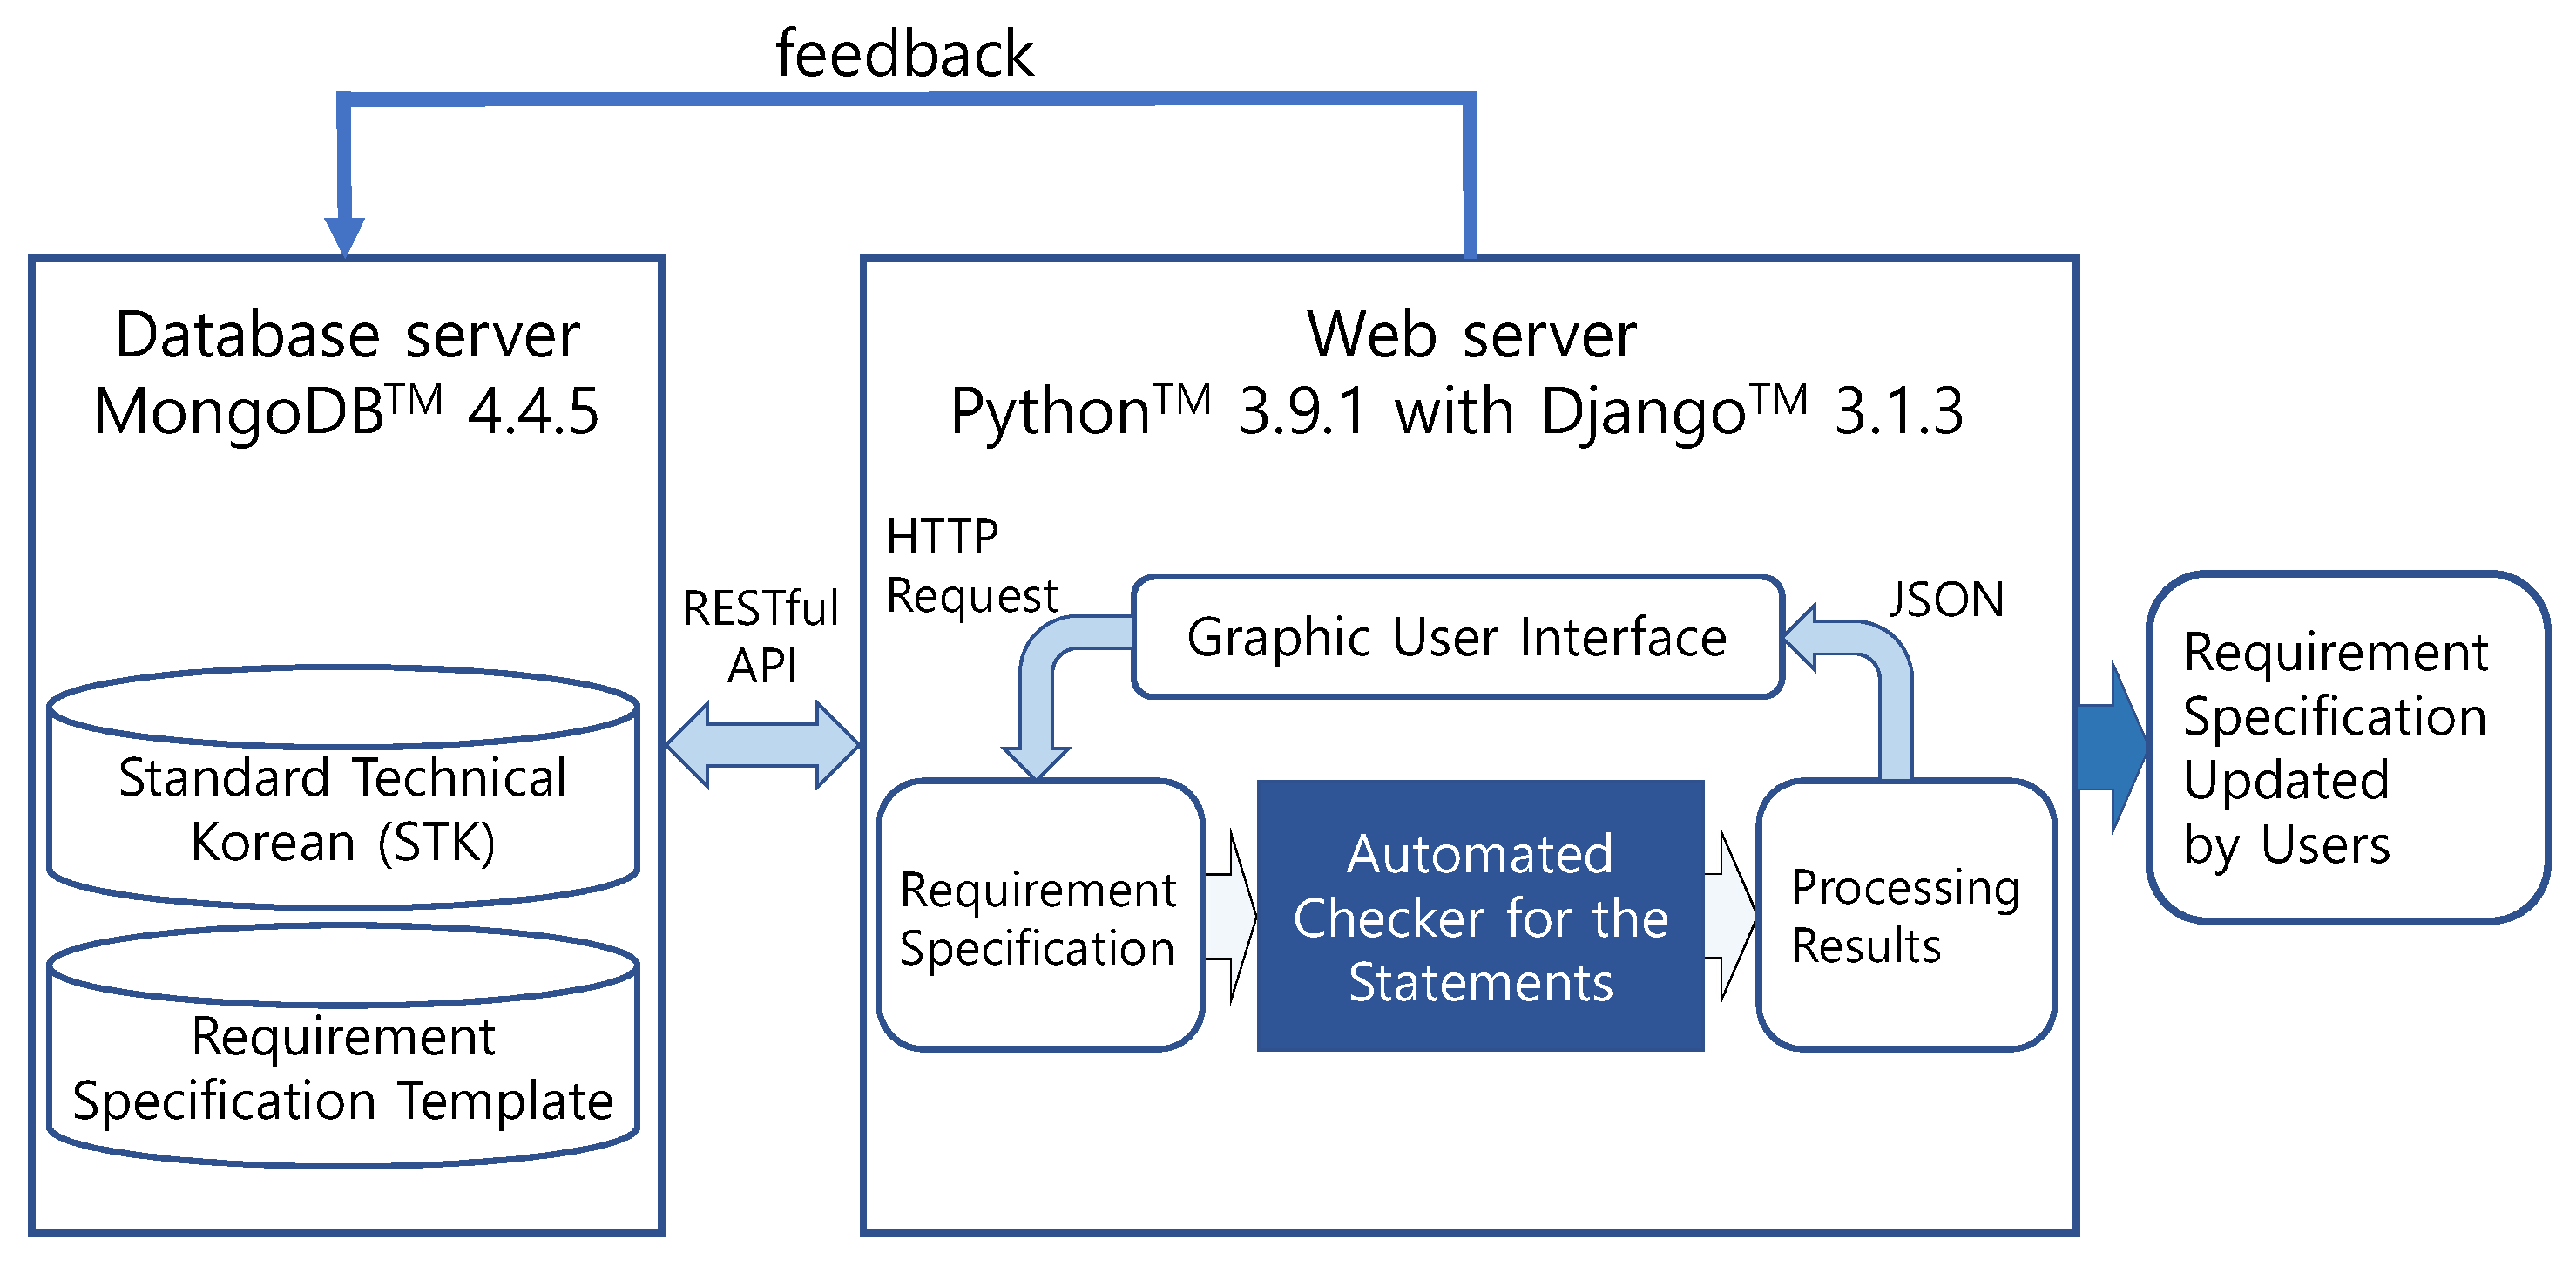
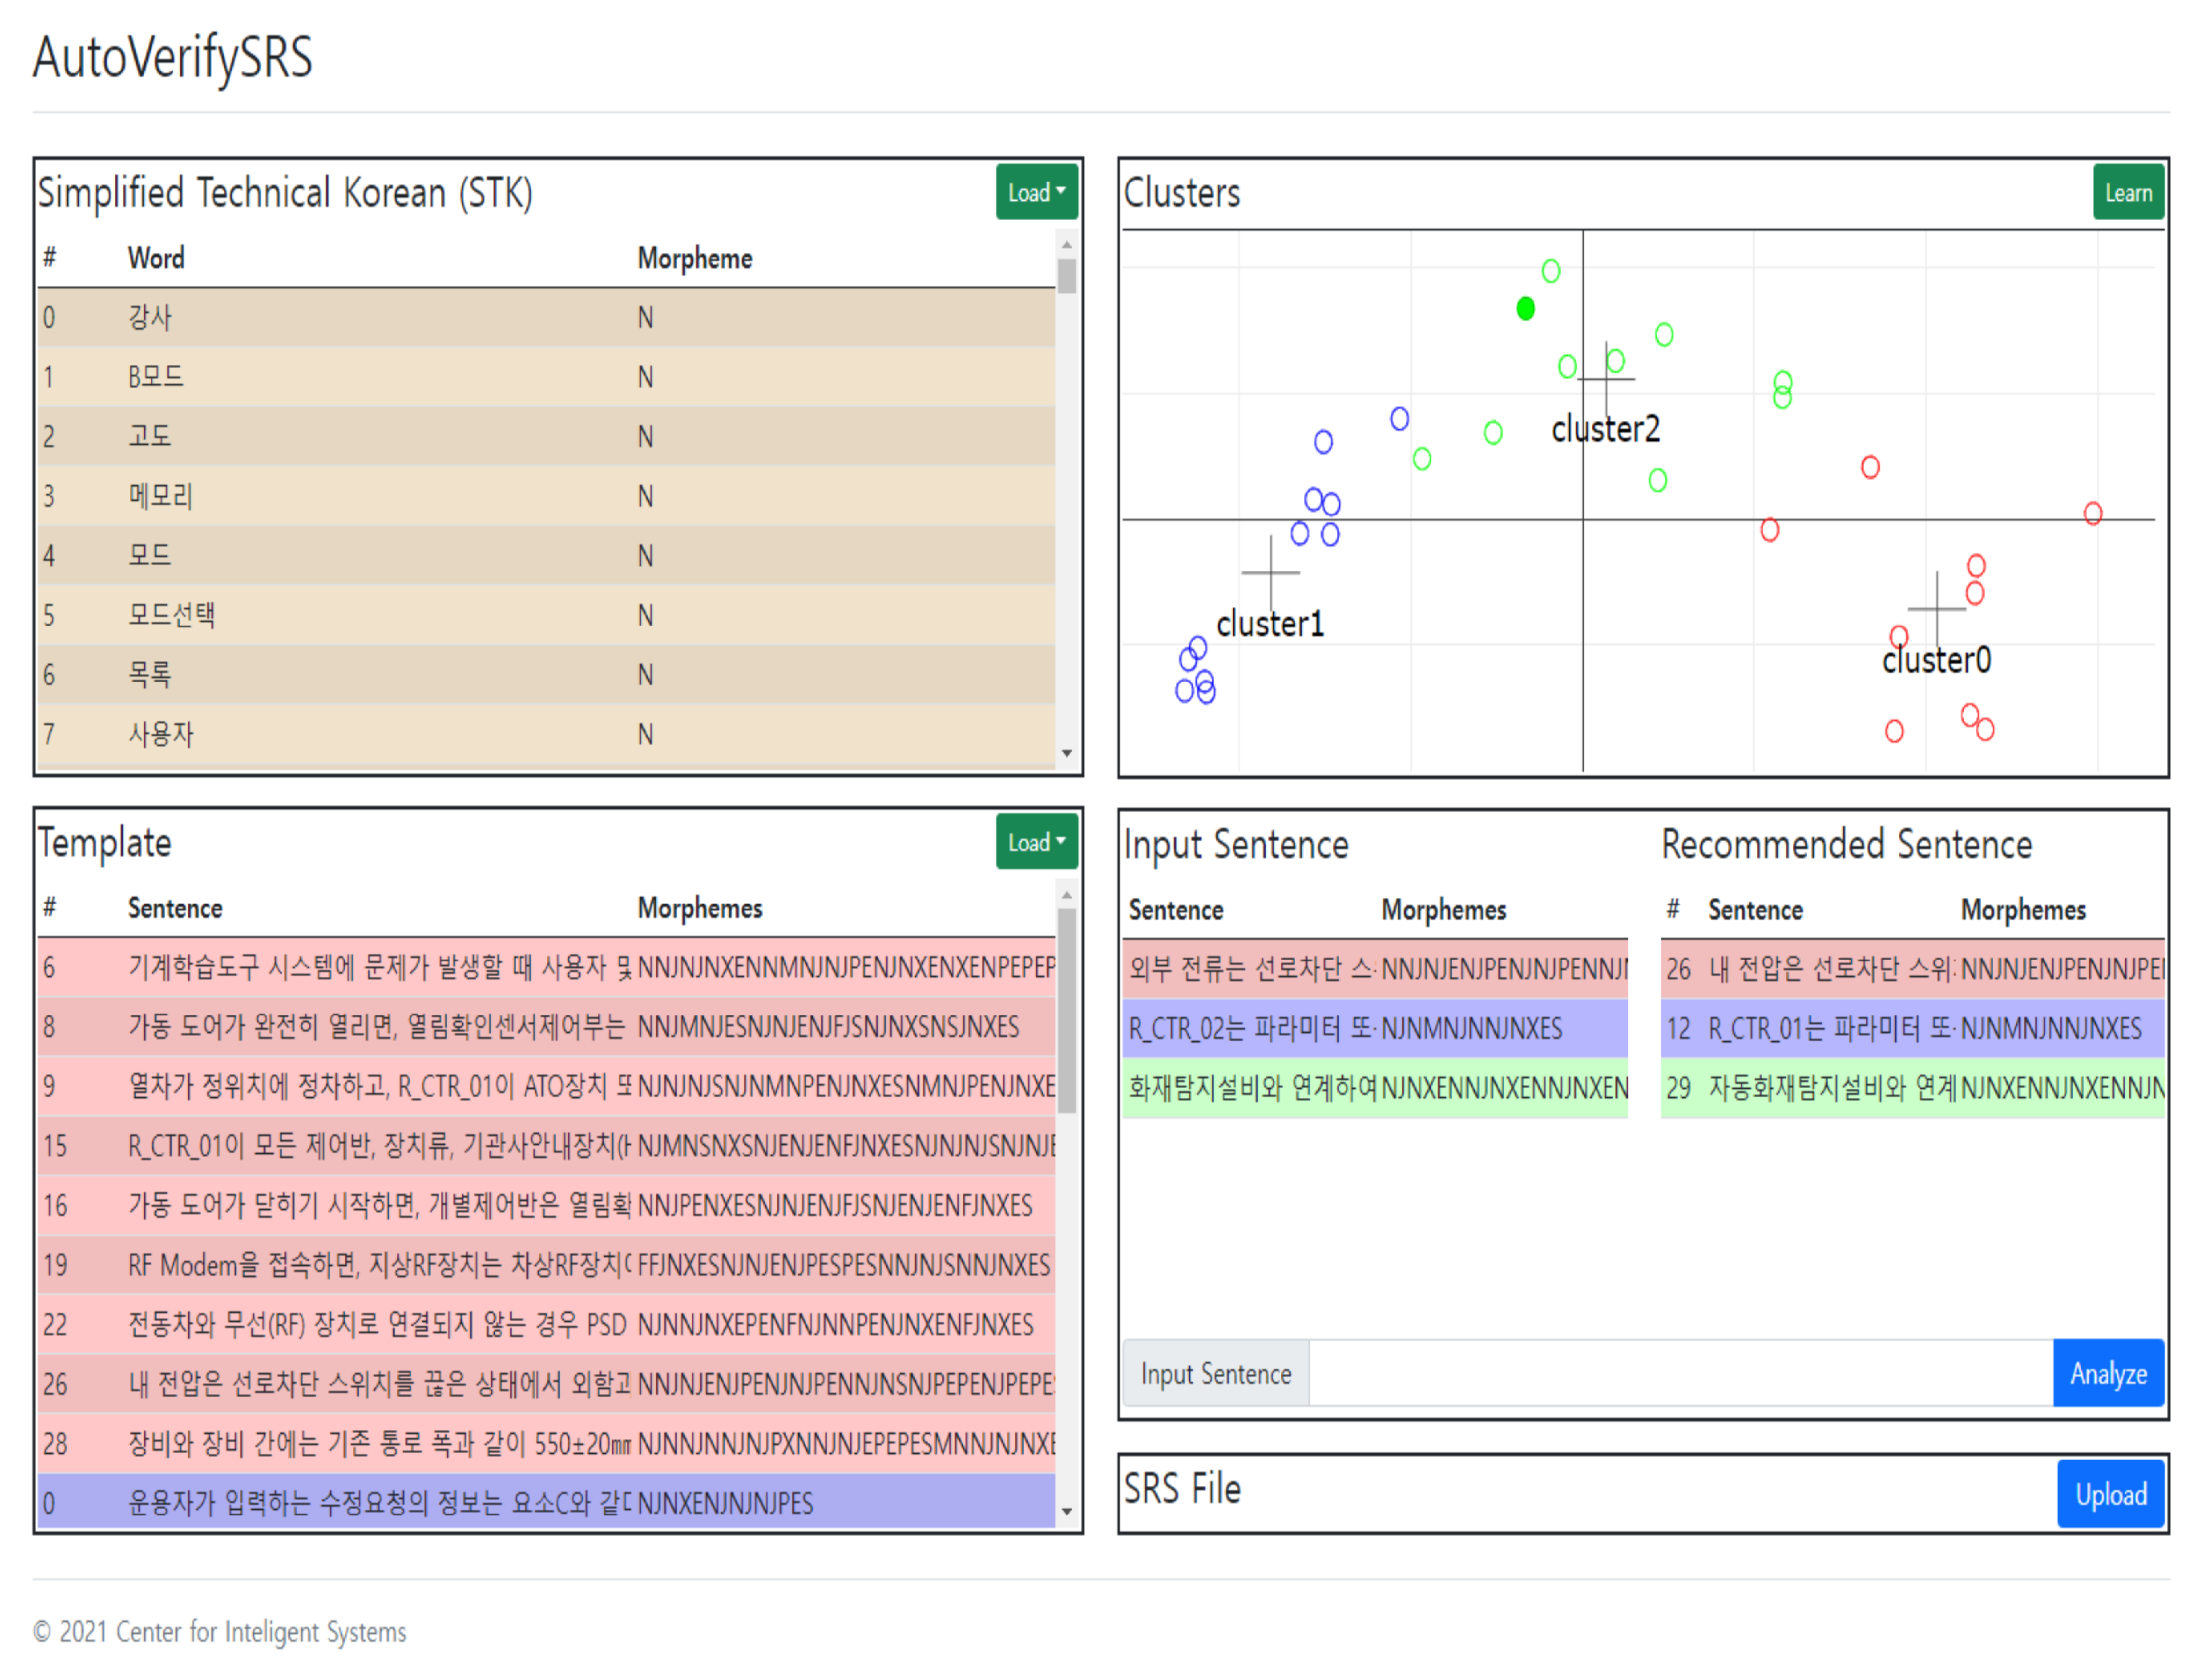
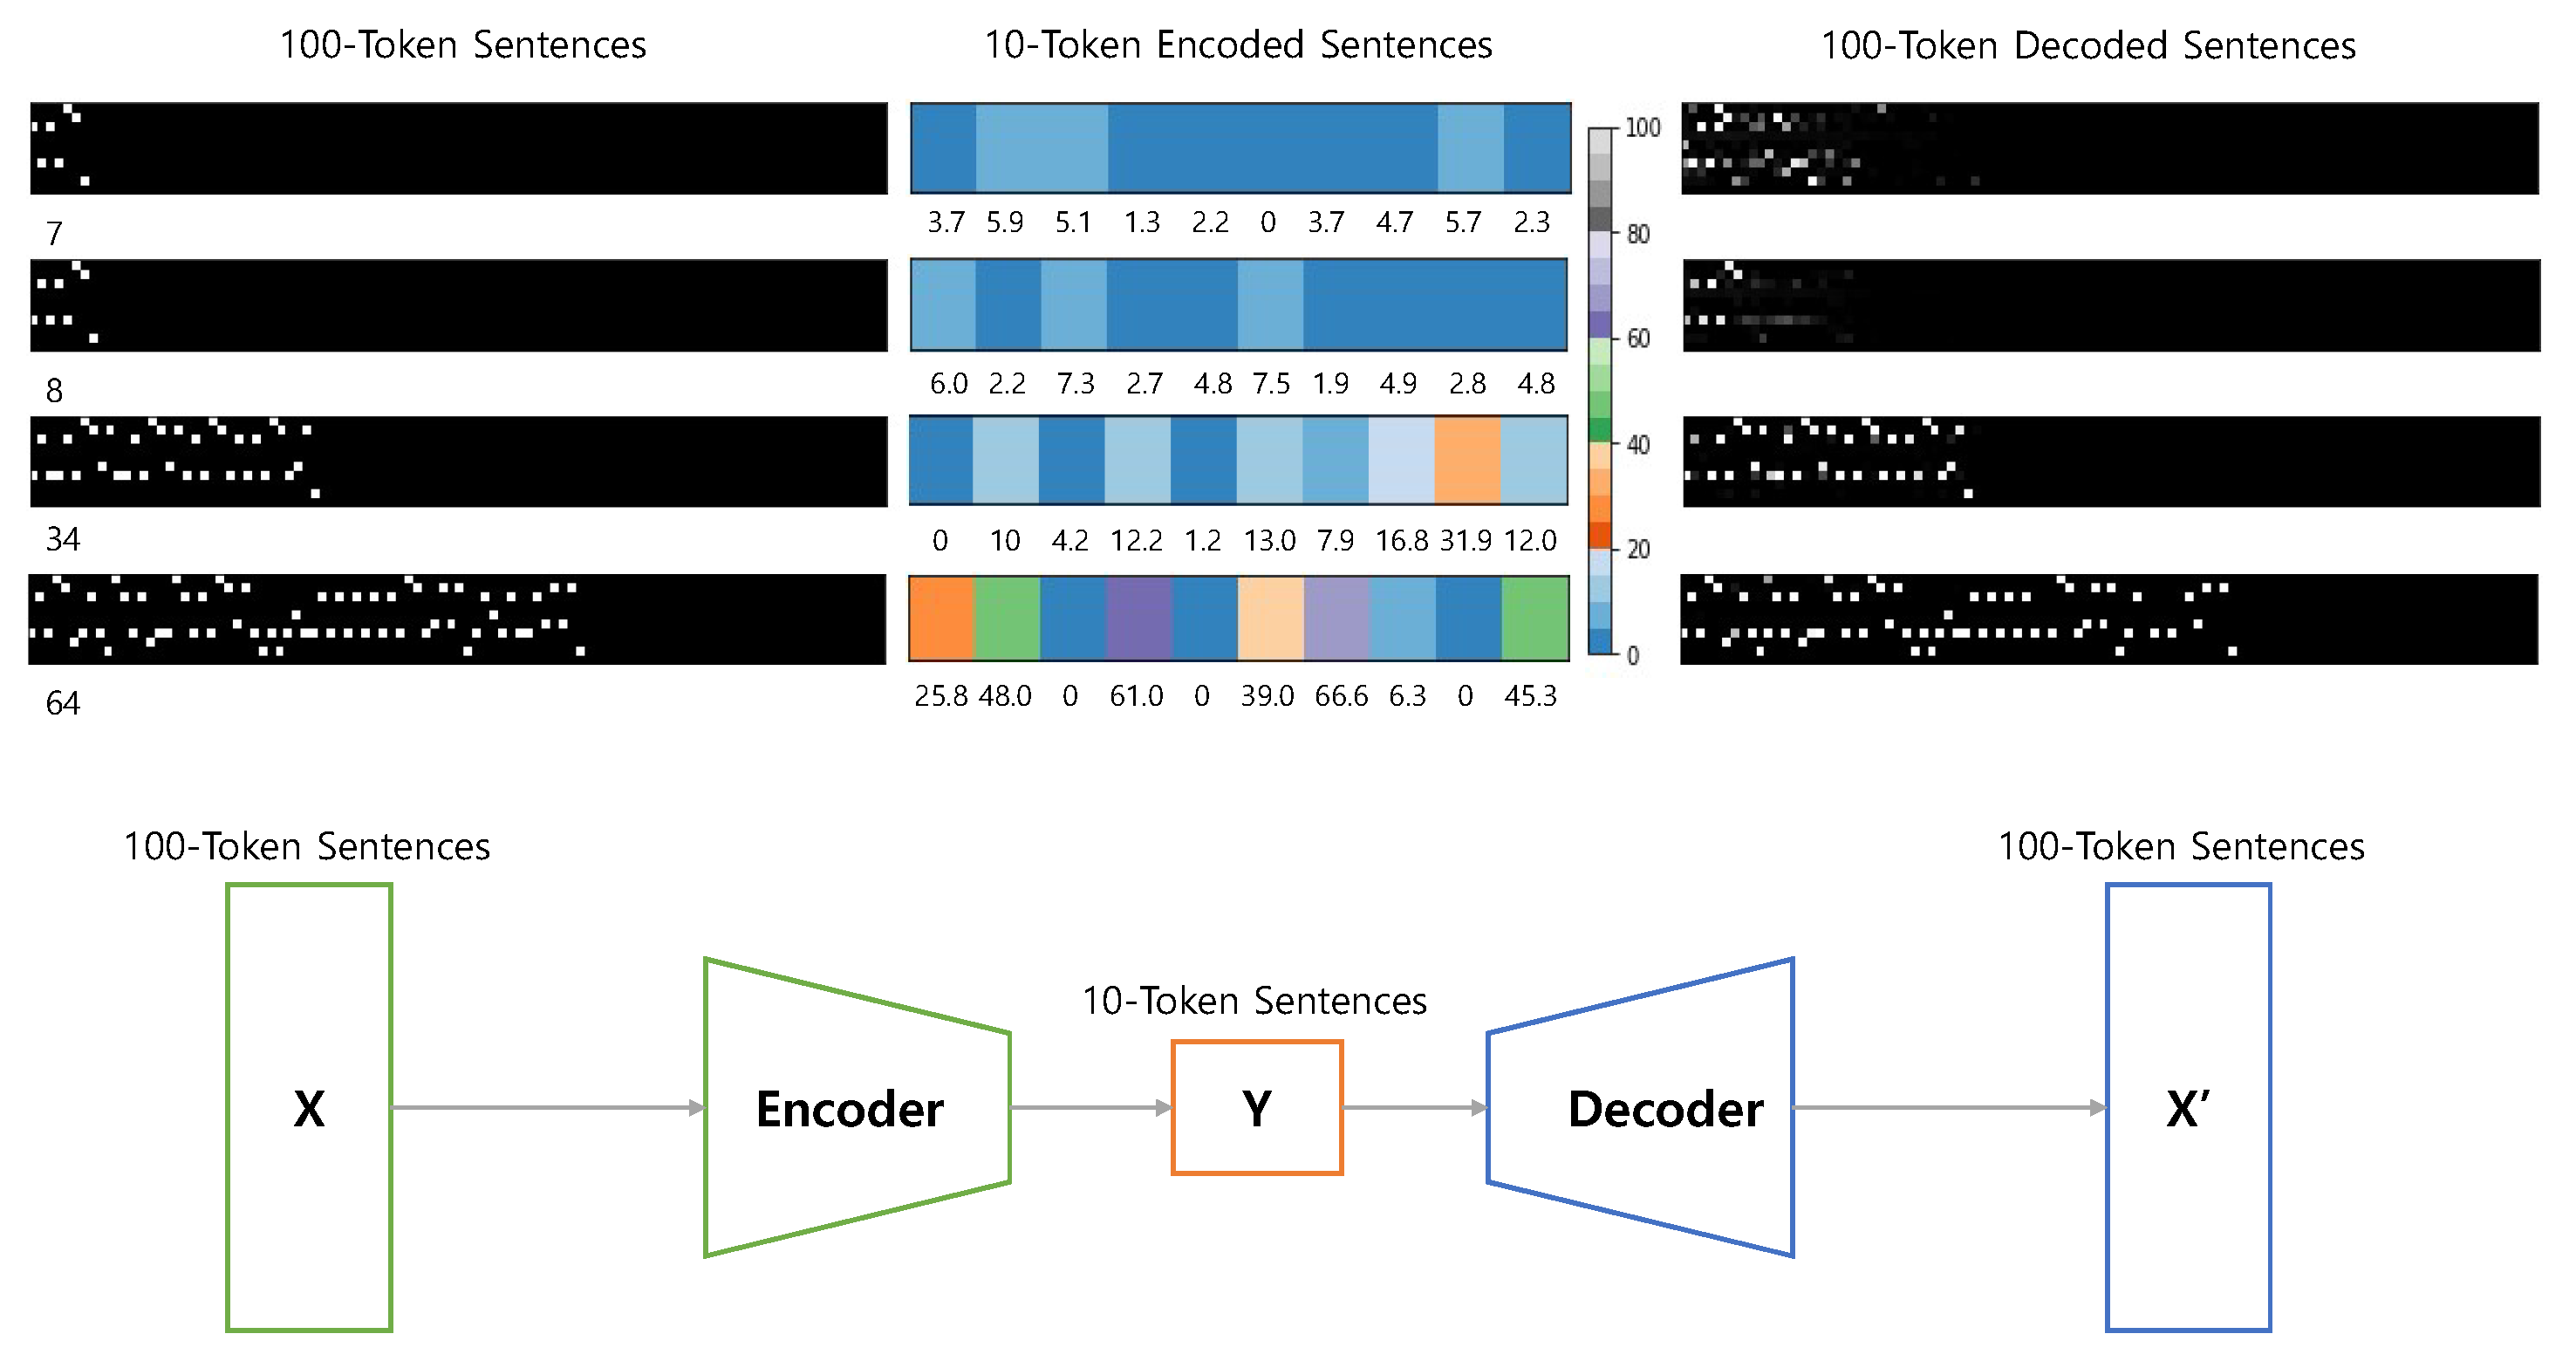
3.2. Implementation of Automated Checker

The automated checker has been implemented by using Python 3.9.1 , the Django 3.1.3 Web development tool, and the MongoDB 4.4.5 database management system. The architecture of our system is illustrated in Figure 2.
The system consists of a database server and a Web server. The database server includes a set of standard technical Korean (STK), which represents jargon in a specific domain, and a group of requirement specification templates as a reference document. The Web server and graphical user interface (GUI) of our system allow users to remotely access our system at any time. From the GUI, a sentence or a file of a requirement specification is fed into the automated checker using the HTTP request. The processing results that prove the soundness of the requirement specification are displayed on the output panel in the open standard format of JSON (JavaScript Object Notation).
An actual screen capture of our system is depicted in Figure 3. As shown in the upper-left part of our system, a set of STK is saved into a database and is loaded from a database that is connected to the GUI on the Web server with the RESTful API. The database of domain-specific templates, which is also connected to the GUI, is displayed in the lower-left part of Figure 3. After the STK and templates are loaded, the k-means algorithm divides the templates of requirement specifications into clusters. The k value should be determined by unsupervised clustering algorithms, i.e., EM and DBSCAN, as mentioned in Section 3.1. The distribution of instances in clusters and their centroids is depicted in the upper-right part of Figure 3. To check the soundness of a requirement specification, users can key in a single sentence in Korean; then, our system returns an identical template if the input sentence exists in the template database. Otherwise, it returns the most similar template that can be used to correct the input sentence. Users could also process the file of sentences with a period in each line, as shown in the lower-right part of Figure 3.

4. Experimental Results

To verify the automated checker that we have developed, as depicted in Figure 3, a set of experiments was conducted with various requirement specifications in the domain of an open platform development for a railway train. The first experiment focused on the method by which our system classifies a tapestry of templates into several clusters. In the second experiment, we measured and analyzed the degree of similarity between new sentences inputted by users and the templates recommended by our system.

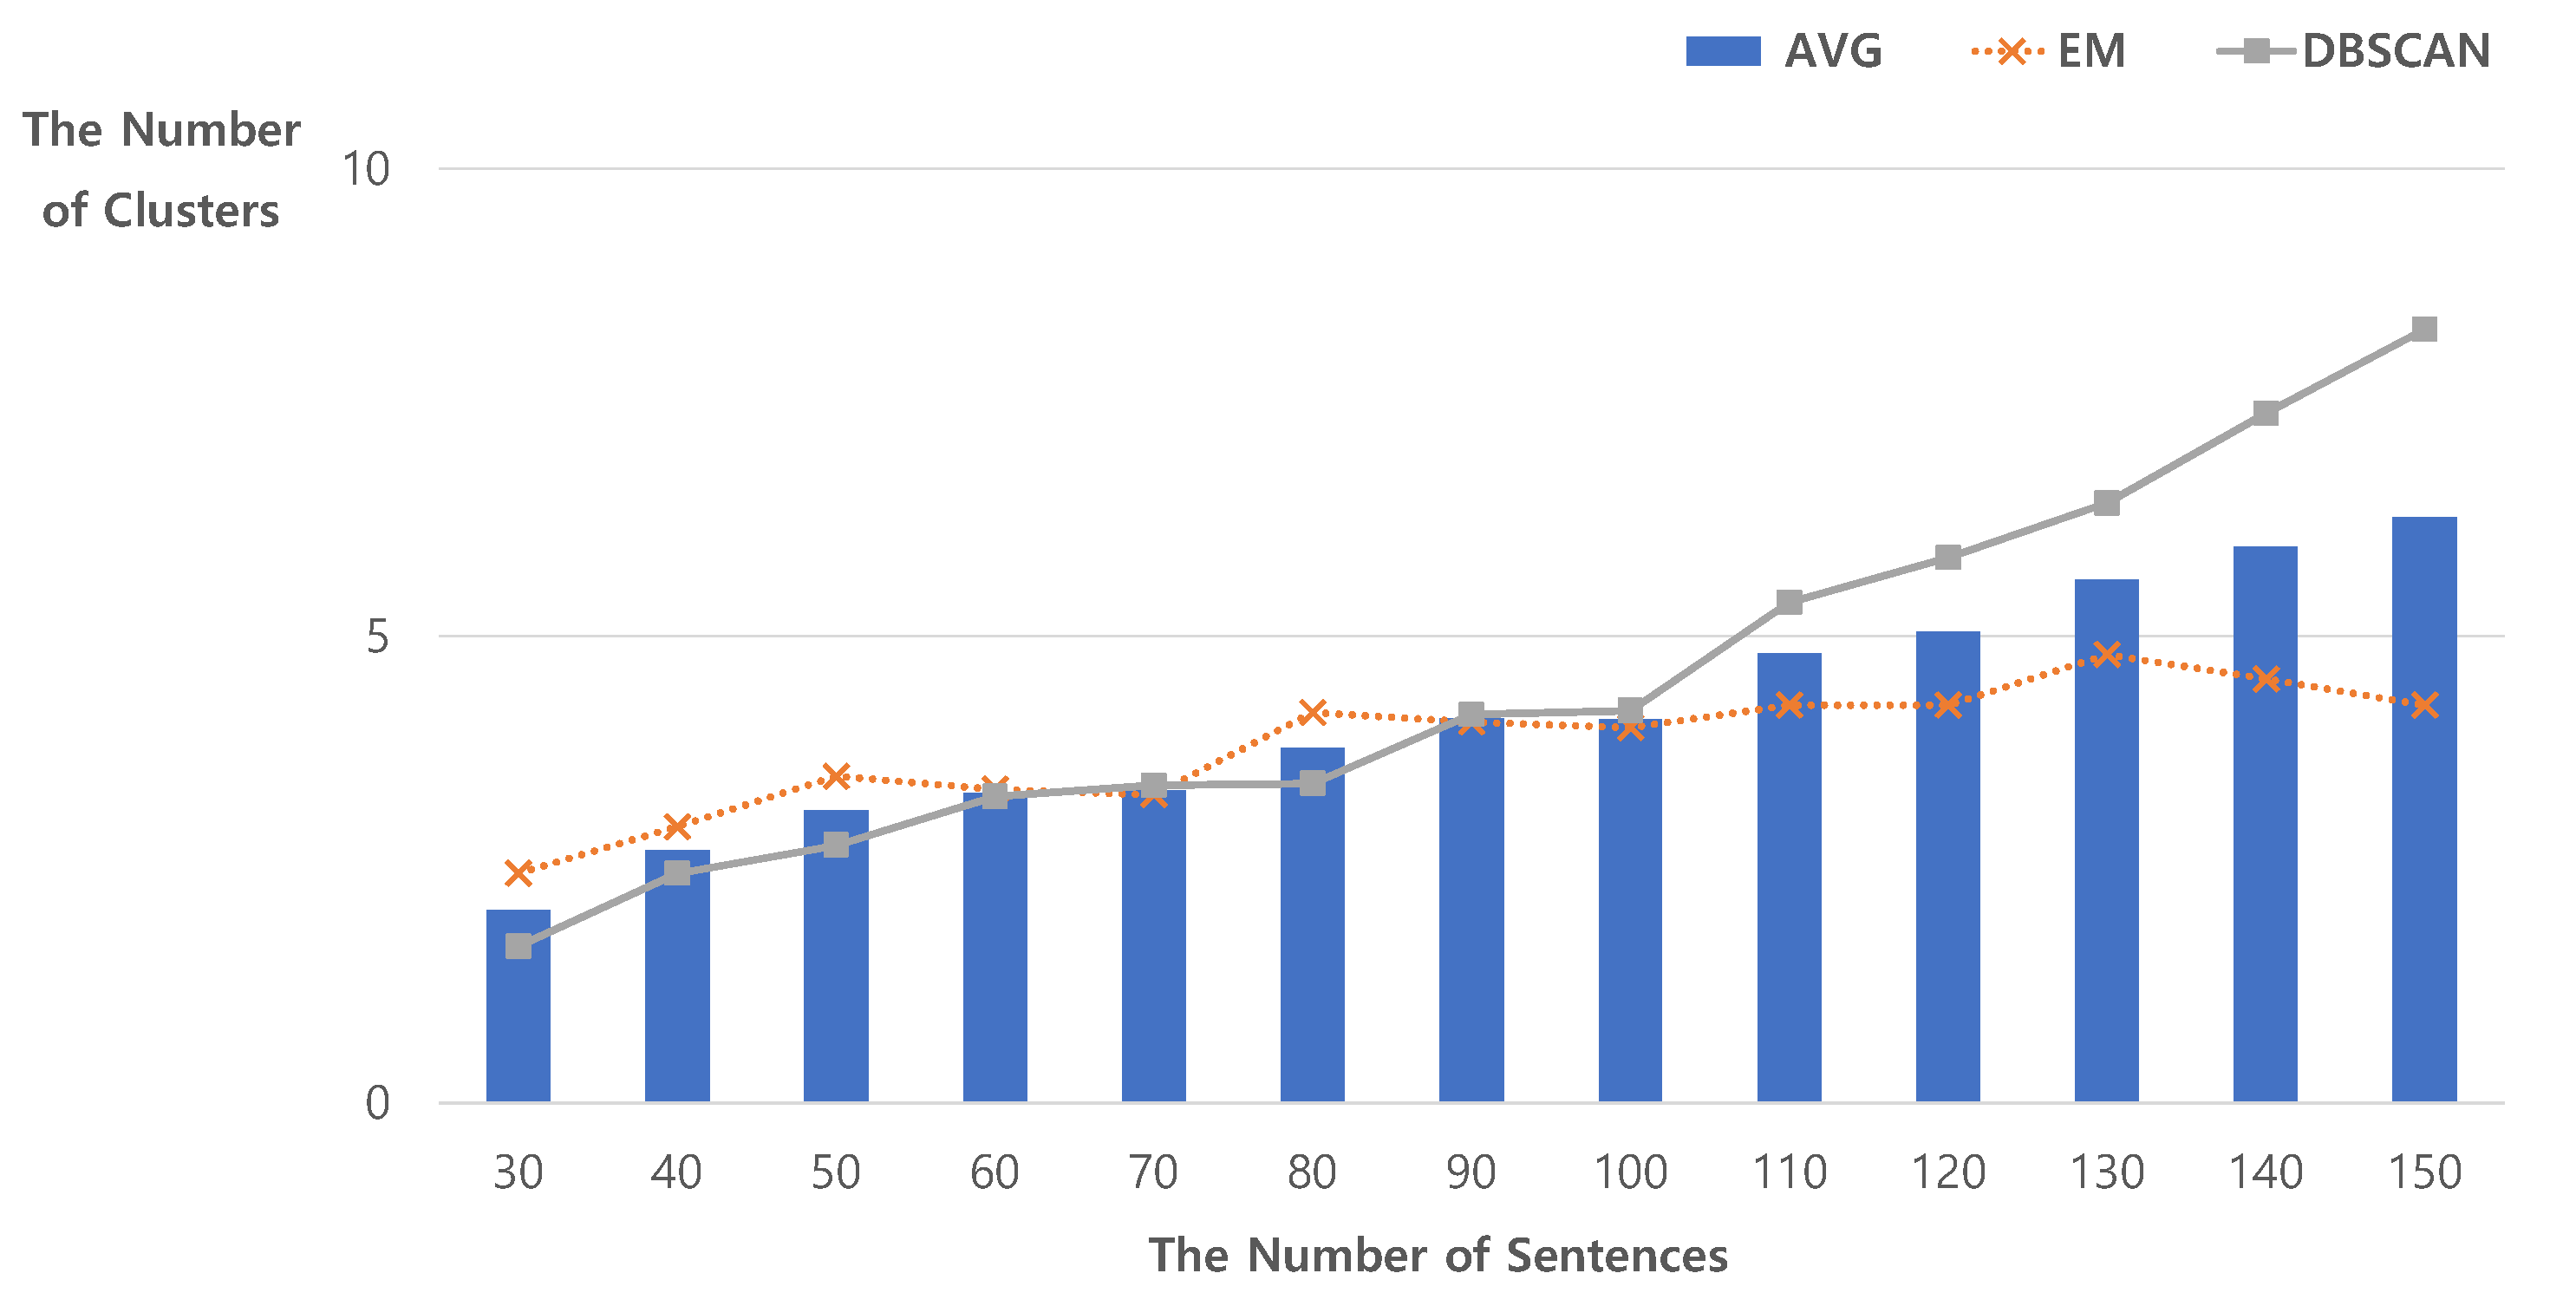
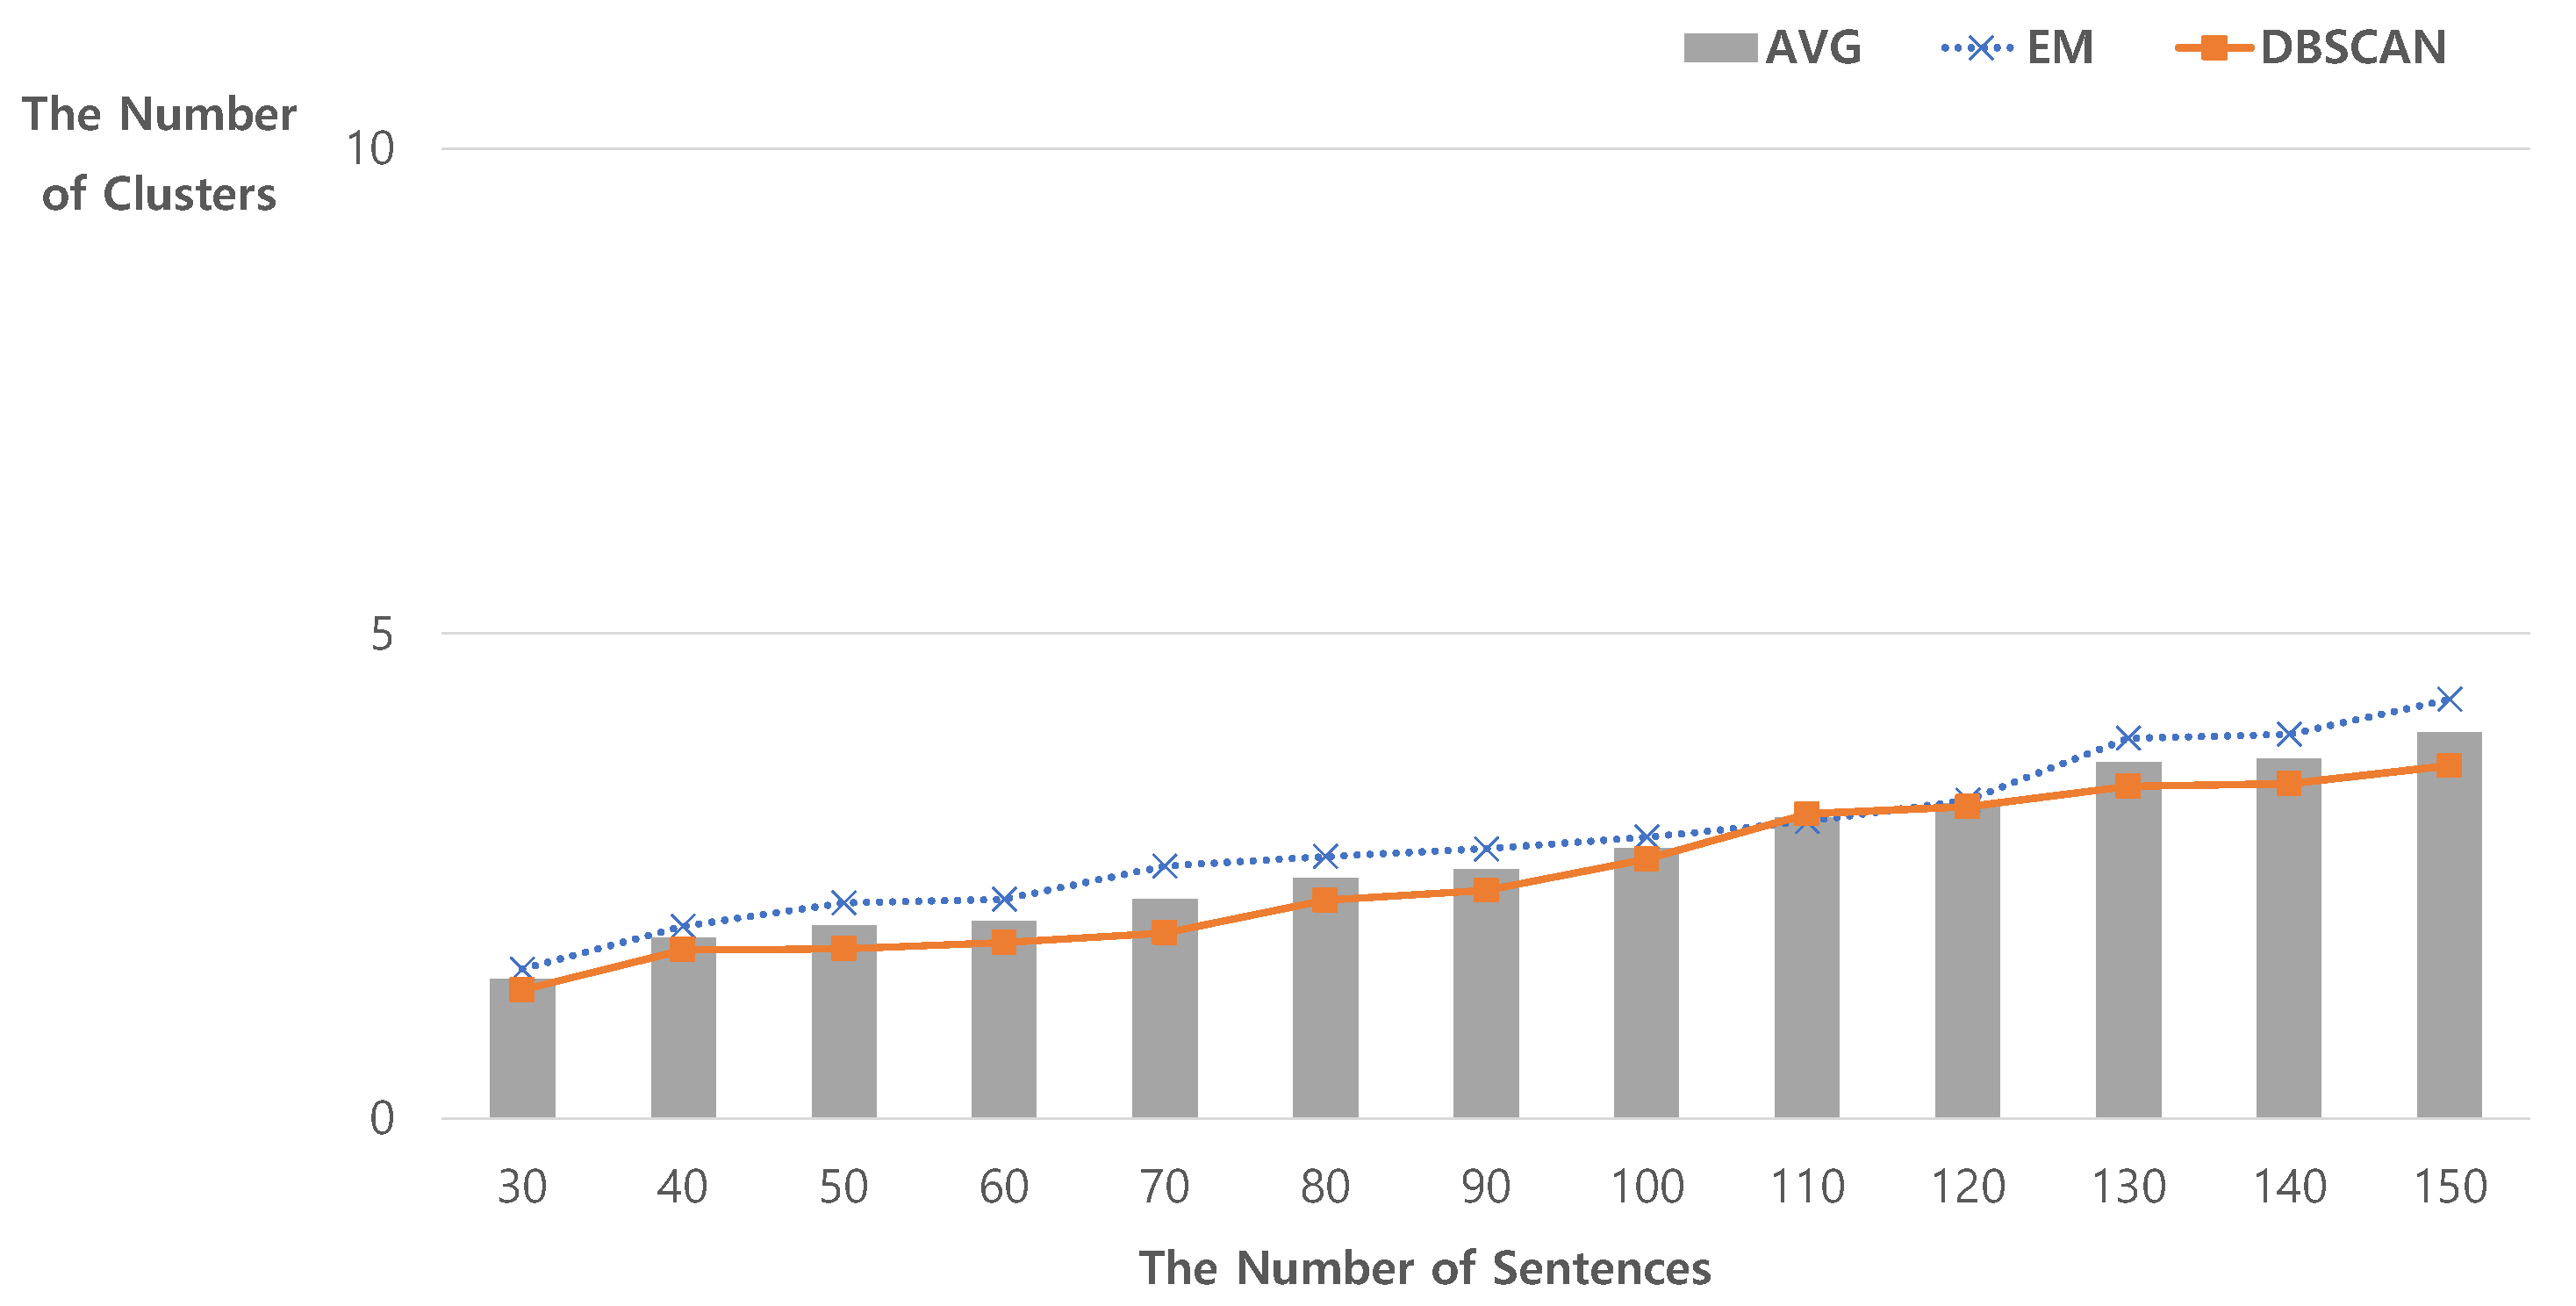
4.1. The Number of Natural Clusters Using Unsupervised Clustering Techniques

To find the appropriate number of clusters for the sentences, the EM and DBSCAN algorithms, as unsupervised clustering techniques, are utilized. The EM algorithm is provided by weka.clusterers.EM of Weka Workbench [27] 3.9.5 and python-weka-wrapper3 0.2.2 . The DBSCAN algorithm is provided by sklearn.cluster.DBSCAN of scikit-learn [28] 0.24.2 , whose critical parameters are as follows: the epsilon ( ϵ ) is 1.75 and the minimum number of samples (minPts) is 3. An instance of these algorithms is given by the sequence of morphemes, which is the output of the Korean Morphological Analyzer, Hannanum, whose maximum length is set to 100 tokens. A total of 150 sentences as templates were tested in this experiment.
As shown in Figure 4, the average number of clusters generated by the EM and DBSCAN algorithms was measured with 30 to 150 randomly sampled instances, after 10 runs were executed for each set of instances. Here, the average number of clusters generated by EM is denoted as A and the average number of clusters generated by DBSCAN is denoted as B. The average of A and B ranges from 2.21 to 6.14 , which is denoted by a bar in Figure 4. As the number of instances increases up to 150, the average of B also increases. In this clustering process of DBSCAN, more clusters could be generated in the event that the number of instances increases, while comparing this value with that of EM. However, when the number of instances ranges from 80 to 150, the average of A is almost the same. When the number of instances is greater than 100, the difference between A and B becomes larger, as depicted in Figure 4. Given a set of templates, the appropriate number of clusters can thus be determined by the average of A and B. In this experiment, the 6.14 clusters as the average of A and B were generated, while 150 instances were given. Because the number of produced clusters was relatively large as compared to the number of input instances, we attempted to lessen the overhead of maintaining the large number of clusters.
To properly maintain the number of attributes, a property of an instance, the maximum number of attributes, was set to 100. In other words, the number of morphemes for any sentence should be less than or equal to 100. In the domain of open platform development for a railway train, all of the statements for requirement specifications can be transformed into a sequence of morphemes with the same length of 100. When a sentence has a relatively short sequence of morphemes, most attributes are filled with an empty attribute, i.e., a null value. Regardless of the length of sentences, some parts of the sequence should also be stuffed with meaningless, null values to preserve the same length.
The approach presented in this paper proposes an efficient method to deal with sparsity caused by null attributes. Figure 5 shows an encoding and decoding procedure [7], which uses the AutoEncoder model within TensorFlow 2.5 . 0 on Python. It also presents an unsupervised clustering process, which uses the EM and DBSCAN algorithms. The encoder, as shown in Figure 5, transforms a 100-token sentence into a 10-token sentence. When an instance of a 10-token sentence is fed into learning techniques in a dimensional reduction format, each clustering algorithm is trained to divide a set of 10-token templates into separate clusters.
Specifically, we apply the autoencoder model to our domain, which maps the input sentences into the coded one. Our model of the autoencoder uses the ADAM optimizer with 40 epochs, when the number of nodes on a hidden layer is clearly smaller than the number of nodes on an input layer. As the number of iterations over the entire training set increased, the mean squared error (MSE) did not start to increase. In other words, we did not observe any overfitting while increasing the number of epochs in the experiment. Figure 6 presents a graphical representation of 100-token original sentences, 10-token encoded sentences, and 100-token decoded sentences, which were visualized in Python with Matplotlib  3.4.2 .
In Figure 6, the 100-token sentences and their decoded sentences are plotted in a black box with white dots, which correspond to morphemes in a 100-token sentence. In these patterns, fewer white dots in a black array represent a shorter sentence, such as the uppermost sentence among the four instances in Figure 6. The encoder compresses a 100-token sentence into a low-dimensional 10-token sentence while removing null attributes. Since the encoder attempts to reduce noise, i.e., null values, in our domain, the low-dimensional 10-token sentence contains the core properties of the morphemes. An instance of a 10-token sentence composed of meaningful attributes is fitted into a 10-cell array, whose cell denotes the degree of sparsity. For example, in the uppermost sentence in Figure 6, the 10-token sentence consists of cells with small values, which is a relatively short sentence. On the other hand, when observing the lower sentence, the array is composed of cells with large values, which is a long sentence. In the encoding and decoding procedure, the decoder maps the 10-token encoded sentences into the sentences reconstructed by 100 tokens. By using our model of autoencoder, we have tested the reliability of the encoding and decoding procedure on 150 sentences. Given the fact that the 100-token original sentences on the left of Figure 6 were very similarly transformed into the 100-token decoded sentences on the right, we can conclude that the application of the autoencoder model to our domain was successful and the method is dependable.
The encoder in Figure 5 transformed a 100-token sentence into a 10-token sentence. When an instance of a 10-token sentence was finally fed into two clustering techniques in a dimensional reduction format, each of them was trained to divide a set of 10-token templates into separate clusters. When 10-token encoded sentences were given as input instances, the number of clusters using EM and DBSCAN was measured and averaged over ten runs for each set of instances. As declared above, the average number of clusters generated by EM is denoted as A and the average number of clusters generated by DBSCAN is denoted as B. The average of A and B increased from 1.42 to 3.26 , which is denoted by a bar in Figure 7. While referring to the results shown in Figure 4, i.e., the average of A and B without autoencoding ranges from 2.21 to 6.14 , the average number of clusters with autoencoding was maximally reduced by 2.88 (=6.14−3.26). As the number of instances increased up to 150, the average of number of clusters slightly increased. In comparison to the experimental result shown in Figure 4, the result of A is highly similar to the result of B, as shown in Figure 7. When an instance of a 10-token sentence is fed into two clustering techniques, i.e., EM and DBSCAN, the average of A and B is drastically reduced from 6.14 to 3.26 clusters, in the case of 150 instances. Our efforts to maintain a reduced number of clusters led the automated checker with autoencoding to provide similar templates as quickly as possible.

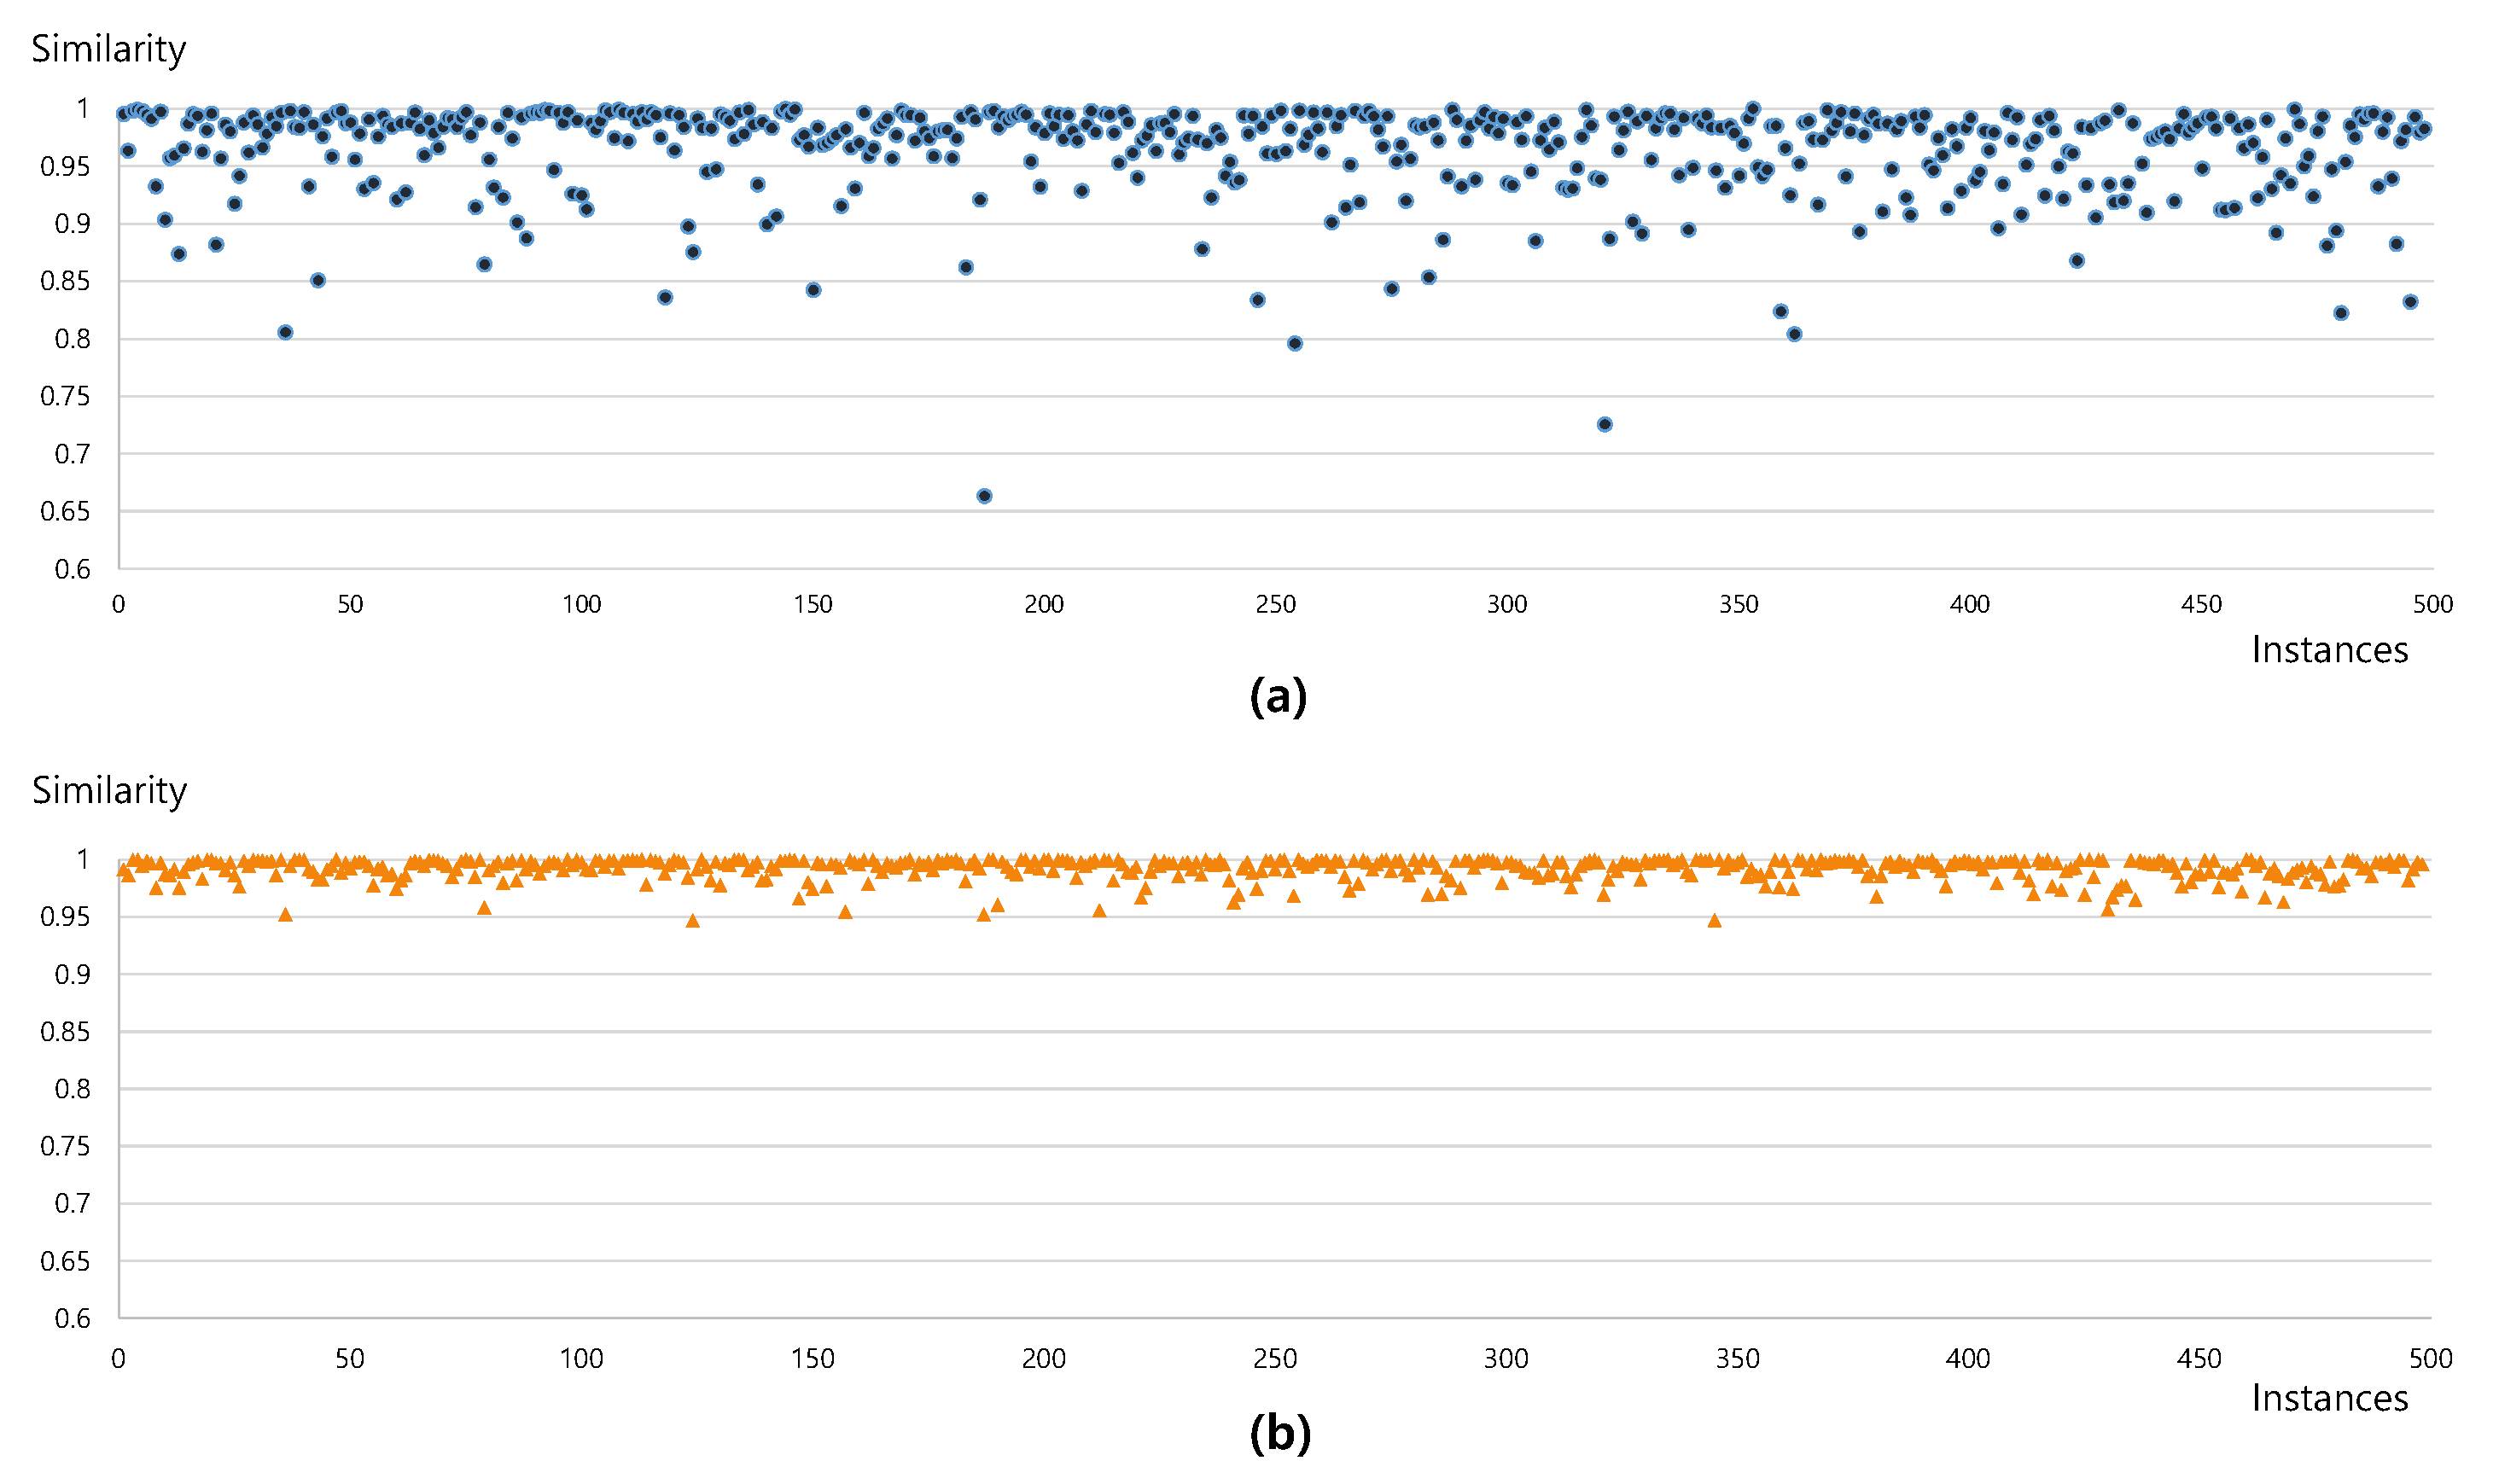
4.2. Recommending Similar Templates Using k-Means Clustering Algorithm

The k-means clustering algorithm is used to separate a set of templates into clusters. Then, it recommends a specific template that is syntactically similar to the structure of the input sentence. Using the Euclidean distance metric and the cosine similarity metric [29], the k-means clustering algorithm produces a recommendation of a template that is closest to the input sentence, which is shown in Figure 8.
Figure 8 shows the distribution of similarity between the input sentence and its closest template, which both belong to the same cluster that has been classified through the k-means clustering algorithm. Based on the result of Figure 7, the k-means clustering algorithm partitions 500 instances into three clusters, which is indicated as the k value in this experiment. Then, using the Euclidean distance and cosine similarity metric, the degree of similarity is measured across 500 instances that do not currently exist in the template database. For inputted instances, a single morpheme from a sequence of morphemes in a specific template is randomly selected; a single unit in a template has been replaced with a different morpheme and the other units remained intact. After generating 500 instances in this manner, we compared them with the recommended templates to test the degree of similarity between the two.
Since the k-means clustering algorithm using the Euclidean distance provides the distance between an instance and the center of a cluster, it can be used to quantify the level of similarity between two instances. Here, within a cluster, the Euclidean distance from the input sentence to the center of the cluster is S, the Euclidean distance from the recommended template to the center of the cluster is T, and the difference between S and T is U. The Euclidean distance of the farthest instance from the center of the cluster is P, the Euclidean distance of the closest instance to the center of the cluster is Q, and the difference between P and Q is R. Using these values, the normalized similarity is calculated as 1 ( U / R ) and indicated on the y axis of Figure 8a. When the formula of the normalized similarity is applied to the 500 instances, the minimum value of similarity is 0.6632 , the maximum is 0.9999 , and the average is 0.9693 ± 0.0410 .
The resulting performance of the k-means clustering algorithm using the cosine similarity metric was also measured for 500 instances, as shown in Figure 8b. The cosine similarity metric measures the similarity between the newly created input instance and a specific template; when the value is closer to 1, the inputs are more similar to the templates. The distribution of similarities using the cosine similarity metric is summarized as follows: the minimum is 0.9466 , the maximum is 0.9998 , and the average is 0.9927 ± 0.0094 . In comparison to the experiment that used the Euclidean distance metric, the experiment using the cosine similarity metric showed better performance, where the results ranged from 0.9466 to 0.9998 , as depicted in Figure 8b. Since the average similarity achieved using these two metrics was over 97.00 % , we demonstrate that our framework successfully recommends templates that are highly similar to the syntax of the input sentence.

5. Conclusions and Future Research

In this paper, we propose a method to review the syntactic correctness of requirement specifications and implement an automated checker to assess the recommendation process of appropriate templates in the domain of an open platform development for a railway train. After confirming the accuracy of the recommendations, we plugged the entire process into an automated checker that displays a database of STK, a set of templates, the formation of clusters, inputted sentences, the result of syntactic correctness, and the recommended templates. Our system enables users to verify whether or not their requirement specifications are syntactically valid and to modify incorrect ones while referring to the most similar templates.
When users are developing a large-scale system, they wish to compose a cohesive and accurate requirement specification for clear communication. For this purpose, we built a system that can automatically verify the syntactic soundness of sentences and continuously process the recommendation of a relevant template. Using our system, we evaluated the performance of cluster generation without specifying the number of clusters. Based on the clusters, we calculated the level of similarity between an input sentence and a template. We found that our system was able to successfully recommend templates that were syntactically close to the input sentence, because the degree of similarity was over 97.00 % on average.
The development of this automated checker contributes to the setup of a well-established development environment and to the reduction in the system development costs. For future research, the proposed framework in our system could be applied to various system development settings where accurate and concise requirement specifications are required. The databases of technical jargon and templates could be continuously expanded, even if sentences are written in other languages—for example, in English. In parallel, the performance of our system will be tested in the event that the size of the STK and number of templates incrementally increase, while maintaining the dynamic number of clusters in a data set. Currently, our system can provide users with recommendations that improve the cohesiveness of requirement specifications. We aim to ultimately develop a system that can adaptively deal with additional specifications that occur in a system development life cycle.

Author Contributions

Conceptualization, S.N. and K.C.; methodology, S.N.; software, S.N.; validation, S.N., K.C. and J.S.; formal analysis, S.N.; investigation, S.N.; resources, S.N., K.C. and J.S.; data curation, S.N.; writing—original draft preparation, S.N.; writing—review and editing, S.N.; visualization, S.N.; supervision, S.N.; project administration, K.C.; funding acquisition, J.S. All authors have read and agreed to the published version of the manuscript.

Funding

This work has been supported by Deltaindex, Inc. (S-2021-C2171-00001) granted in the program years of 2021 and 2022, and also by the Catholic University of Korea research fund (M2020B000200128) granted in the program year of 2020.

Institutional Review Board Statement

Not applicable.

Informed Consent Statement

Not applicable.

Data Availability Statement

All data included in this study are available upon request. Please contact Sanguk Noh at sunoh@catholic.ac.kr.

Acknowledgments

The authors would like to thank their students, Seokgun Hwang, Jaehun Choi, Moonsik Park, and Hunwoo Park, for their help in implementing the automated checker to syntactically review requirement specifications.

Conflicts of Interest

The authors declare no conflict of interest.

Abbreviations

The following abbreviations are used in this manuscript:
CNLControlled Natural Language
STKStandard Technical Korean
EMExpectation-Maximization algorithm
DBSCANDensity-Based Spatial Clustering of Applications with Noise algorithm
RESTful APIREpresentational State Transfer Application Programming Interface
JSONJavaScript Object Notation
MSEMean Squared Error

References

  1. Kuhn, T. A survey and classification of controlled natural languages. Comput. Linguist. 2014, 40, 121–170. [Google Scholar] [CrossRef]
  2. ASD (AeroSpace and Defence Industries, Association of Europe). Simplified Technical English. In Specification ASD-STE100; European community trade mark No. 017966390; European Community: Brussels, Belgium, 2021; 382p. [Google Scholar]
  3. Congree Language ©. Machine-Aided Author Assistance for Simplified Technical English. Karlsbad, Germany, 2019. Available online: www.congree.com (accessed on 1 July 2022).
  4. MacKay, D. Chapter 20—An Example Inference Task: Clustering. In Information Theory, Inference and Learning Algorithms; Cambridge University Press: Cambridge, UK, 2003; pp. 284–292. [Google Scholar]
  5. Pourrajabi, M.; Moulavi, D.; Campello, R.J.G.B.; Zimek, A.; Sander, J.; Goebel, R. Model Selection for Semi-Supervised Clustering. In Proceedings of the 17th International Conference on Extending Database Technology (EDBT), Athens, Greece, 24–28 March 2014; pp. 331–342. [Google Scholar]
  6. Amorim, R.C.; Hennig, C. Recovering the number of clusters in data sets with noise features using feature rescaling factors. Inf. Sci. 2015, 324, 126–145. [Google Scholar] [CrossRef] [Green Version]
  7. Goodfellow, I.; Bengio, Y.; Courville, A. Chapter 14. Autoencoders. In Deep Learning; MIT Press: Cambridge, MA, USA, 2016; pp. 499–523. Available online: http://www.deeplearningbook.org (accessed on 1 July 2022).
  8. European Commission, Directorate-General for Translation. How to Write Clearly. Publications Office, 2011. Available online: https://data.europa.eu/doi/10.2782/29211 (accessed on 15 June 2022).
  9. Waller, R. What Makes a Good Document? The Criteria We Use; Simplification Centre, University of Reading: Reading, UK, 2011; 35p, Available online: www.simplificationcentre.org.uk (accessed on 1 July 2022).
  10. Hloch, M.; Kubek, M.; Unger, H. A Survey on Innovative Graph-Based Clustering Algorithms. In The Autonomous Web; Springer: Cham, Switzerland, 2022; Volume 101, pp. 95–110. [Google Scholar]
  11. Al-jabery, K.K.; Obafemi-Ajayi, T.; Olbricht, G.R.; Wunsch, D.C., II. Clustering algorithms. In Computational Learning Approaches to Data Analytics in Biomedical Applications; Academic Press, Elsevier Inc.: Cambridge, MA, USA, 2020; pp. 29–100. [Google Scholar]
  12. Balakrishnan, N.; Balas, V.E.; Rajendran, A. Chapter 2—Computational intelligence in healthcare and biosignal processing. In Handbook of Computational Intelligence in Biomedical Engineering and Healthcare; Academic Press, Elsevier Inc.: Cambridge, MA, USA, 2021; pp. 31–64. [Google Scholar]
  13. Zhang, H.; Li, H.; Chen, N.; Chen, S.; Liu, J. Novel fuzzy clustering algorithm with variable multi-pixel fitting spatial information for image segmentation. Pattern Recognit. 2022, 121, 108201. [Google Scholar] [CrossRef]
  14. Kumar, S.N.; Ahilan, A.; Fred, A.L.; Kumar, H.A. ROI extraction in CT lung images of COVID-19 using Fast Fuzzy C means clustering. In Biomedical Engineering Tools for Management for Patients with COVID-19; Academic Press, Elsevier Inc.: Cambridge, MA, USA, 2021; pp. 103–119. [Google Scholar] [CrossRef]
  15. Lei, Y. 4 – Clustering algorithm-based fault diagnosis. In Intelligent Fault Diagnosis and Remaining Useful Life Prediction of Rotating Machinery; Butterworth-Heinemann: Oxford, UK, 2017; pp. 175–229. [Google Scholar]
  16. Pons-Vives, P.J.; Morro-Ribot, M.; Mulet-Forteza, C.; Valero, O. An Application of Ordered Weighted Averaging Operators to Customer Classification in Hotels. Mathematics 2022, 10, 1987. [Google Scholar] [CrossRef]
  17. Michis, A.A. Multiscale Partial Correlation Clustering of Stock Market Returns. J. Risk Financ. Manag. 2022, 15, 24. [Google Scholar] [CrossRef]
  18. Catania, L.J. The science and technologies of artificial intelligence (AI). In Foundations of Artificial Intelligence in Healthcare and Bioscience; Academic Press, Elsevier Inc.: Cambridge, MA, USA, 2021; pp. 29–72. [Google Scholar]
  19. Dempster, A.P.; Laird, N.M.; Rubin, D.B. Maximum Likelihood from Incomplete Data via the EM Algorithm. J. R. Stat. Soc. 1977, 39, 1–38. [Google Scholar]
  20. Do, C.; Batzoglou, S. What is the expectation maximization algorithm? Nat. Biotechnol. 2008, 26, 897–899. [Google Scholar] [CrossRef] [PubMed]
  21. Ester, M.; Kriegel, H.P.; Sander, J.; Xu, X. A density-based algorithm for discovering clusters in large spatial databases with noise. In Proceedings of the Second International Conference on Knowledge Discovery and Data Mining (KDD-96), Portland, OR, USA, 2–4 August 1996; Simoudis, E., Han, J., Fayyad, U.M., Eds.; AAAI Press: Palo Alto, CA, USA, 1996; pp. 226–231. [Google Scholar]
  22. MacQueen, J. Some methods for classification and analysis of multivariate observations. In Proceedings of the 5th Berkeley Symposium on Mathematical Statistics and Probability, University of California, Berkeley, CA, USA, 1 January 1967; Volume 1, pp. 281–297. [Google Scholar]
  23. Franti, P.; Sieranoja, S. K-means properties on six clustering benchmark datasets. Appl. Intell. 2018, 48, 4743–4759. [Google Scholar] [CrossRef]
  24. Javed, A.; Lee, B.S.; Rizzo, D.M. A benchmark study on time series clustering. Mach. Learn. Appl. 2020, 1, 100001. [Google Scholar] [CrossRef]
  25. Sheng, X.; Zhang, Q.; Gao, R.; Guo, D.; Jing, Z.; Xin, X. K-means Cluster Algorithm Applied for Geometric Shaping Based on Iterative Polar Modulation in Inter-Data Centers Optical Interconnection. Electronics 2021, 10, 2417. [Google Scholar] [CrossRef]
  26. Semantic Web Research Center. Korean Morphological Analyzer: Hannanum. KAIST, Republic of Korea. 2016. Available online: http://swrc.kaist.ac.kr/hannanum/ (accessed on 1 July 2022).
  27. Witten, I.; Frank, E.; Hall, M.; Pal, C. Appendix B—The WEKA Workbench. In Data Mining: Practical Machine Learning Tools and Techniques, 4th ed.; Morgan Kaufmann Publishers: Burlington, MA, USA, 2017; pp. 553–571. [Google Scholar]
  28. Pedregosa, F.; Varoquaux, G.; Gramfort, A.; Michel, V.; Thirion, B.; Grisel, O.; Blondel, M.; Prettenhofer, P.; Weiss, R.; Dubourg, V.; et al. Scikit-learn: Machine Learning in Python. J. Mach. Learn. Res. 2011, 12, 2825–2830. [Google Scholar]
  29. Gupta, V.; Sachdeva, S.; Dohare, N. Chapter 8—Deep similarity learning for disease prediction. In Hybrid Computational Intelligence for Pattern Analysis, Trends in Deep Learning Methodologies; Academic Press, Elsevier Inc.: Cambridge, MA, USA, 2021; pp. 183–206. [Google Scholar]
Figure 1. The overall validation process used to prove the correctness of a requirement specification.
Electronics 11 02113 g001
Figure 2. The architecture of the automated checker for the correctness of requirement specifications.
Electronics 11 02113 g002
Figure 3. Automated checker for the correctness of requirement specifications.
Electronics 11 02113 g003
Figure 4. The average number of clusters after 10 runs using the EM and DBSCAN algorithms.
Electronics 11 02113 g004
Figure 5. The architecture of the unsupervised clustering techniques used to identify the number of natural clusters.
Electronics 11 02113 g005
Figure 6. The retaining process of input sentences through the encoding and decoding procedure.
Electronics 11 02113 g006
Figure 7. The average number of clusters after 10 runs using EM and DBSCAN algorithms with autoencoding.
Electronics 11 02113 g007
Figure 8. Comparing the performance of similarity (a) using a Euclidean distance metric, and (b) using a cosine similarity metric.
Electronics 11 02113 g008
Publisher’s Note: MDPI stays neutral with regard to jurisdictional claims in published maps and institutional affiliations.

